+ All Categories
Home > Documents > 586 Energy - Census data, see table 968. Figure 19.1 Energy Supply and Disposition: 1970 to 1993...

586 Energy - Census data, see table 968. Figure 19.1 Energy Supply and Disposition: 1970 to 1993...

Date post: 05-Jul-2018
Category:
Upload: dinhnhu
View: 213 times
Download: 0 times
Share this document with a friend
22
0 20 40 60 80 100 1970 1972 1974 1976 1978 1980 1982 1984 1986 1988 1990 1992 1994 0 100 200 300 400 500 600 700 United States France Japan Germany Russia Canada Great Britain Sweden South Korea Ukraine Figure 19.2 Commercial Nuclear Power Generation— Top 10 Countries: 1993 Source: Chart prepared by U.S. Bureau of the Census. For data, see table 968. Figure 19.1 Energy Supply and Disposition: 1970 to 1993 Source: Chart prepared by U.S. Bureau of the Census. For data, see table 936. Quadrillion Btu 586 Energy Billion kWh Production Consumption Imports
Transcript

0

20

40

60

80

100

1970 1972 1974 1976 1978 1980 1982 1984 1986 1988 1990 1992 1994

0 100 200 300 400 500 600 700

United States

France

Japan

Germany

Russia

Canada

Great Britain

Sweden

South Korea

Ukraine

Figure 19.2Commercial Nuclear Power Generation—Top 10 Countries: 1993

Source: Chart prepared by U.S. Bureau of the Census. For data, see table 968.

Figure 19.1Energy Supply and Disposition: 1970 to 1993

Source: Chart prepared by U.S. Bureau of the Census. For data, see table 936.

Quadrillion Btu

586 Energy

Billion kWh

Production

Consumption

Imports

Section 19

EnergyThis section presents statistics on fuelresources, energy production and con-sumption, electric energy, hydroelectricpower, nuclear power, solar energy,wood energy and the electric and gasutility industries. The principal sourcesare the U.S. Department of Energy’s Energy Information Administration (EIA),the Edison Electric Institute, Washington,DC, and the American Gas Association,Arlington, VA. For additional data ontransportation, see section 21; on fuels,see section 24; and on energy-relatedhousing characteristics, see section 25.

The EIA, in its Annual Energy Review, pro-vides statistics and trend data on energysupply, demand, and prices. Information isincluded on petroleum and natural gas,coal, electricity, hydroelectric power, nu-clear power, solar, wood, and geothermalenergy. Among its annual reports areAnnual Energy Review, Electric PowerAnnual, Natural Gas Annual, PetroleumSupply Annual, State Energy Data Report,State Energy Price and Expenditure Re-port, Financial Statistics of Selected Elec-tric Utilities, Performance Profiles of MajorEnergy Producers, Annual Energy Out-look, and International Energy Annual.These various publications contain State,national, and international data on produc-tion of electricity, net summer capability ofgenerating plants, fuels used in energyproduction, energy sales and consumption,and hydroelectric power. The EIA also is-sues the Monthly Energy Review, whichpresents current supply, disposition, andprice data, and monthly publications onpetroleum, coal, natural gas, and electricpower. Data on residential energy con-sumption, expenditures, and conservationactivities are available from EIA’s Residen-tial Energy Consumption Survey and arepublished triennially in Residential EnergyConsumption Survey: Consumption andExpenditures, and Residential EnergyConsumption Survey: Housing Character-istics, and several other reports.

The Edison Electric Institute’s monthly bul-letin and annual Statistical Year Book ofthe Electric Utility Industry for the Yearcontain data on the distribution of electric

In BriefEnergy production projected toincrease 1.3 percent by the year2000 while consumption will rise8.4 percent.Crude oil imports surpass domesticproduction in 1994 with 7.0 millionbarrels per day compared to 6.6 for production.Net generation of electric energy byutilities reached a record 2.9 trillionkWh in 1993.

energy by public utilities; information on theelectric power supply, expansion of electricgenerating facilities, and the manufactureof heavy electric power equipment is pres-ented in the annual Year End Summary ofthe Electric Power Situation in the UnitedStates. The American Gas Association, inits monthly and quarterly bulletins and itsyearbook, Gas Facts, presents data ongas utilities, including sales, revenues, cus-tomers, prices, and other financial and op-erating statistics.

Btu conversion factors. —Various ener-gy sources are converted from originalunits (e.g., short tons, cubic feet, barrels,kilowatt-hours) to the thermal equivalentusing British thermal units (Btu). A Btu isthe amount of energy required to raisethe temperature of 1 pound of water 1degree Fahrenheit (F) at or near 39.2 de-grees F. Factors are calculated annuallyfrom the latest final annual data avail-able; some are revised as a result. Thefollowing list provides conversion factorsused in 1992 for production and con-sumption, in that order, for various fuels:Petroleum, 5.800 and 5.376 mil. Btu perbarrel; total coal, 21.675 and 21.164 mil.Btu per short ton; and natural gas (dry),1,030 Btu per cubic foot for both. Thefactors for the production of nuclear pow-er and geothermal power were 10,740and 20,997 Btu per kilowatt-hour, respec-tively. The fossil fuel steam-electric pow-er plant generation factor of 10,332 Btuper kilowatt-hour was used for hydroelec-tric power generation and for wood andwaste, wind, photovoltaic, and solar ther-mal energy consumed at electric utilities.

No. 934. Total Horsepower of All Prime Movers: 1960 to 1992

[In millions, except percent. As of January, except as noted. Prime movers are mechanical engines and turbines, and work ani-mals, which originally convert fuels or force (as wind or falling water) into work and power. Electric motors, which obtain their powerfrom prime movers, are excluded to avoid duplication. See also Historical Statistics, Colonial Times to 1970, series S 1-14]

YEARTotalhorse-power

AUTOMOTIVE 1 2 NONAUTOMOTIVE

Total Percentof total Total Facto-

ries3 4 Mines3 4 Rail-roads5

Merchantshipsandsailingvessels4

Farms

Electriccentralsta-tions2

Air-craft5 6

1960 . . . . . . . 11,008 10,367 94.2 641 42 35 47 24 240 217 371965 . . . . . . . 15,096 14,306 94.8 790 48 40 44 24 272 307 551970 . . . . . . . 20,408 19,325 94.7 1,083 54 45 54 22 290 435 1831975 . . . . . . . 25,100 23,752 94.6 1,348 60 47 62 22 318 654 185

1980 . . . . . . . 28,922 27,362 94.6 1,564 64 48 63 28 345 806 2101981 . . . . . . . 29,507 27,909 94.6 1,598 64 48 65 29 345 835 2121982 . . . . . . . 30,495 28,852 94.6 1,643 64 48 64 29 352 854 2321983 . . . . . . . 31,337 29,662 94.7 1,675 64 47 62 29 356 877 2401984 . . . . . . . 31,819 30,117 94.7 1,702 65 47 61 30 359 886 254

1985 . . . . . . . 32,529 30,792 94.7 1,737 65 47 58 29 358 912 2681986 . . . . . . . 32,660 30,893 94.6 1,767 65 47 56 29 358 942 2701987 . . . . . . . 33,266 31,488 94.7 1,778 65 47 53 29 357 958 2691988 . . . . . . . 34,200 32,415 94.8 1,785 65 47 53 28 356 969 2671989 . . . . . . . 34,579 32,790 94.8 1,789 65 47 50 28 356 976 267

1990 . . . . . . . 34,958 33,158 94.7 1,800 67 48 50 28 356 984 2671991 . . . . . . . 34,962 33,158 94.8 1,804 67 48 50 27 355 991 2661992 . . . . . . . 35,300 33,431 94.7 1,869 68 47 50 29 352 71,057 266

1 Includes passenger cars, trucks, buses, and motorcycles. 2 As of July 1, except beginning 1992, as of January 1.3 Beginning 1965, data are estimates. 4 This is an extension of trends, since government agencies suspended compilation ofthese power capacity statistics. Beginning 1992, includes vessels on the Great Lakes. 5 Beginning 1965, not strictly comparablewith earlier years. 6 Includes private planes and commercial airlines. 7 Includes 57 million horsepower in cogenerating andindustrial electric power capacity.

Source: John A. Waring, Arlington, VA, unpublished estimates.

No. 935. Energy Supply and Disposition, by Type of Fuel—Projections:1993 to 2010

[Quadrillion Btu per year, except percent change . Projections are ‘‘reference’’ or mid-level forecasts.See report for methodology and assumptions used in generating projections]

TYPE OF FUEL 1993 2000 2005 2010PERCENT CHANGE

1993-2000

2000-2005

2005-2010

Production, total . . . . . . . . . . . . . . . . . 69.62 70.51 72.75 75.86 1.3 3.2 4.3Crude oil and lease condensate . . . . . . . . . 14.50 11.33 10.92 11.42 -21.9 -3.6 4.6Natural gas plant liquids . . . . . . . . . . . . . . 2.41 2.57 2.69 2.81 6.6 4.7 4.5Natural gas . . . . . . . . . . . . . . . . . . . . . . . 18.90 19.65 20.53 21.51 4.0 4.5 4.8Coal. . . . . . . . . . . . . . . . . . . . . . . . . . . . 20.23 22.08 23.21 24.51 9.1 5.1 5.6Nuclear power . . . . . . . . . . . . . . . . . . . . . 6.52 6.96 6.97 6.36 6.7 0.1 -8.8Renewable energy and other . . . . . . . . . . . 7.06 7.92 8.43 9.25 12.2 6.4 9.7

Imports, total . . . . . . . . . . . . . . . . . . . . 21.40 28.20 30.87 32.62 31.8 9.5 5.7Crude oil. . . . . . . . . . . . . . . . . . . . . . . . . 14.79 19.14 19.72 19.53 29.4 3.0 -1.0Petroleum products. . . . . . . . . . . . . . . . . . 3.79 5.18 7.10 8.12 36.7 37.1 14.4Natural gas . . . . . . . . . . . . . . . . . . . . . . . 2.32 3.17 3.33 3.97 36.6 5.0 19.2Other imports. . . . . . . . . . . . . . . . . . . . . . 0.50 0.71 0.73 1.00 42.0 2.8 37.0

Exports, total . . . . . . . . . . . . . . . . . . . . 4.21 4.40 4.49 4.83 4.5 2.0 7.6Petroleum . . . . . . . . . . . . . . . . . . . . . . . . 2.11 1.97 1.68 1.64 -6.6 -14.7 -2.4Natural gas . . . . . . . . . . . . . . . . . . . . . . . 0.15 0.21 0.27 0.31 40.0 28.6 14.8Coal. . . . . . . . . . . . . . . . . . . . . . . . . . . . 1.96 2.22 2.54 2.89 13.3 14.4 13.8

Consumption, total . . . . . . . . . . . . . . . 87.27 94.61 99.37 103.88 8.4 5.0 4.5Petroleum products. . . . . . . . . . . . . . . . . . 33.71 36.89 39.30 40.82 9.4 6.5 3.9Natural gas . . . . . . . . . . . . . . . . . . . . . . . 20.81 22.78 23.76 25.30 9.5 4.3 6.5Coal. . . . . . . . . . . . . . . . . . . . . . . . . . . . 19.43 20.14 21.01 21.97 3.7 4.3 4.6Nuclear power . . . . . . . . . . . . . . . . . . . . . 6.52 6.96 6.97 6.36 6.7 0.1 -8.8Renewable energy/other . . . . . . . . . . . . . . 6.80 7.83 8.32 9.41 15.1 6.3 13.1

Source: U.S. Energy Information Administration, Annual Energy Outlook 1995.

Energy588

No. 936. Energy Supply and Disposition, by Type of Fuel: 1970 to 1993[In quadrillion British thermal units (Btu). For Btu conversion factors, see text, section 19]

TYPE OF FUEL 1970 1973 1975 1980 1985 1986 1987 1988 1989 1990 1991 1992 1993

Production . . . . . . . . . . 62.1 62.1 59.9 64.8 64.9 64.4 65.0 66.1 66.1 167.9 67.5 66.9 65.81Crude oil 2 . . . . . . . . . 20.4 19.5 17.7 18.3 19.0 18.4 17.7 17.3 16.1 15.6 15.7 15.2 14.48Natural gas liquids . . . 2.5 2.6 2.4 2.3 2.2 2.2 2.2 2.3 2.2 2.2 2.3 2.4 2.40Natural gas 3 . . . . . . . 21.7 22.2 19.6 19.9 17.0 16.5 17.1 17.6 17.9 18.4 18.2 18.4 18.98Coal . . . . . . . . . . . . . 14.6 14.0 15.0 18.6 19.3 19.5 20.1 20.7 21.4 22.5 21.6 21.6 20.49Nuclear electric power . 0.2 0.9 1.9 2.7 4.2 4.5 4.9 5.7 5.7 6.2 6.6 6.6 6.52Hydroelectric power. . . 2.6 2.9 3.2 2.9 3.0 3.1 2.6 2.3 2.8 2.9 2.9 2.5 2.76Geothermal and other . (Z) (Z) 0.1 0.1 0.2 0.2 0.2 0.2 0.2 0.2 0.2 0.2 0.18

Net trade 4 . . . . . . . . . . -5.7 -12.7 -11.7 -12.3 -7.9 -10.3 -11.9 -13.2 -14.2 -14.1 -13.4 -14.6 -16.9Exports . . . . . . . . . . . 2.7 2.1 2.4 3.7 4.2 4.1 3.9 4.4 4.8 4.9 5.2 5.0 4.31Coal . . . . . . . . . . . 1.9 1.4 1.8 2.4 2.4 2.3 2.1 2.5 2.6 2.8 2.9 2.7 1.95

Imports . . . . . . . . . . . 8.4 14.7 14.1 16.0 12.1 14.4 15.8 17.6 19.0 19.0 18.6 19.7 21.19Crude oil . . . . . . . . 2.8 6.9 8.7 11.2 6.8 9.0 10.1 11.0 12.6 12.8 12.6 13.3 14.63

Consumption . . . . . . . . 66.4 74.3 70.6 76.0 74.0 74.3 76.9 80.2 81.3 81.3 81.1 82.1 583.96Petroleum products . . . 29.5 34.8 32.7 34.2 30.9 32.2 32.9 34.2 34.2 33.6 32.9 33.5 33.77Natural gas 3 . . . . . . . 21.8 22.5 20.0 20.4 17.8 16.7 17.7 18.6 19.4 19.3 19.6 20.1 20.79Coal . . . . . . . . . . . . . 12.3 13.0 12.7 15.4 17.5 17.3 18.0 18.9 18.9 19.1 18.8 18.9 19.63Nuclear power . . . . . . 0.2 0.9 1.9 2.7 4.2 4.5 4.9 5.7 5.7 6.2 6.6 6.6 6.52Hydroelectric power 6 . 2.7 3.0 3.2 3.1 3.4 3.5 3.1 2.7 2.9 3.0 3.1 2.8 3.06Geothermal and other . (Z) (Z) 0.1 0.1 0.2 0.2 0.3 0.3 0.3 0.2 0.2 0.2 0.20

Z Less than 50 trillion. 1 Represents peak year for U.S. energy production. 2 Includes lease condensate. 3 Drymarketed gas. 4 Exports minus imports. 5 Represents peak year for U.S. energy consumption. 6 Includes industrialgeneration of hydropower and net electricity imports.

No. 937. Energy Imports and Exports, by Type of Fuel: 1970 to 1993[In quadrillion of Btu. For definition of Btu, see text, section 19]

TYPE OF FUEL 1970 1973 1975 1980 1985 1987 1988 1989 1990 1991 1992 1993

Net imports:1Coal . . . . . . . . . . . . . -1.93 -1.42 -1.74 -2.39 -2.39 -2.05 -2.45 -2.57 -2.70 -2.77 -2.59 -1.77Natural Gas (dry) . . . . 0.77 0.98 0.90 0.96 0.90 0.94 1.22 1.28 1.46 1.67 1.94 2.14Petroleum . . . . . . . . . 6.92 12.98 12.51 13.50 8.95 12.53 14.01 15.33 15.29 14.22 14.96 16.19Other 2 . . . . . . . . . . . -0.04 0.14 0.08 0.18 0.41 0.49 0.37 0.14 0.03 0.24 0.32 0.31

Imports:Coal . . . . . . . . . . . . . (Z) (Z) 0.02 0.03 0.05 0.04 0.05 0.07 0.07 0.08 0.10 0.18Natural Gas (dry) . . . . 0.85 1.06 0.98 1.01 0.95 0.99 1.30 1.39 1.55 1.80 2.16 2.29Petroleum . . . . . . . . . 7.47 13.47 12.95 14.66 10.61 14.16 15.75 17.16 17.12 16.35 16.97 18.30Other 2 . . . . . . . . . . . 0.07 0.20 0.16 0.28 0.49 0.57 0.47 0.33 0.25 0.35 0.43 0.42

Exports:Coal . . . . . . . . . . . . . 1.94 1.43 1.76 2.42 2.44 2.09 2.50 2.64 2.77 2.85 2.68 1.95Natural Gas (dry) . . . . 0.07 0.08 0.07 0.05 0.06 0.05 0.07 0.11 0.09 0.13 0.22 0.14Petroleum . . . . . . . . . 0.55 0.49 0.44 1.16 1.66 1.63 1.74 1.84 1.82 2.13 2.01 2.11Other 2 . . . . . . . . . . . 0.11 0.06 0.08 0.09 0.08 0.08 0.10 0.18 0.23 0.11 0.11 0.10

Z Less than .005 quadrillion Btu. 1 Net imports equals imports minus exports. Minus sign (-) denotes an excess of exportsover imports. 2 Coal coke and small amounts of electricity transmitted across U.S. borders with Canada and Mexico.

No. 938. Selected Energy Indicators—Summary: 1970 to 1993[Btu=British thermal unit. For Btu conversion factors, see text, section 19. Minus sign (-) indicates decrease]

ITEM 1970 1973 1975 1980 1985 1986 1987 1988 1989 1990 1991 1992 1993

AVERAGE ANNUALPERCENT CHANGE 1

Gross domestic product 2 . . . 3.0 1.7 -0.7 -0.1 0.6 2.9 3.0 3.9 2.5 1.2 -0.6 2.3 3.1Energy production, total 3 . . . 4.6 -0.2 -1.8 0.3 -0.3 -0.8 0.9 1.8 (Z) 2.6 -0.5 -0.9 -2.1Crude oil 4 . . . . . . . . . . . . 4.2 -0.9 -4.7 0.2 0.2 -3.3 -3.9 -2.3 -6.9 -3.4 0.8 -3.1 -4.9Natural gas . . . . . . . . . . . 6.4 -0.0 -6.1 -0.2 -1.2 -2.6 3.5 2.7 1.4 2.8 -0.7 0.8 2.8Coal . . . . . . . . . . . . . . . . 2.2 -0.2 3.4 1.2 -0.4 1.0 3.2 2.9 2.9 5.1 -3.9 (Z) -6.5

Energy consumption, total 3 . . 4.6 1.4 -2.6 -0.8 -0.0 0.4 3.4 4.2 1.4 -0.1 -0.2 1.3 2.1Petroleum products . . . . . . 4.8 1.9 -3.1 -1.6 -0.1 4.0 2.1 4.1 (Z) -1.9 -2.1 2.1 0.9Natural gas (dry). . . . . . . . 6.5 -0.3 -6.0 -0.3 -0.7 -6.5 6.0 4.5 4.4 -0.5 1.6 2.6 3.6Coal . . . . . . . . . . . . . . . . 1.1 2.4 -1.2 0.5 0.5 -1.2 4.2 4.6 0.4 0.9 -1.7 0.5 2.9

PER CAPITA 5

(mil. Btu)Energy production . . . . . . . . 304 294 278 285 273 268 268 270 268 272 268 262 254Energy consumption . . . . . . . 327 351 327 334 311 309 317 328 329 326 322 322 325Energy consumption perdollar of GDP 2 (1,000 Btu) . 23.1 22.7 21.9 20.1 17.3 16.9 16.9 17.0 16.8 16.6 16.7 16.5 16.3

Z Less than .05 percent. 1 Represents percent change from immediate prior year; for example, 1970, change from 1965.Percent change derived from Btu values. 2 Gross domestic product in constant (1987) dollars. 3 Includes types of fuel orpower, not shown separately. 4 Includes lease condensate. 5 Based on resident population estimated as of July 1.

Source of tables 936 to 938: U.S. Energy Information Administration, Annual Energy Review, and Monthly Energy Review.

Energy Supply and Disposition—Energy Imports 589

No. 939. Energy Consumption—End-Use Sector and Selected Source, by State: 1992

[In trillions of Btu, except as indicated. For Btu conversion factors, see text, section 19]

REGION, DIVISION,AND STATE Total1

Percapita2(mil.Btu)

END-USE SECTOR SOURCE

Resi-dential

Com-mercial

Indus-trial

Trans-porta-tion

Petro-leum

Naturalgas(dry)

CoalHydro-electricpower

Nuclearelectricpower

United States . . 82,128 322.0 16,193 12,875 330,597 22,464 33,525 20,139 18,846 2,793 6,607

Northeast . . . . . . . . . . 12,746 249.3 3,233 2,730 3,366 3,418 5,766 2,784 1,997 455 1,541New England . . . . . . 3,132 237.4 904 684 673 871 1,712 529 190 138 411Maine . . . . . . . . . 370 299.5 78 53 135 104 225 5 22 50 57New Hampshire . . . 244 218.9 71 40 59 74 143 17 35 21 84Vermont . . . . . . . . 140 244.9 42 26 27 45 79 8 1 24 40Massachusetts . . . 1,370 228.5 407 342 236 386 751 306 111 20 51Rhode Island. . . . . 247 246.5 66 45 79 57 101 79 - 10 -Connecticut. . . . . . 762 232.3 240 179 137 206 414 114 22 14 179

Middle Atlantic . . . . 9,614 253.5 2,328 2,046 2,694 2,546 4,055 2,254 1,807 317 1,131New York . . . . . . . 3,616 199.7 995 1,021 723 878 1,574 987 337 306 258New Jersey. . . . . . 2,401 307.0 495 484 614 809 1,213 561 63 4-1 231Pennsylvania. . . . . 3,597 299.9 838 542 1,357 860 1,268 707 1,408 13 642

Midwest . . . . . . . . . . . 19,663 324.3 4,411 3,115 7,349 4,788 6,815 4,877 6,487 213 1,693East North Central . . 13,816 323.4 3,148 2,164 5,359 3,145 4,482 3,583 4,509 52 1,267Ohio . . . . . . . . . . 3,733 338.7 822 579 1,551 780 1,137 839 1,419 3 158Indiana. . . . . . . . . 2,408 425.5 426 271 1,154 556 808 489 1,297 6 -Illinois . . . . . . . . . 3,487 300.3 852 636 1,238 762 1,143 1,011 693 1 787Michigan . . . . . . . 2,784 295.1 700 442 943 699 914 909 702 8 201Wisconsin. . . . . . . 1,404 281.3 348 236 473 348 481 335 399 35 120

West North Central . 5,846 326.2 1,263 951 1,991 1,643 2,333 1,294 1,978 161 426Minnesota. . . . . . . 1,369 306.4 307 189 498 376 540 312 300 60 119Iowa . . . . . . . . . . 927 330.6 203 139 361 224 320 232 327 10 36Missouri . . . . . . . . 1,499 288.8 369 286 353 492 648 241 523 15 86North Dakota. . . . . 327 516.1 51 38 169 70 118 38 399 25 -South Dakota . . . . 205 289.2 48 32 53 72 104 27 34 41 -Nebraska . . . . . . . 506 316.0 116 106 131 152 207 105 141 11 93Kansas . . . . . . . . 1,014 402.9 170 162 425 257 396 339 254 - 91

South . . . . . . . . . . . . . 34,187 387.7 5,835 4,374 15,033 8,945 14,276 8,667 7,937 509 2,614South Atlantic . . . . . 12,670 281.0 2,945 2,315 3,620 3,790 5,243 1,655 3,600 181 1,659Delaware . . . . . . . 241 348.2 47 35 93 65 141 41 46 - -Maryland . . . . . . . 1,204 244.8 321 185 353 344 498 186 248 19 114Dist. of Columbia . . 174 297.3 34 80 33 27 34 33 1 - -Virginia. . . . . . . . . 1,853 289.8 429 392 468 565 732 208 344 4 249West Virginia. . . . . 794 439.1 131 88 416 159 295 137 805 12 -North Carolina . . . . 2,019 295.3 468 344 666 541 754 186 600 60 243South Carolina . . . 1,224 339.8 240 165 513 307 405 142 288 28 486Georgia . . . . . . . . 2,095 309.3 454 330 640 671 808 352 616 56 299Florida . . . . . . . . . 3,066 227.4 821 695 438 1,112 1,577 370 653 2 268

East South Central. . 5,946 382.8 1,106 580 2,650 1,610 2,101 987 2,262 244 462Kentucky . . . . . . . 1,532 408.2 271 180 691 391 539 201 814 39 -Tennessee . . . . . . 1,793 356.7 382 140 810 461 608 249 591 99 167Alabama. . . . . . . . 1,653 399.6 286 159 784 425 538 287 771 106 207Mississippi . . . . . . 968 370.0 167 102 365 333 415 251 87 - 87

West South Central . 15,571 565.0 1,783 1,478 8,764 3,546 6,932 6,024 2,076 85 493Arkansas . . . . . . . 796 332.5 157 101 307 231 286 227 221 35 121Louisiana . . . . . . . 3,558 831.4 288 211 2,314 745 1,508 1,614 224 - 111Oklahoma. . . . . . . 1,302 406.2 224 173 529 377 473 558 307 33 -Texas. . . . . . . . . . 9,915 560.7 1,114 993 5,614 2,194 4,665 3,626 1,324 17 262

West . . . . . . . . . . . . . 15,506 281.2 2,716 2,657 4,820 5,313 6,667 3,812 2,425 1,615 759Mountain . . . . . . . . . 4,605 320.3 849 859 1,501 1,396 1,731 1,034 2,200 275 273Montana. . . . . . . . 341 414.1 56 50 145 90 149 47 190 85 -Idaho . . . . . . . . . . 387 362.7 76 75 145 91 123 50 10 67 -Wyoming . . . . . . . 422 908.7 33 38 268 82 120 131 491 7 -Colorado . . . . . . . 959 276.8 213 233 233 280 349 259 332 16 -New Mexico . . . . . 584 369.4 78 96 195 215 241 211 268 3 -Arizona . . . . . . . . 945 246.5 206 207 194 338 364 134 369 71 273Utah . . . . . . . . . . 557 307.4 100 87 210 159 208 132 363 6 -Nevada . . . . . . . . 412 307.9 87 72 112 141 176 71 179 21 -

Pacific . . . . . . . . . . 10,901 267.5 1,866 1,798 3,319 3,917 4,936 2,778 225 1,340 486Washington. . . . . . 1,991 387.2 363 288 698 642 860 175 106 697 61Oregon . . . . . . . . 942 317.1 194 162 284 302 369 127 41 388 49California . . . . . . . 7,092 229.6 1,240 1,256 1,915 2,681 3,243 2,090 65 244 376Alaska . . . . . . . . . 612 1040.4 46 59 358 149 206 384 13 10 -Hawaii . . . . . . . . . 263 227.6 23 33 64 143 258 3 1 1 -

- Represents zero. 1 Sources of energy includes geothermal, wood and waste, and net interstate sales of electricity,including losses, not shown separately. 2 Based on estimated resident population as of July 1. 3 Includes 27.2 trillion Btu ofnet imports of coal coke not allocated by State. 4 A negative number occurs when more electricity is expended than is createdto provide electricity during peak demand periods.

Source: U.S. Energy Information Administration, State Energy Data Report, 1992.

Energy590

No. 940. Energy Consumption, by End-Use Sector: 1970 to 1993

[Btu=British thermal unit. For residential and commercial, industrial, and transportation, represents consumption offossil fuels only. For Btu conversion factors, see text, section 19]

YEARTotal

consumption(quad. Btu)

Residentialand

commercial(quad. Btu)

Industrialand

miscel-laneous

(quad. Btu)

Transporta-tion

(quad. Btu)

PERCENT OF TOTAL

Residentialand

commercial

Industrialand

miscel-laneous

Transpor-tation

1970 . . . . . . . . . . . . . . 66.4 21.7 28.6 16.1 32.7 43.1 24.21973 . . . . . . . . . . . . . . 74.3 24.1 31.5 18.6 32.5 42.4 25.0

1975 . . . . . . . . . . . . . . 70.6 23.9 28.4 18.3 33.9 40.3 25.91976 . . . . . . . . . . . . . . 74.4 25.0 30.2 19.1 33.6 40.7 25.71977 . . . . . . . . . . . . . . 76.3 25.4 31.1 19.8 33.3 40.7 26.01978 . . . . . . . . . . . . . . 78.1 26.1 31.4 20.6 33.4 40.2 26.41979 . . . . . . . . . . . . . . 78.9 25.8 32.6 20.5 32.7 41.3 25.9

1980 . . . . . . . . . . . . . . 76.0 25.7 30.6 19.7 33.8 40.3 25.91981 . . . . . . . . . . . . . . 74.0 25.2 29.2 19.5 34.1 39.5 26.41982 . . . . . . . . . . . . . . 70.9 25.6 26.1 19.1 36.2 36.9 26.91983 . . . . . . . . . . . . . . 70.5 25.6 25.8 19.1 36.3 36.5 27.11984 . . . . . . . . . . . . . . 74.1 26.5 27.9 19.8 35.7 37.6 26.7

1985 . . . . . . . . . . . . . . 74.0 26.7 27.2 20.1 36.1 36.8 27.11986 . . . . . . . . . . . . . . 74.3 26.9 26.6 20.8 36.1 35.8 28.01987 . . . . . . . . . . . . . . 76.9 27.6 27.8 21.5 35.9 36.2 27.91988 . . . . . . . . . . . . . . 80.2 28.9 29.0 22.3 36.1 36.1 27.81989 . . . . . . . . . . . . . . 81.3 29.4 29.4 22.6 36.1 36.1 27.7

1990 . . . . . . . . . . . . . . 81.3 28.8 29.9 22.5 35.4 36.8 27.71991 . . . . . . . . . . . . . . 81.1 29.4 29.6 22.1 36.3 36.5 27.31992 . . . . . . . . . . . . . . 82.1 29.1 30.6 22.5 35.4 37.2 27.31993 . . . . . . . . . . . . . . 84.0 30.3 30.8 22.8 36.1 36.6 27.2

Source: U.S. Energy Information Administration, Annual Energy Review.

No. 941. Energy Expenditures and Average Fuel Prices, by Source and Sector:1970 to 1992

[For definition of Btu, see text, section 19. End-use sector and electric utilities exclude expenditures and prices on energy sourcessuch as hydropower, solar, wind, and geothermal. Also excludes expenditures for reported amounts of energy consumed by theenergy industry for production, transportation, and processing operations]

SOURCE ANDSECTOR 1970 1973 1975 1980 1985 1987 1988 1989 1990 1991 1992

EXPENDITURES(mil. dol.)

Total1 2 . . . . . . . . . . 82,579 111,616 171,782 373,900 435,444 393,525 407,597 434,354 469,420 467,029 472,756Natural gas . . . . . . . 10,891 13,933 20,061 51,061 72,938 58,019 61,089 65,383 64,102 64,697 68,401Petroleum products2 . 48,088 65,305 103,859 238,408 223,196 186,413 189,261 206,277 234,461 221,916 221,764Motor gasoline . . . 31,596 39,667 59,446 124,408 118,044 99,809 103,211 112,585 126,472 123,051 125,158

Coal. . . . . . . . . . . . 4,594 6,229 13,048 22,648 29,719 27,586 28,371 28,106 28,382 27,869 27,411Electricity sales . . . . 23,351 33,780 50,680 98,098 149,242 154,692 162,070 169,340 176,742 184,822 186,956

Residential sector. . . 20,083 27,078 36,844 68,825 98,307 97,552 102,773 108,423 109,265 114,739 115,150Commercial sector . . 10,668 15,104 22,835 46,881 70,263 68,777 71,579 75,467 78,922 81,483 82,398Industrial sector . . . . 16,458 23,531 41,169 94,520 105,723 89,975 91,315 93,827 100,903 99,603 102,035Transportation sector2 35,370 45,904 70,934 163,674 161,150 137,220 141,930 156,637 180,330 171,204 173,173Motor gasoline . . . 30,525 38,598 57,992 121,809 115,201 97,527 100,988 110,168 123,775 120,557 122,700

Electric utilities. . . . . 4,316 7,817 16,396 37,435 42,558 36,692 37,435 38,895 38,443 36,501 35,763

AVERAGE FUELPRICES

(dol. per mil. Btu)

All sectors. . . . . . . . 1.65 2.02 3.33 6.91 8.42 7.37 7.30 7.69 8.37 8.32 8.27

Residential sector. . . 2.12 2.73 3.83 7.55 11.14 10.95 10.90 11.26 12.14 12.34 12.27Commercial sector . . 1.97 2.56 4.09 7.88 11.71 11.06 10.91 11.40 12.03 12.21 12.32Industrial sector . . . . 0.83 1.08 2.20 4.71 6.09 5.19 5.03 5.11 5.40 5.34 5.29Transportation sector. 2.31 2.57 4.02 8.61 8.26 6.57 6.56 7.16 8.26 7.97 7.93Electric utilities. . . . . 0.32 0.46 0.96 1.75 1.85 1.51 1.45 1.48 1.46 1.37 1.34

1 Includes electricity sales; excludes electricity generation. 2 Includes sources or fuel types not shown separately.

Source: U.S. Energy Information Administration, State Energy Price and Expenditure Report, annual.

Energy Consumption—Energy Expenditures 591

No. 942. Energy Expenditures—End-Use Sector and Selected Source, by State: 1992

[In millions of dollars, except as indicated. End-use sector and electric utilities exclude expenditures on energy sources suchas hydropower, solar, wind, and geothermal. Also excludes expenditures for reported amounts of energy consumed by the energyindustry for production, transportation, and processing operations]

REGION,DIVISION, AND

STATETotal1

Percapita2(dol.)

END-USE SECTOR SOURCE

Resi-dential

Com-mercial

Indus-trial

Trans-porta-tion

Petroleumproducts Natural

gas CoalElec-tricitysalesTotal Gaso-

line

U.S. . . . . . 472,756 1,853 115,150 82,398 3102,035 173,173 221,764 125,158 68,401 27,411 186,956

Northeast . . . . . 92,317 1,806 27,816 20,802 15,284 28,416 40,167 21,922 14,636 3,159 38,434N.E . . . . . . . 24,923 1,889 7,879 5,265 3,725 8,055 12,269 6,719 3,108 357 10,094ME . . . . . . 2,567 2,077 704 375 552 937 1,475 714 28 57 1,039NH . . . . . . 2,002 1,796 638 322 362 681 1,027 604 105 60 893VT . . . . . . 1,145 2,005 363 201 164 417 671 339 38 2 436MA . . . . . . 10,848 1,810 3,434 2,504 1,410 3,500 5,189 2,864 1,721 193 4,347RI . . . . . . . 1,867 1,865 567 359 408 533 777 452 435 - 657CT . . . . . . 6,494 1,980 2,173 1,504 829 1,988 3,129 1,745 780 44 2,722

M.A . . . . . . . 67,394 1,777 19,937 15,537 11,559 20,361 27,898 15,203 11,528 2,802 28,340NY . . . . . . 28,751 1,588 9,272 8,150 3,558 7,772 11,162 6,294 5,365 525 13,091NJ . . . . . . 16,156 2,066 4,161 3,615 2,764 5,616 7,541 3,641 2,758 108 5,975PA . . . . . . 22,487 1,875 6,504 3,773 5,237 6,973 9,196 5,268 3,405 2,169 9,274

Midwest . . . . . . 112,265 1,851 28,172 18,171 27,416 38,507 49,002 28,978 20,130 9,126 41,591E.N.C . . . . . . 78,919 1,847 20,363 13,114 19,981 25,461 32,205 19,438 15,394 6,757 30,140OH . . . . . . 21,156 1,920 5,365 3,555 5,653 6,584 8,410 5,128 3,706 2,073 8,718IN . . . . . . . 11,606 2,051 2,597 1,428 3,442 4,140 5,079 2,697 1,977 1,845 4,042IL . . . . . . . 21,273 1,832 5,899 4,070 4,926 6,378 8,061 4,908 4,433 1,180 8,599MI. . . . . . . 16,744 1,775 4,313 2,807 4,268 5,356 6,849 4,344 3,784 1,109 6,009WI . . . . . . 8,140 1,630 2,189 1,256 1,693 3,003 3,804 2,362 1,495 551 2,772

W.N.C. . . . . . 33,346 1,861 7,809 5,057 7,434 13,046 16,797 9,540 4,736 2,369 11,452MN . . . . . . 7,648 1,712 1,829 939 1,783 3,097 3,862 2,380 1,170 371 2,593IA . . . . . . . 5,295 1,889 1,328 752 1,348 1,867 2,472 1,454 953 373 1,807MO . . . . . . 9,237 1,779 2,345 1,597 1,507 3,788 4,616 2,781 1,099 699 3,489ND . . . . . . 1,566 2,471 289 192 510 576 792 402 110 474 412SD . . . . . . 1,287 1,818 302 172 227 586 766 425 110 41 404NE . . . . . . 3,024 1,889 646 533 543 1,302 1,618 858 419 110 982KS . . . . . . 5,288 2,103 1,069 872 1,516 1,831 2,673 1,241 875 300 1,765

South . . . . . . . 174,910 1,983 39,823 25,702 43,992 65,393 86,374 45,903 21,453 12,249 70,406S.A . . . . . . . 78,331 1,737 21,243 13,883 13,625 29,580 36,437 22,617 6,672 5,973 35,913DE . . . . . . 1,379 1,970 368 220 278 514 724 393 154 78 568MD . . . . . . 8,209 1,670 2,334 1,140 1,644 3,092 3,910 2,509 913 390 3,468DC . . . . . . 1,143 1,954 234 485 175 249 282 206 213 2 650VA . . . . . . 11,258 1,761 3,036 2,158 1,548 4,517 5,398 3,400 942 529 4,782WV . . . . . . 3,761 2,079 773 464 1,218 1,305 1,949 990 478 1,184 1,193NC . . . . . . 12,886 1,913 3,530 2,063 2,712 4,580 5,787 3,636 769 1,038 6,213SC . . . . . . 6,733 1,869 1,628 936 1,771 2,399 2,865 1,870 550 451 3,230GA . . . . . . 12,605 1,861 3,188 2,220 2,526 4,671 5,429 3,377 1,576 1,108 5,530FL . . . . . . 20,357 1,510 6,154 4,198 1,753 8,253 10,094 6,237 1,078 1,192 10,280

E.S.C . . . . . . 30,073 1,936 6,416 3,232 8,289 12,136 14,401 8,456 3,096 3,223 12,141KY . . . . . . 7,263 1,935 1,452 838 1,985 2,989 3,657 2,013 696 991 2,781TN . . . . . . 9,529 1,896 2,062 780 2,922 3,765 4,422 2,747 939 765 4,040AL . . . . . . 8,357 2,019 1,840 973 2,305 3,239 3,787 2,313 932 1,328 3,362MS . . . . . . 4,924 1,883 1,062 641 1,077 2,144 2,535 1,383 529 139 1,958

W.S.C. . . . . . 66,506 2,413 12,164 8,587 22,078 23,677 35,536 14,829 11,686 3,054 22,352AR . . . . . . 4,691 1,959 1,125 609 1,089 1,869 2,184 1,343 676 366 1,864LA . . . . . . 12,378 2,893 1,947 1,334 4,933 4,164 6,584 2,189 2,440 345 3,824OK . . . . . . 6,048 1,887 1,382 920 1,130 2,617 3,013 1,754 1,282 382 2,207TX . . . . . . 43,390 2,454 7,711 5,725 14,927 15,027 23,756 9,544 7,289 1,961 14,457

West . . . . . . . . 93,164 1,690 19,340 17,723 15,245 40,857 46,221 28,355 12,182 2,876 36,525Mountain . . . 25,922 1,803 5,495 4,819 4,575 11,034 12,900 7,860 2,965 2,511 10,050MT . . . . . . 1,719 2,091 298 235 394 792 991 529 180 140 542ID . . . . . . . 1,930 1,811 368 319 449 794 1,006 598 170 18 736WY . . . . . . 1,550 3,334 176 176 574 624 783 341 231 390 488CO . . . . . . 5,443 1,571 1,217 1,170 695 2,360 2,706 1,798 823 369 1,902NM . . . . . . 3,004 1,899 535 570 499 1,399 1,698 953 341 354 1,010AZ . . . . . . 6,884 1,797 1,800 1,529 900 2,656 2,923 2,015 493 515 3,517UT . . . . . . 2,861 1,580 579 434 575 1,273 1,451 842 475 463 868NV . . . . . . 2,530 1,894 520 387 488 1,135 1,344 784 253 262 987

Pacfic . . . . . 67,242 1,650 13,845 12,903 10,670 29,824 33,321 20,496 9,217 366 26,475WA . . . . . . 8,888 1,728 1,603 1,140 1,363 4,782 5,266 2,748 611 154 3,015OR . . . . . . 5,101 1,716 953 746 915 2,488 2,814 1,682 460 48 1,850CA . . . . . . 49,418 1,600 10,651 10,358 7,861 20,548 22,619 15,249 7,897 119 20,378AK . . . . . . 1,867 3,175 337 338 188 1,004 1,255 307 211 43 430HI . . . . . . . 1,968 1,702 302 322 343 1,002 1,367 510 39 2 803

- Represents zero. 1 Includes sources not shown separately. Total expenditures are the sum of purchases for each source(including electricity sales) less electric utility purchases of fuel. 2 Based on estimated resident population as of July 1.3 Includes net imports of coal coke not shown separately by State.

Source: U.S. Energy Information Administration, State Energy Price and Expenditure Report, annual.

Energy592

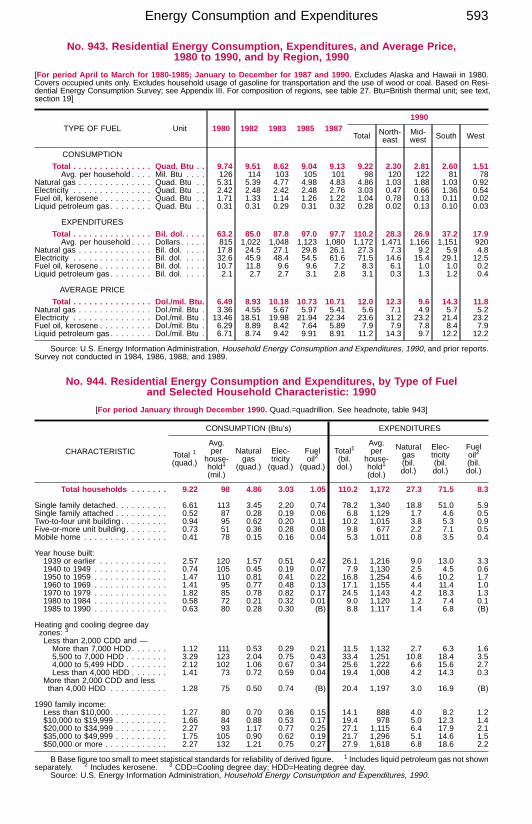
No. 943. Residential Energy Consumption, Expenditures, and Average Price,1980 to 1990, and by Region, 1990

[For period April to March for 1980-1985; January to December for 1987 and 1990. Excludes Alaska and Hawaii in 1980.Covers occupied units only. Excludes household usage of gasoline for transportation and the use of wood or coal. Based on Resi-dential Energy Consumption Survey; see Appendix III. For composition of regions, see table 27. Btu=British thermal unit; see text,section 19]

TYPE OF FUEL Unit 1980 1982 1983 1985 19871990

Total North-east

Mid-west South West

CONSUMPTION

Total . . . . . . . . . . . . . . . Quad. Btu . . 9.74 9.51 8.62 9.04 9.13 9.22 2.30 2.81 2.60 1.51Avg. per household . . . . Mil. Btu . . . . 126 114 103 105 101 98 120 122 81 78

Natural gas . . . . . . . . . . . . . . Quad. Btu . . 5.31 5.39 4.77 4.98 4.83 4.86 1.03 1.88 1.03 0.92Electricity . . . . . . . . . . . . . . . Quad. Btu . . 2.42 2.48 2.42 2.48 2.76 3.03 0.47 0.66 1.36 0.54Fuel oil, kerosene . . . . . . . . . . Quad. Btu . . 1.71 1.33 1.14 1.26 1.22 1.04 0.78 0.13 0.11 0.02Liquid petroleum gas . . . . . . . . Quad. Btu . . 0.31 0.31 0.29 0.31 0.32 0.28 0.02 0.13 0.10 0.03

EXPENDITURES

Total . . . . . . . . . . . . . . . Bil. dol. . . . . 63.2 85.0 87.8 97.0 97.7 110.2 28.3 26.9 37.2 17.9Avg. per household . . . . Dollars . . . . . 815 1,022 1,048 1,123 1,080 1,172 1,471 1,166 1,151 920

Natural gas . . . . . . . . . . . . . . Bil. dol. . . . . 17.8 24.5 27.1 29.8 26.1 27.3 7.3 9.2 5.9 4.8Electricity . . . . . . . . . . . . . . . Bil. dol. . . . . 32.6 45.9 48.4 54.5 61.6 71.5 14.6 15.4 29.1 12.5Fuel oil, kerosene . . . . . . . . . . Bil. dol. . . . . 10.7 11.8 9.6 9.6 7.2 8.3 6.1 1.0 1.0 0.2Liquid petroleum gas . . . . . . . . Bil. dol. . . . . 2.1 2.7 2.7 3.1 2.8 3.1 0.3 1.3 1.2 0.4

AVERAGE PRICE

Total . . . . . . . . . . . . . . . Dol./mil. Btu. 6.49 8.93 10.18 10.73 10.71 12.0 12.3 9.6 14.3 11.8Natural gas . . . . . . . . . . . . . . Dol./mil. Btu . 3.36 4.55 5.67 5.97 5.41 5.6 7.1 4.9 5.7 5.2Electricity . . . . . . . . . . . . . . . Dol./mil. Btu . 13.46 18.51 19.98 21.94 22.34 23.6 31.2 23.2 21.4 23.2Fuel oil, kerosene . . . . . . . . . . Dol./mil. Btu . 6.29 8.89 8.42 7.64 5.89 7.9 7.9 7.8 8.4 7.9Liquid petroleum gas . . . . . . . . Dol./mil. Btu . 6.71 8.74 9.42 9.91 8.91 11.2 14.3 9.7 12.2 12.2

Source: U.S. Energy Information Administration, Household Energy Consumption and Expenditures, 1990, and prior reports.Survey not conducted in 1984, 1986, 1988, and 1989.

No. 944. Residential Energy Consumption and Expenditures, by Type of Fueland Selected Household Characteristic: 1990

[For period January through December 1990. Quad.=quadrillion. See headnote, table 943]

CHARACTERISTIC

CONSUMPTION (Btu’s) EXPENDITURES

Total 1(quad.)

Avg.per

house-hold1(mil.)

Naturalgas

(quad.)

Elec-tricity(quad.)

Fueloil2

(quad.)

Total1(bil.dol.)

Avg.per

house-hold1(dol.)

Naturalgas(bil.dol.)

Elec-tricity(bil.dol.)

Fueloil2(bil.dol.)

Total households . . . . . . . 9.22 98 4.86 3.03 1.05 110.2 1,172 27.3 71.5 8.3

Single family detached. . . . . . . . . . 6.61 113 3.45 2.20 0.74 78.2 1,340 18.8 51.0 5.9Single family attached . . . . . . . . . . 0.52 87 0.28 0.19 0.06 6.8 1,129 1.7 4.6 0.5Two-to-four unit building. . . . . . . . . 0.94 95 0.62 0.20 0.11 10.2 1,015 3.8 5.3 0.9Five-or-more unit building. . . . . . . . 0.73 51 0.36 0.28 0.08 9.8 677 2.2 7.1 0.5Mobile home . . . . . . . . . . . . . . . . 0.41 78 0.15 0.16 0.04 5.3 1,011 0.8 3.5 0.4

Year house built:1939 or earlier . . . . . . . . . . . . . 2.57 120 1.57 0.51 0.42 26.1 1,216 9.0 13.0 3.31940 to 1949 . . . . . . . . . . . . . . 0.74 105 0.45 0.19 0.07 7.9 1,130 2.5 4.5 0.61950 to 1959 . . . . . . . . . . . . . . 1.47 110 0.81 0.41 0.22 16.8 1,254 4.6 10.2 1.71960 to 1969 . . . . . . . . . . . . . . 1.41 95 0.77 0.48 0.13 17.1 1,155 4.4 11.4 1.01970 to 1979 . . . . . . . . . . . . . . 1.82 85 0.78 0.82 0.17 24.5 1,143 4.2 18.3 1.31980 to 1984 . . . . . . . . . . . . . . 0.58 72 0.21 0.32 0.01 9.0 1,120 1.2 7.4 0.11985 to 1990 . . . . . . . . . . . . . . 0.63 80 0.28 0.30 (B) 8.8 1,117 1.4 6.8 (B)

Heating and cooling degree dayzones: 3Less than 2,000 CDD and —More than 7,000 HDD. . . . . . . 1.12 111 0.53 0.29 0.21 11.5 1,132 2.7 6.3 1.65,500 to 7,000 HDD . . . . . . . . 3.29 123 2.04 0.75 0.43 33.4 1,251 10.8 18.4 3.54,000 to 5,499 HDD . . . . . . . . 2.12 102 1.06 0.67 0.34 25.6 1,222 6.6 15.6 2.7Less than 4,000 HDD . . . . . . . 1.41 73 0.72 0.59 0.04 19.4 1,008 4.2 14.3 0.3

More than 2,000 CDD and lessthan 4,000 HDD . . . . . . . . . . . 1.28 75 0.50 0.74 (B) 20.4 1,197 3.0 16.9 (B)

1990 family income:Less than $10,000. . . . . . . . . . . 1.27 80 0.70 0.36 0.15 14.1 888 4.0 8.2 1.2$10,000 to $19,999 . . . . . . . . . . 1.66 84 0.88 0.53 0.17 19.4 978 5.0 12.3 1.4$20,000 to $34,999 . . . . . . . . . . 2.27 93 1.17 0.77 0.25 27.1 1,115 6.4 17.9 2.1$35,000 to $49,999 . . . . . . . . . . 1.75 105 0.90 0.62 0.19 21.7 1,296 5.1 14.6 1.5$50,000 or more . . . . . . . . . . . . 2.27 132 1.21 0.75 0.27 27.9 1,618 6.8 18.6 2.2

B Base figure too small to meet statistical standards for reliability of derived figure. 1 Includes liquid petroleum gas not shownseparately. 2 Includes kerosene. 3 CDD=Cooling degree day; HDD=Heating degree day.

Source: U.S. Energy Information Administration, Household Energy Consumption and Expenditures, 1990.

Energy Consumption and Expenditures 593

No. 945. Manufacturing Primary Energy Consumption for all Purposes, by Type of Fueland Major Industry Group: 1991

[In trillions of Btu . Estimates represented in this table are for the primary consumption of energy for heat and power and as feed-stocks or raw material inputs. Primary consumption is defined as the consumption of the energy that was originally produced offsiteor was produced onsite from input materials not classified as energy. Examples of the latter are hydrogen produced from the elec-trolysis of brine; the output of captive (onsite) mines or wells; woodchips, bark, and woodwaste from wood purchased as a raw mate-rial input; and waste materials such as wastepaper and packing materials. Primary consumption excludes quantities of energy thatare produced from other energy inputs and, therefore, avoids double counting. Based on the 1991 Manufacturing Energy Consump-tion Survey and subject to sampling variability]

INDUSTRY SIC 1

code TotalNetelec-tricity 2

Residualfueloil

Distil-latefueloil 3

Naturalgas 4 LPG Coal

Cokeand

breezeOther 5

All industries . . . . . . . . . . . (X) 20,257 2,370 454 146 6,095 1,574 2,006 308 7,304

Food and kindred products . . . . . . 20 956 169 27 17 (D) 5 154 (D) (D)Tobacco products . . . . . . . . . . . . 21 24 3 1 (Z) 4 (Z) 15 - (Z)Textile mill products . . . . . . . . . . . 22 274 101 12 6 108 2 31 - 13Apparel and other textile products . 23 44 19 (S) 1 19 1 2 - 1Lumber and wood products. . . . . . 24 451 61 2 16 41 4 2 - 325Furniture and fixtures. . . . . . . . . . 25 68 17 1 1 19 1 4 - 26Paper and allied products . . . . . . . 26 2,506 201 156 9 (D) 5 296 (D) (D)Printing and publishing. . . . . . . . . 27 108 53 (Z) 2 48 1 - - 4Chemicals and allied products . . . . 28 5,051 440 (D) 14 2,227 (D) (D) 10 526Petroleum and coal products. . . . . 29 5,967 105 65 21 838 (D) (D) (D) 4,864

Rubber and misc. plastic products . 30 238 116 8 3 96 3 7 - 6Leather and leather products. . . . . 31 12 3 1 1 5 (Z) (S) - 1Stone, clay, and glass products . . . 32 880 105 9 20 381 (D) 293 (D) (D)Primary metal industries . . . . . . . . 33 2,467 499 (D) 11 708 (D) 853 278 72Fabricated metal products . . . . . . 34 307 102 3 6 175 4 5 (D) (D)Industrial machinery & equipment . 35 237 101 3 4 109 2 11 1 5Electric and electronic equipment . . 36 212 102 4 2 79 1 (D) (D) (D)Transportation equipment . . . . . . . 37 323 118 12 7 133 2 (D) (D) 17Instruments and related products . . 38 98 42 3 (D) 26 (S) (D) - (D)Misc. manufacturing industries. . . . 39 32 12 1 (D) 15 (Z) 1 - (S)

- Represents or rounds to zero. D Withheld to avoid disclosing data for individual establishments. S Withheld becauseRelative Standard Error is greater than 50 percent. X Not applicable. Z Less than 0.5 trillion Btu. 1 Standard IndustrialClassification Code; see text, section 13. 2 Net electricity is obtained by aggregating purchases, transfers in, and generation fromnoncombustible renewable resources minus quantities sold and transferred out. Excludes electricity inputs from onsitecogeneration or generation from combustible fuels because that energy has already been included as generating fuel (for example,coal). 3 Includes Nos.1, 2, and 4 fuel oils and Nos. 1, 2, and 4 diesel fuels. 4 Includes natural gas obtained from utilities,transmission pipelines, and any other supplier such as brokers and producers. 5 Includes net steam, and other energy thatrespondents indicated was used to produce heat and power or as feedstock/raw material inputs.

Source: U.S. Energy Information Administration, Manufacturing Energy Consumption 1991.

No. 946. Manufacturing Energy Consumption for Fuel Purposes, by Type of Fueland End-Use: 1991

[In trillions of Btu . See headnote, table 945]

END-USE CATEGORIES 1 TotalNet

electri-city 2

Residualfueloil

Distillatefuel oil

and dieselfuel 3

Naturalgas 4 LPG

Coal(excludingcoal coke

andbreeze)

Other 5

Total inputs . . . . . . . . . . . . . 15,027 2,370 414 139 5,506 105 1,184 5,309

Boiler fuel . . . . . . . . . . . . . . . . . . (X) (D) 296 40 2,098 18 859 (X)

Direct process uses . . . . . . . . . . . . (X) 1,864 109 34 2,578 64 314 (X)Process heating. . . . . . . . . . . . . (X) 235 107 19 2,382 49 314 (X)Process cooling and refrigeration . (X) 124 (Z) (Z) 13 (Z) - (X)Machine drive . . . . . . . . . . . . . . (X) 1,187 2 14 127 15 - (X)Electro-chemical processes . . . . . (X) 304 (X) (X) (X) (X) (X) (X)Other process use . . . . . . . . . . . (X) 15 (Z) 1 56 (Z) (Z) (X)

Direct nonprocess uses . . . . . . . . . (X) 396 7 53 702 19 (D) (X)Facility heating, ventilation,and air conditioning 6 . . . . . . . . (X) 192 4 8 283 3 (Z) (X)Facility lighting. . . . . . . . . . . . . . (X) 161 (X) (X) (X) (X) (X) (X)Facility support . . . . . . . . . . . . . (X) 36 (D) (Z) 23 (Z) - (X)Onsite transportation . . . . . . . . . (X) 4 (X) 38 (Z) 16 (X) (X)Conventional electricity generation. (X) (X) 2 4 347 (Z) (D) (X)Other nonprocess use . . . . . . . . (X) 4 (D) 2 49 (Z) - (X)

End-use not reported . . . . . . . . . . . 5,547 (D) 2 12 128 4 (D) 5,309

- Represents or rounds to zero. D Withheld to avoid disclosing data for individual establishments. X Not applicable.Z Less that .5 trillion. 1 Allocations to specific end-uses are made on the basis of reasonable approximations by respondents.2 ‘‘Net electricity’’ is obtained by summing purchases, transfers in, and generation from noncombustible renewable resources,minus quantities sold and transferred out. It does not include electricity inputs from onsite cogeneration or generation fromcombustible fuels because that energy has already been included as generating fuel (for example, coal).3 Includes Nos. 1, 2, and 4 fuel oils and Nos. 1, 2, and 4 diesel fuels. 4 Includes natural gas obtained from utilities, transmissionpipelines, and any other supplier(s) such as brokers and producers. 5 Includes net steam (the sum of purchases, generation fromrenewables, and net transfers) and other energy that respondents indicated was used to produce heat and power. 6 Excludessteam and hot water.

Source: U.S. Energy Information Administration, Manufacturing Energy Consumption 1991.

Energy594

No. 947. Commercial Buildings—Energy Consumption and Expenditures,by Major Fuel Type Used: 1992

[Covers buildings using one or more major fuel. Excludes industrial buildings predominantly residential buildings, and buildings ofless than 1,000 sq. ft. Based on a sample survey of building representatives and energy suppliers; therefore, subject to samplingvariability. For characteristics of commercial buildings, see tables in section 25. Tril. = trillion]

TYPE OF FUEL

MAJOR FUEL CONSUMPTION MAJOR FUEL EXPENDITURES

Total(tril. Btu)

Perbuilding(mil. Btu)

Persquarefeet(1,000Btu)

Perworker(mil. Btu)

Total(mil. dol.)

Perbuilding(1,000dol.)

Persquarefeet

(dollars)

Permil.Btu

(dollars)

All buildings . . . . . . . . . . . 5,803 1,207 85.5 81.5 72,599 15.1 1.07 12.51

Energy sources (more thanone may apply):Electricity. . . . . . . . . . . . . . . . 5,802 1,258 87.2 81.5 72,595 15.7 1.09 12.51Natural gas . . . . . . . . . . . . . . 4,576 1,722 101.7 89.4 52,563 19.8 1.17 11.49Fuel oil . . . . . . . . . . . . . . . . . 1,526 2,727 115.4 84.4 17,972 32.1 1.36 11.78District heat . . . . . . . . . . . . . . 839 8,872 160.0 117.5 9,106 96.3 1.74 10.85District chilled water . . . . . . . . 292 10,369 152.6 107.8 3,167 112.5 1.65 10.85Propane . . . . . . . . . . . . . . . . 220 653 64.9 76.3 3,561 10.6 1.05 16.18Other . . . . . . . . . . . . . . . . . . 67 411 43.3 50.9 992 6.1 0.64 14.78

Source: U.S. Energy Information Administration, Commercial Buildings Energy Consumption and Expenditures, 1992.

No. 948. Commercial Buildings—Energy Consumption and Expenditures: 1992

[Covers buildings using one or more major fuel. Excludes industrial buildings, predominantly residential buildings, and buildings ofless than 1,000 sq. ft. Based on a sample survey of building representatives and energy suppliers; therefore, subject to samplingvariability. For characteristics of commercial buildings, see tables in section 25. For composition of regions, see table 27]

BUILDING CHARACTERISTIC

ALL BUILDINGSUSING ANY MAJOR

FUEL

CONSUMPTION(tril. Btu)

EXPENDITURES(mil. dol.)

Number(1,000)

Squarefeet(mil.)

Majorfuel,total 1

Electricity Naturalgas

Majorfuel,total 1

Electricity Naturalgas

All buildings . . . . . . . . . 4,615 66,538 5,803 2,609 2,487 72,599 57,619 10,679

Region:Northeast . . . . . . . . . . . . . . . 755 13,235 1,090 419 354 16,226 12,250 2,014Midwest . . . . . . . . . . . . . . . . 1,141 16,909 1,688 622 858 17,204 12,745 3,258South . . . . . . . . . . . . . . . . . . 1,874 23,979 1,888 1,002 760 22,843 19,097 2,998West. . . . . . . . . . . . . . . . . . . 845 12,415 1,137 566 515 16,326 13,527 2,408

Year constructed:1900 or before . . . . . . . . . . . . 169 1,721 118 38 62 1,447 1,029 2811901 to 1920 . . . . . . . . . . . . . 244 3,401 213 67 102 2,516 1,711 5161921 to 1945 . . . . . . . . . . . . . 681 8,385 878 217 522 8,244 5,263 2,1521946 to 1960 . . . . . . . . . . . . . 839 10,135 825 332 380 9,820 7,477 1,6881961 to 1970 . . . . . . . . . . . . . 757 12,473 1,200 528 501 14,576 11,617 1,9471974 to 1979 . . . . . . . . . . . . . 945 13,781 1,261 629 528 16,459 13,659 2,1871980 to 1983 . . . . . . . . . . . . . 855 14,153 1,133 689 345 16,834 14,510 1,6681984 to 1986 . . . . . . . . . . . . . 127 2,489 173 109 48 2,702 2,354 239

Principal activity within building:Assembly 2 . . . . . . . . . . . . . . 704 9,123 510 233 202 6,460 4,939 995Education . . . . . . . . . . . . . . . 301 8,470 637 235 291 7,389 5,526 1,271Food sales/services. . . . . . . . . 390 2,248 584 251 320 7,200 5,609 1,483Health care . . . . . . . . . . . . . . 63 1,763 403 138 189 3,733 2,640 662Lodging. . . . . . . . . . . . . . . . . 154 2,891 463 189 193 5,459 4,030 929Mercantile/services . . . . . . . . . 1,270 12,399 892 444 381 12,907 10,583 1,899Office . . . . . . . . . . . . . . . . . . 749 12,319 1,272 704 413 18,125 15,511 1,641Public order and safety . . . . . . 24 1,652 52 (B) 9 811 743 43Warehouse . . . . . . . . . . . . . . 685 11,179 590 253 259 6,750 5,386 939Other . . . . . . . . . . . . . . . . . . 65 1,124 270 78 (B) 2,178 1,479 (B)

Vacant . . . . . . . . . . . . . . . . . . . 210 3,371 131 47 61 1,585 1,172 290

Square footage:1,001 to 5,000 . . . . . . . . . . . . 2,539 6,995 715 334 333 10,604 8,536 1,7615,001 to 10,000 . . . . . . . . . . . 954 7,057 682 251 378 8,481 6,336 1,82810,001 to 25,000 . . . . . . . . . . 628 10,097 1,038 335 611 10,373 7,758 2,12925,001 to 50,000 . . . . . . . . . . 275 9,856 794 347 324 9,864 7,619 1,55950,001 to 100,000. . . . . . . . . . 114 7,926 642 308 255 8,483 6,806 1,184100,001 to 200,000 . . . . . . . . . 70 9,658 640 347 206 8,413 6,935 893200,001 to 500,000 . . . . . . . . . 25 7,678 711 361 215 8,457 6,847 742500,001 and over . . . . . . . . . . 9 7,271 581 325 165 7,924 6,783 582

B Base figure too small to meet statistical standards for reliability of a derived figure. 1 Includes fuel oil, propane, andpurchased steam not shown separately. 2 Includes public assembly, public order and safety, and religious worship.

Source: U.S. Energy Information Administration, Commercial Buildings Energy Consumption and Expenditures, 1992.

Commercial Buildings 595

No. 949. Fossil Fuel Prices in Current and Constant (1987) Dollars: 1970 to 1993

[In cents per million British thermal units (Btu), except as indicated. All fuel prices taken as close to the pointof production as possible. See text, section 19, for explanation of Btu conversions from mineral fuels]

FUEL 1970 1973 1975 1980 1985 1986 1987 1988 1989 1990 1991 1992 1993

CURRENT DOLLARS

Composite 1 . . . . . . . . 31.7 39.8 82.1 204.2 251.2 165.3 170.0 153.3 167.1 184.3 167.0 165.8 165.1Crude oil. . . . . . . . . . . . . . 54.8 67.1 132.2 372.2 415.3 215.7 265.5 216.9 273.4 345.3 285.2 275.7 245.5Natural gas . . . . . . . . . . . . 15.4 20.1 40.2 144.8 225.7 174.8 150.2 152.4 152.7 154.6 148.0 156.8 177.5Bituminous coal 2 . . . . . . . . 26.2 36.5 83.9 109.4 114.8 108.2 104.9 100.8 100.0 99.5 98.9 96.9 95.0Anthracite coal . . . . . . . . . . 48.8 61.7 149.5 185.9 204.2 191.1 188.9 189.8 183.6 174.5 161.0 151.7 167.5

CONSTANT (1987) DOLLARS

Composite 1 . . . . . . . . 90.1 96.4 166.9 284.8 266.1 170.6 170.0 147.5 154.0 162.7 141.9 136.9 132.9Crude oil. . . . . . . . . . . . . . 155.7 162.5 268.7 519.1 439.9 222.6 265.5 208.8 252.0 304.8 242.3 227.7 197.7Natural gas . . . . . . . . . . . . 43.8 48.7 81.7 202.0 239.1 180.4 150.2 146.7 140.7 136.5 125.7 129.5 142.9Bituminous coal 2 . . . . . . . . 74.4 88.4 170.5 152.6 121.6 111.7 104.9 97.0 92.2 87.8 84.0 80.0 76.5Anthracite coal . . . . . . . . . . 138.6 149.4 303.9 259.3 216.3 197.2 188.9 182.7 169.2 154.0 136.8 125.3 134.9

GDP implicit price deflator3(1987=100) . . . . . . . . . . . 35.2 41.3 49.2 71.7 94.4 96.9 100.0 103.9 108.5 113.2 117.8 121.9 123.5

1 Weighted by relative importance of individual fuels in total fuels production. 2 Includes subbituminous and lignite.3 GDP=Gross domestic product; see text, section 15.

Source: U.S. Energy Information Administration, Annual Energy Review.

No. 951. World Primary Energy Production, by Region and Type: 1973 to 1992

[In quadrillion Btu. Btu=British thermal units. For Btu conversion factors, see source]

REGION AND TYPE 1973 1975 1980 1985 1986 1987 1988 1989 1990 1991 1992

World, total . . . . . . 244.8 245.0 286.6 302.1 312.1 319.6 332.1 339.6 344.0 340.8 343.1

North America . . . . . . . . 73.3 71.1 80.5 84.1 82.7 84.1 86.2 86.2 88.2 89.1 88.8United States . . . . . . . 62.0 59.8 64.7 64.6 64.1 64.6 65.8 65.8 67.7 67.4 66.7

Central and SouthAmerica . . . . . . . . . . . 12.9 10.6 12.1 13.5 14.3 14.3 15.2 15.7 16.6 17.4 17.6Western Europe . . . . . . . 19.6 21.4 28.7 36.4 37.4 37.9 38.4 37.9 37.8 39.0 39.3Eastern Europe andSoviet Union . . . . . . . . 51.4 55.9 69.3 74.5 77.4 79.4 81.8 81.5 79.1 70.8 67.0Middle East . . . . . . . . . . 46.6 43.5 42.2 25.7 30.6 32.1 36.0 39.6 41.0 40.2 43.9Africa . . . . . . . . . . . . . . 14.8 13.3 17.3 18.4 18.1 18.5 19.5 20.5 21.5 23.4 23.7Far East and Oceania . . . 26.2 29.3 36.5 49.5 51.6 53.2 54.9 58.3 59.9 60.9 62.8

Crude oil. . . . . . . . . . . . 117.8 111.6 127.6 115.4 120.2 121.0 125.8 127.8 129.3 128.6 129.2Natural gas . . . . . . . . . . 43.2 43.9 52.8 60.6 61.9 64.9 68.1 70.6 72.0 74.0 74.3Natural gas liquids . . . . . 4.2 4.4 5.5 5.7 6.0 6.3 6.6 6.7 7.0 7.3 7.6Coal. . . . . . . . . . . . . . . 63.8 66.3 75.0 84.2 86.5 88.2 90.3 92.9 92.8 86.7 87.6Hydroelectric power . . . . 13.5 15.0 18.2 20.7 21.1 21.3 22.0 21.8 22.5 22.9 22.9Nuclear electric power. . . 2.2 3.9 7.6 15.4 16.3 17.8 19.3 19.8 20.3 21.3 21.5

Source: U.S. Energy Information Administration, International Energy Annual.

Energy596

No. 952. U.S. Foreign Trade in Selected Mineral Fuels: 1970 to 1994

[Minus sign (-) indicates an excess of imports over exports. See also Historical Statistics, Colonial Times to 1970,series M 100, 101, 127, 128, 140, 141, 178, and 181]

MINERAL FUEL Unit 1970 1973 1975 1980 1985 1990 1991 1992 1993 1994

NATURAL GAS

Imports. . . . . . . . . . Bil. cu. ft.. . . . 821 1,033 953 985 950 1,532 1,773 2,138 2,350 2,558Exports . . . . . . . . . Bil. cu. ft.. . . . 70 77 73 49 55 86 129 216 140 144Net trade . . . . . . . . Bil. cu. ft.. . . . -751 -956 -880 -936 -894 -1,446 -1,644 -1,922 -2,210 -2,414

CRUDE OIL

Imports 1 . . . . . . . . Mil. bbl.. . . . . 483 1,184 1,498 1,926 1,168 2,151 2,110 2,220 2,477 2,565Exports . . . . . . . . . Mil. bbl.. . . . . 5 1 2 105 75 40 42 32 36 36Net trade . . . . . . . . Mil. bbl.. . . . . -478 -1,183 -1,496 -1,821 -1,093 -2,112 -2,068 -2,188 -2,441 -2,529

PETROLEUMPRODUCTS

Imports. . . . . . . . . . Mil. bbl.. . . . . 765 1,099 712 603 681 775 673 659 669 694Exports . . . . . . . . . Mil. bbl.. . . . . 89 84 74 94 211 273 323 314 330 308Net trade . . . . . . . . Mil. bbl.. . . . . -676 -1,015 -638 -509 -470 -502 -350 -345 -339 -387

COAL

Imports. . . . . . . . . . 1,000 sh. tons 36 127 940 1,194 1,952 2,699 3,390 3,803 7,309 7,584Exports . . . . . . . . . 1,000 sh. tons 71,733 53,587 66,309 91,742 92,680 105,804 108,969 102,516 74,519 71,359Net trade . . . . . . . . 1,000 sh. tons 71,697 53,460 65,369 90,548 90,728 103,105 105,579 98,713 67,210 63,775

1 Beginning 1980, includes strategic petroleum reserve imports.

Source: U.S. Energy Information Administration, Natural Gas Monthly, Petroleum Supply Monthly, and Monthly EnergyReview.

No. 953. Daily International Flow of Crude Oil, by Area: 1991

[In thousands of barrels per day ]

EXPORTING AREA Total 1

IMPORTING AREA

North America CentralandSouthAmerica

WesternEurope

EasternEurope

MiddleEastandAfrica

Japan

OtherFarEastand

OceaniaU.S. Canada

World, total . . . . . . . . . . 28,406 5,782 551 1,641 10,245 834 1,143 4,180 4,030

United States . . . . . . . . . . . . . . 116 (X) 5 2111 - - - - -

North America, except U.S. . . . . . 2,121 1,502 15 58 346 - 32 157 11Central and South America . . . . . 1,842 927 35 615 208 - - 9 48Western Europe . . . . . . . . . . . . . 2,939 183 348 11 2,374 - 23 - -Eastern Europe and U.S.S.R. . . . . 1,205 1 - 5 637 493 16 2 51

Middle East . . . . . . . . . . . . . . . . 12,947 1,770 89 682 3,567 246 731 3,034 2,828Africa . . . . . . . . . . . . . . . . . . . . 4,969 1,160 59 147 3,101 95 323 11 73Far East and Oceania . . . . . . . . . 2,267 239 - 12 12 - 18 967 1,019

- Represents zero. X Not applicable. 1 Includes stocks at sea, exchanges, transshipments, and other statisticaldiscrepancies not shown separately. 2 Includes shipments to Puerto Rico and Virgin Islands.

Source: U.S. Energy Information Administration, International Energy Annual.

Foreign Trade—Crude Oil Movements 597

No. 954. Crude Oil Imports Into United States, by Country of Origin: 1970 to 1994

[In millions of barrels. Barrels contain 42 gallons]

COUNTRY OF ORIGIN 1970 1973 1975 1980 1985 1987 1988 1989 1990 1991 1992 1993 1994

Total . . . . . . . . . . 483 1,184 1,498 1,921 1,168 1,706 1,864 2,133 2,151 2,110 2,226 2,477 2,565

Canada. . . . . . . . . . . . 245 365 219 73 171 222 249 230 235 271 292 329 345Mexico . . . . . . . . . . . . - (Z) 26 185 261 220 246 261 251 277 288 315 343Norway . . . . . . . . . . . . - - 4 53 11 26 23 46 35 27 43 50 69Trinidad-Tobago . . . . . . (Z) 22 42 42 36 27 26 27 28 26 26 20 23United Kingdom . . . . . . - - (Z) 63 101 111 93 58 57 39 73 114 145

OPEC 1 . . . . . . . . . . . 222 765 1,172 1,410 479 876 984 1,232 1,283 1,233 1,247 1,346 1,307Algeria. . . . . . . . . . . 2 44 96 166 31 42 21 22 23 16 9 9 9Ecuador. . . . . . . . . . - 17 21 6 20 8 12 29 14 19 23 28 (2)Gabon. . . . . . . . . . . - - 10 9 19 13 5 18 23 31 45 55 71Indonesia. . . . . . . . . 26 73 138 115 107 96 68 58 36 37 26 24 34Iran. . . . . . . . . . . . . 12 79 101 3 10 36 (Z) - - 12 - - -Iraq. . . . . . . . . . . . . - 1 1 10 17 30 125 161 188 - - - -Kuwait . . . . . . . . . . . 12 15 1 10 1 26 29 57 29 2 14 126 112Libya. . . . . . . . . . . . 17 49 81 200 - - - - - - - - -Nigeria . . . . . . . . . . 17 164 272 307 102 193 222 292 286 249 243 264 228Qatar . . . . . . . . . . . - 3 7 8 - - - 1 1 - - - -Saudi Arabia. . . . . . . 15 169 256 456 48 234 333 407 436 622 585 468 473United Arab Emirates . 23 26 43 63 13 20 8 8 3 1 - 4 4Venezuela . . . . . . . . 98 126 144 57 112 178 160 181 243 244 302 369 376

Other . . . . . . . . . . . . . 16 32 34 95 108 225 244 279 264 237 257 304 333

- Represents zero. Z Less than 500,000 barrels. 1 Organization of Petroleum Exporting Countries. 2 On December 31,1992, Ecuador withdrew as a member of OPEC. Effective January 1, 1994, imports from Ecuador appear under imports from‘‘Other.’’

Source: 1970, U.S. Bureau of Mines, Minerals Yearbooks, vol. I; thereafter, U.S. Energy Information Administration, PetroleumSupply Annual, vol. I.

No. 955. Crude Oil and Refined Products—Summary: 1973 to 1994

[Barrels of 42 gallons. Data are averages]

YEAR

CRUDE OIL(1,000 bbl. per day)

REFINED OIL PRODUCTS(1,000 bbl. per day) Total oil

imports2(1,000bbl. perday)

CRUDE OILSTOCKS 3

(mil. bbl.)

Input torefin-eries

Domesticproduc-tion

Imports

Exports Domesticdemand Imports Exports Total Strategic

reserveTotal 1Stra-tegic

reserve

1973 . . . . . . . . 12,431 9,208 3,244 (X) 2 17,308 3,012 229 6,256 242 (X)1974 . . . . . . . . 12,133 8,774 3,477 (X) 3 16,653 2,635 218 6,112 265 (X)1975 . . . . . . . . 12,442 8,375 4,105 (X) 6 16,322 1,951 204 6,056 271 (X)

1976 . . . . . . . . 13,416 8,132 5,287 (X) 8 17,461 2,026 215 7,313 285 (X)1977 . . . . . . . . 14,602 8,245 6,615 21 50 18,431 2,193 193 8,807 348 71978 . . . . . . . . 14,739 8,707 6,356 161 158 18,847 2,008 204 8,363 376 671979 . . . . . . . . 14,648 8,552 6,519 67 235 18,513 1,937 236 8,456 430 91

1980 . . . . . . . . 13,481 8,597 5,263 44 287 17,056 1,646 258 6,909 466 1081981 . . . . . . . . 12,470 8,572 4,396 256 228 16,058 1,599 367 5,996 594 2301982 . . . . . . . . 11,774 8,649 3,488 165 236 15,296 1,625 579 5,113 644 2941983 . . . . . . . . 11,685 8,688 3,329 234 164 15,231 1,722 575 5,051 723 3791984 . . . . . . . . 12,044 8,879 3,426 197 181 15,726 2,011 541 5,437 796 451

1985 . . . . . . . . 12,002 8,971 3,201 118 204 15,726 1,866 577 5,067 814 4931986 . . . . . . . . 12,716 8,680 4,178 48 154 16,281 2,045 631 6,224 843 5121987 . . . . . . . . 12,854 8,349 4,674 73 151 16,665 2,004 613 6,678 890 5411988 . . . . . . . . 13,246 8,140 5,107 51 155 17,283 2,295 661 7,402 890 5601989 . . . . . . . . 13,401 7,613 5,843 56 142 17,325 2,217 717 8,061 921 580

1990 . . . . . . . . 13,409 7,355 5,894 27 109 16,988 2,123 748 8,018 908 5861991 . . . . . . . . 13,301 7,417 5,782 - 116 16,714 1,844 885 7,627 893 5691992 . . . . . . . . 13,411 7,171 6,083 10 89 17,033 1,805 861 7,888 893 5751993 . . . . . . . . 13,613 6,847 6,787 15 98 17,237 1,833 904 8,620 922 5871994 . . . . . . . . 13,872 6,627 7,027 12 99 17,679 1,902 843 8,929 929 592

- Represents zero. X Not applicable. 1 Includes Strategic Petroleum Reserve. 2 Crude oil (including Strategic PetroleumReserve imports) plus refined products. 3 End of year.

Source: U.S. Energy Information Administration, Monthly Energy Review, February 1995.

Energy598

No. 956. Strategic Petroleum Reserve: 1977 to 1993[Million barrels, except as noted. The Strategic Petroleum Reserve is a stock of petroleum maintained by the Federal

Government for use during periods of major supply interruption]

YEAR Crude oilimports

Domesticcrude oildeliveries

STOCKS AT YEAR-ENDDays of netpetroleumimports 3Quantity 1

Percent ofcrude oilstocks 2

Percent oftotal

petroleumstocks

1977 . . . . . . . . . . . . . . . . . . . . 7.54 40.37 7.46 2.1 0.6 11980 . . . . . . . . . . . . . . . . . . . . 16.07 1.30 107.80 23.1 7.7 171985 . . . . . . . . . . . . . . . . . . . . 43.12 0.17 493.32 60.6 32.5 1151987 . . . . . . . . . . . . . . . . . . . . 26.52 2.69 540.65 60.8 33.6 911988 . . . . . . . . . . . . . . . . . . . . 18.76 0.01 559.52 62.9 35.0 851989 . . . . . . . . . . . . . . . . . . . . 20.35 - 579.86 62.9 36.7 811990 . . . . . . . . . . . . . . . . . . . . 9.77 - 585.69 64.5 36.1 821991 . . . . . . . . . . . . . . . . . . . . - - 568.51 63.7 35.2 861992 . . . . . . . . . . . . . . . . . . . . 3.59 2.60 574.72 64.5 36.1 831993 . . . . . . . . . . . . . . . . . . . . 5.37 6.96 587.08 63.6 35.7 78

- Represents zero. 1 Stocks do not include imported quantities in transit to Strategic Petroleum Reserve terminals, pipelinefill, and above ground storage. 2 Including lease condensate stocks. 3 Derived by dividing end-of-year strategic petroleumreserve stocks by annual average daily net imports of all petroleum. Calculated prior to rounding. 4 The quantity of domestic fueloil which was in storage prior to injection of foreign crude oil.

Source: U.S. Energy Information Administration, Annual Energy Review.

No. 957. World Petroleum Consumption, by Major Consuming Country: 1983 to 1993[Million barrels per day ]

REGION AND COUNTRY 1983 1985 1986 1987 1988 1989 1990 1991 1992 1993

World, total . . . . . . . . . . . . 58.74 60.10 61.76 63.01 64.83 66.03 66.16 66.71 66.57 66.72

North America, total . . . . . . . . . . 18.03 18.70 19.28 19.74 20.53 20.73 20.41 20.14 20.51 20.75Canada. . . . . . . . . . . . . . . . . 1.45 1.50 1.51 1.55 1.69 1.73 1.69 1.62 1.64 1.66Mexico . . . . . . . . . . . . . . . . . 1.35 1.47 1.49 1.52 1.55 1.66 1.73 1.80 1.83 1.84United States . . . . . . . . . . . . . 15.23 15.73 16.28 16.67 17.28 17.33 16.99 16.71 17.03 17.24

Central & South America, total . . . 3.19 3.19 3.41 3.52 3.57 3.58 3.60 3.65 3.74 3.89Brazil . . . . . . . . . . . . . . . . . . 0.98 1.08 1.24 1.26 1.30 1.32 1.34 1.35 1.37 1.41

Western Europe, total . . . . . . . . . 12.38 12.39 12.79 12.93 13.08 13.16 13.25 13.66 13.81 13.80France . . . . . . . . . . . . . . . . . 1.84 1.78 1.77 1.79 1.80 1.86 1.82 1.94 1.93 1.91Germany . . . . . . . . . . . . . . . . 2.66 2.70 2.86 2.77 2.74 2.58 2.66 2.83 2.84 2.90Italy . . . . . . . . . . . . . . . . . . . 1.75 1.72 1.74 1.86 1.84 1.93 1.87 1.86 1.94 1.88United Kingdom . . . . . . . . . . . 1.53 1.63 1.65 1.60 1.70 1.74 1.75 1.80 1.80 1.80

Eastern Europe and former U.S.S.R. 10.47 10.46 10.46 10.51 10.38 10.19 9.73 9.43 7.85 6.81Middle East, total . . . . . . . . . . . . 2.61 2.85 2.98 3.06 3.15 3.36 3.47 3.40 3.40 3.49Africa, total . . . . . . . . . . . . . . . . 1.70 1.83 1.83 1.84 1.91 1.99 2.10 2.15 2.18 2.17Far East & Oceania, total. . . . . . . 10.36 10.69 11.03 11.42 12.21 13.03 13.61 14.28 15.09 15.82China . . . . . . . . . . . . . . . . . . 1.73 1.89 2.00 2.12 2.28 2.38 2.30 2.50 2.66 3.11India. . . . . . . . . . . . . . . . . . . 0.77 0.90 0.95 0.99 1.08 1.15 1.17 1.19 1.28 1.29Japan . . . . . . . . . . . . . . . . . . 4.40 4.38 4.44 4.48 4.75 4.98 5.14 5.28 5.45 5.38

Source: U.S. Energy Information Administration, Annual Energy Review and Monthly Energy Review, monthly.

No. 958. Energy Producing Companies—Selected Financial and Investment Indicators:1983 to 1993

[Based on data from major publicly-owned domestic crude oil producing companies which either had at least 1 percent of domesticproduction or reserves of oil, natural gas, coal, or uranium, or at least 1 percent of refining capacity or petroleum product sales.There were 25 companies in 1983 and 1993; 22 during 1984 through 1987; and 23 in 1988 to 1992]

ITEM 1983 1985 1986 1987 1988 1989 1990 1991 1992 1993

INCOME STATEMENT (bil. dol.)Operating revenues . . . . . . . . . . . . . . . . 511.0 492.5 378.5 417.4 419.8 433.6 510.4 469.3 472.8 448.1Operating expenses . . . . . . . . . . . . . . . . 462.8 444.2 354.4 383.7 381.6 397.7 470.1 443.3 449.5 423.0Operating income. . . . . . . . . . . . . . . . . . 48.2 48.3 24.0 33.7 38.2 35.9 40.2 26.0 23.3 25.1Pretax income . . . . . . . . . . . . . . . . . . . . 47.4 43.6 20.6 25.0 34.3 32.3 37.5 25.1 22.5 (NA)Net income . . . . . . . . . . . . . . . . . . . . . . 21.9 17.4 9.2 11.3 22.3 19.8 21.6 14.7 1.8 15.5Funds from operations 1 . . . . . . . . . . . . . 60.7 63.5 53.1 51.6 57.8 48.3 54.9 47.8 44.8 (NA)

BALANCE SHEET (bil. dol.)Net property, plant, and equipment . . . . . . 278.4 297.7 291.1 297.6 293.6 293.2 302.5 305.5 309.7 307.9Net investment in place 2. . . . . . . . . . . . . 296.3 315.4 310.0 316.4 309.6 309.9 319.7 325.6 331.6 331.5Total assets. . . . . . . . . . . . . . . . . . . . . . 421.8 438.4 427.0 443.6 437.8 434.5 457.2 447.1 453.6 451.3

RATIOS (percent)Net income to operating revenues . . . . . . . 4.3 3.5 2.4 2.7 5.3 4.6 4.2 3.1 30.4 3.5Net income to total assets . . . . . . . . . . . . 5.2 4.0 2.2 2.5 5.1 4.6 4.7 3.3 0.4 3.4Net income to stockholders’ equity . . . . . . 11.4 10.5 5.6 6.8 13.5 12.3 12.9 8.8 1.1 9.6Long-term debt to stockholders’ equity 4 . . . 34.8 54.3 56.0 57.6 56.6 56.4 53.0 54.3 59.4 55.3Long-term debt to total assets4 . . . . . . . . . 15.9 20.5 21.6 21.5 21.3 20.9 19.4 20.3 20.6 19.8

NA Not available. 1 The sum of net income, depreciation, depletion and amortization, deferred taxes, dry hole expenses,etc. 2 Composed of net property, plant and equipment plus investment, and advances to unconsolidated subsidiaries. 3 Theimplementation of the new ‘‘Financial Accounting Standard No. 106’’ greatly reduced the reported profitability of large publiclytraded corporations. Net income without these accounting changes would have been $12.5 billion. 4 Long-term debt includesamounts applicable to capitalized leases.

Source: U.S. Energy Information Administration, Performance Profiles of Major Energy Producers, annual.

Strategic Reserve—World Oil—Energy Companies 599

No. 959. Petroleum and Coal Products Corporations—Sales, Net Profit, and ProfitPer Dollar of Sales: 1980 to 1993

[Represents SIC group 29. Profit rates are averages of quarterly figures at annual rates. Beginning 1986,excludes estimates for corporations with less than $250,000 in assets]

ITEM Unit 1980 1983 1984 1985 1986 1987 1988 1989 1990 1991 1992 1993

Sales . . . . . . . . . . . . . . . . . Bil. dol . . 333.2 312.7 338.4 320.9 226.5 248.3 252.2 265.3 318.5 282.2 278.0 266.1Net profit:Before income taxes . . . . . Bil. dol . . 39.1 27.1 24.5 17.7 9.8 14.2 27.3 23.7 23.3 12.2 2.0 15.0After income taxes . . . . . . Bil. dol . . 25.5 19.3 17.2 12.7 8.8 10.9 21.2 19.5 18.0 10.9 3.2 13.1

Depreciation1. . . . . . . . . . . . Bil. dol . . 11.6 17.5 20.7 22.1 21.9 20.3 20.0 18.5 18.7 18.0 18.3 17.4Profits per dollar of sales:Before income taxes . . . . . Cents . . 11.7 8.7 7.2 5.5 4.1 5.8 10.8 9.0 7.4 4.3 0.4 5.6After income taxes . . . . . . Cents . . 7.7 6.2 5.1 4.0 3.8 4.5 8.5 7.4 5.7 3.9 0.9 4.9

Profits on stockholders’ equity:Before income taxes . . . . . Percent . 30.7 17.8 14.3 11.7 6.8 10.1 19.2 17.8 16.6 8.6 1.5 11.9After income taxes . . . . . . Percent . 20.0 12.7 10.0 8.5 6.1 7.7 14.9 14.6 12.8 7.7 2.4 10.3

1 Includes depletion and accelerated amortization of emergency facilities.Source: 1980, U.S. Federal Trade Commission; thereafter, U.S. Bureau of the Census, Quarterly Financial Report for

Manufacturing, Mining and Trade Corporations.

No. 960. Major Petroleum Companies—Financial Data Summary: 1973 to 1993[Data represent a composite of approximately 42 major worldwide petroleum companies aggregated on a consolidated,

total company basis]

ITEM 1973 1975 1980 1985 1987 1988 1989 1990 1991 1992 1993

FINANCIAL DATA (bil. dol.)Net income . . . . . . . . . . . . . . . . . . . . 11.8 11.6 32.9 19.4 15.0 24.6 24.7 26.8 18.7 12.1 18.9Depreciation, depletion, etc . . . . . . . . . 10.5 11.3 32.5 53.0 45.0 34.3 33.7 38.7 36.5 43.3 36.6Cash flow1. . . . . . . . . . . . . . . . . . . . . 22.3 22.8 65.4 72.4 60.0 58.9 58.4 65.5 55.2 55.4 55.5Dividends paid . . . . . . . . . . . . . . . . . . 4.0 4.7 9.3 12.0 12.4 14.0 16.0 15.9 16.3 16.5 15.5Net internal funds available for investmentor debt repayment 2. . . . . . . . . . . . . . 18.3 18.1 56.1 60.4 47.6 44.9 42.4 49.6 38.9 38.9 40Capital and exploratory expenditures . . . 16.3 26.9 62.1 58.3 50.1 62.4 55.1 59.6 61.5 53.6 51.8Long-term capitalization . . . . . . . . . . . . 102.9 121.1 211.4 272.1 282.2 287.8 290.0 300.0 307.4 290.7 291.6Long-term debt . . . . . . . . . . . . . . . . 22.5 28.9 49.8 93.5 88.4 88.5 91.4 90.4 95.9 94.0 91.5Preferred stock . . . . . . . . . . . . . . . . 0.4 0.4 2.0 3.3 4.1 4.5 6.4 5.2 4.1 5.3 5.8Common stock and retained earnings 3. 80.0 91.9 159.6 175.3 189.7 194.8 192.2 204.4 207.4 191.4 194.3

Excess of expenditures over cashincome 4 . . . . . . . . . . . . . . . . . . . . . -2.0 8.9 6.0 -2.1 -2.5 17.5 12.7 10.0 22.6 14.7 11.8

RATIOS 5 (percent)Long-term debt to long-termcapitalization . . . . . . . . . . . . . . . . . . 22.0 23.8 23.6 34.4 31.3 30.8 31.5 30.1 31.2 32.3 31.4Net income to total average capital . . . . 12.0 10.0 17.0 7.0 4.6 8.6 8.3 9.1 6.2 4.1 6.5Net income to average common equity . . 15.6 13.1 22.5 10.8 7.3 12.8 12.4 13.5 9.1 6.1 9.8

1 Generally represents internally-generated funds from operations. Sum of net income and noncash charges such asdepreciation, depletion, and amortization. 2 Cash flow minus dividends paid. 3 Includes common stock, capital surplus, andearned surplus accounts after adjustments. 4 Capital and exploratory expenditures plus dividends paid minus cash flow.5 Represents approximate year-to-year comparisons because of changes in the makeup of the group due to mergers and othercorporate changes.

Source: Carl H. Pforzheimer & Co., New York, NY, Comparative Oil Company Statements, 1993-1992, and earlier reports.

No. 961. Electric Utility Sales and Average Prices, by End-Use Sector: 1970 to 1993[Prior to 1980, covers Class A and B privately-owned electric utilities; thereafter, Class A utilities whose electric operating

revenues were $100 million or more during the previous year]

YEAR

SALES (bil. kWh) AVERAGE PRICE OF ELECTRICITY SOLD (cents per kWh)

Total 1 Resi-dential

Com-mer-cial

Indus-trial

Current dollars Constant (1987) dollars 2

Total 1 Resi-dential

Com-mer-cial

Indus-trial Total 1 Resi-

dential

Com-mer-cial

Indus-trial

1970 . . . . . 1,392 466 307 571 1.7 2.2 2.1 1.0 4.8 6.3 6.0 2.81973 . . . . . 1,713 579 388 686 2.0 2.5 2.4 1.3 4.8 6.1 5.8 3.11975 . . . . . 1,747 588 403 688 2.9 3.5 3.5 2.1 5.9 7.1 7.1 4.31980 . . . . . 2,094 717 488 815 4.7 5.4 5.5 3.7 6.6 7.5 7.7 5.21981 . . . . . 2,147 722 514 826 5.5 6.2 6.3 4.3 7.0 7.9 8.0 5.41982 . . . . . 2,086 730 526 745 6.1 6.9 6.9 5.0 7.3 8.2 8.2 6.01983 . . . . . 2,151 751 544 776 6.3 7.2 7.0 5.0 7.2 8.3 8.0 5.71984 . . . . . 2,286 780 583 838 6.3 7.2 7.1 4.8 6.9 7.9 7.8 5.31985 . . . . . 2,324 794 606 837 6.4 7.4 7.3 5.0 6.8 7.8 7.7 5.31986 . . . . . 2,369 819 631 831 6.4 7.4 7.2 4.9 6.6 7.6 7.4 5.11987 . . . . . 2,457 850 660 858 6.4 7.4 7.1 4.8 6.4 7.4 7.1 4.81988 . . . . . 2,578 893 699 896 6.4 7.5 7.0 4.7 6.2 7.2 6.7 4.51989 . . . . . 2,647 906 726 926 6.5 7.6 7.2 4.7 6.0 7.0 6.6 4.31990 . . . . . 2,713 924 751 946 6.6 7.8 7.3 4.7 5.8 6.9 6.4 4.11991 . . . . . 2,762 955 766 947 6.7 8.0 7.5 4.8 5.7 6.8 6.4 4.11992 . . . . . 2,763 936 761 973 6.8 8.2 7.7 4.8 5.6 6.8 6.4 4.01993 . . . . . 2,865 994 790 983 6.9 8.3 7.7 4.9 5.6 6.7 6.2 3.9

1 Includes other sectors not shown separately. 2 Based on the GDP implicit price deflator.Source: U.S. Energy Information Administration, Annual Energy Review.

Energy600

No. 962. Electric Utility Industry—Net Generation, Net Summer Capability,Generating Units, and Consumption of Fuels: 1970 to 1993

[Net Generation for calendar years; other data as of December 31. See also Historical Statistics, Colonial Times to 1970,series S 32-52, S 78-82, and S 86-107]

ITEM Unit 1970 1975 1980 1985 1988 1989 1990 1991 1992 1993

NET GENERATION

Total . . . . . . . . . . . . . . . . . . Bil. kWh . . 1,532 1,918 2,286 2,470 2,704 2,784 2,808 2,825 2,797 2,883Average annual change 1 . . . Percent . . . 7.3 4.5 3.5 1.5 3.0 2.9 0.9 0.6 -1.0 3.0

Net generation, kWh per kW of netsummer capability 2 . . . . . . . . . . Rate . . . . . 4,560 3,904 3,951 3,770 3,990 4,064 4,064 4,076 4,024 4,130

Investor owned. . . . . . . . . . . . . . . Bil. kWh. . . 1,183 1,487 1,783 1,918 2,146 2,192 2,203 2,213 2,214 2,271Percent of total utilities . . . . . . . . Percent . . . 77.2 77.5 78.0 77.7 79.4 78.7 78.4 78.4 79.2 78.8

Publicly owned . . . . . . . . . . . . . . . Bil. kWh. . . 349 431 503 552 559 592 606 610 582 611Municipal . . . . . . . . . . . . . . . . . Bil. kWh. . . 71 82 87 74 97 100 98 97 94 103Federal . . . . . . . . . . . . . . . . . . Bil. kWh. . . 186 221 235 233 201 224 235 241 225 232Cooperatives and other . . . . . . . Bil. kWh. . . 91 128 182 245 261 269 273 272 263 276

Source of energy:Coal 3 . . . . . . . . . . . . . . . . . . . Percent . . . 46.0 44.6 51.0 57.2 57.4 56.2 55.5 54.9 56.3 56.9Nuclear . . . . . . . . . . . . . . . . . . Percent . . . 1.4 9.0 11.0 15.5 19.5 19.0 20.5 21.7 22.1 21.2Oil . . . . . . . . . . . . . . . . . . . . . Percent . . . 12.0 15.1 10.8 4.1 5.5 5.7 4.2 3.9 3.2 3.5Gas . . . . . . . . . . . . . . . . . . . . Percent . . . 24.3 15.6 15.1 11.8 9.3 9.6 9.4 9.4 9.4 9.0Hydro . . . . . . . . . . . . . . . . . . . Percent . . . 16.2 15.6 12.1 11.4 8.2 9.5 10.0 9.8 8.6 9.2

Type of prime mover: 4Hydro . . . . . . . . . . . . . . . . . . . Bil. kWh. . . 248 300 276 281 223 265 280 276 239 265Steam conventional 5 . . . . . . . . . Bil. kWh. . . 1,240 1,414 1,726 1,778 1,921 1,950 1,919 1,905 1,906 1,973Gas turbine and internal combustion Bil. kWh. . . 22 28 28 16 22 29 22 22 21 25Steam nuclear . . . . . . . . . . . . . Bil. kWh. . . 22 173 251 384 527 529 577 613 619 610Other . . . . . . . . . . . . . . . . . . . Bil. kWh. . . 1 3 6 11 12 11 11 10 10 10

NET SUMMER CAPABILITY

Total 6 . . . . . . . . . . . . . . . . . Mil. kW . . . 336 491 579 655 678 685 691 693 695 698Average annual change 1 . . . Percent . . . 7.2 7.6 3.3 2.5 1.1 1.1 0.9 0.3 0.3 0.4

Hydro . . . . . . . . . . . . . . . . . . . . . Mil. kW . . . 64 78 82 89 90 91 91 92 93 94Steam conventional 7 . . . . . . . . . . Mil. kW . . . 248 333 397 437 442 444 448 447 447 447Gas turbine . . . . . . . . . . . . . . . . . Mil. kW . . . 13 37 43 44 44 45 46 48 50 52Steam nuclear . . . . . . . . . . . . . . . Mil. kW . . . 7 37 52 79 95 98 100 100 99 99Internal combustion. . . . . . . . . . . . Mil. kW . . . 4 5 5 5 5 5 5 5 5 5Geothermal and other . . . . . . . . . . Mil. kW . . . (Z) 1 1 2 2 2 2 2 2 2

NUMBER OF GENERATING UNITS

Total 8 . . . . . . . . . . . . . . . . . Number . . 9,717 (NA) 11,084 (NA) 10,305 10,325 10,296 10,260 10,221 10,105Hydro . . . . . . . . . . . . . . . . . . . . . Number . . . 3,108 (NA) 3,275 (NA) 3,496 3,479 3,479 3,476 3,497 3,388Steam conventional. . . . . . . . . . . . Number . . . 2,813 (NA) 2,862 (NA) 2,383 2,363 2,354 2,284 2,307 2,221Gas turbine . . . . . . . . . . . . . . . . . Number . . . 658 (NA) 1,447 (NA) 1,397 1,438 1,460 1,485 1,501 1,411Steam nuclear . . . . . . . . . . . . . . . Number . . . 16 (NA) 74 (NA) 108 110 111 111 109 109Internal combustion. . . . . . . . . . . . Number . . . 3,118 (NA) 3,410 (NA) 2,872 2,889 2,847 2,803 2,807 2,976

CONSUMPTION OF FUELS

Net generation by fuel 9. . . . Bil. kWh . . 1,284 1,618 2,010 2,189 2,481 2,519 2,525 2,539 2,548 2,608Average annual change1. . Percent . . . (NA) 4.6 4.3 1.7 4.2 1.5 0.2 0.6 0.4 2.3

Coal . . . . . . . . . . . . . . . . . . . . . . Bil. kWh. . . 704 853 1,162 1,402 1,541 1,554 1,560 1,551 1,576 1,639Percent of total . . . . . . . . . . . . . Percent . . . 54.8 52.7 57.8 64.0 62.1 61.7 61.7 (NA) (NA) (NA)

Petroleum . . . . . . . . . . . . . . . . . . Bil. kWh. . . 184 289 246 100 149 158 117 111 89 100Gas . . . . . . . . . . . . . . . . . . . . . . Bil. kWh. . . 373 300 346 292 253 267 264 264 264 259Nuclear . . . . . . . . . . . . . . . . . . . . Bil. kWh. . . 22 173 251 384 527 529 577 613 619 610Fuel consumed:Total energy equivalent. . . . . . . . Quad. Btu . 13.40 15.19 18.57 18.79 20.12 20.54 20.32 20.06 19.99 20.71Coal . . . . . . . . . . . . . . . . . . . . Mil. sh. tons 320 406 569 694 758 767 774 772 780 814Oil . . . . . . . . . . . . . . . . . . . . . Mil. bbl. . . . 339 507 421 175 250 270 200 189 152 169Gas . . . . . . . . . . . . . . . . . . . . Bil. cu. ft . . 3,932 3,158 3,682 3,044 2,636 2,787 2,787 2,789 2,766 2,680

NA Not available. Z Less than 0.5 million kW. 1 Change from immediate prior year except for 1970, change from 1960.For explanation of average annual percent change, see Guide to Tabular Presentation. 2 Net summer capability is the steadyhourly output that generating equipment is expected to supply to system load, exclusive of auxiliary power as demonstrated by testat the time of summer peak demand. 3 Includes small percentage (.5 percent) from wood and waste, geothermal, and petroleumcoke. 4 A prime mover is the engine, turbine, water wheel, or similar machine which drives an electric generator. 5 Fossil fuelsonly. 6 Includes wind, solar thermal, and photovoltaic, not shown separately. 7 Includes fossil steam, wood, and waste.8 Each prime mover type in combination plants counted separately. Includes geothermal, wind, and solar, not shown separately.9 Includes small amounts of wood, waste, wind, geothermal, solar thermal, and photovoltaic.

Source: 1970, U.S. Federal Power Commission, Electric Power Statistics, and press releases; thereafter, U.S. EnergyInformation Administration, 1975 and 1980, Power Production, Fuel Consumption, and Installed Capacity Data-Annual, andunpublished data; thereafter, Electric Power Annual, Annual Energy Review, and unpublished data.

Electric Utility Industry 601

No. 963. Electric Utility Industry—Capability, Peak Load, and Capacity Margin:1970 to 1993

[Excludes Alaska and Hawaii. Capability represents the maximum kilowatt output with all power sources available and with hydrau-lic equipment under actual water conditions, allowing for maintenance, emergency outages, and system operating requirements.Capacity margin is the difference between capability and peak load]

YEAR

CAPABILITY AT THE TIME OF— NONCOINCIDENTPEAK LOAD CAPACITY MARGIN

Summer peak load(1,000 kW)

Winter peak load1(1,000 kW)

Summer Winter1

Summer Winter1

Amount

Changefromprioryear2

Amount

Changefromprioryear2

Amount(1,000kW)

Percentof

capability

Amount(1,000kW)

Percentof

capability

1970 . . . . . . . 326,900 26,600 339,050 27,600 274,650 248,550 52,250 16.0 90,500 26.71975 . . . . . . . 479,300 34,900 492,450 25,050 356,800 331,100 122,500 25.6 161,350 32.81978 . . . . . . . 545,700 29,700 561,550 23,950 408,050 383,100 137,650 25.2 178,450 31.81979 3. . . . . . 544,506 (X) 554,525 (X) 398,424 368,876 146,082 26.8 185,649 33.51980 . . . . . . . 558,237 13,731 572,195 17,670 427,058 384,567 131,179 23.5 187,628 32.81981 . . . . . . . 572,219 13,982 586,569 14,374 429,349 397,800 142,870 25.0 188,769 32.21982 . . . . . . . 586,142 13,923 598,066 11,497 415,618 373,985 170,524 29.1 224,081 37.51983 . . . . . . . 596,449 10,307 612,453 14,387 447,526 410,779 148,923 25.0 201,674 32.91984 . . . . . . . 604,240 7,791 622,125 9,672 451,150 436,374 153,090 25.3 185,751 29.91985 . . . . . . . 621,597 17,357 636,475 14,350 460,503 423,660 161,094 25.9 212,815 33.41986 . . . . . . . 633,291 11,694 646,721 10,246 476,320 422,857 156,971 24.8 223,864 34.61987 . . . . . . . 648,118 14,827 662,977 16,256 496,185 448,277 151,933 23.4 214,700 32.41988 . . . . . . . 661,580 13,462 676,940 13,963 529,460 466,533 132,120 20.0 210,407 31.11989 . . . . . . . 673,316 11,736 685,249 8,309 523,432 496,378 149,884 22.3 188,871 27.61990 . . . . . . . 685,091 11,775 696,757 11,508 545,537 484,014 139,554 20.4 212,743 30.51991 . . . . . . . 690,915 5,824 703,212 6,455 551,320 485,435 139,595 20.2 217,777 31.01992 . . . . . . . 695,436 4,521 707,752 4,540 548,707 492,983 146,729 21.1 214,769 30.31993 . . . . . . . 694,250 1,186 711,957 4,205 575,356 521,733 118,894 17.1 190,224 26.7

X Not applicable. 1 1970 is for the month of December. 2 For 1970 and 1975, change from 1969 and 1974, respectively.3 Beginning 1979, data are not entirely comparable with prior years due to change in data source.

Source: Edison Electric Institute, Washington, DC, Statistical Yearbook of the Electric Utility Industry, annual.

No. 964. Electric Energy Sales, by Class of Service, 1970 to 1993, and by State, 1993[In billions of kilowatt-hours ]

REGION, DIVISION,AND STATE Total1 Resi-

dentialCom-mercial

Indus-trial

1970 . . . . . . . . . . . . . 1,392.3 466.3 306.7 570.91973 . . . . . . . . . . . . . 1,712.9 579.2 388.3 686.11975 . . . . . . . . . . . . . 1,747.1 588.1 403.0 687.71980 . . . . . . . . . . . . . 2,094.4 717.5 488.2 815.11985 . . . . . . . . . . . . . 2,309.5 791.0 609.0 824.51988 . . . . . . . . . . . . . 2,578.1 892.9 699.1 896.51989 . . . . . . . . . . . . . 2,646.8 905.5 725.9 925.71990 . . . . . . . . . . . . . 2,712.6 924.0 751.0 945.51991 . . . . . . . . . . . . . 2,762.0 955.4 765.7 946.61992 . . . . . . . . . . . . . 2,763.3 935.9 761.3 972.7

1993, total 2 . . . . . 2,861.5 994.8 794.6 977.2Northeast . . . . . . . . . . 420.6 141.5 147.1 115.9New England . . . . . . 104.8 38.1 38.7 26.2Maine . . . . . . . . . 12.0 3.9 2.9 5.0New Hampshire . . . 8.8 3.4 2.1 3.1Vermont . . . . . . . . 5.0 2.0 1.6 1.4Massachusetts . . . 45.3 15.8 18.9 9.6Rhode Island. . . . . 6.5 2.4 2.5 1.4Connecticut. . . . . . 27.2 10.6 10.7 5.6

Middle Atlantic . . . . 315.8 103.4 108.5 89.7New York . . . . . . . 130.2 39.9 47.7 30.2New Jersey. . . . . . 65.6 22.0 28.5 14.6Pennsylvania. . . . . 120.0 41.5 32.3 44.9

Midwest . . . . . . . . . . . 690.9 220.7 181.7 268.4East North Central . . 489.0 146.3 127.3 200.5Ohio . . . . . . . . . . 148.6 42.0 33.3 68.8Indiana. . . . . . . . . 81.9 25.0 17.0 39.4Illinois . . . . . . . . . 117.8 35.2 34.4 40.2Michigan . . . . . . . 87.6 26.8 28.9 30.6Wisconsin. . . . . . . 53.2 17.4 13.7 21.4

West North Central . 201.8 74.4 54.4 67.9Minnesota. . . . . . . 49.2 15.6 8.5 24.4Iowa . . . . . . . . . . 32.1 11.1 7.3 12.5Missouri . . . . . . . . 58.6 24.2 19.9 13.6North Dakota. . . . . 7.4 3.2 1.8 1.9South Dakota . . . . 6.9 3.1 1.6 1.8Nebraska . . . . . . . 18.7 7.2 5.5 5.0Kansas . . . . . . . . 28.8 10.0 9.8 8.7

REGION, DIVISION,AND STATE Total1 Resi-

dentialCom-mercial

Indus-trial

South . . . . . . . . . . . . . 1,220.3 459.5 296.7 424.2South Atlantic . . . . . 582.4 236.5 167.5 159.9Delaware . . . . . . . 9.1 3.0 2.6 3.4Maryland . . . . . . . 53.9 21.5 11.3 20.2Dist. of Columbia . . 10.4 1.6 5.4 3.0Virginia. . . . . . . . . 81.4 32.5 22.7 17.4West Virginia. . . . . 24.4 8.7 5.5 10.2North Carolina . . . . 99.8 37.7 26.7 33.5South Carolina . . . 61.5 20.7 13.2 26.9Georgia . . . . . . . . 89.2 33.9 25.2 29.1Florida . . . . . . . . . 152.7 76.8 54.9 16.3

East South Central. . 247.8 85.3 32.9 124.6Kentucky . . . . . . . 68.1 19.2 9.8 36.3Tennessee . . . . . . 79.8 30.2 5.2 43.5Alabama. . . . . . . . 65.1 22.6 11.3 30.5Mississippi . . . . . . 34.7 13.2 6.7 14.2

West South Central . 390.0 137.8 96.3 139.7Arkansas . . . . . . . 31.7 11.8 6.7 12.6Louisiana . . . . . . . 67.8 22.4 14.4 28.4Oklahoma. . . . . . . 40.5 15.9 10.8 11.7Texas. . . . . . . . . . 250.1 87.7 64.3 86.9

West . . . . . . . . . . . . . 529.8 173.1 169.0 168.7Mountain . . . . . . . . . 171.2 54.0 53.8 56.7Montana. . . . . . . . 12.9 3.6 3.0 5.8Idaho . . . . . . . . . . 18.7 6.2 5.0 7.2Wyoming . . . . . . . 11.9 1.9 2.5 7.4Colorado . . . . . . . 33.0 10.7 14.4 7.0New Mexico . . . . . 14.9 3.9 4.8 4.8Arizona . . . . . . . . 44.4 16.7 14.8 11.0Utah . . . . . . . . . . 16.9 4.7 5.0 6.2Nevada . . . . . . . . 18.5 6.3 4.3 7.2

Pacific . . . . . . . . . . 358.6 119.1 115.2 112.0Washington. . . . . . 90.5 30.9 19.5 36.6Oregon . . . . . . . . 44.6 16.7 12.2 15.0California . . . . . . . 210.5 67.4 79.1 56.2Alaska . . . . . . . . . 4.4 1.6 2.1 0.5Hawaii . . . . . . . . . 8.7 2.5 2.4 3.8

1 Includes other service not shown separately. 2 Preliminary.

Source: U.S. Energy Information Administration, Electric Power Annual.

Energy602

No. 965. Electric Energy—Net Generation and Net Summer Capability, by State:1990 to 1993

[Capacity as of Dec. 31. Covers utilities for public use]

DIVISIONANDSTATE

NET GENERATION(bil. kWh)

NETSUMMER

CAPABILITY(mil. kW)

1990 1992

1993

1990 1993Total

Per-centfromcoal

U.S. . . . 2,808.2 2,797.2 2,882.5 56.9 690.5 700.0

N.E . . . . . 94.1 84.6 83.9 17.9 23.4 22.4ME . . . . 9.1 8.3 8.1 - 2.4 2.4NH . . . . 10.8 13.5 14.6 22.4 2.6 2.5VT . . . . 5.0 4.7 4.3 - 1.1 1.1MA . . . . 36.5 32.8 28.2 34.9 9.9 9.5RI . . . . . 0.6 0.1 0.1 - 0.3 0.2CT . . . . 32.2 25.2 28.7 6.6 7.1 6.8

M.A . . . . . 330.8 309.4 306.8 41.6 78.4 80.0NY . . . . 128.7 112.2 106.3 20.5 31.2 32.7NJ . . . . 36.5 31.2 34.3 15.9 13.7 13.9PA . . . . 165.7 166.0 166.2 60.4 33.4 33.4

E.N.C . . . . 485.8 487.6 513.8 73.3 113.1 114.2OH . . . . 126.5 136.3 133.7 92.0 27.0 27.2IN. . . . . 97.7 97.3 100.0 98.8 20.6 20.9IL . . . . . 127.0 124.8 140.1 42.7 32.6 32.8MI . . . . 89.1 82.7 92.3 66.7 22.3 22.4WI . . . . 45.6 46.5 47.8 70.3 10.6 10.9

W.N.C. . . . 218.4 212.8 218.4 75.9 54.2 54.8MN . . . . 41.6 37.8 41.3 65.7 8.8 8.9IA . . . . . 29.0 29.4 31.0 86.0 8.0 8.1MO . . . . 59.0 56.6 53.2 76.5 15.2 15.4ND . . . . 26.8 28.6 28.5 94.9 4.5 4.5SD . . . . 6.4 6.2 5.3 50.3 2.7 2.7NE . . . . 21.6 22.4 22.7 64.9 5.5 5.5KS . . . . 33.9 31.8 36.4 73.6 9.6 9.7

S.A . . . . . 533.8 547.5 575.4 58.5 129.2 134.9DE . . . . 7.1 6.3 8.3 62.4 2.0 2.3MD . . . . 31.5 39.6 43.5 57.2 9.8 10.7DC . . . . 0.4 0.1 0.2 - 0.8 0.8

DIVISIONANDSTATE

NET GENERATION(bil. kWh)

NETSUMMER

CAPABILITY(mil. kW)

1990 1992

1993

1990 1993Total

Per-centfromcoal

VA . . . . 47.2 49.0 52.2 47.4 13.7 14.1WV . . . . 77.4 72.3 71.1 99.2 14.4 14.4NC . . . . 79.8 83.0 88.8 66.9 20.2 20.2SC . . . . 69.3 71.5 75.6 35.1 14.9 16.1GA . . . . 97.6 91.8 95.7 66.1 20.7 21.5FL . . . . 123.6 134.0 140.1 44.2 32.7 34.8

E.S.C . . . . 246.9 264.0 274.0 79.2 59.5 58.5KY . . . . 73.8 77.4 85.0 96.1 15.5 15.3TN . . . . 73.9 75.4 71.6 83.2 17.0 16.2AL . . . . 76.2 90.8 94.1 70.9 20.0 20.0MS . . . . 22.9 20.5 23.2 38.0 7.0 7.0

W.S.C. . . . 374.3 378.5 394.4 49.4 101.2 103.3AR . . . . 37.1 37.4 38.0 47.4 9.6 9.7LA . . . . 58.2 55.2 59.4 32.6 16.8 16.9OK . . . . 45.1 45.9 48.8 59.4 12.8 12.9TX . . . . 234.0 240.0 248.2 51.7 62.0 63.9

Mountain . 247.4 257.2 255.0 75.9 49.3 49.8MT . . . . 25.7 25.5 23.4 58.7 4.9 4.9ID. . . . . 8.6 6.3 9.0 - 2.3 2.3WY . . . . 39.4 41.9 40.2 97.9 5.8 5.9CO . . . . 31.3 31.9 32.7 93.2 6.6 6.6NM . . . . 28.5 27.7 28.4 89.9 5.0 5.1AZ . . . . 62.3 70.1 68.0 54.4 14.9 15.0UT . . . . 32.3 32.9 33.5 95.4 4.8 4.8NV . . . . 19.3 21.0 19.8 78.8 4.9 5.2

Pacific . . . 276.7 255.7 261.0 4.8 82.1 82.0WA . . . . 100.5 84.1 83.8 10.5 24.2 24.3OR . . . . 49.2 41.2 40.7 8.6 11.2 10.1CA . . . . 114.5 119.3 125.8 - 43.7 44.3AK . . . . 4.5 4.2 4.6 7.1 1.5 1.7HI . . . . . 8.0 6.9 6.1 - 1.5 1.6

- Represents zero.Source: U.S. Energy Information Administration, Electric Power Annual, Electric Power Monthly, December issues, and

Inventory of Power Plants in the United States, annual.

No. 966. Nuclear Power Plants—Number of Units, Net Generation, and Net SummerCapability, by State: 1993

REGION,DIVISION,AND STATE

Numberof units

NETGENERATION

NET SUMMERCAPABILITY

Total(mil.kWh)

Percentof

total1

Total(mil.kW)

Percentof

total1

U.S. . . . 109 610,291 21.2 99.04 14.1Northeast . . 27 155,451 39.8 23.79 23.2N.E . . . . . 8 44,299 52.8 6.39 28.6ME . . . . 1 5,740 71.1 0.87 36.2NH . . . . 1 9,047 62.0 1.15 45.9VT . . . . 1 3,372 78.4 0.50 45.3MA . . . . 1 4,339 15.4 0.67 7.0CT . . . . 4 21,802 75.9 3.21 47.5

M.A . . . . . 19 111,152 36.2 17.39 21.7NY . . . . 6 26,889 25.3 4.83 14.8NJ . . . . 4 24,932 72.7 3.85 27.8PA . . . . 9 59,331 35.7 8.71 26.1

Midwest . . . 31 166,681 22.8 25.70 15.2E.N.C. . . . 23 128,374 25.0 20.11 17.6OH . . . . 2 10,011 7.5 2.04 7.5IL . . . . . 13 78,373 55.9 12.61 38.5MI . . . . 5 28,525 30.9 3.97 17.7WI . . . . 3 11,465 24.0 1.50 13.7

W.N.C . . . 8 38,307 17.5 5.58 10.2MN. . . . 3 11,986 29.1 1.55 17.5IA. . . . . 1 3,235 10.4 0.52 6.4MO. . . . 1 8,381 15.8 1.13 7.3NE . . . . 2 6,805 29.9 1.25 22.8KS . . . . 1 7,900 21.7 1.13 11.7

REGION,DIVISION,AND STATE

Numberof units

NETGENERATION

NET SUMMERCAPABILITY

Total(mil.kWh)

Percentof

total1

Total(mil.kW)

Percentof

total1

South . . . . . 43 227,417 18.3 40.34 13.6S.A . . . . . 27 158,058 27.5 23.66 17.5MD. . . . 2 12,301 28.3 1.66 15.5VA . . . . 4 22,689 43.5 3.35 23.8NC . . . . 5 23,759 26.8 4.64 23.0SC . . . . 7 46,189 61.1 6.36 39.5GA . . . . 4 27,233 28.4 3.83 17.8FL . . . . 5 25,887 18.5 3.83 11.0

E.S.C . . . . 8 29,032 10.6 8.20 14.0TN . . . . 2 3,305 4.6 2.22 13.7AL . . . . 5 17,823 18.9 4.84 24.2MS . . . . 1 7,904 34.0 1.14 16.2

W.S.C . . . 8 40,327 10.2 8.48 8.2AR . . . . 2 13,522 35.5 1.69 17.5LA . . . . 2 14,398 24.3 2.01 11.9TX . . . . 4 12,407 5.0 4.78 7.5

West . . . . . . 8 60,743 11.8 9.22 7.0Mountain . 3 22,049 8.6 3.81 7.6AZ . . . . 3 22,049 32.4 3.81 25.3

Pacfic . . . 5 38,694 14.8 5.41 6.6WA. . . . 1 7,135 8.5 1.10 4.5OR . . . . - -21 -0.1 - -CA . . . . 4 31,581 25.1 4.31 9.7

- Represents zero. 1 For total capability and generation, see table 965.Source: U.S. Energy Information Administration, Electric Power Annual and Electric Power Monthly, December issues.

Electric Energy—Nuclear Power 603

No. 967. Nuclear Power Plants—Number, Capacity, and Generation: 1965 to 1993

ITEM 1965 1970 1975 1980 1985 1987 1988 1989 1990 1991 1992 1993

Operable generating units1 . . . . . . . 6 18 54 70 95 107 108 110 111 111 109 109Net summer capability1 2 (mil. kW). . 0.8 7.0 37.3 51.8 79.4 93.6 94.7 98.2 99.6 99.6 99.0 99.1Net generation (bil. kWh) . . . . . . . . 3.7 21.8 172.5 251.1 383.7 455.3 527.0 529.4 576.9 612.6 618.8 610.3Percent of total electric utilitygeneration . . . . . . . . . . . . . . . 0.3 1.4 9.0 11.0 15.5 17.7 19.5 19.0 20.5 21.7 22.1 21.2

Capacity factor 3. . . . . . . . . . . . . . (NA) (NA) 55.9 56.3 58.0 57.4 63.5 62.2 66.0 70.2 70.9 70.5

NA Not available. 1 As of yearend. 2 Net summer capability is the peak steady hourly output that generating equipmentis expected to supply to system load, exclusive of auxiliary and other powerplant, as demonstrated by test at the time of summerpeak demand. 3 Weighted average of monthly capacity factors. Monthly factors are derived by dividing actual monthly generationby the maximum possible generation for the month (hours in month times net maximum dependable capacity).

Source: U.S. Energy Information Administration, Annual Energy Review.

No. 969. Uranium Supply, Enrichment, and Discharged Commercial Reactor Fuel:1980 to 1994

[Years ending Dec. 31, except as noted. For additional data on uranium, see section 25 on mining. For explanationof kilogram, see weights and measures]

ITEM Unit 1980 1985 1988 1989 1990 1991 1992 1993 1994

URANIUM CONCENTRATE

Production . . . . . . . . . . . . . Mil. lb . . . . 43.70 11.31 13.13 13.84 8.89 7.95 5.65 3.07 (NA)Exports . . . . . . . . . . . . . . . Mil. lb . . . . 5.80 5.30 3.30 2.10 2.00 3.50 2.80 2.80 (NA)Imports. . . . . . . . . . . . . . . . Mil. lb . . . . 3.60 11.70 15.80 13.10 23.70 16.30 23.30 17.70 (NA)Avg price of domestic purchases Dol./lb . . . . (NA) 31.43 26.15 19.56 15.70 13.66 13.45 (NA) (NA)

ENRICHMENT 1

Enriched product 2 . . . . . . . . Mil. Swu3 . . 10.69 10.2 9.9 11.9 10.2 10.3 (NA) (NA) (NA)For domestic customers . . . Mil. Swu3 . . 6.89 6.0 6.3 7.6 6.8 6.7 (NA) (NA) (NA)For foreign customers . . . . Mil. Swu3 . . 3.80 4.2 3.6 4.3 3.4 3.6 (NA) (NA) (NA)

Sales . . . . . . . . . . . . . . . . . Mil. dol . . . 1,379 1,403 1,094 1,320 1,148 1,156 (NA) (NA) (NA)

DISCHARGED COMMERCIALREACTOR FUEL 4

Annual discharge . . . . . . . . . Metric tons. 1,193 1,330 1,672 1,914 2,028 1,794 2,255 2,082 1,925Inventory, year-end 5. . . . . . . Metric tons. 6,434 12,481 17,178 19,092 21,120 22,914 25,169 27,251 29,176

NANot available. 1 Beginning 1985, represents fiscal years. 2 Based on sales. 3 Separative work units. The standardmeasure of enrichment services is based on operating tails assay in effect at the time the enriched product was placed ininventory. 4 Uranium content. Source: Nuclear Assurance Corporation, Atlanta, GA. 5 Reprocessed fuel not included asinventory.

Source: Except as noted, U.S. Energy Information Administration, Annual Energy Review, Uranium Industry Annual andunpublished data.

Energy604

No. 970. Electric Utilities—Generation, Sales, Revenue, and Customers: 1970 to 1993[Sales and revenue are to and from ultimate customers]

CLASS Unit 1970 1975 1980 1985 1988 1989 1990 1991 1992 1993,prel.

Generation 1. . . . . . . . . . . . . Bil. kWh . 1,532 1,918 2,286 2,470 2,704 2,784 2,808 2,825 2,797 2,883Sales 2 . . . . . . . . . . . . . . . . Bil. kWh 1,391 1,733 2,126 2,306 2,554 2,621 2,684 2,737 2,735 2,836Residential or domestic . . . . Bil. kWh . 448 586 734 793 886 899 916 949 929 990Percent of total . . . . . . . Percent . 32.2 33.8 34.5 34.4 34.7 34.3 34.1 34.7 34.0 34.9

Commercial 3 . . . . . . . . . . Bil. kWh . 313 418 524 606 698 716 739 753 756 782Industrial 4 . . . . . . . . . . . . Bil. kWh . 573 662 794 820 882 913 932 935 949 964

Revenue 2 . . . . . . . . . . . . . . Bil. dol . 22.1 46.9 95.5 149.2 162.4 169.6 176.5 185.1 187.3 196.4Residential or domestic . . . . Bil. dol . . 9.4 18.8 37.6 58.6 66.4 68.8 71.7 76.4 76.4 82.3Percent of total . . . . . . . Percent . 42.7 40.1 39.4 39.3 40.9 40.5 40.7 41.2 40.8 41.9

Commercial 3 . . . . . . . . . . Bil. dol . . 6.3 13.5 27.4 44.1 49.1 51.6 54.2 56.8 58.0 60.3Industrial 4 . . . . . . . . . . . . Bil. dol . . 5.4 12.7 27.3 41.4 41.6 43.7 44.9 45.9 46.8 47.5

Ultimate customers, Dec. 31 2 Million. . 72.5 81.8 92.7 101.6 106.4 108.5 110.1 111.4 113.1 114.8Residential or domestic . . . . Million . . 64.0 72.6 82.2 89.8 93.9 95.6 97.0 98.2 99.6 101.1Commercial 3 . . . . . . . . . . Million . . 7.9 8.6 9.7 10.9 11.6 12.0 12.1 12.3 12.5 12.7Industrial 4 . . . . . . . . . . . . Million . . 0.4 0.4 0.5 0.5 0.5 0.5 0.5 0.5 0.5 0.5

Avg. kWh used percustomer . . . . . . . . . . . . . . 1,000. . . 19.4 21.4 23.2 22.9 24.2 24.4 24.6 24.7 24.4 24.9Residential . . . . . . . . . . . . 1,000. . . 7.1 8.2 9.0 8.9 9.5 9.5 9.5 9.7 9.4 9.9Commercial 3 . . . . . . . . . . 1,000. . . 40.0 49.0 54.5 56.1 60.4 60.6 61.3 61.6 61.0 62.4

Avg. annual bill per customer Dollar . . 307 579 1,040 1,482 1,536 1,576 1,614 1,670 1,667 1,726Residential . . . . . . . . . . . . Dollar . . 149 262 462 658 712 725 744 782 772 821Commercial 3 . . . . . . . . . . Dollar . . 804 1,580 2,848 4,080 4,256 4,363 4,494 4,646 4,681 4,814

Avg. revenue per kWh sold. . Cents . . 1.59 2.70 4.49 6.47 6.36 6.47 6.57 6.76 6.85 6.93Residential . . . . . . . . . . . . Cents . . 2.10 3.21 5.12 7.39 7.49 7.65 7.83 8.05 8.22 8.32Commercial 3 . . . . . . . . . . Cents . . 2.01 3.23 5.22 7.27 7.04 7.20 7.33 7.55 7.67 7.72Industrial 4 . . . . . . . . . . . . Cents . . 0.95 1.92 3.44 5.04 4.71 4.79 4.81 4.91 4.93 4.93

1 Source: 1970 and 1975, U.S. Federal Power Commission; thereafter, U.S. Energy Information Administration, MonthlyEnergy Review, monthly. 2 Includes other types not shown separately. 3 Small light and power. 4 Large light and power.

Source: Except as noted, Edison Electric Institute, Washington, DC, Statistical Yearbook of the Electric Utility Industry, annual.

No. 971. Major Investor-Owned Electric Utilities—Balance Sheet and Income Accountof Privately Owned Companies: 1982 to 1993

[In billions of dollars. As of Dec. 31. As of 1990, covers approximately 180 investor-owned electric utilities that during each ofthe last 3 years met any one or more of the following conditions — 1 mil. megawatthours of total sales; 100 megawatthours of salesfor resale, 500 megawatthours of gross interchange out, and 500 megawatthours of wheeling for other. See also HistoricalStatistics, Colonial Times to 1970, series S 133-146 and V 197-212]

ITEM 1982 1985 1986 1987 1988 1989 1990 1991 1992 1993

COMPOSITE BALANCE SHEET

Total assets and other debits . . . . . 315.0 404.7 426.1 446.3 454.3 465.7 477.9 487.5 506.4 566.6

Total electric utility plant. . . . . . . . . . . . . . 321.2 396.9 419.5 434.6 449.4 462.4 480.6 497.9 518.8 537.3Electric depreciation and amortization . . . . 67.6 85.1 93.9 103.2 113.5 125.0 135.7 148.3 160.5 173.4Net electric utility plant . . . . . . . . . . . . . . 253.6 311.8 325.6 331.4 335.9 337.5 344.9 349.6 358.3 363.8Total other utility plant . . . . . . . . . . . . . . . 16.7 19.9 21.2 23.1 24.6 26.3 28.5 31.0 33.4 36.4Other utility depreciation and amortization. . 5.3 6.5 7.2 7.8 8.5 9.2 10.0 10.8 11.7 12.4Net other utility plant . . . . . . . . . . . . . . . . 11.4 13.4 14.0 15.2 16.1 17.1 18.6 20.2 21.7 24.0Total all utility plant . . . . . . . . . . . . . . . . . 337.9 431.1 455.9 475.7 493.0 507.9 528.7 548.4 571.9 593.6All utility plant depreciation and amortization. 72.9 97.4 107.7 118.7 131.3 144.6 157.4 171.7 185.1 199.8Net all utility plant. . . . . . . . . . . . . . . . . . 265.0 333.8 348.2 357.0 361.6 363.2 371.3 376.8 386.9 393.8Other property and investments . . . . . . . . 9.1 12.1 13.5 15.6 15.2 16.1 17.7 17.4 18.0 20.1Current and accrued assets . . . . . . . . . . . 31.7 39.4 38.4 40.9 39.1 41.5 41.5 43.4 43.4 42.4Deferred debits . . . . . . . . . . . . . . . . . . . 9.3 19.4 26.1 32.9 38.3 44.8 47.3 50.0 58.0 110.3

Liabilities and other credits . . . . . . . 315.0 404.7 426.1 446.3 454.3 465.7 477.9 487.5 506.4 566.6

Capital stock 1 . . . . . . . . . . . . . . . . . . . . 70.3 82.8 81.6 79.9 80.7 82.9 83.2 83.6 86.1 87.1Other paid-in capital 2 . . . . . . . . . . . . . . . 27.7 36.3 38.4 40.3 40.4 39.1 40.5 42.9 44.7 47.2Retained earnings . . . . . . . . . . . . . . . . . 27.9 41.1 46.0 48.0 47.1 47.7 48.1 49.0 49.7 49.9Subsidiary earnings . . . . . . . . . . . . . . . . 1.6 2.2 2.3 2.6 2.5 2.8 2.9 3.0 2.7 2.9Long-term debt . . . . . . . . . . . . . . . . . . . 124.0 152.7 157.2 158.4 160.7 162.9 167.9 171.9 174.1 174.9

Current and accrued liabilities. . . . . . . . . . 28.6 32.0 34.0 39.3 38.4 42.0 44.3 43.4 45.6 48.9Deferred credits and operating reserves 3 . . 15.1 20.9 22.4 25.6 28.1 28.5 28.8 29.2 31.1 40.9Deferred income taxes as deferred credits . 19.4 32.7 39.6 45.9 50.2 53.3 56.5 59.2 65.0 105.0

COMPOSITE INCOME ACCOUNTS

Electric operating revenues . . . . . . . . . . . 109.3 135.3 136.3 138.5 143.9 150.9 157.3 166.8 169.5 176.4Electric operating expenses . . . . . . . . . . . 91.1 111.1 110.2 111.6 115.3 121.6 127.9 135.9 139.0 146.1Net electric utility operating income . . . . . . 18.1 24.1 26.1 27.0 28.6 29.4 29.4 30.9 30.5 30.2Other than electric utility operating income . 0.9 1.2 1.1 1.1 1.2 1.2 1.1 1.2 1.3 1.5Net utility operating income . . . . . . . . . . . 19.1 25.3 27.2 28.1 29.8 30.6 30.5 32.1 31.8 31.7Total other income . . . . . . . . . . . . . . . . . 5.3 7.4 7.2 6.6 5.0 5.2 4.1 3.9 2.9 2.8

Total income 4 . . . . . . . . . . . . . . . . . . . . 24.4 32.7 34.4 34.6 34.8 35.8 34.6 36.0 34.7 34.6Income deductions 5 . . . . . . . . . . . . . . . . 9.4 14.0 14.0 15.6 18.8 18.5 17.7 19.1 16.3 16.7Net income . . . . . . . . . . . . . . . . . . . . . . 15.0 18.7 20.4 19.0 16.0 17.3 16.9 16.9 18.4 17.9

1 Composed of Common Stock Issued and Preferred Stock Issued. 2 Composed of Capital Stock Subscribed, Liability andPremium and Other Paid-in Capital. 3 Composed of Total Deferred Credits lessAccumulated Deferred Income Taxes as DeferredCredits. 4 Composed of Net Utility Operating Income plus Total Other Income. 5 Composed of the difference between TotalIncome less Net Income.

Source: U.S. Energy Information Administration, 1982, Financial Statistics of Selected Electric Utilities, annual; thereafter,Financial Statistics of Major U.S. Investor-Owned Electric Utilities, annual.

Electric Utilities 605

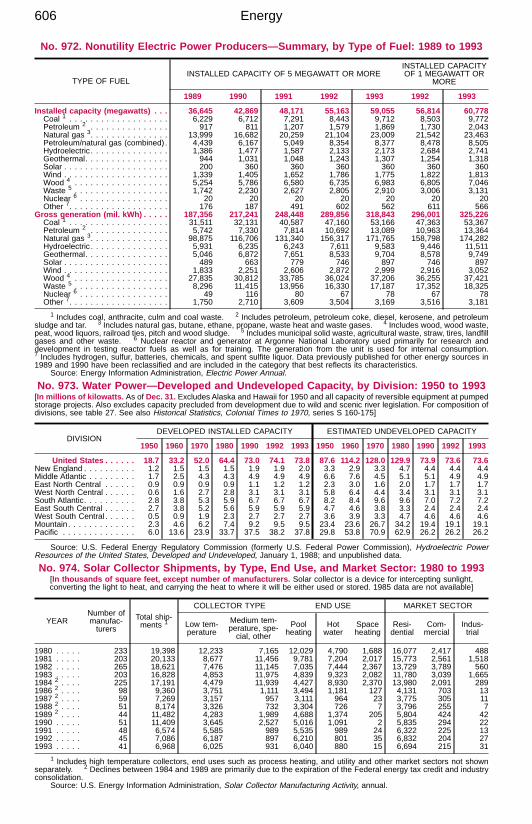
No. 972. Nonutility Electric Power Producers—Summary, by Type of Fuel: 1989 to 1993

TYPE OF FUELINSTALLED CAPACITY OF 5 MEGAWATT OR MORE

INSTALLED CAPACITYOF 1 MEGAWATT OR

MORE

1989 1990 1991 1992 1993 1992 1993

Installed capacity (megawatts) . . . 36,645 42,869 48,171 55,163 59,055 56,814 60,778Coal 1 . . . . . . . . . . . . . . . . . . . 6,229 6,712 7,291 8,443 9,712 8,503 9,772Petroleum 2 . . . . . . . . . . . . . . . 917 811 1,207 1,579 1,869 1,730 2,043Natural gas 3. . . . . . . . . . . . . . . 13,999 16,682 20,259 21,104 23,009 21,542 23,463Petroleum/natural gas (combined) . 4,439 6,167 5,049 8,354 8,377 8,478 8,505Hydroelectric . . . . . . . . . . . . . . . 1,386 1,477 1,587 2,133 2,173 2,684 2,741Geothermal. . . . . . . . . . . . . . . . 944 1,031 1,048 1,243 1,307 1,254 1,318Solar . . . . . . . . . . . . . . . . . . . . 200 360 360 360 360 360 360Wind . . . . . . . . . . . . . . . . . . . . 1,339 1,405 1,652 1,786 1,775 1,822 1,813Wood 4 . . . . . . . . . . . . . . . . . . 5,254 5,786 6,580 6,735 6,983 6,805 7,046Waste 5 . . . . . . . . . . . . . . . . . . 1,742 2,230 2,627 2,805 2,910 3,006 3,131Nuclear 6 . . . . . . . . . . . . . . . . . 20 20 20 20 20 20 20Other 7. . . . . . . . . . . . . . . . . . . 176 187 491 602 562 611 566

Gross generation (mil. kWh) . . . . . 187,356 217,241 248,448 289,856 318,843 296,001 325,226Coal 1 . . . . . . . . . . . . . . . . . . . 31,511 32,131 40,587 47,160 53,166 47,363 53,367Petroleum 2 . . . . . . . . . . . . . . . 5,742 7,330 7,814 10,692 13,089 10,963 13,364Natural gas 3. . . . . . . . . . . . . . . 98,875 116,706 131,340 156,317 171,765 158,798 174,282Hydroelectric . . . . . . . . . . . . . . . 5,931 6,235 6,243 7,611 9,583 9,446 11,511Geothermal. . . . . . . . . . . . . . . . 5,046 6,872 7,651 8,533 9,704 8,578 9,749Solar . . . . . . . . . . . . . . . . . . . . 489 663 779 746 897 746 897Wind . . . . . . . . . . . . . . . . . . . . 1,833 2,251 2,606 2,872 2,999 2,916 3,052Wood 4 . . . . . . . . . . . . . . . . . . 27,835 30,812 33,785 36,024 37,206 36,255 37,421Waste 5 . . . . . . . . . . . . . . . . . . 8,296 11,415 13,956 16,330 17,187 17,352 18,325Nuclear 6 . . . . . . . . . . . . . . . . . 49 116 80 67 78 67 78Other 7. . . . . . . . . . . . . . . . . . . 1,750 2,710 3,609 3,504 3,169 3,516 3,181

1 Includes coal, anthracite, culm and coal waste. 2 Includes petroleum, petroleum coke, diesel, kerosene, and petroleumsludge and tar. 3 Includes natural gas, butane, ethane, propane, waste heat and waste gases. 4 Includes wood, wood waste,peat, wood liquors, railroad ties, pitch and wood sludge. 5 Includes municipal solid waste, agricultural waste, straw, tires, landfillgases and other waste. 6 Nuclear reactor and generator at Argonne National Laboratory used primarily for research anddevelopment in testing reactor fuels as well as for training. The generation from the unit is used for internal consumption.7 Includes hydrogen, sulfur, batteries, chemicals, and spent sulfite liquor. Data previously published for other energy sources in1989 and 1990 have been reclassified and are included in the category that best reflects its characteristics.

Source: Energy Information Administration, Electric Power Annual.

No. 973. Water Power—Developed and Undeveloped Capacity, by Division: 1950 to 1993[In millions of kilowatts. As of Dec. 31. Excludes Alaska and Hawaii for 1950 and all capacity of reversible equipment at pumpedstorage projects. Also excludes capacity precluded from development due to wild and scenic river legislation. For composition ofdivisions, see table 27. See also Historical Statistics, Colonial Times to 1970, series S 160-175]

DIVISIONDEVELOPED INSTALLED CAPACITY ESTIMATED UNDEVELOPED CAPACITY

1950 1960 1970 1980 1990 1992 1993 1950 1960 1970 1980 1990 1992 1993

United States . . . . . . 18.7 33.2 52.0 64.4 73.0 74.1 73.8 87.6 114.2 128.0 129.9 73.9 73.6 73.6New England . . . . . . . . . . 1.2 1.5 1.5 1.5 1.9 1.9 2.0 3.3 2.9 3.3 4.7 4.4 4.4 4.4Middle Atlantic . . . . . . . . . 1.7 2.5 4.3 4.3 4.9 4.9 4.9 6.6 7.6 4.5 5.1 5.1 4.9 4.9East North Central . . . . . . 0.9 0.9 0.9 0.9 1.1 1.2 1.2 2.3 3.0 1.6 2.0 1.7 1.7 1.7West North Central . . . . . . 0.6 1.6 2.7 2.8 3.1 3.1 3.1 5.8 6.4 4.4 3.4 3.1 3.1 3.1South Atlantic. . . . . . . . . . 2.8 3.8 5.3 5.9 6.7 6.7 6.7 8.2 8.4 9.6 9.6 7.0 7.2 7.2East South Central . . . . . . 2.7 3.8 5.2 5.6 5.9 5.9 5.9 4.7 4.6 3.8 3.3 2.4 2.4 2.4West South Central . . . . . . 0.5 0.9 1.9 2.3 2.7 2.7 2.7 3.6 3.9 3.3 4.7 4.6 4.6 4.6Mountain. . . . . . . . . . . . . 2.3 4.6 6.2 7.4 9.2 9.5 9.5 23.4 23.6 26.7 34.2 19.4 19.1 19.1Pacific . . . . . . . . . . . . . . 6.0 13.6 23.9 33.7 37.5 38.2 37.8 29.8 53.8 70.9 62.9 26.2 26.2 26.2

Source: U.S. Federal Energy Regulatory Commission (formerly U.S. Federal Power Commission), Hydroelectric PowerResources of the United States, Developed and Undeveloped, January 1, 1988; and unpublished data.

No. 974. Solar Collector Shipments, by Type, End Use, and Market Sector: 1980 to 1993[In thousands of square feet, except number of manufacturers. Solar collector is a device for intercepting sunlight,converting the light to heat, and carrying the heat to where it will be either used or stored. 1985 data are not available]

YEARNumber ofmanufac-turers

Total ship-ments 1

COLLECTOR TYPE END USE MARKET SECTOR

Low tem-perature

Medium tem-perature, spe-cial, other

Poolheating

Hotwater

Spaceheating

Resi-dential

Com-mercial

Indus-trial

1980 . . . . . 233 19,398 12,233 7,165 12,029 4,790 1,688 16,077 2,417 4881981 . . . . . 203 20,133 8,677 11,456 9,781 7,204 2,017 15,773 2,561 1,5181982 . . . . . 265 18,621 7,476 11,145 7,035 7,444 2,367 13,729 3,789 5601983 . . . . . 203 16,828 4,853 11,975 4,839 9,323 2,082 11,780 3,039 1,6651984 2 . . . . 225 17,191 4,479 11,939 4,427 8,930 2,370 13,980 2,091 2891986 2 . . . . 98 9,360 3,751 1,111 3,494 1,181 127 4,131 703 131987 2 . . . . 59 7,269 3,157 957 3,111 964 23 3,775 305 111988 2 . . . . 51 8,174 3,326 732 3,304 726 7 3,796 255 71989 2 . . . . 44 11,482 4,283 1,989 4,688 1,374 205 5,804 424 421990 . . . . . 51 11,409 3,645 2,527 5,016 1,091 2 5,835 294 221991 . . . . . 48 6,574 5,585 989 5,535 989 24 6,322 225 131992 . . . . . 45 7,086 6,187 897 6,210 801 35 6,832 204 271993 . . . . . 41 6,968 6,025 931 6,040 880 15 6,694 215 31

1 Includes high temperature collectors, end uses such as process heating, and utility and other market sectors not shownseparately. 2 Declines between 1984 and 1989 are primarily due to the expiration of the Federal energy tax credit and industryconsolidation.

Source: U.S. Energy Information Administration, Solar Collector Manufacturing Activity, annual.

Energy606

No. 975. Renewable Energy Consumption Estimates, by Type: 1990 to 1992

[Renewable energy is obtained from sources that are essentially inexhaustible unlike fossil fuels of which thereis a finite supply]

SOURCE AND SECTORQUANTITY

(quadrillion Btu) PERCENT CHANGE

1990 1991 1992 1990-91 1991-92

SOURCES

Total . . . . . . . . . . . . . . . . . . . . . . 6.01 6.20 6.04 3.2 -2.6

Consumption for electricity . . . . . . . . . . . . 3.77 4.01 3.77 6.4 -6.0

Electric utilities . . . . . . . . . . . . . . . . . . 3.13 3.09 2.70 -1.3 -12.6Hydroelectric power . . . . . . . . . . . . . 2.93 2.90 2.51 -1.0 -13.4Geothermal energy . . . . . . . . . . . . . 0.18 0.17 0.17 -5.6 0.0Biofuels 1 . . . . . . . . . . . . . . . . . . . . 0.02 0.02 0.02 0.0 0.0Wind energy 2. . . . . . . . . . . . . . . . . (Z) (Z) (Z) (X) (X)

Nonutility power generators. . . . . . . . . . 0.62 0.69 0.78 11.3 13.0Hydroelectric power . . . . . . . . . . . . . 0.08 0.08 0.10 1.2 19.0Geothermal, solar, and wind energy . . 0.10 0.11 0.13 10.0 18.2Biofuels 1 . . . . . . . . . . . . . . . . . . . . 0.44 0.49 0.55 13.0 11.3

Net imported electricity. . . . . . . . . . . . . 0.02 0.23 0.29 1,050.0 26.1

Consumption for other uses 3 . . . . . . . . . . 2.23 2.19 2.27 -1.8 3.7

Biofuels 1 . . . . . . . . . . . . . . . . . . . . . 2.17 2.13 2.21 -1.8 3.8Solar and photovoltaic energy . . . . . . . . 0.06 0.06 0.06 0.0 0.0

SECTORS

Total . . . . . . . . . . . . . . . . . . . . . . 6.01 6.20 6.04 3.2 -2.6

Residential and commercial . . . . . . . . . . . 0.64 0.67 0.71 4.7 6.0Industrial. . . . . . . . . . . . . . . . . . . . . . . . 2.13 2.14 2.26 0.5 5.6Transportation . . . . . . . . . . . . . . . . . . . . 0.08 0.07 0.08 -12.5 14.3Electric utilities. . . . . . . . . . . . . . . . . . . . 3.15 3.32 3.00 5.4 -9.6

Z Less than 0.005 quadrillion Btu. X Not applicable. 1 Biofuels are fuelwood, wood byproducts, waste wood, municipalsolid waste, manufacturing process waste, and alcohol fuels. 2 Also includes photovoltaic and solar thermal energy. 3 Includedare nonutility thermal energy uses, such as space heating and industrial process heat production. Excluded are estimates formechanical energy, such as shaft power from dams, wind machines, and solar-powered motors and activators.

Source: U.S. Energy Information Administration, Annual Energy Review.

No. 976. Privately Owned Gas Utility Industry—Balance Sheet and IncomeAccount: 1980 to 1993

[In millions of dollars. The gas utility industry consists of pipeline and distribution companies. Excludes operations ofcompanies distributing gas in bottles or tanks. See also Historical Statistics, Colonial Times to 1970, series S 205-218]

ITEM 1980 1985 1987 1988 1989 1990 1991 1992 1993

COMPOSITE BALANCE SHEET

Assets, total 1 . . . . . . . . . . 75,851 104,478 109,390 121,667 123,820 121,686 124,120 129,400 131,508Total utility plant . . . . . . . . . . . . . 67,071 88,121 93,540 99,933 106,017 112,863 119,772 129,272 131,377Depreciation and amortization. . . . 26,162 36,377 41,162 44,423 47,054 49,483 52,400 57,005 58,738

Utility plant (net). . . . . . . . . . . . . 40,909 51,744 52,378 55,510 58,963 63,380 67,372 72,267 72,640Investment and fund accounts 1 . . 15,530 23,871 25,660 31,552 28,111 23,872 22,883 21,883 23,218Current and accrued assets . . . . . 17,243 24,771 21,025 23,402 24,836 23,268 23,023 23,783 20,560Deferred debits 2 . . . . . . . . . . . . 2,169 4,092 8,633 9,658 10,364 9,576 9,277 9,776 13,142

Liabilities, total 1 . . . . . . . . 75,851 104,478 109,390 121,667 123,820 121,686 124,120 129,400 131,508Capitalization, total 1 . . . . . . . . . . 51,382 65,799 66,312 69,875 74,753 74,958 75,463 81,183 80,000Capital stock 1 . . . . . . . . . . . . 29,315 39,517 38,212 39,898 43,889 43,810 43,435 46,318 47,547Long-term debts . . . . . . . . . . . 22,067 26,282 28,100 29,977 30,864 31,148 32,028 34,865 32,441

Current and accrued liabilities. . . . 18,119 26,125 26,664 33,735 31,005 29,550 28,128 26,438 26,127Deferred income taxes 3 . . . . . . . 4,149 7,769 9,901 10,685 11,292 11,360 10,527 10,952 12,889Other liabilities and credits . . . . . . 2,201 4,785 6,513 7,372 6,770 5,818 10,002 10,827 12,494

COMPOSITE INCOME ACCOUNT

Operating revenues, total . . 85,918 103,945 69,566 69,754 70,363 66,027 63,922 66,405 70,420Operating expenses 4 . . . . . . . . . 81,789 98,320 64,409 64,696 64,262 60,137 59,165 60,042 63,326Operation and maintenance . . . 74,508 88,572 56,054 57,032 55,990 51,627 50,867 48,054 50,752Federal, State, and local taxes . 4,847 6,590 5,179 4,241 4,843 4,957 4,446 6,031 6,221

Operating income. . . . . . . . . . . . 4,129 5,625 5,157 5,058 6,101 5,890 4,756 6,363 7,094

Utility operating income . . . . . . . . 4,471 6,030 5,452 5,202 6,274 6,077 4,962 6,562 7,292Income before interest charges 1. . 6,929 7,636 6,845 7,472 8,764 8,081 5,530 7,223 8,850Net income 1 . . . . . . . . . . . . . . . 4,194 3,785 2,971 3,352 4,641 4,410 1,894 3,750 5,610Dividends . . . . . . . . . . . . . . . . . 2,564 4,060 3,453 3,151 3,113 3,191 4,341 3,889 3,241

1 Beginning 1980, not comparable with earlier years due to Federal Power Commission ruling requiring adoption of the equitymethod in reporting earnings of subsidiaries. 2 Includes capital stock discount and expense and reacquired securities.3 Includes reserves for deferred income taxes. 4 Includes expenses not shown separately.

Source: American Gas Association, Arlington, VA, Gas Facts, annual, (copyright).

Energy Consumption—Privately Owned Gas Utility Industry 607


Recommended