Page 1
7/27/2019 592_renew_energy_europe__jm_7.pdf
http://slidepdf.com/reader/full/592renewenergyeuropejm7pdf 1/36
The renewable energy contribution from
waste across Europe.
Jan Manders
Deputy President CEWEP
3rd December 2009
ISWA Dakofa Conference
1
Page 2
7/27/2019 592_renew_energy_europe__jm_7.pdf
http://slidepdf.com/reader/full/592renewenergyeuropejm7pdf 2/36
CEWEPConfederation of European Waste-to-Energy Plants
CEWEP represents 380 of the 420
Waste-to-Energy plants across Europe.
They thermally treat household andcomparable waste, which is not other-
wise reused or recycled, and
generate energy from it.
In 2007 across Europe they supply:
electricity for 5 million households
and heat for 4 million households.2
Page 3
7/27/2019 592_renew_energy_europe__jm_7.pdf
http://slidepdf.com/reader/full/592renewenergyeuropejm7pdf 3/36
Objectives of the Study
Demonstrate amount of Renewable Energy generated
by various Waste Processing Routes across Europe
(present and future potential)
Indicate contribution of Energy from Waste routes to
the achievement of the EU Binding Renewable Energy
Targets 2020 in the Renewable Energy Directive
3
Page 4
7/27/2019 592_renew_energy_europe__jm_7.pdf
http://slidepdf.com/reader/full/592renewenergyeuropejm7pdf 4/36
Treatment of MSW in Europe EU27, 250 m tpa
A large part of the
EU27 waste is still
wasted by putting it
on landfills !
But waste is a
precious resource
which should beutilised for raw
materials and
ENERGY !
Thermal
Treatment
19%Recycling
(Incl. BiologicalTreatment)
40%
Landfilling
41%
Treatment of Municipal Solid Waste in the EU 27 in 2006
Source: EUROSTAT 4
Page 5
7/27/2019 592_renew_energy_europe__jm_7.pdf
http://slidepdf.com/reader/full/592renewenergyeuropejm7pdf 5/36
Why Renewable Energy from Waste
deserves the attention?
• RE from waste is a much cheaper source of RE than
from most other RE sources (solar, wind, biomass)
• It is readily available from professional waste
processing, although in volume it has its limitations
• It already makes a significant contribution to the
Renewable Energy performance of various countries
• RE from waste contributes to achieving the 2020 RE
binding targets across Europe
• It is a major factor in avoided CO2 emissions due to
professional waste processing
5
Page 6
7/27/2019 592_renew_energy_europe__jm_7.pdf
http://slidepdf.com/reader/full/592renewenergyeuropejm7pdf 6/36
EU 27 have ambitious targets for Renewable Energy
overall 20 % of consumption by 2020
6
0
5
10
15
20
25
30
35
40
45
50
SE LV FI AT PT EE RO DK SL LT FR BG ES PL GR SK CZ DE IT HU IE CY NL BE GB LU MT EU27
Binding targets 2020 and actual 2005 Renewable Energy as % of totalconsumption EU 27
2020 Target
2005 Level
The gap to close is about 1500 TWh of Renewable Energy(at a flat – zero growth - EU energy consumption level of 13700 TWh)
Page 7
7/27/2019 592_renew_energy_europe__jm_7.pdf
http://slidepdf.com/reader/full/592renewenergyeuropejm7pdf 7/36
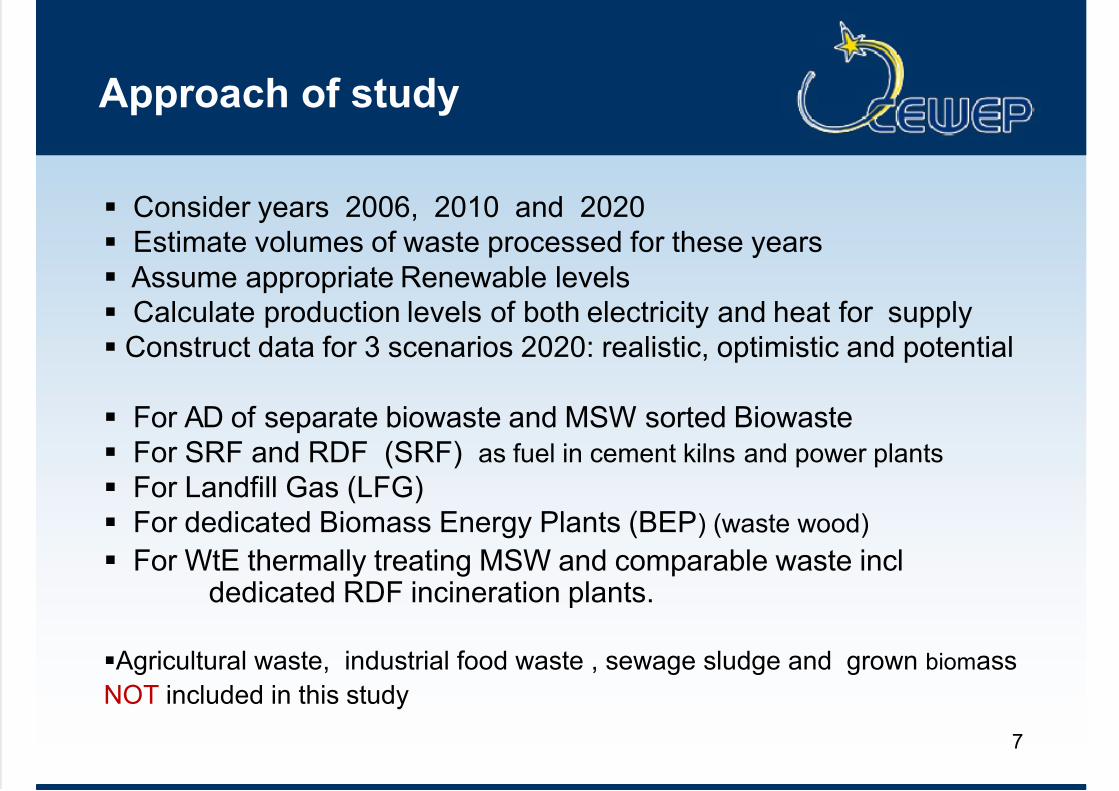
Approach of study
Consider years 2006, 2010 and 2020
Estimate volumes of waste processed for these years
Assume appropriate Renewable levels
Calculate production levels of both electricity and heat for supply
Construct data for 3 scenarios 2020: realistic, optimistic and potential
For AD of separate biowaste and MSW sorted Biowaste
For SRF and RDF (SRF) as fuel in cement kilns and power plants
For Landfill Gas (LFG)
For dedicated Biomass Energy Plants (BEP) (waste wood)
For WtE thermally treating MSW and comparable waste incldedicated RDF incineration plants.
Agricultural waste, industrial food waste , sewage sludge and grown biomass
NOT included in this study
7
Page 8
7/27/2019 592_renew_energy_europe__jm_7.pdf
http://slidepdf.com/reader/full/592renewenergyeuropejm7pdf 8/36
Recognition of energy from MSW and
comparable waste as Renewable Energy
Route Source of waste Abbr. Form of energy
% of Energy as
Renewable
Incineration with Energy
Recovery
Mixed residual
waste
WtE Steam ->
Electr. & Heat
Av 50
Range 47-80
Landfill Gas MSW or Mixed
residual waste
LFG Biogas ->
Electr. (and
Heat)
100
Solid Recovered Fuel Sorted fraction from
MSW and CDW
SRF Substituted
Fuel in cement
kilns, Power pl
Av 45
Range
30 -55 Anaerobic Digestion Source separated
biomass fraction or
Sorted bio-fraction
of MSW
AD Biogas ->
Electr. & Heat 100
Biomass Energy Plants
incineration,gasification
Collected & sorted
waste wood
BEP Steam ->
Electr. & Heat
95 - 100
8
Page 9
7/27/2019 592_renew_energy_europe__jm_7.pdf
http://slidepdf.com/reader/full/592renewenergyeuropejm7pdf 9/36
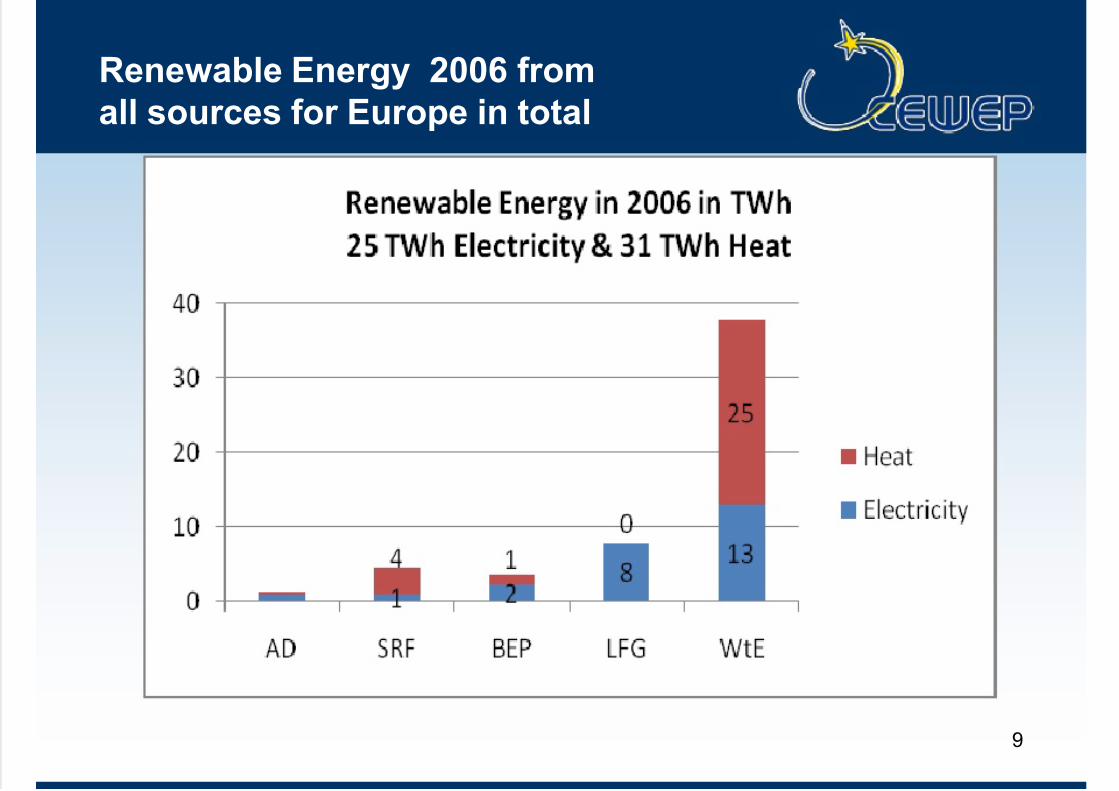
Renewable Energy 2006 from
all sources for Europe in total
9
Page 10
7/27/2019 592_renew_energy_europe__jm_7.pdf
http://slidepdf.com/reader/full/592renewenergyeuropejm7pdf 10/36
Growth in Renewable Electricity from
all sources for Europe in total
10
Page 11
7/27/2019 592_renew_energy_europe__jm_7.pdf
http://slidepdf.com/reader/full/592renewenergyeuropejm7pdf 11/36
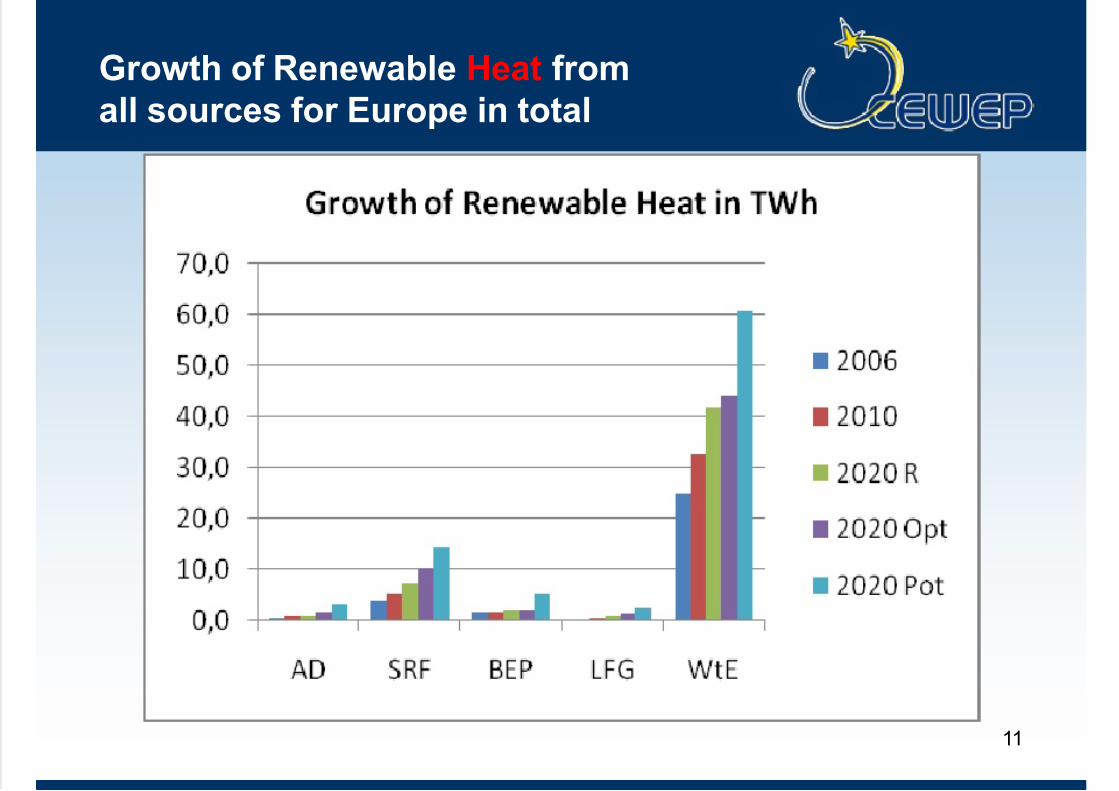
Growth of Renewable Heat from
all sources for Europe in total
11
Page 12
7/27/2019 592_renew_energy_europe__jm_7.pdf
http://slidepdf.com/reader/full/592renewenergyeuropejm7pdf 12/36
Anaerobic Digestion
underlying assumptions
units 2006 2010 2020Real 2020 Pot
Volume of
biowaste
kt 3900 5200 8000 10000
Renewable
Electr Prod
TWh 0,78 1,04 1,6 2
Renewable
Heat
applied
TWh 0,5 0,6 0,8 1,2
Assumptions:
Split in biowaste of 50 % source separated and 50 % from sorted MSW
Generated Electricity is 200 kWh/ tonne biowaste
Additionally heat can be applied as low T heat e.g. in greenhouses;
potentially up to 150 kWh/t waste, but outlet is often not available.
Currently applications in ES, DE, AT, BE, DK, IT, NL, CH; sometimes in
co-digestion with other biomass from agriculture.
Major interest developing in UK 12
Page 13
7/27/2019 592_renew_energy_europe__jm_7.pdf
http://slidepdf.com/reader/full/592renewenergyeuropejm7pdf 13/36
Renewable Energy projection from AD
across Europe
13
Page 14
7/27/2019 592_renew_energy_europe__jm_7.pdf
http://slidepdf.com/reader/full/592renewenergyeuropejm7pdf 14/36
• Material originating from sorting of Commercial & MSW
• SRF/RDF supposed to be 45 % biogenic (ERFO)
• Major outlets for SRF/RDF are
Cement kilns (heat)
Power plants (electricity)
Dedicated incineration plants (CHP) = WtE plant(data included in WtE overview)
Renewable Energy from SRF/ RDF
14
Volume kt 2006 2010 2020 R 2020 Opt 2020 Pot
Cement
kilns
1800 2500 3500 5000 7000
Power
Plants
1150 1500 3000 6500 13000
D e d i c a t e d
W t E P l an t s
1000 7000 10000 12000 15000
This volume is included in WtE section
Page 15
7/27/2019 592_renew_energy_europe__jm_7.pdf
http://slidepdf.com/reader/full/592renewenergyeuropejm7pdf 15/36
Renewable Energy projection from SFR(in cement kilns and power plants)
15
Page 16
7/27/2019 592_renew_energy_europe__jm_7.pdf
http://slidepdf.com/reader/full/592renewenergyeuropejm7pdf 16/36
Exploitation of LFG for Energy Recovery
has grown fast but is now leveling off.
85 % is coming from the UK, IT, FR and DE
16
Page 17
7/27/2019 592_renew_energy_europe__jm_7.pdf
http://slidepdf.com/reader/full/592renewenergyeuropejm7pdf 17/36
Utilisation of LFG in the UK has been dominated
by electricity and has been driven by support schemes
17
Page 18
7/27/2019 592_renew_energy_europe__jm_7.pdf
http://slidepdf.com/reader/full/592renewenergyeuropejm7pdf 18/36
Electricity from LFG in UK is
now levelling off at 4.8 TWh
18
Page 19
7/27/2019 592_renew_energy_europe__jm_7.pdf
http://slidepdf.com/reader/full/592renewenergyeuropejm7pdf 19/36
In 2006 Electricity production from LFG was about 7 TWh
Projections 2020 potential based on country by country analysis
Energy from LFG in UK,IT, DE, FR, NL and similar countries will
decline (reduction of waste being landfilled and exhaustion of existing landfill recovery operations)
New Member States will focus on meeting Landfill Directive but
reluctant to make investment for LFG conversion to electricity.
Various obstacles will contribute to modest growth of LFG
conversion in current “Landfill countries”:
lack of funding for additional conversion investment
Lacking grid capacity to transport generated power
Remote location does hamper exploitation of heat potential
Assumptions on Energy from Landfill
Gas Recovery across Europe
19
Page 20
7/27/2019 592_renew_energy_europe__jm_7.pdf
http://slidepdf.com/reader/full/592renewenergyeuropejm7pdf 20/36
Electricity from LFG in Europe
not likely to grow.
20
Page 21
7/27/2019 592_renew_energy_europe__jm_7.pdf
http://slidepdf.com/reader/full/592renewenergyeuropejm7pdf 21/36
Dedicated Biomass Energy plants (BEP)(incineration of waste wood)
Now mainly restricted to DE, NL, SE, CH, BE
Only viable when heavily subsidised
Data difficult to verify.
Limited growth potential
2008 estimate k tonnes Electricity TWh Heat TWh
Germany 1,2 1,2 -
NL 0,5 0,56 -
Sweden 0,38 1,48
Others
21
Page 22
7/27/2019 592_renew_energy_europe__jm_7.pdf
http://slidepdf.com/reader/full/592renewenergyeuropejm7pdf 22/36
WtE: Waste Incineration with
Energy Recovery
22
Page 23
7/27/2019 592_renew_energy_europe__jm_7.pdf
http://slidepdf.com/reader/full/592renewenergyeuropejm7pdf 23/36
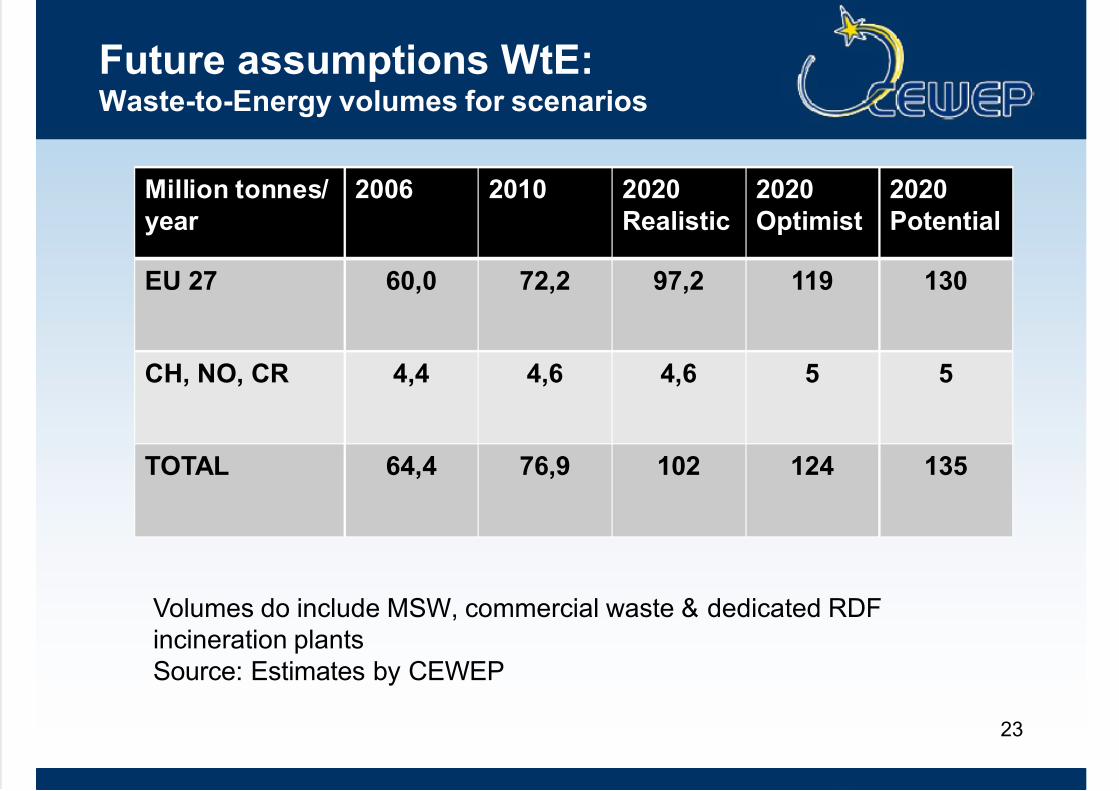
Future assumptions WtE:Waste-to-Energy volumes for scenarios
Million tonnes/
year
2006 2010 2020
Realistic
2020
Optimist
2020
Potential
EU 27 60,0 72,2 97,2 119 130
CH, NO, CR 4,4 4,6 4,6 5 5
TOTAL 64,4 76,9 102 124 135
23
Volumes do include MSW, commercial waste & dedicated RDF
incineration plants
Source: Estimates by CEWEP
Page 24
7/27/2019 592_renew_energy_europe__jm_7.pdf
http://slidepdf.com/reader/full/592renewenergyeuropejm7pdf 24/36
WtE Energy output assumptions
Average energy output data per tonne of waste treated
(for portfolio of existing and new plants)
Total energy output (renewable & fossil)
2006 2010 2020
Realistic
2020
Optimistic
2020
Potential
Electricity
production
kWh/t
waste
400 450 500 520 550
Heatsupply
kWh/t
waste
760 850 820 740
Expansion
with
Electricity
only plants
900
Exploitation
of heat
potential
24
Page 25
7/27/2019 592_renew_energy_europe__jm_7.pdf
http://slidepdf.com/reader/full/592renewenergyeuropejm7pdf 25/36
The Total Energy Output
projection for WtE
25Includes both renewable and fossil components.
Page 26
7/27/2019 592_renew_energy_europe__jm_7.pdf
http://slidepdf.com/reader/full/592renewenergyeuropejm7pdf 26/36
Growth of Renewable Energy from WtE
for the total of Europe
26
Page 27
7/27/2019 592_renew_energy_europe__jm_7.pdf
http://slidepdf.com/reader/full/592renewenergyeuropejm7pdf 27/36
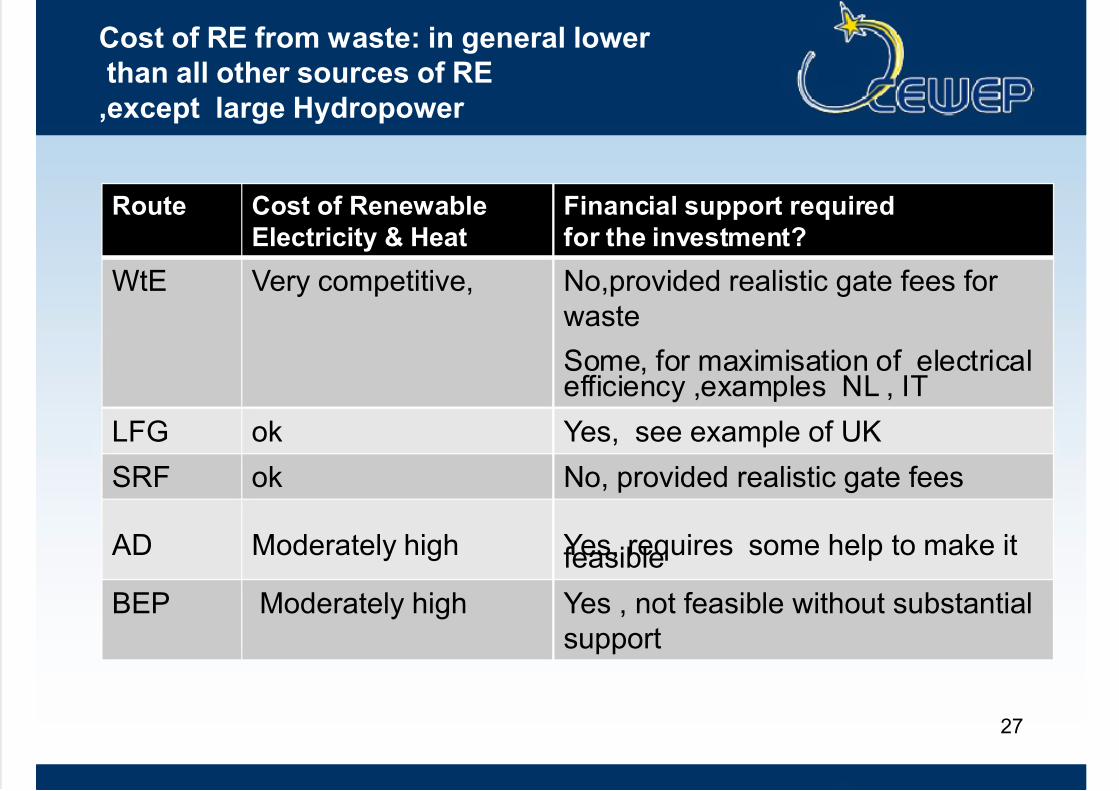
Cost of RE from waste: in general lower
than all other sources of RE
,except large Hydropower
Route Cost of Renewable
Electricity & Heat
Financial support required
for the investment?
WtE Very competitive, No,provided realistic gate fees for
waste
Some, for maximisation of electricalefficiency ,examples NL , IT
LFG ok Yes, see example of UK
SRF ok No, provided realistic gate fees
AD Moderately high Yes, requires some help to make itfeasible
BEP Moderately high Yes , not feasible without substantial
support
27
Page 28
7/27/2019 592_renew_energy_europe__jm_7.pdf
http://slidepdf.com/reader/full/592renewenergyeuropejm7pdf 28/36
RE from waste is by far the cheapest
form of Renewable Electricity !
28
Source: EREF report 2009;
* * Price level for WtE € 45 -65 €/ MWh. Only few % of WtE Electricity gets some Renew Subsidy
* For LFG avg Feed in Tariff in EU: 71 € (incl minor subsidy)
***
Page 29
7/27/2019 592_renew_energy_europe__jm_7.pdf
http://slidepdf.com/reader/full/592renewenergyeuropejm7pdf 29/36
The Avoided CO2 Emissions due to
Energy Production from Waste are huge
29Please note that these data exclude fossil emissions and therefore do notrepresent a full carbon footprint analysis for the various routes !
Page 30
7/27/2019 592_renew_energy_europe__jm_7.pdf
http://slidepdf.com/reader/full/592renewenergyeuropejm7pdf 30/36
How much does Energy from Waste
contribute to the EU 27 binding targets?
30
2006 2020 Comments
Total EU 27
Energy
consumption
13700 TWh 13700 TWh
If no growth in
consumption !
Total EU 27
Renewable
Energy
1258 TWh
(8,5 %)
2735 TWh
Target 20 %:
The gap is
about 1500 TWh
Renewable
contribution from
Waste EU 27
55 TWh
Between
90 – 151 TWh
Waste can
potentiallly fill 95
from the gap of 1500 TWh
Share Energy
from Waste of
Total RE
4,4 %
Between
3,3 and 5,5 %
assuming Binding
EU Targets are
achieved !
Page 31
7/27/2019 592_renew_energy_europe__jm_7.pdf
http://slidepdf.com/reader/full/592renewenergyeuropejm7pdf 31/36
In 2006 Renewable Energy from Waste origin amounts toabout 24 TWh of electricity and 31 TWh of heat. This
represents 4,4 % of all RE produced in Europe
This is likely to grow to 38 TWh and 52 TWh respectively
by 2020, but has the potential to grow to 66 and 85TWh.
Energy from Waste has the potential to fill 95 from the
EU 27 RE gap of 1500 TWh !
Energy from Waste also has a significant contribution to
make in avoiding CO2 emissions.
Of the various sources WtE is by far the largest and has
the most substantial growth potential, followed by SRF
Overall Conclusions Energy from Waste
31
Page 32
7/27/2019 592_renew_energy_europe__jm_7.pdf
http://slidepdf.com/reader/full/592renewenergyeuropejm7pdf 32/36
Conclusions WtE
In 2006 Waste to Energy supplies a considerable amount
of Renewable Energy: 38 TWh for the whole of Europe
This will grow towards 2020 to a level of at least 66 TWh,
and potentially to 98 TWh, through an increase of theamount of waste processed via WtE and by steady
efficiency improvements (heat & electrical efficiency)
Countries which continue to make a significant contribution
through WtE to their total Renewable Energy productionare: NL, BE, DK, DE, SE
Note that the total Energy output of WtE and SRF is twice the
amount regarded as renewable !
32
Page 33
7/27/2019 592_renew_energy_europe__jm_7.pdf
http://slidepdf.com/reader/full/592renewenergyeuropejm7pdf 33/36
Why should generation of RE from MSW and
comparable waste get priority across Europe ?
• It is a sustainable biomass source of RE, e.g. not
competing with the food chain, although of limited
supply.
• With the implementation of smart professional Waste
Management Policies it will become available as“low hanging fruit” at relatively low cost
• If we want to even get near to achieving the EU 27
binding targets, we cannot afford “to waste” this
readily available source !• It is a substantial contributor to avoiding CO2 emissions
33
Page 34
7/27/2019 592_renew_energy_europe__jm_7.pdf
http://slidepdf.com/reader/full/592renewenergyeuropejm7pdf 34/36
Recommendations for maximisation of
Renewable Energy from Waste across Europe?
EU Policy Level
• Promote classification as Renewable by all MS
• Promote that MS set up support schemes
•Speed up R1 status of WtE plants across Europe
National Level
• Attitude to learn from successful examples elsewhere
e.g. SE, DK, DE , NL, Flanders, UK (LFG)
• Make RE from Waste a key element in National WasteMgt Plans, in particular for new Member States
• Set up (modest) support schemes for RE from waste to
overcome the hurdles
34
Page 35
7/27/2019 592_renew_energy_europe__jm_7.pdf
http://slidepdf.com/reader/full/592renewenergyeuropejm7pdf 35/36
Thank you for your attention !
CEWEP
Confederation of European
Waste-to-Energy Plants
Office in Brussels:
Boulevard Clovis 12AB-1000 Brussels
BELGIUM
Tel.: +32 (0)2 770 63 11
Fax: +32 (0)2 770 68 14e-mail: [email protected]
www.cewep.eu
[email protected]
35
Page 36
7/27/2019 592_renew_energy_europe__jm_7.pdf
http://slidepdf.com/reader/full/592renewenergyeuropejm7pdf 36/36
Key assumptions for 2020 scenarios EU 27
36
2020 Realistic 2020 Optimistic 2020 Potential
MSW market Flat at 250 mt Growth to 280 mt
esp in new MS
Growth to 312 mt
As per ECT EEA
Landfill diversion of
MSW in EU 27
30 kt landfill left
(12 %) in new MS
Zero landfill
60 % Rec/ 40 % WtE
& MBT
Zero landfill
60 % Rec/ 40 % WtE
& MBT
Commercial Waste
Market
decrease vs 2006 Flat Flat
Waste & Energy
Management
Policies
Promotion of EfW
as key waste
treatment routes inall Member States
Priority for EfW
implemented in
National Policies
Urgency: Max. RE
generation from
waste is mademandatory
Support schemes
for Renewable
Energy
Investment support
for Renewable
Energy from waste,
esp in new M.S.
implemented
Generation of high
efficiency RE from
waste is financially
supported
Application of heat
from WtE key priority
and infrastructure
supported