100 Movement of People People Mobility Hampered by the Pandemic and Virus Containment Measures 5 Migration The number of Asian migrants stood at 90.3 million in 2019 out of 271.6 million migrants worldwide. The coronavirus disease pandemic afected their lives via health, socioeconomic, and protection crises. 30 In 2019, the stock of international migrants worldwide reached 271.6 million, up 9.2% from 2015 (Figure 5.1). 31 International migrants accounted for around 3.5% of the global population in 2019. The migrant stock continued to grow across all regions from 2015. 32 Global migrants from Asia grew 7.6% to 90.3 million in 2019 from 84.0 million in 2015. During the same period, growth was highest in the Middle East (16.8%) and Africa (12.5%). Asia remains the largest source of migrants—one in three migrants (33.3%) worldwide. India had the largest number of outward migrants in 2019 (17.5 million) and has been the top source of Asian outmigrants since 1995 30 Asia refers to the 49 members of the Asian Development Bank (ADB) within Asia and the Pacifc, which includes Japan and Oceania (Australia and New Zealand) in addition to the 46 developing Asian economies. 31 United Nations (UN) recommendations on statistics of international migration defne the “stock of international migrants present in a country” as “the set of persons who have ever changed their country of usual residence, that is to say, persons who have spent at least one year of their lives in a country other than the one in which they live at the time the data are gathered” (UN 1998). International migrant stock consists of persons crossing borders for various reasons—for employment, family reunifcation, study, and fight from confict and violence. Some involve the creation of new borders, generating large numbers of international migrants—as during the 1991 dissolution of the Soviet Union. 32 With the exit of the United Kingdom (UK) from the European Union on 31 January 2020, the UK’s immigration policy will shift from free movement to a points-based system which would reduce overall levels of migration and prioritize skills and talent: scientists, engineers, academics and other highly- skilled workers (Government of the United Kingdom 2020). In the United States (US), nonimmigrant admissions grew by 5.4% from 77.1 million in 2016 to 81.3 million in 2018, while those granted lawful permanent residence declined from 1.2 million in 2016 to 1.1 million in 2018 (Government of the US Department of Homeland Security. Immigration Data and Statistics). In 2020, the US Citizenship and Immigration Services (USCIS) raised its fees as one way to slow legal migration (Government of the US Department of Homeland Security. USCIS). Figure 5�1: International Migrant Stock and Share of Migrants from Asia 0 5 10 15 20 25 30 35 40 0 50 100 150 200 250 300 1990 1995 2000 2005 2010 2015 2019 million Asia to World (left) World to World (left) Asia’s share of total global migrants (right) % Note: Asia’s share of total global migrants is computed as (migrants from the region / total global migrants) x 100. Source: ADB calculations using data from United Nations. Department of Economic and Social Afairs, Population Division. International Migrant Stock: The 2019 Revision. https://www.un.org/en/development/desa/population/ migration/data/estimates2/estimates19.asp (accessed May 2020).
Transcript
100
Movement of PeoplePeople Mobility hampered by the Pandemic and Virus Containment Measures5
Migration
The number of Asian migrants stood at 90.3 million in 2019 out of 271.6 million migrants worldwide. The coronavirus disease pandemic affected their lives via health, socioeconomic, and protection crises.30
In 2019, the stock of international migrants worldwide
reached 271.6 million, up 9.2% from 2015 (Figure 5.1).31
International migrants accounted for around 3.5% of the
global population in 2019. The migrant stock continued
to grow across all regions from 2015.32 Global migrants
from Asia grew 7.6% to 90.3 million in 2019 from 84.0
million in 2015. During the same period, growth was
highest in the Middle East (16.8%) and Africa (12.5%).
Asia remains the largest source of migrants—one in
three migrants (33.3%) worldwide. India had the largest
number of outward migrants in 2019 (17.5 million) and
has been the top source of Asian outmigrants since 1995
30 Asia refers to the 49 members of the Asian Development Bank (ADB) within Asia and the Pacific, which includes Japan and Oceania (Australia and New Zealand) in addition to the 46 developing Asian economies.
31 United Nations (UN) recommendations on statistics of international migration define the “stock of international migrants present in a country” as “the set of persons who have ever changed their country of usual residence, that is to say, persons who have spent at least one year of their lives in a country other than the one in which they live at the time the data are gathered” (UN 1998). International migrant stock consists of persons crossing borders for various reasons—for employment, family reunification, study, and flight from conflict and violence. Some involve the creation of new borders, generating large numbers of international migrants—as during the 1991 dissolution of the Soviet Union.
32 With the exit of the United Kingdom (UK) from the European Union on 31 January 2020, the UK’s immigration policy will shift from free movement to a points-based system which would reduce overall levels of migration and prioritize skills and talent: scientists, engineers, academics and other highly-skilled workers (Government of the United Kingdom 2020). In the United States (US), nonimmigrant admissions grew by 5.4% from 77.1 million in 2016 to 81.3 million in 2018, while those granted lawful permanent residence declined from 1.2 million in 2016 to 1.1 million in 2018 (Government of the US Department of Homeland Security. Immigration Data and Statistics). In 2020, the US Citizenship and Immigration Services (USCIS) raised its fees as one way to slow legal migration (Government of the US Department of Homeland Security. USCIS).
Figure 5�1: international Migrant stock and share of Migrants from asia
0
5
10
15
20
25
30
35
40
0
50
100
150
200
250
300
1990 1995 2000 2005 2010 2015 2019
mill
ion
Asia to World (left) World to World (left)
Asia’s share of total global migrants (right)
%
Note: Asia’s share of total global migrants is computed as (migrants from the region / total global migrants) x 100.
Source: ADB calculations using data from United Nations. Department of Economic and Social Affairs, Population Division. International Migrant Stock: The 2019 Revision. https://www.un.org/en/development/desa/population/migration/data/estimates2/estimates19.asp (accessed May 2020).
Movement of People 101
(7.2 million). Other Asian countries with large diaspora
populations include the People’s Republic of China
(6.3 million), and the Philippines (5.4 million) (Figure 5.2).
Mobility Restrictions and Challenges in 2020
Border closures, travel restrictions, and quarantine measures imposed to mitigate the spread of the coronavirus significantly limited mobility and disproportionately impacted international migrants.
The coronavirus disease (COVID-19) pandemic
significantly affected people’s movement, halted many
industries, and disproportionately imposed huge costs on
migrants and their families. Restrictions on mobility and
travel to curtail COVID-19 infections disrupted economic
activity, created massive unemployment, and led to a
global economic crisis. As the number of confirmed cases
began to rise, many countries quickly imposed lockdowns,
the first in late January and becoming most stringent
in late March and April (Figure 5.3). Some measures
were gradually eased in late April and May but remained
restrictive relative to precrisis conditions as social
distancing and partial lockdowns continued. Mobility
restrictions were more stringent in the top 10 destination
countries for migrants—including the US, the Russian
Federation, and Middle East countries—where more than
60% of Asia’s migrants reside. It became challenging for
migrant workers to travel back home.
The pandemic and ensuing lockdowns put many migrant
jobs in jeopardy. The International Labour Organization
(ILO 2020b) reported that low-skilled migrants and
seasonal workers were likely to be laid off first, but
last to get tested or treated. They are often excluded
from government policy responses, such as wage
subsidies, unemployment benefits or social security, and
social protection measures. With limited or no social
protection, no savings, without adequate food and
shelter, and no financial means to return to their home
Figure 5�2: top 10 sources of Migrants, 2019—asia (million)
0 5 10 15 20
Viet Nam
Myanmar
Kazakhstan
Indonesia
Afghanistan
Philippines
Pakistan
Bangladesh
PRC
India
2019 2005 1990
PRC = People’s Republic of China.
Source: ADB calculations using data from United Nations. Department of Economic and Social Affairs, Population Division. International Migrant Stock: The 2019 Revision. https://www.un.org/en/development/desa/population/migration/data/estimates2/estimates19.asp (accessed May 2020).
Figure 5�3: Mobility Restrictions during the CoVid-19 Pandemic—2020 oxford government stringency index
0
10
20
30
40
50
60
70
80
90
1 Ja
n
17 J
an
2 F
eb
18 F
eb
5 M
ar
21
Mar
6 A
pr
22
Ap
r
8 M
ay
24
May
9 J
un
25
Ju
n
11 J
ul
27
Ju
l
12 A
ug
28
Au
g
13 S
ep
29
Sep
15 O
ct
31
Oct
Top 10 migrant host countries World Asia
COVID-19 = coronavirus disease.
Notes: The Oxford COVID-19 Government Response Stringency Index is a composite indicator, with a range of 0 to 100 (most restrictive), that captures policy decisions on (i) school closings, (ii) workplace closings, (iii) cancellation of public events, (iv) restrictions on gathering size, (v) public transport closures, (vi) home confinement orders, (vii) restrictions on internal movement, (viii) international travel controls, and (ix) public information on COVID-19. The top 10 migrant host countries for 2019 include the United States, Saudi Arabia, the Russian Federation, the United Arab Emirates, India, Australia, Thailand, Canada, Pakistan, and Malaysia.
Source: ADB calculations using data from Hale et al. (2020a).
asian Economic integration report 2021102
countries, thousands of migrants were stranded. Working
migrants sent home continue to face uncertainty over
their future employment prospects.
Thailand’s closure of 18 border points from 23 March
resulted in the sudden, unexpected outflow of migrant
workers from Cambodia, the Lao People’s Democratic
Republic (Lao PDR), and Myanmar traveling back to
their home countries and communities (Table 5.1).33
Nepal expects around 500,000 workers who lost their
jobs abroad to return home, mainly from the Middle
East and Malaysia, while Bangladesh has repatriated
about 400,000 of its migrants. India’s Vanda Bharat
mission flights have repatriated at least 1 million workers.
Between February and December 2020, at least
300,000 Filipino migrant workers have been repatriated.
Australia’s travel ban for noncitizens and nonresidents,
and the temporary suspension of its visa-exemption
facilities, put Indonesian migrant workers and working
professionals in limbo as they were either locked in or
out of Australia for indefinite periods.34 Indonesians
in the southern Philippines had to appeal for food
assistance from their government in Jakarta. Malaysia’s
movement control order barred its citizens from
traveling abroad—including 300,000 workers who
commute to Singapore daily.35 Migrants from Asia crucial
to the Middle East workforce were confronted with the
sudden loss of income and unemployment, particularly
low-skilled workers. In Qatar, migrant construction
workers were quarantined in overcrowded labor
dormitories, creating a higher risk of COVID-19 exposure
(Pattison and Sedhai 2020).
table 5�1: number of Return Migrants during the CoVid-19 Pandemic
Country of origin
Return Migrants
Repatriated Mainly from as ofnumber% outmigrant stock (2019)
Armenia 60,000 6.2 Russian Federation, Europe 30 June
Azerbaijan 20,000 1.7 Russian Federation 29 May
Bangladesh 408,408 5.2 Middle East 31 December
Cambodia 100,000 9.1 Thailand 06 August
India 1,666,496 9.5 Middle East, US, Europe, Asia 31 December
Indonesia 130,000 2.9 Malaysia, Middle East Mid-June
Lao PDR 119,401 8.9 Thailand 17 June
Myanmar 135,469 3.7 Thailand, PRC, Lao PDR 15 June
Nepal 51,441 2.3 India 12 October
Philippines 327,511 6.1 Middle East, Asia, US, Europe 31 December
Samoa 1,000 0.8 New Zealand 5 August
Tonga 3,000 4.0 New Zealand 26 August
Uzbekistan 500,000 25.3 Russian Federation 29 May
Vanuatu 1,000 13.6 New Zealand 26 June
COVID-19 = coronavirus disease, Lao PDR = Lao People’s Democratic Republic, PRC = People’s Republic of China, US = United States.
Sources: ADB calculations using data from United Nations. Department of Economic and Social Affairs, Population Division. International Migrant Stock: The 2019 Revision. https://www.un.org/en/development/desa/population/migration/data/estimates2/estimates19.asp (accessed May 2020); Ahamad (2021); Engblom, Lephilibert, and Baruah (2020); Eurasianet.org (2020); Global Knowledge Partnership for Migration and Development (2020); Government of India, Ministry of External Affairs. https://www.mea.gov.in/vande-bharat-mission-list-of-flights.htm (accessed January 2021); Government of the Philippines, Department of Foreign Affairs (2021); International Organization for Migration (2020a, 2020b, 2020c, 2020d); Massing (2020); Millard (2020); Olsen and Vorn (2020); Pannier (2020); Pollock and Paing (2020); Prasain (2020); Radio New Zealand (2020a, 2020b).
33 As of December 2019, there were 2.8 million registered migrant workers in Thailand and an unknown number of undocumented migrant workers. Around 700,000 migrant workers in Thailand, who worked mostly in tourism, services, and construction industries, have lost their jobs since the lockdown started in late March 2020.
34 According to Government of Australia, Department of Home Affairs, from 20 March 2020, travel restrictions have been in place prohibiting travel to Australia of all foreign nationals, unless exempt.
35 Martinus (2020) reported that the Singapore government then made accommodations for Malaysian workers to continue working as usual.
Movement of People 103
Among the safety nets provided to returning Asian
migrants were cash grants, subsidies for housing and
transportation, as well as free access to COVID-19
testing and treatment. Subsidies were offered to help
businesses retain employees, and social insurance
contributions were deferred for employers (Testaverde
2020). Placement services were deployed, and
regulations adjusted to protect migrants. Regulations
and taxes on remittance were also reduced.
Returning Philippine migrants were given cash ($200)
and transportation assistance (Government of the
Philippines, Department of Labor and Employment
2020). In Bangladesh, returning migrants received a
stipend of Tk5,000 upon arrival at the airport and were
eligible for government loans ranging from Tk500,000
to Tk700,000 if they invested in economic activities,
especially in agriculture (BenarNews.org 2020). Viet Nam
used apps that record a person’s health status and
symptoms to expedite the return of migrant workers or
those traveling within the country (Bismonte 2020). In
the Republic of Korea, a disaster relief fund that began
in March 2020 was expanded to include all migrants,
provided they have been living in the capital city for at
least 90 days. Using prepaid cards, the measure provided
relief to migrants who had lost their jobs and were unable
to return to their home countries due to travel restrictions
(The Workers Rights 2020). In New Zealand, migrant
workers were allowed to take sick leave given assistance
for lost work due to lockdowns. Free COVID-19 testing
and treatment was provided in Kazakhstan and the
Republic of Korea. Singapore canceled levies for hiring
foreign workers to help employers of foreign workers. The
PRC also developed an online platform to facilitate job
placement and recruitment as well as skills development.
Overview of Migration to and from Asia
Outward migration has steadily increased, especially those headed outside Asia.
In recent years, the stock of Asian migrants across the world
has grown faster than the number of migrants residing
within the region (Figure 5.4), suggesting that extraregional
migration remains the preferred route. Although the
number of intraregional migrants within Asia has increased
since 1990, the share has been trending downward.
36 Government of New Zealand, Ministry of Business, Innovation and Employment. https://www.immigration.govt.nz/about-us/research-and-statistics/research-reports/recognised-seasonal-employer-rse-scheme (accessed September 2020); and Government of Australia, Department of Foreign Affairs and Trade. https://www.dfat.gov.au/geo/pacific/engagement/pacific-labour-mobility (accessed September 2020).
Figure 5�4: Migration to and from asia, by Region (million)
50 30 10 10 30 50 70 90
1990
1995
2000
2005
2010
2015
2019
Asia Europe North America Middle East Other regions
(a) Migrants to Asia, by Source Region
(b) Migrants from Asia, by Host Region
Source: ADB calculations using data from United Nations. Department of Economic and Social Affairs, Population Division. International Migrant Stock: The 2019 Revision. https://www.un.org/en/development/desa/population/migration/data/estimates2/estimates19.asp (accessed May 2020).
By subregion, South Asia (45.3%) and Southeast
Asia (24.2%) account for the largest shares of Asian
outmigrants (Figure 5.5). Around 50% of migrants from
South Asia move to the Middle East while 28.9% remain
within Asia. Southeast Asian migrants tend to stay within
Asia, although 24.9% reside in North America. Central
Asian migrants are found mostly in Europe, particularly
the Russian Federation.
Outmigration is also common in the Pacific. In Fiji, Samoa,
and Tonga, outmigrants comprise about 35.4% of the
population—and are affected by Oceania’s migration
policies. New Zealand’s Recognized Seasonal Employer
(RSE) scheme and Australia’s Pacific Labour Scheme
allow for the employment of migrants from the Pacific.
The RSE cap for 2020–2021 is 14,400, while the Pacific
Labour Scheme is uncapped.36 Nationals from Niue and
the Cook Islands, as concurrent New Zealand citizens, can
asian Economic integration report 2021104
table 5�2: top 10 economies hosting Migrants from asia and CoVid-19 Cases
number of asian
Migrants share of totalnumber of Confirmed
CoVid-19 Casesa share of global total
United States 13,177,721 14.4% 19,968,087 23.9%
Saudi Arabia 9,167,287 10.0% 362,741 0.4%
Russian Federation 6,806,668 7.5% 3,127,347 3.7%
United Arab Emirates 6,517,803 7.1% 207,822 0.2%
India 5,097,377 5.6% 10,266,674 12.3%
Australia 3,713,494 4.1% 28,425 0.0%
Thailand 3,617,946 4.0% 7,163 0.0%
Canada 3,307,678 3.6% 584,409 0.7%
Malaysia 3,186,689 3.5% 113,010 0.1%
Pakistan 3,180,724 3.5% 482,178 0.6%
top 10 total 57,773,387 64�0% 35,147,856 42�1%
COVID-19 = coronavirus disease.
aThe number of confirmed COVID-19 cases are as of 31 December 2020; the number of global cases totaled 83,427,446.
Sources: ADB calculations using data from Roser et al. (2020); and United Nations. Department of Economic and Social Affairs, Population Division. International Migrant Stock: The 2019 Revision. https://www.un.org/en/development/desa/population/migration/data/estimates2/estimates19.asp (accessed May 2020).
Figure 5�5: asian outmigrants by subregion and their Regional destination, 2019 (number of international migrants)
Asia
South Asia
Southeast Asia
East Asia
Central Asia
Oceania
Pacific
Middle East
Europe
North America
Latin America and the Caribbean
Africa
Other regions
Source: ADB calculations using data from United Nations. Department of Economic and Social Affairs, Population Division. International Migrant Stock: The 2019 Revision. https://www.un.org/en/development/desa/population/migration/data/estimates2/estimates19.asp (accessed May 2020).
Many low-skilled migrants from Asia were hit hard by the pandemic, forcing them to return home, while high-skilled migrant workers in sectors vital to developed host countries stayed on.
Migrants from Asia are in 186 different economies, with
more than 40% concentrated in the US, Saudi Arabia,
the Russian Federation, the United Arab Emirates, and
Canada (Table 5.2). These non-Asian destinations
also collectively account for about one-third of the
confirmed COVID-19 cases globally. Among the top host
countries in Asia, India had 12.3% share of confirmed
coronavirus cases.
Skills and the relative importance of certain types
of migrant occupations in host countries basically
determined how much pressure was applied for migrants
to return to their home countries. In the Middle East,
where foreign workers account for up to 80% of the labor
force, many low-skilled migrant workers in construction,
tourism, retail services, and as domestic workers either
lost their jobs or were stranded and had to return home
with no clear prospects of reemployment. The same was
true for migrants in the Russian Federation, where 80%
have only low- to medium-level skills (Figure 5.6).
live and work in New Zealand without restriction.37
In Central Asian economies such as Armenia, Georgia,
and Kazakhstan, outmigrants comprise at least 20%
of the population.
37 Outward migrants from Niue and the Cook Islands were proportional to 170.3% and 63.3% of their respective populations in 2019.
Movement of People 105
For high-skilled migrants working in Australia, Canada,
Saudi Arabia, and the UK, there was far less pressure
to return to their home countries. Migrants working
in industries key to the pandemic response, such as
health workers, were relatively insulated from being
repatriated. In Canada, for example, 26% of doctors
are foreign-trained workers.38 In Qatar and the United
Arab Emirates, at least 90% of doctors are foreign-born
workers. In Bahrain, Oman, Qatar and Saudi Arabia, at
least 47% of nurses are migrants. Kuwait, where 96% of
nurses are migrants, recently hired at least 500 doctors
and nurses from Pakistan, is preparing for a second wave
of the coronavirus (Al Sherbini 2020).
In the US, incoming migrants faced new entry
restrictions. The US immigration services were
suspended in April 2020 and the issuance of H-1B and
other work visas were suspended until 31 December
2020, banning the entry of foreign workers who
present a risk to the labor market. Exemptions were
made for public health or health-care professionals,
and researchers directly engaged in alleviating the
effects of the COVID-19 pandemic or engaged in
research with substantial public health benefits.39 This
temporary ban affected migrants, especially those
in professional occupations (16.9%), elementary
occupations (23.3%), and sales and service workers
(18.6%).40 In the UK, skilled tier visas accounted for
50% of all visa applications, a category dominated by
migrants from India (46.4%) and, to a lesser extent,
the Philippines (7.2%) and Australia (3.8%).41 As part
of the continuing national effort to fight the pandemic,
doctors, nurses, and paramedics had their work visas
automatically extended for 1 year free of charge. This
benefited the source countries for medical workers, such
as the Philippines, the largest source of migrant nurses
worldwide (Ladrido 2020). Migrants account for at least
25% of employed professionals in the UK.42
Many Asian migrants continue to seek (re)employment
prospects in Saudi Arabia and the United Arab Emirates.
The global economic contraction is forecast to reverse
short-term growth prospects in the Middle East; and
policies on the nationalization of labor have begun to
affect the flow of low-skilled migrants. In Bangladesh, for
example, between 2017 and 2019, the flow of migrant
workers to Saudi Arabia declined by 27.6%, to the
United Arab Emirates by 19.8%, and to Qatar by 38.7%.43
Notwithstanding these domestic-oriented labor policies,
the demand for migrant labor in the Middle East will
likely continue as the region pursues post-pandemic
diversification (Ghosh 2020).
Figure 5�6: employment distribution of Migrants by level of skills (%)
0% 20% 40% 60% 80% 100%
Japan
Australia
United Kingdom
Canada
France
Germany
US
Russian Federation
Italy
Republic of Korea
Thailand
Saudi Arabia
Malaysia
Low Medium High
US = United States.
Note: Data are from latest available year.
Source: International Labour Organization. ILOSTAT. https://ilostat.ilo.org/data/ (accessed September 2020).
38 See World Health Organization. National Health Workforce Accounts. https://apps.who.int/nhwaportal/ (accessed January 2021).39 See Government of the United States, Department of State–Bureau of Consular Affairs (2020).40 International Labour Organization. ILOSTAT. https://ilostat.ilo.org/data/ (accessed September 2020).41 Visa applications for the year ending September 2019 totaled 63,510—29,482 from India; 4,576 from the Philippines; and 2,401 from Australia. 42 ILOSTAT data set on employment of migrants by occupation. https://ilostat.ilo.org/data/ (accessed September 2020).43 Government of Bangladesh. Bureau of Manpower, Employment and Training. http://www.old.bmet.gov.bd/BMET/stattisticalDataAction (accessed
September 2020).
asian Economic integration report 2021106
Intraregional Migration
Intraregional migration remains an important part of international migration from the region.
Around 35% of Asian migrants stay within the region,
varying by subregion (Figure 5.7). The absolute number
of intraregional Asian migrants during 2015–2019
rose 3.3%—from 30.8 million to 31.8 million. Most
intraregional migrants come from the PRC (5.4 million),
Bangladesh (3.7 million), Myanmar (3.3 million), India
(3.2 million), and Indonesia (1.9 million). Intraregional
PRC migrants move to Japan (14.6%), Australia (12.0%),
and the Republic of Korea (11.6%), but Hong Kong,
China (42.3%) remains the top destination. At least
80% of Bangladeshi migrants move to India while 57% of
those from Myanmar reside in Thailand.
Among the top economies hosting intraregional
migrants are India (5.1 million), Australia (3.7 million),
Thailand (3.6 million), Malaysia (3.2 million), and
Pakistan (3.2 million). Intraregional migrants to India
largely come from neighboring countries such as
Bangladesh (3.1 million), Pakistan (1.1 million), and Nepal
(0.5 million). Australia hosted migrants primarily from
the PRC (0.6 million), New Zealand (0.6 million), and
India (0.6 million), while Thailand hosted those from
nearby countries such as Myanmar (1.9 million), the
Lao PDR (0.9 million), and Cambodia (0.7 million).
Inter-subregional migration remains high among ADB’s
Pacific developing member countries (41.2%). New
Zealand—through its Recognized Seasonal Employer
(RSE) scheme—allows in horticulture and viticulture
workers from Fiji, Kiribati, Nauru, Papua New Guinea,
Samoa, Solomon Islands, Tonga, Tuvalu, and Vanuatu.
Australia’s Pacific Labour Scheme allows workers from
Fiji, Kiribati, Nauru, Papua New Guinea, Samoa,
Solomon Islands, Timor-Leste, Tonga, Tuvalu, and
Vanuatu to take up nonseasonal low- and semi-skilled
work in rural Australia in growth sectors such as health
care, social assistance, and hospitality.44 As the pandemic
battered tourism across Pacific countries, the Pacific
Labour Scheme is one way migrant workers can
continue to send remittances to their home
country (McDonald 2020).
East Asia and Southeast Asia also have relatively
high migrant mobility within their subregions. Intra-
subregional migrants in East Asia, primarily from the
PRC (3.7 million) and the Republic of Korea (0.7 million)
were double their inter-subregional migrants (2.1 million)
in 2019. Still, migrants from Indonesia, the Philippines,
and Viet Nam continue as the top migrants to East Asia.
These economies have labor arrangements—such as a
bilateral labor agreement with the Republic of Korea and
the Philippines45 and a memorandum of cooperation
for specified skilled workers between Japan and the
Philippines (Japan International Trainee and Skilled
Worker Cooperation Organization 2019)—to ensure
their migrants have worker protection.
Figure 5�7: Migration from asia by subregion (% of total outmigrants)
(i) Intra-subregional refers to migrants from subregion i as a percentage of migrants from subregion i to the world.
(ii) Other Asia refers to migrants from subregion i to other Asian subregions as a percentage of migrants from subregion i to the world.
(iii) Rest of the world refers to migrants from subregion i to the rest of the world as a percentage of migrants from subregion i to the world.
Source: ADB calculations using data from United Nations. Department of Economic and Social Affairs, Population Division. International Migrant Stock: The 2019 Revision. https://www.un.org/en/development/desa/population/migration/data/estimates2/estimates19.asp (accessed May 2020).
44 The Pacific Labour Scheme—built on the success of the Seasonal Worker Programme—gave more Australian employers access to a reliable seasonal workforce drawn from the Pacific and Timor-Leste.
45 The Republic of Korea’s Employment Permit System has memoranda of understanding with Bangladesh, Cambodia, Indonesia, the Kyrgyz Republic, Myanmar, Mongolia, Nepal, Pakistan, the PRC, the Philippines, Sri Lanka, Thailand, Timor-Leste, Uzbekistan, and Viet Nam.
Movement of People 107
In Southeast Asia, 31.3% (6.9 million) of migrants
remained intra-subregional in 2019. This relatively
large number of migrants within the subregion
makes intraregional government support and
cooperation essential for migrant protection and safety.
For example, in 2017, the Association of Southeast
Asian Nations (ASEAN) approved a Consensus on
the Protection and Promotion of the Rights of Migrant
Workers, a framework of cooperation on intraregional
migrant workers.
A Call for Bolder Regional Cooperation
As with previous crises, the COVID-19 pandemic has led to many calls for greater regional cooperation.
health systems and related infrastructure should
be upgraded and strengthened to make mobility
“pandemic-proof�” Across the region, health systems
need to better respond to future health emergencies—
with improved medical facilities and more-skilled
personnel. The pandemic has underscored the need
for better, more accessible sanitation and water
supply infrastructure.46
a regional migrant information infrastructure
can leverage new technology to provide efficient
information sharing� The exchange of timely, accurate,
and reliable information is essential to manage crises.
Establishing a shared regional migrant information
infrastructure will allow the exchange of accurate,
relevant, and timely migrant information and help apply
migration best practices among countries (KNOMAD
2017). It can address data gaps on migration and
remittances, and provide a monitoring system to spot
any abrupt changes requiring policy intervention.
The system could also facilitate coordination and
cooperation during emergencies and help policy makers
better assess migration issues.
enhanced regional dialogue can explore new ways
to legalize or regularize migration, promote labor
standards, protect migrants, and ensure remittance
inflows� Regional cooperation and integration initiatives
can ease migrant deployment and remittance flows.
There is a need to coordinate on issues such as
formalizing unregistered migrants, the costs of migration,
ethical recruitment, promoting international labor
standards and social protection for migrant workers, and
enhancing mutual recognition of skills.47
better coordination on education and training can
improve capabilities, sharpen competencies, and
expand skills� Asian migrants provide vital skills that
benefit both source and destination countries. The
pandemic highlighted the key role migrant workers
play in medicine and as medical front liners in many
advanced countries. Source countries need to invest
in quality education and relevant training to develop
human capital.
remittances
The COVID-19 pandemic disrupted the growth momentum of remittance inflows to Asia—which reached $315.3 billion in 2019.
In 2019, global remittance inflows reached $716.7
billion—$21.9 million more than in 2018 (Figure 5.8).48
From 2010 to 2018, global remittance inflows grew by an
average 4.9% annually. However, the growth of inflows
46 At the 36th ASEAN Summit in June 2020, leaders discussed regional comprehensive post-pandemic recovery plans. They established the ASEAN COVID-19 response fund, a reserve for medical supplies to meet urgent needs during the pandemic, and ASEAN standard procedures for epidemic response in case of health emergencies (ASEAN 2020).
47 For example, a multi-stakeholder policy dialogue held in February 2020 discussed implementation of the ASEAN Consensus on the Protection and Promotion of the Rights of Migrant Workers, emphasizing the need for more collaborative, multi-stakeholder approaches to the protection of migrant workers (Philippine News Agency 2020).
48 The World Bank defines personal remittances as the sum of personal transfers and compensation of employees. Personal transfers include all current transfers in cash or in kind between resident and nonresident individuals, independent of the source of income of the sender (and regardless of whether the sender receives income from labor, entrepreneurial or property income, social benefits, and any other types of transfers; or disposed assets) and the relationship between the households (regardless of whether they are related or unrelated individuals). Compensation of employees refers to the income of border, seasonal, and other short-term workers who are employed in an economy where they are not resident and of residents employed by nonresident entities.
asian Economic integration report 2021108
table 5�3: Remittance inflows by Recipient Region
Regionshare of
total, 2019
Remittance inflows ($ billion) growth
level Change ($ billion)
2019 2020e 2019 2020e 2019 2020e
Asia 44.0% 315.3 291.8 3.9% –7.4% 12.0 –23.4
Europe 24.5% 175.8 159.5 0.20% –9.3% 0.3 –16.3
Latin America and the Caribbean 13.7% 98.1 97.9 8.1% –0.2% 7.4 –0.2
Middle East 4.2% 30.1 27.5 1.7% –8.6% 0.5 –2.6
North America 1.1% 8.1 7.5 1.1% –6.7% 0.1 –0.5
Africa 12.0% 85.9 78.4 1.8% –8.7% 1.5 –7.5
e = estimate.
Source: ADB calculations using data from Global Knowledge Partnership on Migration and Development (KNOMAD). http://www.knomad.org/data/remittances (accessed November 2020).
in 2019 moderated to 3.2% because of the economic
slowdown in Europe, local currency depreciation against
the US dollar in some major remittance-source countries
such as the Russian Federation, and lower oil prices and
production cuts in the Middle East.
In 2020, the World Bank estimated the impact of the
pandemic-induced global economic slowdown, the
uncertain job market for migrants, weak oil prices, and
unfavorable exchange rates could result in a $50 billion
drop in remittance inflows globally. Inflows to low- and
middle-income countries are expected to fall by 7.2%
with remittances to Asia dropping 7.4%—more than
twice the drop in inflows during the 2008–2009 global
financial crisis and the largest contraction since the
Asian financial crisis. Other major remittance recipients
in Europe and Africa can expect deep cuts in the growth
of remittances in 2020.49
Remittances to Europe grew the slowest in 2019 due to the
economic slowdown in major European outflow countries,
the lower price of oil, and the depreciation of the euro
against the US dollar. Estimates suggest that the region
will suffer a $16.3 billion loss in remittance inflows in 2020
as the impact of the pandemic further weakens major
economies (Table 5.3). Latin America and the Caribbean,
the top recipient region of remittances from the US, is
estimated to have 0.2% lower remittances in 2020, a sharp
downturn compared with the 8.1% remittance growth it
had in 2019, the year inflows hit $98.1 billion, its highest on
record. Around 77% of these inflows came from the US,
one of the worst-hit remittance source economies.
Figure 5�8: Remittance inflows to asia and the World
0
5
10
15
20
25
30
35
40
45
50
0
100
200
300
400
500
600
700
800
20
00
20
01
20
02
20
03
20
04
20
05
20
06
20
07
20
08
20
09
20
102
011
20
122
013
20
142
015
20
162
017
20
182
019
20
20
f
%
$ b
illio
n
Asia (left) Rest of the world (left)Asia's share in world (right)
f = forecast.
Source: ADB calculations using data from Global Knowledge Partnership on Migration and Development (KNOMAD). http://www.knomad.org/data/remittances (accessed November 2020).
49 Based on World Bank estimates released in October 2020, remittance inflow growth was expected to fall across all regions, most notably Europe and Central Asia (–16.1%), followed by East Asia and the Pacific (–10.5%), sub-Saharan Africa (–8.8%), the Middle East and North Africa (–8.5%), South Asia (–3.6%), and Latin America and the Caribbean (–0.2%). Based on weighted averages, remittance growth in Asia is forecast to contract by 8.4% in 2020 and 7.5% in 2021.
Movement of People 109
Remittance Inflows by Asian Subregion
Except for Oceania, subregional remittance inflows
grew in 2019 (Table 5.4). South Asia accounted for 44%
($139.8 billion) of the Asian total—up 6.1% in 2019.
Growth fell from the 12.3% growth in 2018, as lower oil
prices slowed economic activity in the Middle East (the
source for 59.1% of South Asian remittances). Inward-
looking labor policies in the Middle East have started to
affect migrant flows.50 Growth in inflows to other Asian
regions were relatively subdued in 2019. Remittances
to Southeast Asia rose by 2.8%—yet inflows to major
recipients Indonesia, the Philippines, and Viet Nam grew
by 4% or more.
Lower inflows are expected across all subregions in
2020. Remittances to Central Asia, which depends on
the Russian Federation for at least 75% of its inflows,
are estimated to drop by 17.4%. Inflows to Southeast
Asia will likely drop by 8.4%, down $6.5 billion as large
numbers of workers were repatriated and remittances
slowed from the Middle East, North America, and the
Russian Federation. Inflows to South Asia are expected
to contract by similar amounts.
A gradual and prolonged decline in remittance inflows
will hurt the region’s top remittance recipients (Figure
5.9). India, the PRC, and the Philippines accounted for
59.3% ($186.9 billion) of remittances to Asia and 26.1%
of remittances globally ($716.7 billion). Inflows to these
economies will collectively drop by $18.1 billion in 2020,
equivalent to 77.4% of the projected decline in Asia.
table 5�4: Remittance inflows to asian subregions and growth
subregion
amount in $ billion (share of total) growth
2019 2020e 2019 2020e
Central Asia 14.5 (4.6%) 11.9 (4.1%) 3.70% -17.4%
East Asia 81.2 (25.7%) 72.1 (24.7%) 1.7% -11.2%
South Asia 139.8 (44.4%) 134.7 (46.2%) 6.1% -3.6%
Southeast Asia 76.9 (24.4%) 70.4 (24.1%) 2.8% -8.4%
Oceania 2.2 (0.7%) 2.0 (0.7%) -5.5% -9.2%
Pacific 0.8 (0.2%) 0.7 (0.2%) 0.7% -4.3%
e = estimate.
Source: ADB calculations using data from Global Knowledge Partnership on Migration and Development (KNOMAD). http://www.knomad.org/data/remittances (accessed November 2020).
50 Data on overseas employment by destination from the Government of Pakistan, Bureau of Emigration and Overseas Employment (https://beoe.gov.pk/reports-and-statistics) show that in 2018, the number of Pakistani overseas workers deployed in Oman declined by 35.8%, in Saudi Arabia by 29.6%, and in the United Arab Emirates by 24.3%. The Government of Bangladesh, Bureau of Manpower Employment and Training (http://www.old.bmet.gov.bd/BMET/viewStatReport.action?reportnumber=16) indicated that in 2019, the number of workers deployed had dropped by 55.5% in Kuwait (to 12,299) and 34.3% in Qatar (to 50,292).
Figure 5�9: top 10 Remittance Recipients in asia, 2019 ($ billion)
0 20 40 60 80 100
Thailand
Korea, Rep. of
Nepal
Indonesia
Viet Nam
Bangladesh
Pakistan
Philippines
PRC
India
PRC = People’s Republic of China.
Source: ADB calculations using data from Global Knowledge Partnership on Migration and Development (KNOMAD). http://www.knomad.org/data/remittances (accessed November 2020).
asian Economic integration report 2021110
The drop in remittances in 2020 will also affect
economies with lower absolute amounts but with higher
impact on gross domestic product (GDP). In Nepal,
the fourth largest remittance recipient by share of GDP
(Figure 5.10a), remittance inflows are 10 times larger
than official aid, 9 times more than exports, and 67 times
FDI (Pandey 2020). Its remittances derive mostly from
the Middle East (44.6%) and Asia (43.8%), particularly
India and Malaysia where 50% of Nepali emigrant
population reside. A significant drop in remittance
inflows could hurt Nepal’s external balance and foreign
exchange liquidity in its economy. Remittance inflows
are also essential to several Pacific countries with GDP
shares ranging from 10% to as high as 36% (Figure 5.10b).
Per capita remittances are high in Tonga, Samoa, the
Marshall Islands, and Fiji—and a prime source of foreign
exchange. These economies are also largely dependent
on tourism, devastated by global travel restrictions.
Hurricane Harold also damaged Fiji, Solomon Islands,
Tonga, and Vanuatu in April 2020 (IMF 2020a).
Figure 5�10: top 10 Remittance Recipients in asia, 2019
a: Share of GDP (%) b: Per Capita ($)
0 10 20 30 40
Philippines
Kiribati
Armenia
Georgia
Marshall Islands
Samoa
Nepal
Kyrgyz Republic
Tajikistan
Tonga
0 500 1,000 1,500 2,000
Nepal
Sri Lanka
Fiji
Philippines
Kyrgyz Republic
Armenia
Marshall Islands
Georgia
Samoa
Tonga
GDP = gross domestic product.
Note: 2019 figures are not available for some countries.
Sources: ADB calculations using data from Global Knowledge Partnership on Migration and Development (KNOMAD). http://www.knomad.org/data/remittances (accessed November 2020); International Monetary Fund. World Economic Outlook Database. https://www.imf.org/en/Publications/WEO/weo-database/2020/October (accessed November 2020); and United Nations. Department of Economic and Social Affairs, Population Division. World Population Prospects 2019. https://population.un.org/wpp/Download/Standard/Population/ (accessed April 2020).
Quarantine measures to contain the spread of COVID-19 hampered migrants’ ability to send money home to their families.
As the number of confirmed COVID-19 cases began
increasing, governments began imposing a variety of
mobility restrictions to contain the spread of the virus.
In January and February, when restrictions were just
starting, migrants were still able to send money home
without discernible difficulty. Remittance inflows to
11 selected Asian economies even grew by 6.2% in
January and 7.0% in February (Figure 5.11). However,
stringency measures jumped sharply in March 2020
and peaked in April when almost all economies imposed
border and travel restrictions in one form or another. In
many remittance-sending countries, remittance service
providers were not considered essential businesses
and were closed during these months. On average,
remittance inflows to Asia fell by 5% in March. A sharp
downturn in inflows occurred in April (–17.5%) and May
(–18.3%) before recovering by 24.3% in June and 26.7%
in July, as the restrictions on movement gradually eased.
Movement of People 111
Despite the large drop, remittances to Asia will likely remain a relatively stable source of external financing compared with other types of financial flows.
In past crises, remittance flows showed signs of resilience
to shocks relative to other financial flows. However,
this pandemic is different as economies in both source
and recipient countries suffered from a sudden, sharp
slowdown. The road to recovery is expected to be
long and slow. The pandemic is a harder test of the
countercyclical character of remittances despite that
inflows to some developing Asian countries have
started to bounce back (Box 5.1). This could have
implications on the growing role remittances play,
particularly compared with other inflows such as foreign
direct investment (FDI) and tourism. Remittances
accounted for 20.5% of financial flows, behind FDI
(47.8%, $646 billion) and tourism (26.6%, $359 billion)
during 2014–2018 (Figure 5.12a). Asia’s remittance share
relative to other financial flows has also been rising over
the past decade (Figure 5.12b). By subregion, South Asia
and Central Asia have seen rapid increases in the relative
Figure 5�11: stringency Measures and Remittance growth, 2020
-30
-20
-10
0
10
20
30
40
0
10
20
30
40
50
60
70
80
90
Jan Feb Mar Apr May Jun Jul Aug
Top extraregional remittance sources Asia
Rest of the World Remittance growth (y-o-y, right)
%Ind
ex
Notes: Data refer to the average of sample countries. Stringency measures refer to the Oxford COVID-19 Government Response Stringency Index that ranges from 0 (no restriction) to 100 (most restrictive). The top extraregional remittance senders to Asia include the United States, Saudi Arabia, the United Arab Emirates, the Russian Federation, the United Kingdom, Qatar, Canada, Oman, and Italy. Remittance growth is based on the year-on-year growth of aggregate remittance inflows to Armenia, Bangladesh, Bhutan, Fiji, Georgia, Kazakhstan, the Kyrgyz Republic, Pakistan, the Philippines, Samoa, and Sri Lanka.
Sources: ADB calculations using data from Hale et. al (2020a); and the central banks of Armenia, Bangladesh, Bhutan, Fiji, Georgia, Kazakhstan, the Kyrgyz Republic, Pakistan, the Philippines, Samoa, and Sri Lanka (all accessed in December 2020).
Figure 5�12: Financial Flows to asia (% of total financial flows)
a: By Type and Subregion, 2018 b: Remittance Shares by Subregion (5-year moving average)
0
20
40
60
80
100
Net ODA and official aid Net equity inflows
Net FDI inflows Tourism receipts
Remittances
0
20
40
60
20
05
20
06
20
07
20
08
20
09
20
10
20
11
20
12
20
13
20
14
20
15
20
16
20
17
20
18
Central Asia
Cen
tral
Asi
a
East Asia
Eas
t A
sia
South Asia
So
uth
Asi
a
Southeast Asia
So
uth
east
Asi
a
Oceania
Oce
ania
Pacific
Pac
ific
Asia
Asi
a
FDI = foreign direct investment, ODA = official development assistance.
Sources: ADB calculations using data from Global Knowledge Partnership on Migration and Development (KNOMAD). http://www.knomad.org/data/remittances (accessed November 2020); World Bank. World Development Indicators Database. https://databank.worldbank.org/source/world-development-indicators (accessed October 2020); UNWTO (2020); and International Monetary Fund (2019).
asian Economic integration report 2021112
economic contribution of remittances. South Asia is
heavily reliant on remittances for external financing,
accounting for more than 50% of total financial flows,
followed by Central Asia, where remittance inflows
account for one-third of financial flows.
box 5�1: Remittances and CoVid-19—a test of Resilience
Since 2000, remittance inflows to the region have declined twice—in 2009 during the global financial crisis and in 2016 due to weak economic growth in the Russian Federation and the Middle East (box figure). Remittance inflows fell 2.7% in 2009 (foreign direct investment [FDI] fell 20%) with Central Asia, East Asia, and Oceania hit hard. In 2016, remittance inflows to the region fell by 3.1% (FDI fell 10%) as the oil price collapse weakened economic growth in the Middle East and the Russian Federation.a The impact on remittance inflows was more severe in South Asia and Central Asia in 2016 than other subregions, as the two subregions rely on the oil-producing regions as their principal source of inflows.
Remittance inflows during past crises, however, recovered rapidly, surpassing precrisis levels the following year. Resilient and stable inflows relative to other financial flows (like FDI) highlight the key role remittances play in reducing volatility in output, consumption, and investment. Even in extreme cases, remittances reduce the probability of financial crises (IMF 2005; Singer 2008; Ratha and Sirkeci 2010; Rajan and Narayana 2012; Sirkeci, Ratha, and Cohen 2012):
a The Russian Federation in 2016 also suffered a sharp fall in its exchange rate, a balance of payment crisis, and economic sanctions by the United States and the European Union.
Source: Asian Development Bank.
• Remittance inflows to countries in South Asia and Southeast Asia continued to grow as the subregions diversified migrant destinations.
• Remittances are countercyclical—migrants tend to send more money, responding to the needs of their families during crises or natural disasters.
• Existing migrants adjust to the income shock by reducing their own consumption (to continue sending money home).
• Foreign exchange rate movements cause a surge in investment-oriented remittances as local currencies of recipient countries depreciate sharply.
While the two past health crises—the severe acute respiratory syndrome in 2002–2004 and the Middle East respiratory syndrome in 2012—had limited impact on remittances, the COVID-19 pandemic is fundamentally different. Its economic impact is so wide and deep across all source and destination countries, resulting in job and income losses for existing and new migrants, and the mass repatriation of migrants. Thus, remittances as an economic hedge against shocks will likely have limited effect during the pandemic.
trend in Remittance inflows Remittance inflows growth (%)
2009 2016 2020e
asia –2�7 –3�1 –7�4
Central Asia –22.5 –11.1 –17.4
East Asia –12.8 –3.2 –11.2
South Asia 4.5 –5.9 –3.6
Southeast Asia 5.9 3.6 –8.4
Pacific 7.7 –0.8 –4.3
Oceania –14.5 –5.4 –9.2
COVID-19 = coronavirus disease, e = estimate, GFC = global financial crisis, MERS-CoV = Middle East respiratory syndrome coronavirus, SARS = severe acute respiratory syndrome, y-o-y = year-on-year.
Source: ADB calculations using data from Global Knowledge Partnership on Migration and Development (KNOMAD). http://www.knomad.org/data/remittances (accessed November 2020).
Weak economic growth inMiddle East and Russian Federation
COVID-19
SARS(2002–2004)
MERS-CoV (2012) GFC
Movement of People 113
Intraregional and Extraregional Remittance Flows
As major source countries face a significant economic downturn, recipient subregions in Asia brace for the consequences of lower remittances in 2020.
Asia’s largest source of remittances remains the Middle
East—the inflows of $100.4 billion in 2019, 5.3%
($5.0 billion) more than in 2018 (Figure 5.13). Almost
all outflows went to two Asian subregions, South Asia
(82.3%) and Southeast Asia (17.4%)—around 50%
(about 21 million) of migrants from South Asia and
20% (about 4 million) from Southeast Asia reside in
the Middle East. India, Pakistan, and the Philippines
received a total of $76.6 billion, equivalent to 76.3% of
Middle East outflows to Asia and 53.1% of its outflows
worldwide. Year-to-date remittances in the second
quarter (Q2) of 2020 grew in India (3.5% y-o-y) and
Pakistan (8.8%), suggesting the pandemic had not
affected remittance-sending behavior.
In 2019, there were $6.2 billion more inflows from North
America and $3.0 billion more from Europe. Those from
North America ($78.0 billion) accounted for 24.7% of
total inflows to Asia—to Southeast Asia (33.8%), East
Asia (37.3%), and South Asia (27.5%). The PRC, India, the
Philippines, Viet Nam, and the Republic of Korea received
a combined $67.6 billion, equivalent to 86.6% of North
America’s total remittances to Asia. Remittance inflows
from North America to these economies are expected
to slow due to widespread infections in the US, business
closures, and the resulting drop in economic activity.
Inflows from Europe grew to $45.6 billion in 2019, up
by 7.2% from 2018. Led by outflows from the UK and
the Russian Federation, the top subregion recipients
were South Asia (India and Pakistan) and Central Asia
(Uzbekistan, the Kyrgyz Republic, and Tajikistan).
Countries within Asia also contributed to remittance
inflows—though $1.4 billion less than in 2018—as Asia’s
intraregional remittance share declined marginally to
26.9% in 2019 from 28.6% in 2018. By economy, the US,
Saudi Arabia, the United Arab Emirates, and the Russian
Federation were among the top sources of remittance
inflows to the region. Together these economies sent
$146.9 billion to the region, the equivalent of 46.5% of
global remittances to Asia. Top intraregional remitters
include Hong Kong, China; Australia; and Japan, which
together sent $41.2 billion, or 48.4% of intraregional
remittances received.
Declining remittance inflows also threaten economies dependent on remittances.
In 2019, around 26.9% ($85.0 billion) of inflows to Asia
came from migrant host countries within the region—
around 64.5% were from East Asia and Southeast Asia;
another 34% from Oceania and South Asia (Figure
5.14). Malaysia, India, Singapore, and Thailand figure
prominently among the major intraregional remittance
sources. Thus, the pandemic will have varying impact on
the livelihood and incomes of the Asian migrant workers
they host.
Among subregions, the Pacific stands out by its
dependence on Asia for at least 55% of remittances.
Oceania is the source for at least 50% of global
remittances to Fiji, Kiribati, Samoa, Solomon Islands,
and Tonga. Economic recovery in Australia
Figure 5�13: intraregional and extraregional Remittance Flows to asia ($ million)
Asia
South Asia
Southeast Asia
East Asia
Central Asia
Oceania
Pacific
Middle East
Europe
North America
Rest of the World
Source: ADB calculations using data from Global Knowledge Partnership on Migration and Development (KNOMAD) staff estimates. Bilateral Remittance Matrix 2020 (May).
asian Economic integration report 2021114
and New Zealand will benefit countries in the Pacific,
which rely on Oceania for employment and remittance
inflows. However, the deep cut in tourism across the
Pacific suggests that recovery will depend on the
resumption of global travel and tourism alongside a
rebound in remittances.
In 2019, Central Asia (93.5%), South Asia (84.9%),
and Oceania (61.0%) received higher proportions of
remittances from outside Asia, as the bulk of their migrant
workers work in the Russian Federation, the United Arab
Emirates, Saudi Arabia, the US, and the UK. East Asia’s
remittance profile showed a slight increase (to 52.8% from
49.1% in 2015) in remittance receipts from non-Asian
sources. Over the same period, Southeast Asia showed an
increase over other Asian subregions.
Technology, Digitalization, and Remittance Costs
Digital technology will likely play a more important role as traditional remittance channels are constrained by limited mobility.
Many conventional money transfer businesses closed
during the height of government-mandated border and
mobility restrictions, particularly in April and May 2020.
This opened many opportunities for technology-driven
money transfer companies. As people resorted to cashless
payment systems, the use of digital remittances grew at an
unprecedented rate. People began accessing alternative
means of sending remittances—such as mobile money,
internet banking, and other non-cash digital and
electronic channels. The US payment service company,
PayPal, gained 21.3 million new customers in Q2 2020,
increasing nearly 140% y-o-y (Manila Standard 2020).
The lockdowns showcased the role digital channels will
play in future remittances. They influenced migrant
behavior in their choice of remittance channel. But
many core problems with accelerating digitalization
of remittances continue. By Q3 2020, the average
cost of remitting to Asia remains far higher than the
Sustainable Development Goal target of 3%—it costs
6.1% from anywhere in the world and 4.6% from any of
the top remittance-sending countries to Asia.51 There
are significant variations in remittance costs across Asian
subregions—a $200 cash remittance is cheaper to send
to Central Asia (1.0% to Azerbaijan) and South Asia (4.1%
to Bangladesh), while remitting to the Pacific remains the
costliest, ranging from 8.1% (Fiji) to 10.8% (Tonga).
Several nations and organizations issued a call to action in
May 2020 calling on policy makers to declare remittance
services as essential and facilitate the scaling up of digital
remittance channels.52 The biggest policy reinforcements
should focus on three areas: (i) providing digital infrastructure,
internet connectivity, and technological innovations to extend
Figure 5�14: subregional Remittance sources in asia (%)
(i) Within subregion refers to remittances within subregion i as a percentage of remittances from the world to subregion i.
(ii) Rest of Asia refers to the remittances from other Asian subregions to subregion i as a percentage of remittances from the world to subregion i.
(iii) Rest of the World refers to remittances from non-Asian economies to subregion i as a percentage of remittances from the world to subregion i.
Sources: ADB calculations using data from Global Knowledge Partnership on Migration and Development (KNOMAD). http://www.knomad.org/data/remittances (accessed December 2019); and KNOMAD staff estimates. Bilateral Remittance Matrix 2020 (May).
51 World Bank. Remittance Prices Worldwide. https://remittanceprices.worldbank.org/en (accessed November 2020).52 Led by the UK and Swiss authorities, a call to action is a plea for countries across the globe to ease access to international money transfers and support
the scaling of digital channels to ensure funds keep flowing to developing markets during the pandemic.
Movement of People 115
the coverage of money transfer services across national
and currency borders, while simultaneously lowering costs;
(ii) executing the necessary legal, regulatory, and oversight
reforms to allow more nonbank remittance service providers
(especially in rural areas), including consumer and investor
protection, know-your-customer and anti-money laundering
compliance costs; and (iii) supporting government-led
knowledge-sharing campaigns to improve financial literacy
among migrants and their beneficiaries—to further inclusion
in the formal financial system.
Way Forward through Regional Cooperation
As economies recover, the region could benefit from policies and regional cooperation mechanisms that ensure the flow and growth of remittances in a post-pandemic environment.
There are several ways regional cooperation could
benefit remittance flows. First, there needs to be stronger
government commitment to develop remittance
infrastructure, including expanding internet access to
rural and remote areas to increase remittances channeled
formally and help bring down costs. By expanding rural
access to digital technology, remittances could support
rural development and create new jobs and opportunities.
Ensuring interoperability between mobile financial services
will also improve remittance inflows through mobile accounts.
Second, governments and development partners can
expand financial and digital literacy campaigns to
improve the use of modern remittance channels. This
will help migrants with limited experience in accessing
formal financial services and those used to sending
remittances through informal channels.
Third, public institutions and remittance service providers
could collaborate on helping transition migrants and their
families to open bank accounts, enhance saving habits,
and help build household financial resilience. This will also
improve family access to savings, credit, and insurance
products, and provide digital solutions via mobile
phone apps.
Fourth, harmonizing regulations will help unlock
access to digital remittance channels. Reducing the
application time for companies to obtain licenses from
central banks, having clearer regulations on cross-
border partnerships of financial service providers, and
promoting innovative know-your-customer solutions
to include migrants and their families will encourage
digital service providers to open and partner with existing
remittance service providers to expand markets.
And fifth, a broader international remittance agenda for the
long term must include innovation in the global remittances
market and leveraging remittances for consumer and
business lending, micro-saving and micro-insurance,
improving country risk ratings, and accessing international
capital markets through securitization and the issuance of
diaspora bonds (Mohieldin and Ratha 2020).
tourism
The COVID-19 pandemic hit tourism in Asia abruptly and deeply. A recovery to precrisis levels will likely take years, endangering the survival of large parts of the sector.
Impact of COVID-19 on International Visitor Arrivals
The imposition of travel restrictions and fear of infection during travel caused a steep fall in international arrivals.
Asia had become a major destination for international
tourism over the past 2 decades.53 The COVID-19
pandemic brought this trend to an abrupt halt. Many
53 According to the 2008 International Recommendations for Tourism Statistics (United Nations Statistical Commission 2007) that the UNWTO adopts when compiling tourism statistics, tourism refers to the activity of visitors. A visitor is a traveler taking a trip to a main destination outside his/her usual environment, for less than a year, for any purpose (business, leisure, or other personal purpose) other than to be employed by a resident entity in the country or place visited. A visitor is classified as a tourist (or overnight visitor), if his/her trip includes an overnight stay, or as a same-day visitor (or excursionist) otherwise. There are no significant differences between the number of visitors and tourists in many countries except for the PRC where some 60% of visitors are same-day visitors arriving from Hong Kong, China; and Macau, China.
asian Economic integration report 2021116
governments in the region introduced enhanced travel
controls in February 2020 and extended them to full
travel bans within 2 months (Figure 5.15). As of October
2020, most bans were still in place, with only a few
governments deciding to slowly ease travel restrictions.
The extensive travel restrictions led to the grounding of
airline fleets worldwide. Apart from a sudden slump in
the supply of transportation, demand for tourism quickly
contracted as many people became afraid to travel. An
International Air Transport Association (IATA) survey on
consumer travel confidence in April 2020 indicated that
40% of respondents would wait 6 months or more before
traveling again—this rose to 55% in the June edition of
the survey (IATA 2020a). Consumer travel confidence
remained unfavorable in the most recent version of the
survey in September, with more than half of respondents
planning to travel no sooner than in 6 months (IATA 2020b).
Monthly international tourist arrivals fell dramatically
for selected economies in four subregions from January
2019 to September 2020 (Figure 5.16). The drop first
occurred in East Asia, where the pandemic originated
and where travel restrictions were first imposed.
Southeast Asia followed, then South Asia and the Pacific,
as the pandemic spread to those subregions.
Figure 5�15: international travel Restrictions, 2020
Central Asia
1 Jan 15 Jan 1 Feb 15 Feb 1 Mar 15 Mar 1 Apr 15 Apr 1 May 15 May 1 Jun 15 Jun 1 Jul 15 Jul 1 Aug 15 Aug 1 Sep 15 Sep 1 Oct 15 Oct
AzerbaijanGeorgia
KazakhstanKyrgyz Republic
TajikistanTurkmenistan
Uzbekistan
East Asia
Hong Kong, ChinaJapan
MongoliaPeople’s Republic of China
Republic of KoreaTaipei,China
South Asia
AfghanistanBangladesh
BhutanIndia
NepalPakistan
Sri Lanka
Southeast Asia
Brunei DarussalamCambodiaIndonesiaLao PDRMalaysia
MyanmarPhilippines
SingaporeThailand
Timor-LesteViet Nam
Pacific
FijiPapua New Guinea
Solomon IslandsVanuatu
Oceania
AustraliaNew Zealand
LEGEND:
0 - No restrictions
1 - Screening arrivals
2 - Quarantine arrivals from some or all regions
3 - Ban arrivals from some regions
4 - Ban on all regions or total border closure
Blank - no data
Lao PDR = Lao People’s Democratic Republic.
Notes: Data refer to policy applied to foreign travelers, not citizens. No data were available for the following: Armenia, the Cook Islands, the Federated States of Micronesia, Kiribati, Maldives, the Marshall Islands, Nauru, Niue, Palau, Samoa, Tonga, and Tuvalu.
Source: ADB calculations using data from Hale et al. (2020b).
Movement of People 117
As international arrivals fell to historic lows, economies
heavily dependent on tourism were particularly hard
hit. For example, arrivals to Thailand (which reported
the first COVID-19 case outside the PRC in January
2020) subsequently fell from 10.8 million in the first
quarter (Q1) of 2019 to 6.7 million in Q1 2020. After
the government introduced a strict travel ban by the
end of March, Thailand recorded zero tourist arrivals
throughout Q2 2020 and Q3 2020. Following the
same pattern, other Southeast Asian countries, such as
Cambodia (-98.1%), Myanmar (-97.5%), the Philippines
(-97.8%), Singapore (-99.3%), and Viet Nam (-99.0%)
saw near shutdowns for Q2 2020. Similar trends
continued in Q3 2020. According to IMF (2020d),
arrivals to the Pacific island countries contracted 22.7%
in Q1 2020, further slumping by 99.5% in Q2 2020
and 99.4% in Q3 2020. For example, between April
and September, Samoa, Tonga, and Vanuatu had no
international arrivals. Noting that these countries are
among the top 10 recipients of tourism receipts as a
percent of GDP in the Asia and Pacific region, numerous
people lost their jobs and domestic economies suffered
significant losses.
A quick recovery in tourism seems unlikely as an end
to the pandemic is not yet in sight. The prolonged
gloomy prospects for tourism could become a drag
on the economic recovery, especially in highly tourism
dependent economies.
With a slump in international arrivals, many economies
expect a substantial decrease in tourism receipts. If Q4
2020 will see similarly low levels of international tourist
arrivals, tourism receipts are expected to decline by
83.2% in Thailand ($11.9 billion from $70.5 billion, year-
on-year [y-o-y]) and 79.6% in Cambodia ($1.1 billion
from $5.2 billion, y-o-y) (Figure 5.17). In 21 selected
Asian economies, the contributions of international
tourism receipts to GDP are forecast to plunge by an
average of 80.8% in 2020 y-o-y. In terms of absolute
change, it will be most severe for Maldives, where
tourism is one of the main pillars of the economy. From
an estimated 61.2% contribution to GDP in 2019, it
is expected to fall to 19.1% in 2020. A similar drop is
forecast for Vanuatu (9.2% from 45.4%, y-o-y), Palau
(9.7% from 45.6%, y-o-y), Samoa (3.2% from 25.6%),
and Fiji (5.7% from 28.1%, y-o-y).
Pre-COVID-19 Performance of International Tourism
Prior to the COVID-19 outbreak, tourism had been one of the world’s most vibrant and promising economic sectors. In many economies in Asia, tourism was an important pillar of growth and a reliable source of development.
Global tourism showed phenomenal growth over the past
10 years. In 2019, the number of international arrivals had
risen to 1.5 billion, up from 949.6 million a decade earlier
(United Nations World Tourism Organization 2020e).
Figure 5�16: Monthly international tourist arrivals by subregion (January 2019 = 100)
Jan
20
19F
eb 2
019
Mar
20
19
Ap
r 2
019
May
20
19Ju
n 2
019
Jul 2
019
Au
g 2
019
Sep
20
19
Jan
20
20
Feb
20
20
Mar
20
20
Ap
r 2
02
0M
ay 2
02
0
Jun
20
20
Jul 2
02
0A
ug
20
20
Sep
20
20
Oct
20
19N
ov
20
19D
ec 2
019
0
20
40
60
80
100
120
140
160
East Asia South Asia Southeast Asia
Pacific Oceania
Notes: Only economies with complete data from January 2019 to June 2020 were included in estimating the value for each subregion. For some economies with missing data between July and September 2020, international tourist arrivals were obtained from the previous 3-month average. East Asia includes Hong Kong, China; Japan; the Republic of Korea; and Taipei,China. South Asia includes India, Maldives, Nepal, and Sri Lanka. Southeast Asia includes Cambodia, Indonesia, the Lao People’s Democratic Republic, Malaysia, Myanmar, the Philippines, Singapore, Thailand, and Viet Nam. The Pacific includes Fiji, Palau, Samoa, Solomon Islands, and Vanuatu. Oceania includes Australia and New Zealand.
Sources: ADB calculations using data from CEIC; Government of Fiji, Bureau of Statistics. htttps://www.statsfiji.gov.fj (accessed October 2020); Government of the Lao PDR People’s Democratic Republic, Ministry of Information, Culture, and Tourism. International Tourist Arrivals January–March 2020. Unpublished; Government of Malaysia, Ministry of Tourism and Culture. Tourist Arrivals Data. http://mytourismdata.tourism.gov.my; Government of Palau. Visitor Arrivals. https://www.palaugov.pw/visitor-arrivals/; Government of the Republic of Korea, Tourism Organization. https://kto.visitkorea.or.kr; Government of Samoa, Samoa Tourism Board. http://www.samoatourism.org; Government of Singapore, Department of Statistics. https://www.tablebuilder.singstat.gov.sg (all accessed October 2020); Government of Solomon Islands, Ministry of Finance and Treasury. Government (2020); Government of Vanuatu, Ministry of Finance and Economic Management, National Statistics Office (2019); Haver Analytics; and International Monetary Fund (2020b, 2020c, 2020d).
asian Economic integration report 2021118
International visitor arrivals grew by 3.8% in 2019 and
marked the tourism sector’s 10th consecutive year of
growth.54 Asia has outperformed other regions with its
share of global arrivals rising from around 20% in the early
2000s to 30.1% in 2018 (Figure 5.18).
The number of international travelers to Asia increased
by 6.9% in 2018 to reach 439.5 million. Growth in the
number of travelers to Europe was 3.2% in 2018, though it
continued to attract the largest number of arrivals (603.9
million visitors) and had the largest share of the global total
(43.3% on average since 2010). The number of arrivals to
North America rose by 2.9% to 100.9 million visitors, the
highest growth since 2016. The rapid increase in number of
travelers to Asia in 2018 continued an ongoing trend. While
global arrivals increased at an average annual rate of 5.3%
from 2010 to 2018, arrivals to Asia grew an average 7.2%,
faster than North America (3.6%), Europe (4.4%), and
Latin America and the Caribbean (6.2%).
Various factors were behind the strong growth of tourism
in Asia. A long period of broad-based economic growth
gave an increasing part of the population the financial
means to travel domestically and internationally. In
addition, an increasingly liberalized air transport market
led to many low-cost carriers offering inexpensive
flights. For example, ASEAN established the Multilateral
Agreement on Air Services in 2008 and the Multilateral
Agreement for the Full Liberalization of Passengers
Air Services in 2010, which led to an increase in open
routes between different cities in the region and allowed
greater market penetration for low-cost carriers (Leonir
and Laplace 2016). In addition, visa requirements were
reduced, especially within the region, easing travel
still further.
Figure 5�17: outlook for tourism Receipts in selected asian economies (% of GDP)
0
10
20
30
40
50
60
70
Ho
ng
Ko
ng,
Ch
ina
Rep
ub
lic o
f K
ore
aIn
dia
Mal
div
esN
epal
Sri
Lan
kaC
amb
od
iaIn
do
nes
iaL
ao P
DR
Mal
aysi
aM
yan
mar
Ph
ilip
pin
esS
inga
po
reT
hai
lan
dV
iet
Nam F
ijiP
alau
Sam
oa
So
lom
on
Isl
and
sT
on
gaV
anau
tuEast Asia
SouthAsia
Southeast Asia Pacific
Contribution to GDP (2019) Contribution to GDP (2020)
Notes: Only economies with available data on tourism arrivals up to September 2020 were included in estimating contributions of international tourism receipts to GDP. Estimates for receipts (2019 and 2020) were produced under the assumption that international tourism receipts per capita remain at 2018 levels. Estimates for international arrivals (October to December 2020) were produced under assumptions that Q4 2020 arrivals follow Q3 2020 trends, and international movements in the remaining months of the year remain restrictive. Estimates for GDP (2020) were according to the projections of the Asian Development Outlook Update.
Sources: Asian Development Bank calculations using data from Asian Development Bank (2020); CEIC; Haver Analytics; International Monetary Fund (2020b, 2020c); United Nations World Tourism Organization. Tourism Satellite Accounts. http://statistics.unwto.org/ (accessed October 2020); and World Bank. World Development Indicators. https://databank.worldbank.org/source/world-development-indicators (accessed September 2020).
Figure 5�18: global Visitor arrivals by Region of destination
0
5
10
15
20
25
30
35
0
200
400
600
800
1,000
1,200
1,400
1,600
%
mill
ion
Asia (left) Europe (left)Middle East (left) Latin America and the Caribbean (left)North America (left) Africa (left)Other regions (left) Asia's share in world (right)
20
01
20
00
20
02
20
03
20
04
20
05
20
06
20
07
20
08
20
09
20
102
011
20
122
013
20
142
015
20
162
017
20
18
Source: ADB calculations using data from United Nations World Tourism Organization. Tourism Satellite Accounts. http://statistics.unwto.org/ (accessed October 2020).
54 Based on data from United Nations World Tourism Organization. https://www.unwto.org/global-and-regional-tourism-performance (accessed September 2020).
Movement of People 119
Intraregional tourism has been an increasingly important component of Asia’s tourism sector.
As regional integration increased, tourism in Asia has
developed a strong intraregional component. Of 439.5
million total arrivals in 2018, the number of intraregional
arrivals (the number of Asian visitors traveling to Asian
destinations) topped 347.7 million (Figure 5.19). The
intraregional arrival share rose from 74.0 % in 2010 to
79.1 % in 2018. There were 9.8 million more arrivals in
East Asia and 7.7 million more in Southeast Asia. The
sharpest relative increase was in Central Asia, where
intraregional tourism increased by 42.6%, to 22.2 million
in 2018. This strong growth underscores opportunities to
help operationalize the Central Asia Regional Economic
Cooperation (CAREC) Tourism Strategy 2030.
Extraregional visitors to Asia had also been growing since
2010, reaching 91.8 million in 2018, up from 88.6 million
in 2017. Some 40% came from Europe, around 20%
from North America, with one-third from other regions.
Visitors from Europe and North America—led by Canada,
Germany, France, the Russian Federation, the UK and
the US—preferred East Asian and Southeast Asian
destinations, notably Japan, the PRC and Thailand.55
Outbound tourist expenditures from Asia nearly doubled between 2010 and 2018, with the PRC taking the lead.
Asian tourist expenditures continuously grew in nominal
terms by an average annual growth rate of 11.2%
between 2010 and 2018, reaching $546.1 billion in 2018
(Figure 5.20). Throughout the period, spending by East
Asian travelers accounted for 63.6% on average. The PRC
remained the top spender at $227.3 billion, equivalent to
at least half of tourism expenditures in the region.
Although outbound tourism expenditures for the region
has been on an upward trend since 2010, spending per
capita has been declining, from $1,306.9 in 2015 to
$1,212.2 in 2018 (Figure 5.21a). Compared with 2015,
average per capita tourist spending in 2018 declined in
many economies and in all subregions except Oceania.
These downward trends may be attributable to the rising
popularity of budget travel and the increasing availability
of low-cost flights. For instance, outbound tourists from
Southeast Asia almost tripled between 2010 and 2018,
reaching 97.6 million in 2018, but per capita spending fell
by 42.9% to an average of $879.9.
Figure 5�19: Visitors to asia (million)
20
01
20
00
20
02
20
03
20
04
20
05
20
06
20
07
20
08
20
09
20
10
20
11
20
12
20
13
20
14
20
15
20
16
20
17
20
18
0
50
100
150
200
250
300
350
400
450
500
East Asia Southeast Asia Central Asia Oceania
South Asia Pacific Extraregional tourists
Source: ADB calculations using data from United Nations World Tourism Organization. Tourism Satellite Accounts. http://statistics.unwto.org/ (accessed October 2020).
55 Around 96% of extraregional visitors from other regions were visitors from Macau, China to the PRC.
Figure 5�20: tourism expenditure by asian economies
0
10
20
30
40
0
100
200
300
400
500
600
2010 2011 2012 2013 2014 2015 2016 2017 2018
%
bill
ion
PRC (left)
Japan (left)Korea, Republic of (left)
Other East Asia (left)Central Asia (left)
South Asia (left)Southeast Asia (left)
Oceania (left)Pacific (left)Asia’s share in world (right)
PRC = People’s Republic of China.
Sources: ADB calculations using data from World Bank. World Development Indicators Database. https://databank.worldbank.org/source/world-development-indicators (accessed October 2020); and United Nations World Tourism Organization (2020f).
asian Economic integration report 2021120
Asia’s international tourism receipts increased by 10.2%, to a record $411.2 billion in 2018.
Reflecting the robust growth in the number of visitors to
the region, international tourism receipts increased to
a record $411.2 billion in 2018. Global tourism brought
Figure 5�21: tourism expenditure per outbound tourist ($’000)
a: Asian Subregions b: Selected Asian Economies
0 1,000 2,000 3,000
Central Asia
Southeast Asia
Pacific
South Asia
East Asia
Oceania
Asia
2018 2015
0.0
0.5
1.0
1.5
2.0
2.5
3.0
3.5
2010 2011 2012 2013 2014 2015 2016 2017 2018
Australia GeorgiaKazakhstan JapanKorea, Republic of PhilippinesNew Zealand India
Note: 2018 data were not available for some economies with substantial tourism expenditures.
Sources: ADB calculations using data from United Nations World Tourism Organization. Tourism Satellite Accounts. http://statistics.untwo.org/ (accessed October 2020); United Nations World Tourism Organization (2020f); and World Bank. World Development Indicators. https://databank.worldbank.org/source/world-development-indicators (accessed October 2020).
in $1.6 trillion in international tourism receipts, 7.4%
more than in 2017. Europe (36.6%) and Asia (24.9%)
maintained their shares as the two largest recipients,
but tourism receipts to Asia grew 10.1%. (Figure 5.22).
Figure 5�22: international tourism Receipts by Major geographic Region, 2018
Europe, 36.6%
North America,
16.9%
Latin America,6.3%
Middle East,7.5% Africa, 3.5%
Other regions, 4.4%
CentralAsia,0.7%
East Asia,9.0%
Oceania,3.5%
South Asia,2.4%
Southeast Asia, 9.1%
Pacific, 0.1%
Asia, 24.9%
Total Receipts = $1.6 trillion
Sources: ADB calculations using data from International Monetary Fund (2019); United Nations World Tourism Organization (2020e, 2020f); and World Bank. World Development Indicators Database. https://databank.worldbank.org/source/world-development-indicators (accessed October 2020).
Movement of People 121
table 5�5: tourism arrivals and Receipts in asia by subregion, 2018
subregion
international tourism Receipts international arrivals
$ million % of total Asia million % of total Asia
Central Asia 12,208 3.0 32.2 7.3
East Asia 147,914 36.0 245.6 55.9
Oceania 58,288 14.2 13.0 3.0
Pacific 2,438 0.6 1.6 0.4
South Asia 39,895 9.7 15.4 3.5
Southeast Asia 150,369 36.6 131.7 30.0
total 411,112 100�0 439�5 100�0
Sources: ADB calculations using data from International Monetary Fund (2019); United Nations World Tourism Organization (UNWTO). Tourism Satellite Accounts. http://statistics.untwo.org/ (accessed September 2020); UNWTO (2020e and 2020f); and World Bank. World Development Indicators Database. https://databank.worldbank.org/source/world-development-indicators (accessed October 2020).
The upward trend in receipts particularly benefited
tourism-dependent economies in the Pacific and
Southeast Asia.
In 2018, receipts in all Asia’s subregions increased. The
two subregions with the largest shares of international
arrivals also earned the largest share of the region’s
tourism receipts—Southeast Asia (36.6%) and East
Asia (36.0%) (Table 5.5). In Southeast Asia, Thailand
received the highest share ($65.2 billion), while
Cambodia ($4.8 billion) had the highest y-o-y growth
(20.1%). In East Asia, Japan reported both the highest
tourism receipts ($45.3 billion) and growth (22.4%).
Oceania had fewer but relatively high value tourists—most
visitors to Oceania are from countries with relatively high
tourism expenditures. In 2018, the PRC was Australia’s
biggest source of tourists followed by New Zealand, the US,
the UK, Japan, and Singapore. New Zealand had a similar
pattern of tourists from developed countries, with 40%
from Australia and the next 30% from the PRC, the US, the
UK and Germany.
In terms of the largest absolute contribution of tourism
receipts to GDP, Thailand ranked first with $65.2 billion,
followed by Australia and Japan (Figure 5.23a). As a
share of tourism receipts in GDP, Maldives was the most
tourism-dependent economy in Asia, deriving 57.4%
of its 2018 GDP from tourism (Figure 5.23b). Tourism
receipts are important to many countries in the Pacific,
averaging at least 16% of GDP. In Central Asia, tourism
income was proportional to 20% of GDP in Georgia and
9.9% in Armenia. In Cambodia and Thailand, tourism also
contributes a significant share of GDP.
Tourism receipts per visitor arrival varied across subregions.
International tourism receipts per international visitor rose
3.0% to $956.2 in 2018 but differed across subregions
(Figure 5.24). Oceania earned the most per arrival in 2018
at $4,472.8, as Australia ($5,120.8) ranked first in tourism
receipts per arrival in the region. The second highest per
capita income in the region was South Asia at $2,506.7—
India ($2,767.3), Sri Lanka ($2,403.0), and Maldives
($2,058.6) contributed to the high level of per capita
receipts in the subregion. In contrast, Central Asia recorded
the lowest earnings per arrival at $379.0 in 2018. Among the
countries in Central Asia, the Kyrgyz Republic had the lowest
receipts per arrival at $70.4, which was only 7.4% of Asia’s
average. Nevertheless, the subregion is tapping its strong
potential to promote safe, sustainable, and inclusive tourism
under the CAREC Tourism Strategy 2030. This includes
regional initiatives for improved advertising and branding,
additional investments in tourism services and critical
infrastructure, jointly developing tourist products, and
advocating harmonization and relaxation of visa regimes.56
56 CAREC Program. https://www.carecprogram.org (accessed December 2020).
asian Economic integration report 2021122
Figure 5.23: Top 10 Recipients of Tourism Receipts, 2018
a: $ billion b: Share of GDP (%)
0 20 40 60 80
Indonesia
Republic of Korea
Singapore
Malaysia
India
PRC
Hong Kong, China
Japan
Australia
Thailand
0 20 40 60 80
Armenia
Hong Kong, China
Thailand
Cambodia
Georgia
Samoa
Fiji
Vanuatu
Palau
Maldives
GDP = gross domestic product, PRC = People’s Republic of China.
Note: Some economies with incomplete or no time-series data on international tourism receipts (such as Federated States of Micronesia; Niue; Taipei,China; Turkmenistan; and Tuvalu) were not included in the data set used to generate these charts.
Sources: ADB calculations using data from International Monetary Fund. World Economic Outlook Database. https://www.imf.org/en/Publications/WEO/weo-database/2020/October (accessed November 2020); International Monetary Fund (2019); UNWTO (2020f); and World Bank. World Development Indicators. https://databank.worldbank.org/source/world-development-indicators (accessed October 2020).
Comparing 2018 with 2015, receipts per arrival in Asia
slightly declined by 1.6%—tourism revenues per visitor
arrival fell by 14.7% in Central Asia and 8.7% in East Asia,
Figure 5.24: Tourism Receipts per Arrival
a: Asian Subregions ($) b: Selected Asian Economies ($‘000)
0 1,000 2,000 3,000 4,000 5,000
Central Asia
East Asia
Southeast Asia
Pacific
South Asia
Oceania
Asia
2018 2015
0
1
2
3
4
5
6
7
2010 2011 2012 2013 2014 2015 2016 2017 2018
Georgia PRCRepublic of Korea JapanAustralia FijiThailand IndiaSri Lanka
PRC = People’s Republic of China.
Sources: ADB calculations using data from International Monetary Fund (2019); United Nations World Tourism Organization (UNWTO). Tourism Satellite Accounts. http://statistics.untwo.org/ (accessed September 2020); UNWTO (2020e, 2020f); and World Bank. World Development Indicators Database. https://databank.worldbank.org/source/world-development-indicators (accessed October 2020).
despite rising numbers of international arrivals. This
could be due to changing travel behavior involving more
frequent budget trips that last for shorter periods.
Movement of People 123
Prior to the COVID-19 pandemic, tourism was an important driver of income for many economies.
According to the World Travel and Tourism Council
(WTTC) (2020), tourism contributed $8.9 trillion to
global GDP and accounted for 28.3% of global services
exports. As the tourism sector spans various industries—
including transportation, accommodation, and food—it
has generated large amounts of employment and
business. The WTTC estimates that around 330 million
people were employed in the sector and accounted for
one in every four new jobs created in the 5 years prior to
COVID-19 (WTTC 2020).
57 As noted by Lemma (2014) and Faber and Gaubert (2019), despite the important and fast-growing role of the tourism sector, the link between tourism and development outcomes remains understudied, especially in developing countries.
box 5�2: tourism dependency of the Pacific
The Pacific is particularly dependent on tourism for jobs and growth. In the case of Palau, tourism employment accounts for almost half of the island’s total employment. In the Cook Islands and Niue, a third of those employed work in the tourism sector, making substantial contributions to GDP. Papua New Guinea is the Pacific country that is least dependent on tourism, as both tourism employment and receipts hover at just 1%.
The box figure shows that Samoa and Vanuatu enjoy high levels of receipts, considering their moderate tourism employment rates. Fiji has the greatest number of international tourists among the Pacific island countries, accounting for approximately half of total visitors. Prior to the COVID-19 pandemic, the Fijian government recognized tourism as a pillar in the country’s National Development Plan—it targeted tourism industry growth from $1.9 billion in 2017 to $2.2 billion by the end of 2021.a
FSM = Federated States of Micronesia, GDP = gross domestic product.
a Government of Fiji, Ministry of Commerce, Trade, Tourism & Transport. https://www.mcttt.gov.fj/divisions/tourism-unit/programmes/fijian-tourism-2021/ (accessed October 2020).
Notes: Calculations were done using latest available data for employment (2014 for the FSM and Nauru; 2015 for the Marshall Islands and Samoa; 2016 for the Cook Islands and Tuvalu; 2017 for Kiribati and Solomon Islands; and 2018 for Fiji, Niue, Palau, Papua New Guinea, Tonga, and Vanuatu).
Sources: ADB calculations using data from South Pacific Tourism Organization (2019, 2020); and World Bank. World Development Indicators. https://databank.worldbank.org/source/world-development-indicators (accessed October 2020).
Contribution of tourism to employment and gdP in the Pacific
010203040506070
0
10
20
30
40
50
Co
ok
Isla
nd
s
Fiji
Kir
ibat
i
Mar
shal
l Isl
and
s
FS
M
Nau
ru
Niu
e
Pal
au
Pap
ua
New
Gu
inea
Sam
oa
So
lom
on
Isl
and
s
To
nga
Tu
valu
Van
uat
u
% o
f G
DP
% o
f to
tal
emp
loym
ent
Tourism employment to total employment (left)
Contribution of tourism receipts to GDP (right)
Many Asian economies counted on the tourism sector
not only for its effect on income and jobs, but also
for its impact on poverty reduction—and tourism’s
ability to raise the level of community engagement and
social integration (Box 5.2). An ILO (2020b) study
using selected countries in Asia indicated that tourism
employment accounts for 5.1% of total employment
(5.9% among women and 4.7% among men). In Fiji,
where tourism contributes significantly to GDP, tourism’s
share in total employment was 10.2%; in Samoa, it was
12.2%. By providing jobs and income opportunities to the
informal sector, tourism also helps alleviate poverty.57
asian Economic integration report 2021124
Tourism has also triggered the development of large
infrastructure projects with positive spillover effects
across sectors and beyond borders. For example, to meet
increasing tourism demand, Solomon Islands has a long
pipeline of priority projects for improved airports, roads,
wharves, water and sanitation, solid waste management,
energy, and information and communication technology.
In Papua New Guinea, ADB financed a comprehensive
national airport development program to expand safe
and secure access to centers throughout the country that
are inaccessible by road (Everett, Simpson, and Wayne
2018). Tourism development has played an integral part
in the national strategic development framework of many
economies in the region, especially those where tourism
receipts are significant, either in absolute terms or as a
proportion of GDP (see Figure 5.24).
Reviving and Rebuilding the Tourism Sector
The COVID-19 pandemic has hit tourism particularly hard with governments struggling to provide a lifeline for the sector.
Tourism has been one of the most severely hit sectors by
the COVID-19 pandemic. With the end of the pandemic
not yet in sight, it is highly unlikely tourism will recover
in 2021. IATA (2020c) estimates international flights
to reach precrisis levels no earlier than 2024. With
estimates of up to 120 million direct tourism jobs at
risk, $900 billion to $1.2 trillion in export earnings, and
a global GDP loss ranging from 1.5% to 2.8% (UNWTO
2020g), the stakes in successfully restarting the tourism
sector are very high.
box 5�3: government Measures to support tourism in selected adb developing Members
Tourism is important for many economies in Asia. Governments in the region have used stimulus packages to mitigate the pandemic impact and assist businesses and workers in the travel and tourism industry:
The Government of Cambodia has implemented measures to support the tourism industry and its workers, including tax breaks, tax exemptions, and financial aid. It allocated up to $2.0 billion to combat the economic disruption caused by the coronavirus disease (COVID-19) outbreak. Suspended employees from the tourism sector were eligible to receive a monthly subsidy ranging from $15 to $40. Hotels, guesthouses, restaurants, and travel agencies in Phnom Penh, Siem Reap, Sihanoukville, Kep, Kampot, and Bavet, were exempted from paying taxes until the end of 2020. The government is also paying 20% of the minimum wage of hospitality workers. Workers are required to attend a short course delivered by the Ministry of Tourism before payments can be made through the National Social Security Fund. Also, the government granted tax exemptions to airlines until December 2020.
In georgia, the government prepared an economic stimulus package worth GEL1.0 billion (~$330.0 million) in response to the negative COVID-19 impact on the economy—which includes infrastructure spending and tax exemptions until November 2020 to aid the tourism industry (about GEL100.0 million (~$33.0 million).
Tourism-related businesses are exempt from property and income taxes, covering about 18,000 companies and more than 50,000 employees. Georgia’s Tourism Recovery and Anti-Crisis Plan includes support for tax deferment and tax exemption for businesses, and allowances and subsidies for employees. Banks are restructuring the debts of individuals and businesses, especially those in tourism. Interest rate subsidies, bank guarantees, and credit guarantees are also designed for tour operators, hotels, food and beverage business, travel agencies and guides.
In indonesia, the government has applied fiscal measures for all sectors, including tourism: a 6-month tax break for employees and companies starting April 2020; delay of individual and corporate income tax collection to stimulate the economy; and income tax relief for workers in specific sectors. In October 2020, the Tourism and Creative Economy Minister committed to disburse Rp3.3 trillion (~$224.0 million) in grants for tourism-related businesses and local administrations to counter the impact of the COVID-19 pandemic. Of the allocated grants, 70% will be for businesses with the remaining 30% for local administrations.
The Republic of korea made available W300 billion (~$243.0 million) to support the tourism sector. As part of the program, the government allocated W100 billion (~$81.0 million) to provide access to temporary
continued on next page
Movement of People 125
box 5�3: government Measures to support tourism in selected adb developing Members (continued)
Sources: Medina (2020a, 2020b, 2020c, 2020d, 2020e, and 2020f); Organisation for Economic Co-operation and Development (2020); Parama (2020); and United Nations World Tourism Organization (2020d).
unsecured low interest loans for small and medium-sized tourism companies. In addition, it has granted loan extensions or deferments for 1 year on previous loans up to a total of W200 billion (~$162.0 million). Other financial, fiscal, and tax relief measures for the tourism sector include an emergency relief fund for affected small and medium-sized enterprises (SMEs), tax cuts for businesses, and employment support. To encourage local tourism, the government issued domestic travel and tourism vouchers, and increased the “vacation bonus subsidy” program.
In Malaysia, the government launched three economic stimulus packages worth RM260.0 billion (~$59.9 billion) to fulfill three main strategies of protecting social welfare, supporting businesses, and strengthening the economy. Initiatives that target tourism-related businesses include moratoriums on loans, postponement of monthly tax installments, exemption from payment of service tax, discounts up to 50% on monthly electricity bills, additional tax deductions for training expenses, and deferment of income tax installment payments for SMEs. To boost domestic tourism, the government provided travel discount vouchers in partnership with airlines, resorts, and hotels worth RM100 (~$22) per visitor, and offered an individual income tax relief worth RM1,000 (~$226) per visitor for expenses at tourist attractions and accommodation registered with the Ministry of Tourism.
The Government of samoa launched a stimulus package to assist the tourism sector to cope with the unprecedented impact of the COVID-19 pandemic, such as freezing payments for the Samoa National Provident Fund (SNPF) worth ST2.6 million (~$1.0 million) and the Accident Compensation Corporation (ACC) worth ST1.0 million (~$400,000) for 6 months. Under the
SNPF, its assistance includes postponing contribution payments for employers in the hospitality sector. ACC assistance includes a 50% reduction in hotels’ daily fixed rate, exemption from paying rent for all businesses operating within the Faleolo Airport, provision of interest relief on loans, extension of due dates on income taxes, and waiving registration and late fees for transport.
In thailand, the government issued stimulus packages worth B22.4 billion (~$718.0 million) to support the tourism industry. The initiatives are named “We Travel Together” and “Moral Support.” Available from July to October 2020, benefits include subsidized hotel accommodation, airline tickets, car rental fees, bus fares, and facilities in tourist destinations around the country. A total of B20.0 billion (~$641.0 million) was allocated under the “We Travel Together” stimulus package. Some B18.0 million (~$577.0 million) was set aside to subsidize 40% of normal room rates at hotels to eligible travelers, capped at B3,000 (~$96) per night for up to five nights. The other B2.0 million (~$64.0 million) is to subsidize 2 million airline tickets, priced at B2.0 (~$64) per person. The government also allocated B2.4 billion (~$77.0 million) for its “Moral Support” stimulus package, aimed to fund holiday travel expenses of around 1.2 million health workers and volunteers from sub-district hospitals. The subsidy is limited to B2,000 (~$64) per person for a 2-day and 1-night trip. Additionally, the government launched special tourist visas (STV), which allows foreign tourists to stay in Thailand for more than 200 days, as long as they abide by health protocols and insurance requirements. STV applications started in October 2020 and are scheduled to end in September 2021. The government aims to attract 1,200 tourists each month, generating some B12.0 billion (~$380.0 million) in revenue.
Governments are using various fiscal, monetary, and
industry-specific measures to help their economies
cope with the socioeconomic impact of the pandemic—
and its impact on tourism (Box 5.3). Despite these
substantive efforts, it is unlikely that the entire tourism
sector will be able to revive until the end of the
pandemic. And it will likely shrink as some businesses
will be unable to survive. One important government
objective should be to maintain a critical level of tourism
infrastructure so the sector can bounce back quickly
once demand returns.
asian Economic integration report 2021126
Governments should use a phased approach for tourism recovery.
With the priority to protect the health of travelers and
residents, governments have little choice but to rebuild
tourism in stages: (i) by promoting domestic tourism;
(ii) then by establishing green corridors (or “bubbles”)
that allow safe travel between partners; and (iii) finally,
a full return to international travel. Here we analyze this
phased approach.
Jumpstarting Domestic Tourism to Reboot the Tourism Sector
Many governments have started to promote domestic
tourism, mainly by providing subsidies for domestic
tourists. Stimulating domestic tourism typically
responds to actual demand, as many people still yearn
to travel but prefer to stay closer to home and avoid
mass transportation. Furthermore, international travel
restrictions have made it difficult to visit foreign countries.
Early evidence, however, shows that fully mobilizing all
outbound travelers to vacation within the country can
be difficult. First, in several countries, local lockdowns—
such as those previously in Metro Manila, Philippines,
and Melbourne, Australia—make it impossible to travel
domestically. Second, due to the severe economic
downturn and heavy job losses, overall demand for
tourism has declined. One also needs to note that the
tourism industry is often no longer able to operate at full
capacity due to social distancing and other containment
measures. This includes actions such as urging airlines
to keep middle seats empty. Furthermore, in analyzing
demand, some travelers may have lost interest in
domestic destinations, and are more interested in
exploring new places abroad. Domestic tourism might
also be limited by the fact that some people might not
want to travel at all because of fear of infection.
Another limitation of domestic tourism might be a
mismatch between international and domestic demand.
Some countries had been successful in attracting high-
income travelers from abroad before the pandemic.
However, those international travelers are no longer
visiting, and the number of domestic tourists able to
afford high-end tourism services might be limited. In the
worst case, domestic tourist demand for lower cost travel
services might go unmet.
In summary, as domestic tourism is relatively easier
to promote than international tourism, it has become
a short-term objective for many governments in the
region (Box 5.4). In some economies where the number
of foreign tourists exceeds the number of outbound
tourists, stimulating domestic tourism has proven a
viable strategy to help the industry survive. For example,
in the Republic of Korea, 2020 has seen a boom in
domestic tourism, especially during times when new
COVID-19 cases were low. During May 2020, the
number of tourists almost reached the 2019 level, when
both domestic and international tourists could visit.
Similarly, in Viet Nam, domestic tourism has shown a
clear upward trend since the lockdown was eased on
11 May 2020. However, in countries with a large surplus
in tourism infrastructure, domestic tourism, even if fully
mobilized, is not enough. Governments then need to
decide on how best to support the sector.
Establishing Travel Bubbles
In the second stage, many governments have tried to restart
tourism by establishing so-called travel bubbles or green
corridors. Travel bubbles are agreements to open borders
to the nationals of the partner economy. Travel bubbles
can be for business travel only or also include leisure travel.
They often specify provisions on health protocols that
need to be followed when leaving and entering the territory.
Access can be reciprocal or unilateral. They can be formed
between two or more partners.
The first travel bubble in Asia was established between the
PRC and the Republic of Korea in early May 2020. The
agreement is limited to business travelers, who need to be
invited by a company in the other country. And they need to
follow a strict health protocol. After this first travel bubble,
several others have followed with similar arrangements
allowing for essential travel. The exact definition of essential
travel varies and can include diplomats, commuters, or
expatriates (Table 5.6). As only a limited number of visitors
qualify for travel under these arrangements, the increase in
international arrivals has so far been small.
Movement of People 127
box 5�4: the Potential of domestic tourism and travel bubbles
To gauge the potential of domestic tourism and travel bubbles, Helble and Fink (2020) provide a detailed scenario analysis. To gauge the potential of domestic tourism, they assume that due to the pandemic all tourists that traveled internationally in 2018 would decide to vacation in their home country. As box figure 1 illustrates the results and shows that across Asia, in more than half the cases, domestic tourism technically has the potential to fully replace foreign visitors. For
example, in Armenia, before the pandemic, outbound tourists exceeded the number of inbound foreign tourists by 30%. Armenia thus stands a good chance to fill a substantial part of the gap left by international tourists by domestic guests. However, in economies that are highly dependent on tourism, such as Fiji, Maldives, or Thailand, domestic tourism, even when fully mobilized, will not be enough.
1: scenario analysis of domestic Replacing Foreign tourists, based on number of tourists (%)
-100
-80
-60
-40
-20
0
20
40
60
80
100
Arm
enia
Aze
rbai
jan
Geo
rgia
Kaz
akh
stan
Kyr
gyz
Rep
ub
licT
ajik
ista
nU
zbek
ista
nP
RC
Ho
ng
Ko
ng,
Ch
ina
Jap
anR
epu
blic
of
Ko
rea
Mo
ngo
liaT
aip
ei,C
hin
aA
ust
ralia
Co
ok
Isla
nd
sF
ijiK
irib
ati
Mar
shal
l Isl
and
sF
SM
New
Zea
lan
dP
alau
Pap
ua
New
Gu
inea
Sam
oa
So
lom
on
Isl
and
sT
on
gaT
uva
luV
anu
atu
Ban
glad
esh
Bh
uta
nIn
dia
Mal
div
esN
epal
Sri
Lan
kaB
run
ei D
aru
ssal
amC
amb
od
iaIn
do
nes
iaL
ao P
DR
Mya
nm
arM
alay
sia
Ph
ilip
pin
esS
inga
po
reT
imo
r-L
este
Th
aila
nd
Vie
t N
am
Central Asia East Asia The Pacific and Oceania South Asia Southeast Asia
FSM = Federated States of Micronesia, Lao PDR = Lao People’s Democratic Republic, PRC = People’s Republic of China.
Note: These are ratios of difference between domestic tourist departures and international tourist arrivals, to international tourist arrivals. Using data from 2018 tourist arrivals, a value of zero suggests an economy’s domestic tourists are sufficient to compensate for international tourist arrivals. Economies with green bars indicate the potential of domestic tourism is higher than the gap left by the absence of international tourists. Economies including Bangladesh; Brunei Darussalam; Hong Kong, China; Mongolia; Myanmar; the Republic of Korea; Tajikistan; Timor-Leste; and Tuvalu have values that surpass 100%, suggesting these economies’ domestic tourists were more than double their international tourists in 2018. Economies with red bars indicate a gap in arrivals even with mobilization of domestic tourists.
Source: Helble and Fink (2020).
To estimate the potential of travel bubbles, Helble and Fink (2020) assume that such agreements would allow travelers to move in both directions and that the volume would reach the pre-pandemic level and that all bubbles would happen simultaneously. If one country, such as the People’s Republic of China (PRC), is the largest source
of tourists for various partners, the tourist flows would reach the 2018 level across all pairs (box figure 2).
Bilateral travel bubbles obviously help most economies highly dependent on tourism from one source country. For example, the gap for Fiji would drop from 84% to 44% if it entered a bilateral agreement with Australia.
continued on next page
asian Economic integration report 2021128
box 5�4: the Potential of domestic tourism and travel bubbles (continued)
Thailand would see an improvement from –68% to –46% if it established an agreement with the PRC. While these are significant improvements, they still leave these economies with large deficits. In addition, it is unlikely that bilateral tourism would quickly reach precrisis levels.
As with domestic tourism, social distancing and other containment measures would limit supply. Furthermore, traveling in bubbles often requires multiple testing, which comes at a cost that deters some people from traveling abroad.
2: scenario analysis of tourism bubble with largest Partner, based on number of tourists (%)
-2
-4
111
-1
128
1,3
50
48
3
319
-100
-80
-60
-40
-20
0
20
40
60
80
100
Arm
enia
–R
uss
ian
Fed
erat
ion
Aze
rbai
jan
–R
uss
ian
Fed
erat
ion
Geo
rgia
–A
zerb
aija
nK
azak
hst
an–
Uzb
ekis
tan
Kyr
gyz
Rep
ub
lic–
Uzb
ekis
tan
Taj
ikis
tan
–U
zbek
ista
nU
zbek
ista
n–
Kaz
akh
stan
PR
C–
Ho
ng
Ko
ng,
Ch
ina
Ho
ng
Ko
ng,
Ch
ina–
PR
CJa
pan
–P
RC
Rep
ub
lic o
f K
ore
a–P
RC
Mo
ngo
lia–
PR
CT
aip
ei,C
hin
a–P
RC
Au
stra
lia–
PR
CC
oo
k Is
lan
ds–
New
Zea
lan
dF
iji–
Au
stra
liaK
irib
ati–
Au
stra
liaM
arsh
all I
slan
ds–
Un
ited
Sta
tes
FS
M–
Un
ited
Sta
tes
New
Zea
lan
d–
Au
stra
liaP
alau
–P
RC
Pap
ua
New
Gu
inea
–A
ust
ralia
Sam
oa–
New
Zea
lan
dS
olo
mo
n I
slan
ds–
Au
stra
liaT
on
ga–
New
Zea
lan
dT
uva
lu–
Au
stra
liaV
anu
atu
–A
ust
ralia
Ban
glad
esh
–In
dia
Bh
uta
n–
Un
ited
Sta
tes
Ind
ia–
Ban
glad
esh
Mal
div
es–
PR
CN
epal
–In
dia
Sri
Lan
ka–
Ind
iaB
run
ei D
aru
ssal
am–
PR
CC
amb
od
ia–
PR
CIn
do
nes
ia–
Mal
aysi
aL
ao P
DR
–T
hai
lan
dM
yan
mar
–T
hai
lan
dM
alay
sia–
Sin
gap
ore
Ph
ilip
pin
es–
Rep
ub
lic o
f K
ore
aS
inga
po
re–
PR
CT
imo
r-L
este
–In
do
nes
iaT
hai
lan
d–
PR
CV
iet
Nam
–P
RC
Central Asia East Asia Oceania and Pacific South Asia Southeast Asia
FSM = Federated States of Micronesia, Lao PDR = Lao People’s Democratic Republic, PRC = People’s Republic of China.
Notes:
(i) Using 2018 data, in this scenario we assumed that domestic tourists who would otherwise leave the economy would stay at home. We then got the difference between international tourist arrivals, and the sum of inbound tourists from the economy’s preferred partner and its own domestic tourists. We then divided this figure by the total international tourist arrivals to get the ratio. (ii) The green bars indicate by how much the combined domestics tourists from an economy and its preferred partner would surpass the number of international tourists. Some economies and their preferred—including Bangladesh, Brunei Darussalam, the Marshall Islands, the Republic of Korea, Tuvalu, Myanmar—have values that surpass 100%, which suggests that their combined tourists are more than double their 2018 international tourist arrivals. Economies with red bars indicate a gap in arrivals, even with mobilization of domestic tourists and arrivals from their preferred partner.(iii) Arrival data for 2017 were used for the Marshall Islands, Tonga, and Tuvalu, while 2016 was used for the FSM and 2014 for Bangladesh. There was no arrival data available for Afghanistan, Pakistan, Turkmenistan, and Tuvalu for any year.
Source: Helble and Fink (2020).
Movement of People 129
table 5�6: travel bubbles in asia
economies involved (type of agreement)
effective date
Purposetesting
Requirements
Quarantine Requirement
sponsor needed
Contact- tracing
appbusiness/
official leisurebefore
departureupon
arrival
PRC–Republic of korea 1 May 20 √ √ √ Wait until negative test result
√
PRC–singapore 8 Jun 20 √ √ √ Wait until negative test result
Notes:(i) The Reciprocal Green Lane and Travel Corridor Arrangement are reserved for short, business-related travel.(ii) The Periodic Commuting Arrangement is especially for Singapore or Malaysian citizens with working visa who previously frequently crossed the Johor–Singapore
border. Under this arrangement, the workers must spend 90 days in the country of work before they can return home.(iii) Residence Track, usually used by bubbles involving Japan, is for noncitizen long-term residents with working visa, including their families.(iv) Business Track, usually used by bubbles involving Japan, is for short business trips.(v) Testing requirements refer to the COVID-19 polymerase chain reaction (PCR) test. Time allowed to take the test prior to departure varies between bubbles.(vi) Quarantine requirement refers to quarantine upon arrival. “Wait until negative test result” indicates the number of days required to wait in isolation for the result of
the PCR test to become available. Travelers wait in either a self-sourced or government provided location.(vii) Sponsor refers to a business or government agency who would need to sponsor documents such as a travel pass or visa that would grant entry into the country.(viii) The Australia–New Zealand Bubble only opens travel in one direction—from New Zealand to Australia. Travelers to Australia can only visit New South Wales and
the Northern Territory which are considered as safe travel zones. Upon return to New Zealand, the traveler will be subject to a COVID-19 PCR test and 14-day quarantine in a government facility.
Sources: Government of Australia, Department of Home Affairs. https://covid19.homeaffairs.gov.au; Government of Brunei Darussalam, Ministry of Foreign Affairs. http://www.mfa.gov.bn/Shared%20Documents/Annex.pdf; Government of Cambodia, Ministry of Foreign Affairs and International Cooperation. http://www.cambodianembassy.jp/web2/; Government of Indonesia, Ministry of Foreign Affairs. https://kemlu.go.id/singapore/id; Government of Japan, Ministry of Foreign Affairs. https://www.mofa.go.jp; Government of the Lao PDR, Ministry of Foreign Affairs. http://www.mofa.gov.la; Government of Malaysia, Immigration Department of Malaysia. https://www.imi.gov.my/; Government of New Zealand, Ministry of Business, Innovation and Employment. https://www.immigration.govt.nz/; Government of the People’s Republic of China, Ministry of Foreign Affairs of the People’s Republic of China. https://www.fmprc.gov.cn/mfa_eng/; Government of the Republic of Korea, Ministry of Foreign Affairs. http://www.mofa.go.kr/eng/ and http://overseas.mofa.go.kr/sg-en/index.do; Government of Singapore, Ministry of Foreign Affairs. https://safetravel.ica.gov.sg; Government of Thailand, Ministry of Foreign Affairs. http://site.thaiembassy.jp/en/; and Government of Viet Nam, Ministry of Foreign Affairs. https://vnembassy-jp.org/en/ (all accessed November 2020).
asian Economic integration report 2021130
Economic incentives and trust between partners
have proven the decisive factors in establishing travel
bubbles. Particularly interesting is the arrangement
between Singapore and Malaysia. Because of geographic
proximity and close economic ties, these two economies
agreed on a so-called Periodic Commuting Arrangement
for workers who regularly cross the border. However,
the arrangement does not allow for a daily commute,
but those who cross will have to spend at least 90 days
in their country of employment before they can return
home. Overall, the reciprocal travel arrangements
signed so far show that economic considerations
beyond tourism have become the primary driving
force (Table 5.6).
Negotiations on establishing travel bubbles that would
allow for leisure travel started in mid-2020. For example,
Australia and New Zealand initiated negotiations on
a “Trans-Tasman” travel bubble. Given the strong
economic and cultural links between the two countries,
the agreement was expected to boost tourism in both
economies. However, the negotiations stalled due to a
COVID-19 outbreak in the Australian state of Victoria in
June 2020. In October 2020, authorities agreed to open
a quarantine-free, one-way corridor from New Zealand
to limited parts of Australia. In a similar effort to open
borders to leisure tourists, Fiji’s government proposed to
form a travel bubble with Australia and New Zealand the
so-called “Bula bubble” in June 2020. Recurrent waves
of coronavirus infections have been a common tipping
point for these travel negotiations to advance.
One critical requirement to establish travel bubbles
is that the pandemic is under control across partner
countries. While some governments were able to quickly
limit the pandemic spread, others have struggled or
continue to struggle to contain the disease. Recently,
some countries were also confronted with a second wave
of infections. Apart from public health considerations,
the epidemiological situation affects a tourist’s
willingness to travel and a country’s willingness to receive
tourists. The opportunity to open bilateral tourism
typically only arises once both parties are well beyond
their peak of new infections.
In addition to the epidemiological situation, pandemic
preparedness is another important consideration for
tourists. As new outbreaks can never be excluded,
countries need to demonstrate their capacity to handle
them when they do. However, pandemic preparedness
varies significantly. As of October 2020, very few
countries in the region could demonstrate both: a full
control of new infections as well as adequate pandemic
preparedness. This is the main reason that, despite the
strong interest in travel bubbles, few have materialized so
far and the ones agreed upon cover only essential travel.
In sum, restoring public trust in safe travel is key to reviving Asia’s tourism sector; by promoting coordinated, seamlessly executed, responsible, and safety-oriented travel measures, multilateral development banks such as ADB, regional cooperation initiatives, as well as regional policy forums and dialogues can help bring back tourism’s long-term sustainable potential.
The results of an IATA (2020a) survey revealed that
fear of catching the virus while traveling is a major
factor keeping them from returning to their old travel
habits—only 45% expressed interest in traveling again
once the pandemic subsides, while 64% will postpone


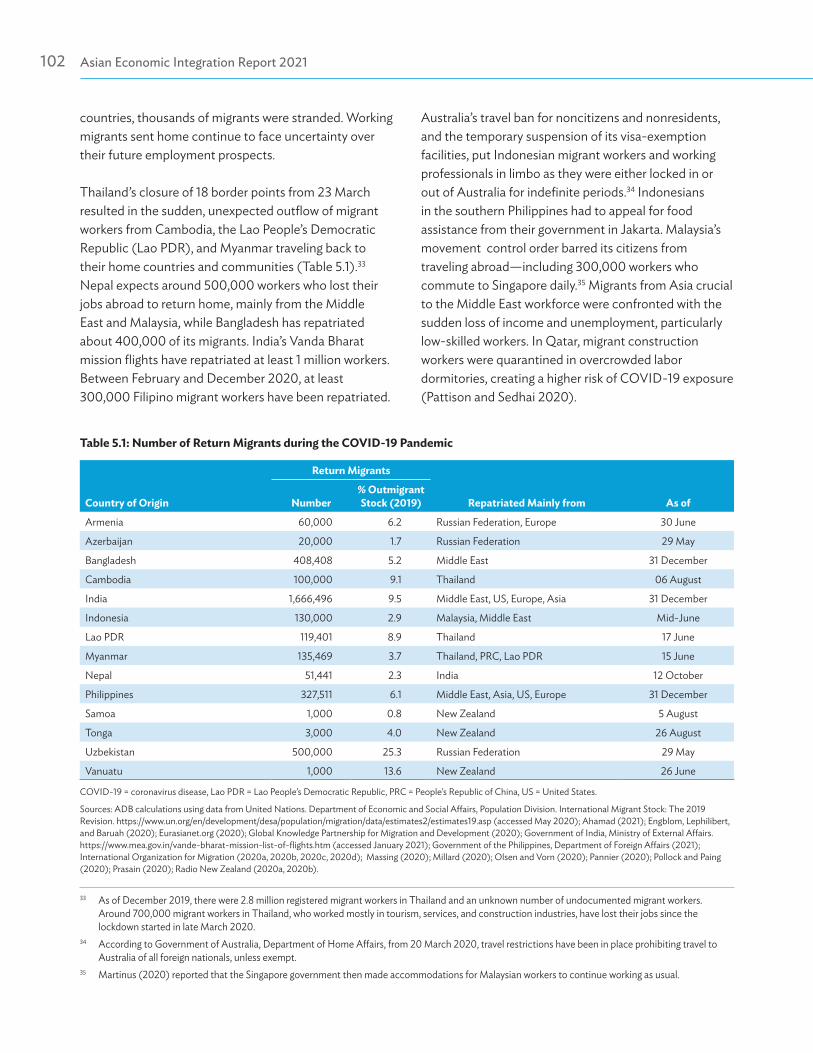


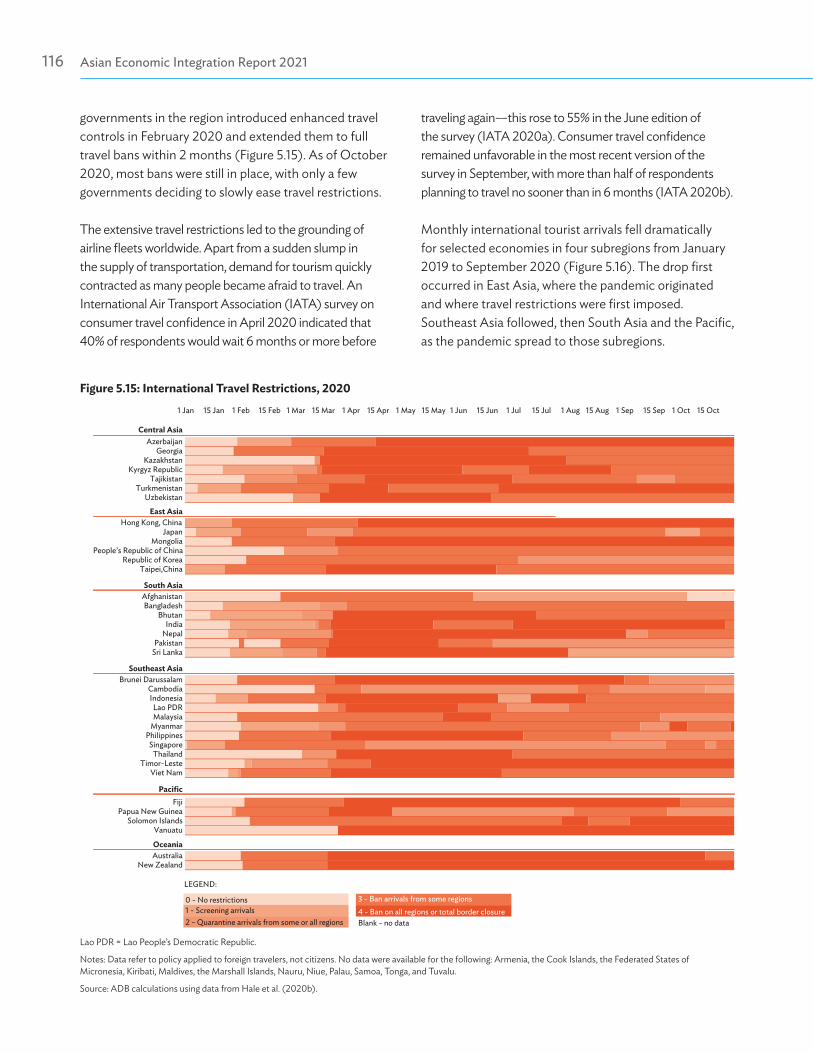

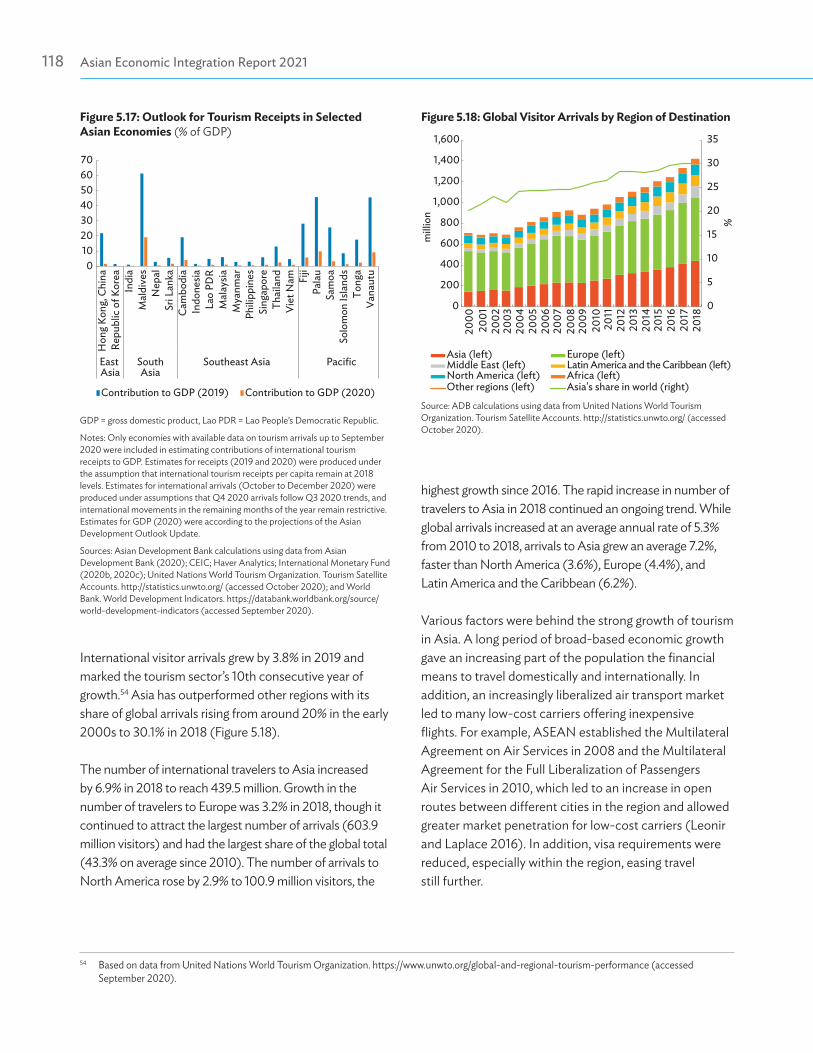


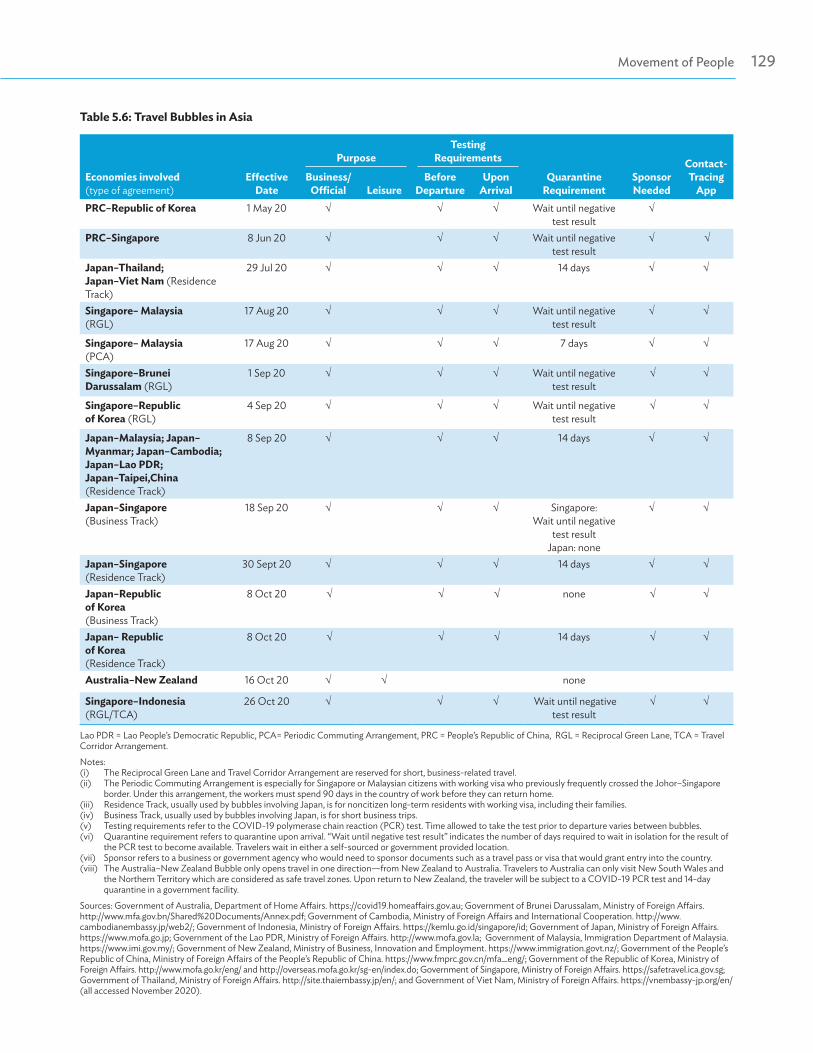


![Edinburgh Research Explorer - COnnecting REpositories · gates, work with recombinant virus still requires the use of high containment facilities [23]. With the recent addition to](https://static.documents.pub/doc/80x56/5e9decf53ff3dd568740bb3f/edinburgh-research-explorer-connecting-repositories-gates-work-with-recombinant.jpg)


