20
1 Chapter 2 Chapter 2 Financial Statements, Taxes and Cash Flow 2- 1
| Date post: | 30-Dec-2015 |
| Category: |
Documents |
| Upload: | lynette-dixon |
| View: | 219 times |
| Download: | 1 times |
6-1
Chapter 2Chapter 2
Financial Statements,Taxes and Cash Flow
Financial Statements,Taxes and Cash Flow
2-1
6-2
Chapter ObjectivesChapter ObjectivesChapter ObjectivesChapter Objectives
Understand the difference between book value (from the Balance Sheet) and market value.
Understand the difference between net profit (from the Income Statement) and cash flow.
Explain the differences between the average tax rate, the marginal tax rate and the flat rate.
Explain the calculation of cash flow from assets, and cash flow to debt-holders and shareholders.
2-2
6-3
A summary of a firm’s financial position on a given date that shows total assets = total liabilities + owners’ equity.
Equation: Assets = Liabilities + Owners’/Shareholders’ Equity.
Net working capital = Current Assets – Current Liabilities.
The Balance SheetThe Balance SheetThe Balance SheetThe Balance Sheet
2-3
6-4
Petro Rabighs’ Balance Petro Rabighs’ Balance Sheet (Asset Side)Sheet (Asset Side)Petro Rabighs’ Balance Petro Rabighs’ Balance Sheet (Asset Side)Sheet (Asset Side)
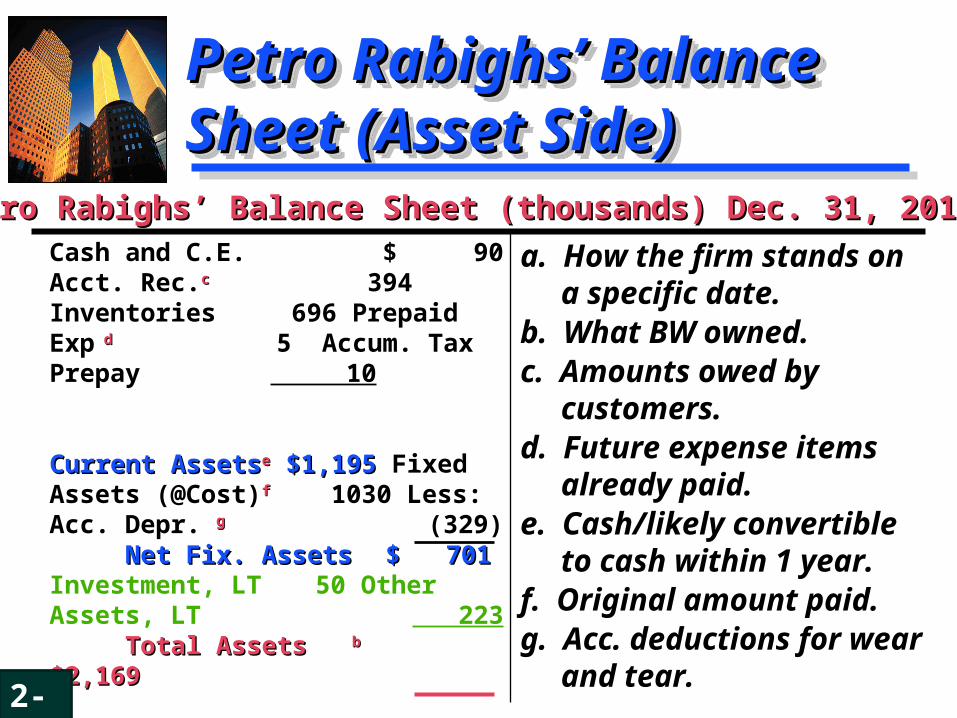
a. How the firm stands on a specific date.
b. What BW owned.c. Amounts owed by
customers.d. Future expense items
already paid.e. Cash/likely convertible
to cash within 1 year.f. Original amount paid.g. Acc. deductions for
wear and tear.
a. How the firm stands on a specific date.
b. What BW owned.c. Amounts owed by
customers.d. Future expense items
already paid.e. Cash/likely convertible
to cash within 1 year.f. Original amount paid.g. Acc. deductions for
wear and tear.
Cash and C.E. $ 90 Acct. Rec.cc 394 Inventories 696 Prepaid Exp dd 5 Accum. Tax Prepay 10 Current AssetsCurrent Assetsee $1,195 $1,195 Fixed Assets (@Cost)ff 1030 Less: Acc. Depr. gg (329)
Net Fix. AssetsNet Fix. Assets $ 701 $ 701 Investment, LT 50 Other Assets, LT 223
Total AssetsTotal Assetsbb $2,169 $2,169
Petro Rabighs’ Balance Sheet (thousands) Dec. 31, 2014Petro Rabighs’ Balance Sheet (thousands) Dec. 31, 2014a
2-4
6-5
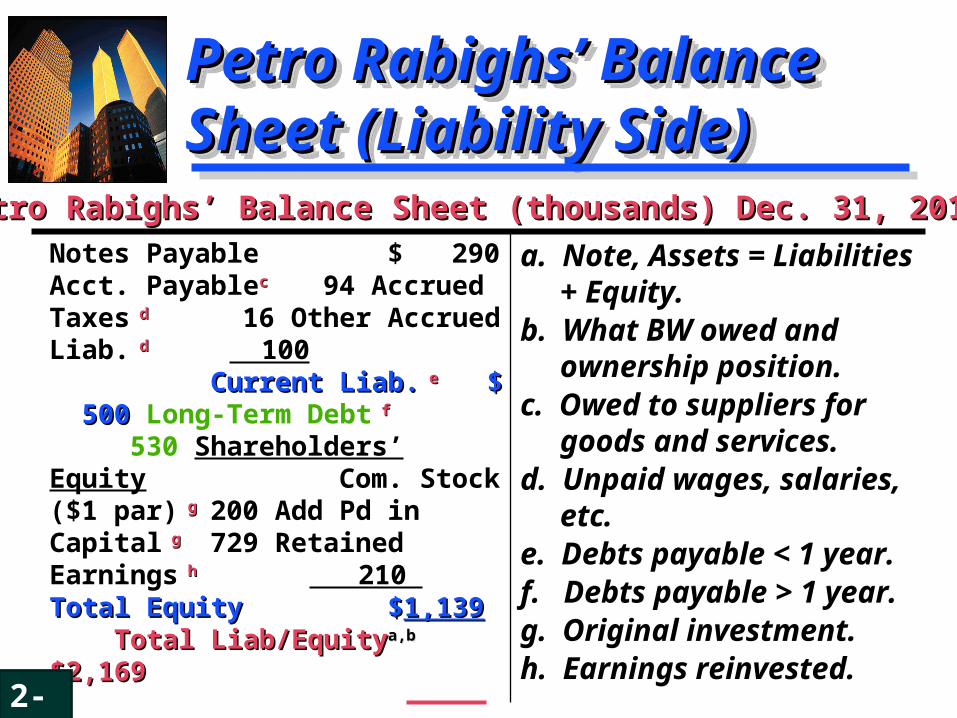
Petro Rabighs’ Balance Petro Rabighs’ Balance Sheet (Liability Side)Sheet (Liability Side)Petro Rabighs’ Balance Petro Rabighs’ Balance Sheet (Liability Side)Sheet (Liability Side)
a. Note, Assets = Liabilities + Equity.
b. What BW owed and ownership position.
c. Owed to suppliers for goods and services.
d. Unpaid wages, salaries, etc.
e. Debts payable < 1 year.f. Debts payable > 1 year.g. Original investment. h. Earnings reinvested.
a. Note, Assets = Liabilities + Equity.
b. What BW owed and ownership position.
c. Owed to suppliers for goods and services.
d. Unpaid wages, salaries, etc.
e. Debts payable < 1 year.f. Debts payable > 1 year.g. Original investment. h. Earnings reinvested.
Notes Payable $ 290 Acct. Payablecc 94 Accrued Taxes dd 16 Other Accrued Liab. dd 100 Current Liab.Current Liab. ee $ $ 500 500 Long-Term Debt ff
530 Shareholders’ Equity Com. Stock ($1 par) gg 200 Add Pd in Capital gg
729 Retained Earnings hh 210 Total Total EquityEquity $ $1,1391,139 Total Liab/EquityTotal Liab/Equitya,ba,b $2,169 $2,169
Petro Rabighs’ Balance Sheet (thousands) Dec. 31, 2014Petro Rabighs’ Balance Sheet (thousands) Dec. 31, 2014
2-5
6-6
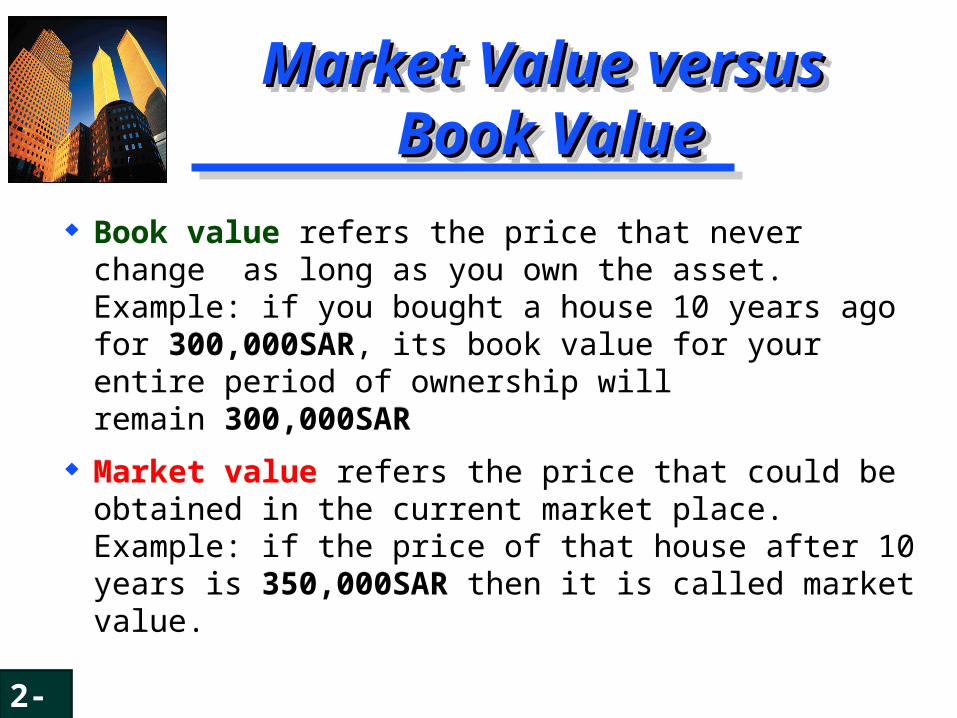
Market Value versus Market Value versus Book ValueBook Value
Market Value versus Market Value versus Book ValueBook Value
Book value refers the price that never change as long as you own the asset. Example: if you bought a house 10 years ago for 300,000SAR, its book value for your entire period of ownership will remain 300,000SAR
Market value refers the price that could be obtained in the current market place. Example: if the price of that house after 10 years is 350,000SAR then it is called market value.
2-6
6-7
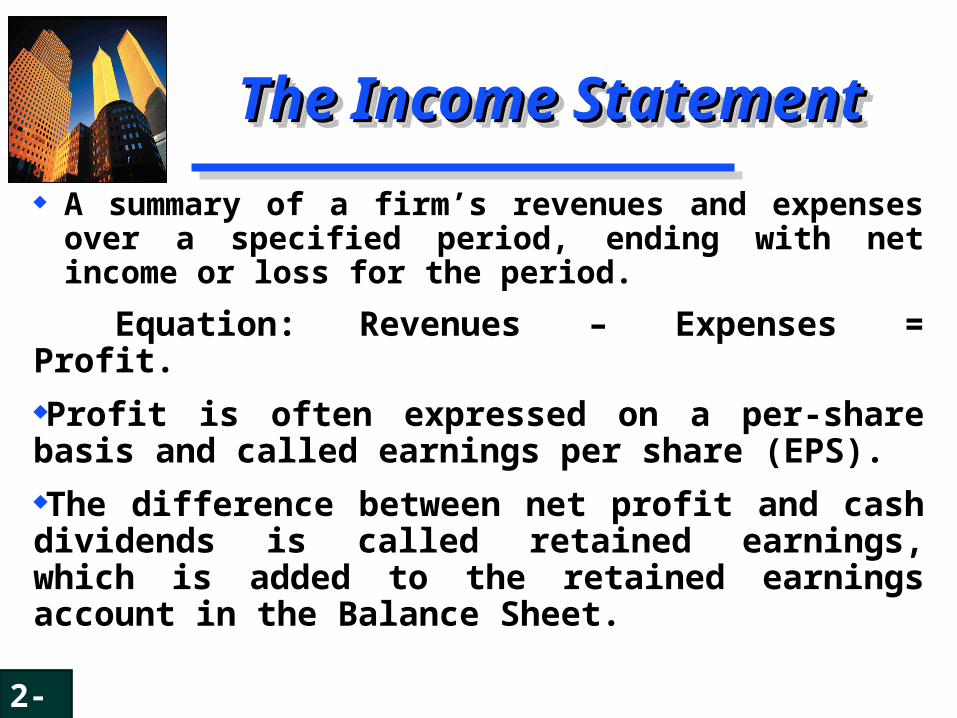
A summary of a firm’s revenues and expenses over a specified period, ending with net income or loss for the period.
Equation: Revenues – Expenses = Profit.Profit is often expressed on a per-share basis and called earnings per share (EPS).The difference between net profit and cash dividends is called retained earnings, which is added to the retained earnings account in the Balance Sheet.
The Income StatementThe Income StatementThe Income StatementThe Income Statement
2-7
6-8
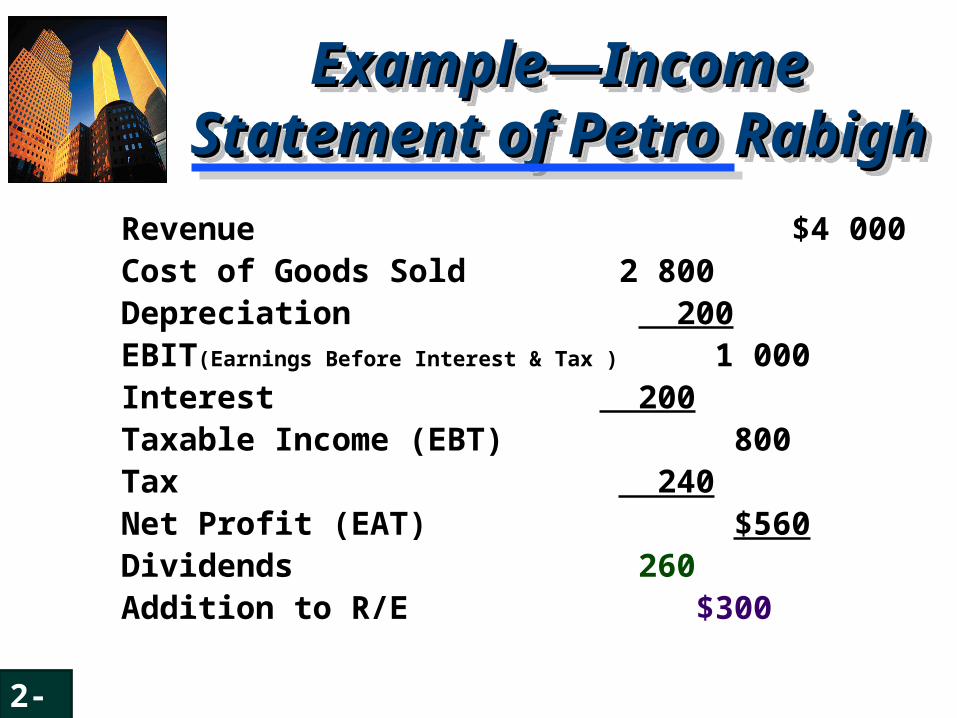
Revenue $4 000Cost of Goods Sold 2 800Depreciation 200EBIT(Earnings Before Interest & Tax ) 1 000Interest 200Taxable Income (EBT) 800Tax 240Net Profit (EAT) $560Dividends 260Addition to R/E $300
Example—Income Example—Income Statement of Petro RabighStatement of Petro Rabigh
Example—Income Example—Income Statement of Petro RabighStatement of Petro Rabigh
2-8
6-9
Can be one of the largest cash outflows that a firm experiences.
The size of the tax bill is determined by the Income Tax Assessment Act.
The Tax Act is the result of political, not economic, forces.
TaxesTaxesTaxesTaxes
2-9
6-10
The average tax rate is the total tax bill divided by taxable income; that is, the percentage of income that goes in taxes.
The marginal tax rate is the extra tax paid if one more dollar is earned.
A flat rate is where there is only one tax rate that is the same for all income levels.
It is the marginal rate that is relevant for most financial decisions.
Tax ratesTax ratesTax ratesTax rates
2-10
6-11
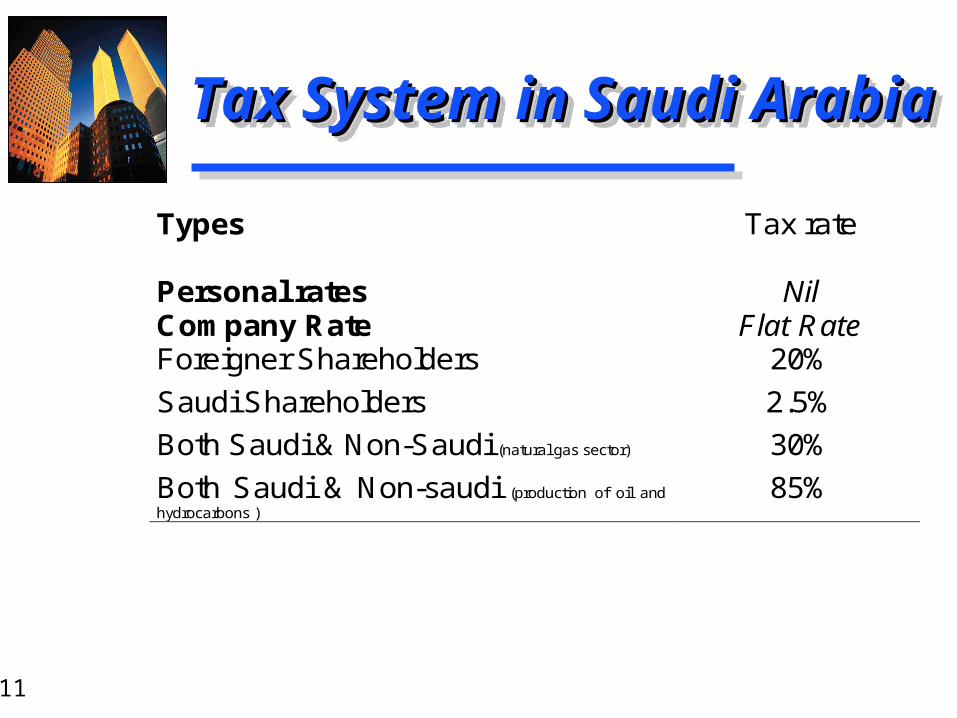
Types
Tax rate
Personal rates Company Rate
Nil Flat Rate
Foreigner Shareholders 20%
Saudi Shareholders 2.5%
Both Saudi & Non-Saudi (natural gas sector) 30%
Both Saudi & Non-saudi (production of oil and hydrocarbons )
85%
Tax System in Saudi ArabiaTax System in Saudi ArabiaTax System in Saudi ArabiaTax System in Saudi Arabia
6-12
Cash Flow from AssetsCash Flow from AssetsCash Flow from AssetsCash Flow from Assets
Equation:
Cash flow from assets = cash flow to debt-holders + cash flow to shareholders.
The cash flow identity or equation states that the cash flow from the firm’s assets is equal to the cash flow paid to suppliers of capital to the firm.
6-13
Cash Flow from AssetsCash Flow from AssetsCash Flow from AssetsCash Flow from Assets
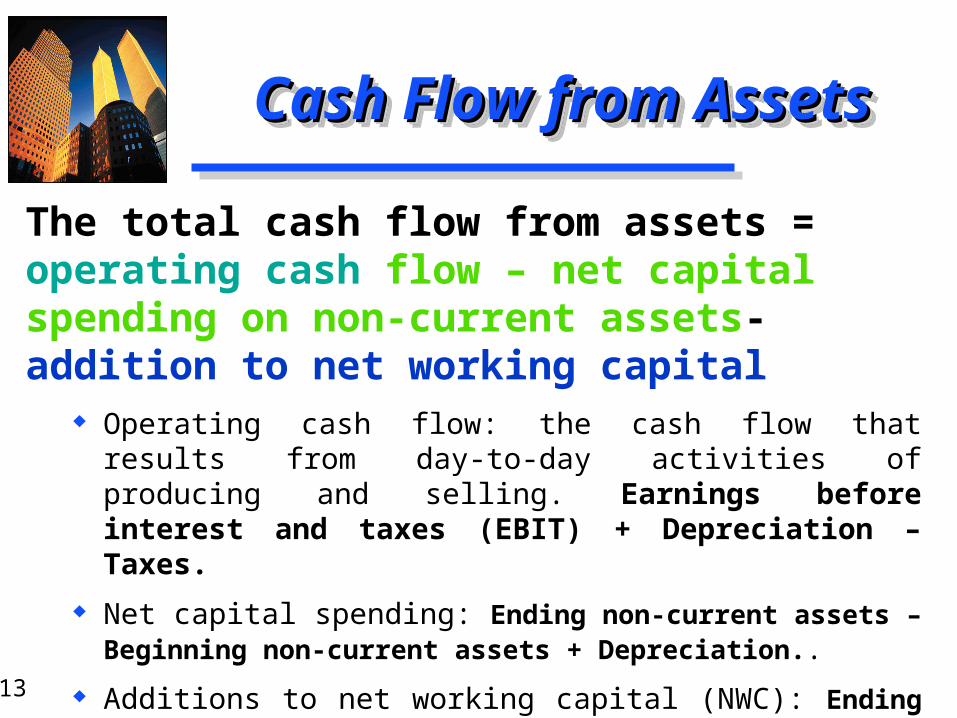
The total cash flow from assets = operating cash flow – net capital spending on non-current assets- addition to net working capital
Operating cash flow: the cash flow that results from day-to-day activities of producing and selling. Earnings before interest and taxes (EBIT) + Depreciation – Taxes.
Net capital spending: Ending non-current assets – Beginning non-current assets + Depreciation..
Additions to net working capital (NWC): Ending NWC – Beginning NWC.
6-14
Cash Flow to Debt-holders Cash Flow to Debt-holders and Shareholdersand Shareholders
The cash flow to debt-holders includes any interest paid less the net new borrowing.
The cash flow to shareholders includes dividends paid out by a firm less net new equity raised.
6-15
Example―Balance Sheet Example―Balance Sheet ($000s)($000s)
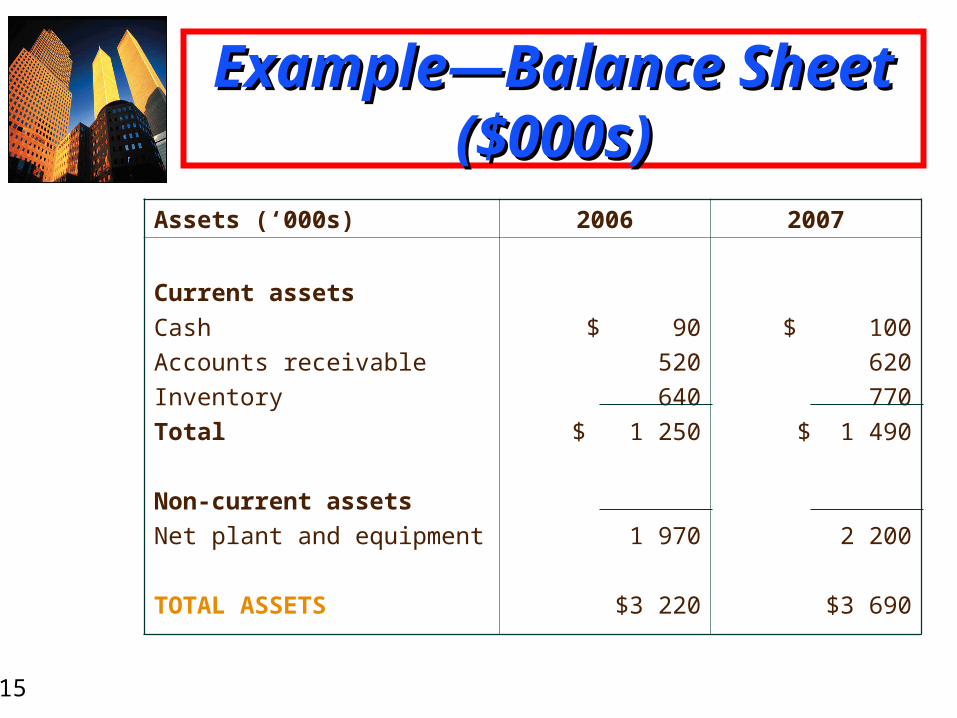
Assets (‘000s) 2006 2007
Current assets
Cash
Accounts receivable
Inventory
Total
Non-current assets
Net plant and equipment
TOTAL ASSETS
$ 90
520
640
$ 1 250
1 970
$3 220
$ 100
620
770
$ 1 490
2 200
$3 690
6-16
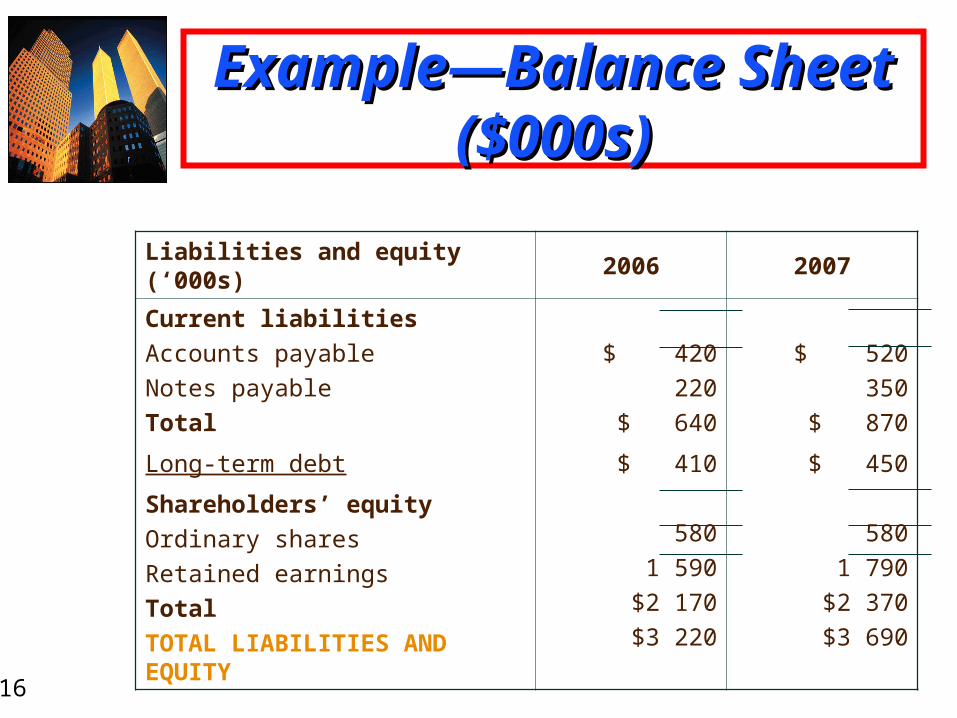
Liabilities and equity (‘000s) 2006 2007
Current liabilities
Accounts payable
Notes payable
Total
Long-term debt
Shareholders’ equity
Ordinary shares
Retained earnings
Total
TOTAL LIABILITIES AND EQUITY
$ 420
220
$ 640
$ 410
580
1 590
$2 170
$3 220
$ 520
350
$ 870
$ 450
580
1 790
$2 370
$3 690
Example―Balance Sheet Example―Balance Sheet ($000s)($000s)
6-17
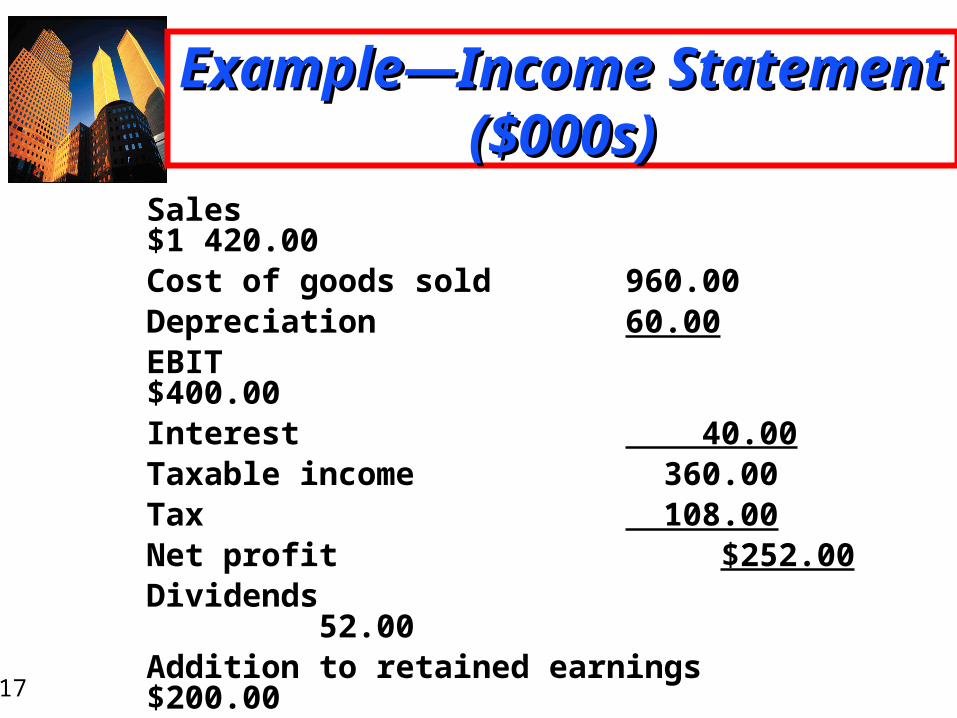
Sales $1 420.00Cost of goods sold 960.00Depreciation 60.00EBIT $400.00Interest 40.00Taxable income 360.00Tax 108.00Net profit $252.00Dividends 52.00Addition to retained earnings $200.00
Example―Income Statement Example―Income Statement ($000s)($000s)
6-18
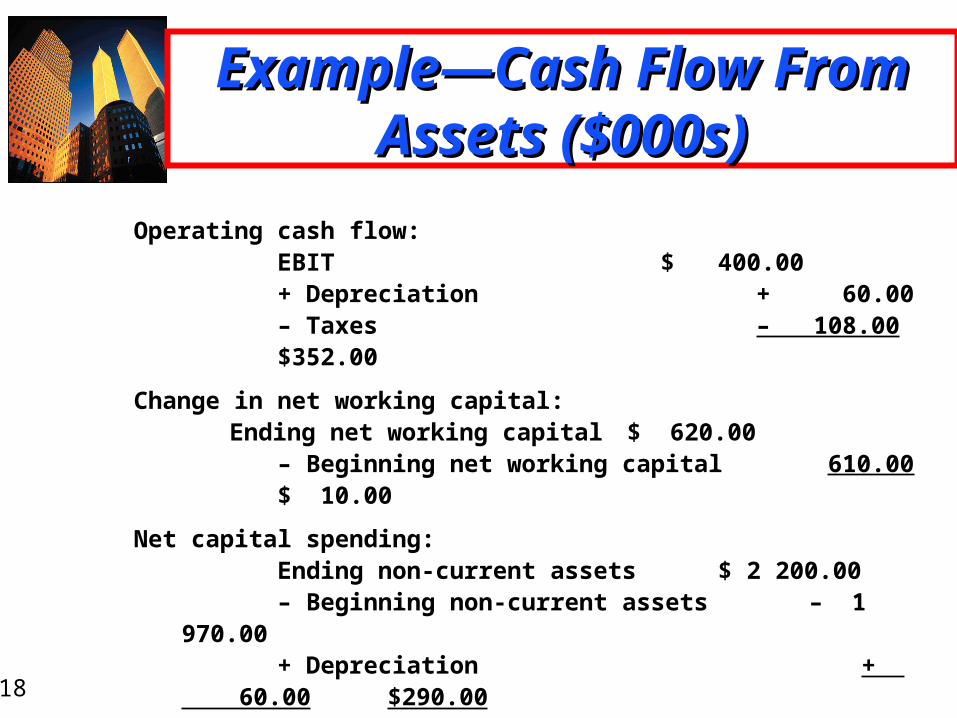
Operating cash flow:EBIT $ 400.00+ Depreciation + 60.00– Taxes – 108.00
$352.00
Change in net working capital:Ending net working capital $ 620.00
– Beginning net working capital 610.00 $ 10.00
Net capital spending:Ending non-current assets $ 2 200.00– Beginning non-current assets – 1 970.00+ Depreciation + 60.00
$290.00
Cash flow from assets: $ 52.00
Example―Cash Flow From Example―Cash Flow From Assets ($000s)Assets ($000s)
6-19
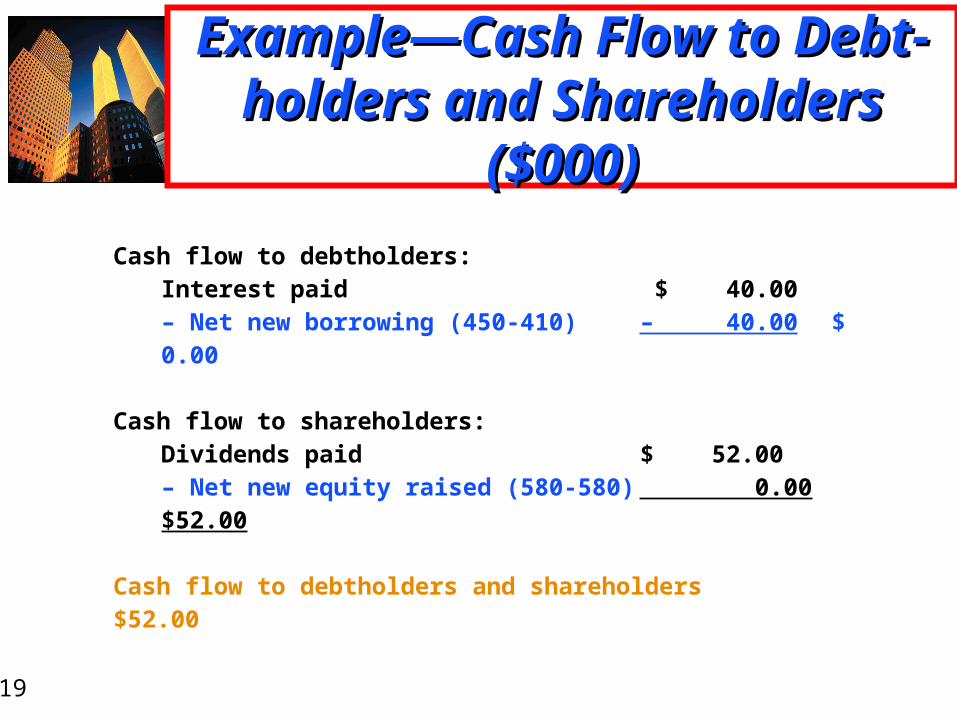
Cash flow to debtholders:Interest paid $ 40.00– Net new borrowing (450-410) – 40.00 $ 0.00
Cash flow to shareholders:Dividends paid $ 52.00– Net new equity raised (580-580) 0.00 $52.00
Cash flow to debtholders and shareholders $52.00
Example―Cash Flow to Debt-Example―Cash Flow to Debt-holders and Shareholdersholders and Shareholders
($000)($000)
6-20
Summary and ConclusionsSummary and Conclusions
The book values on an accounting Balance Sheet can be very different from market values.
Net profit as it is computed on the Income Statement is not a cash flow, a primary reason being the deduction of depreciation (a non-cash expense).
Marginal and average tax rates can be different. However it is the marginal tax rate that is relevant for most financial decisions.
Cash flow from assets equals cash flow to debt-holders and shareholders.
It is important not to confuse book values with market values, and accounting income with cash flow.


