+ All Categories
Home > Documents > 6 5 s r Dec - ddhgraham.com.au · ACN 102756347 AFSL or s r No. 5 6 Dec r 201 8 In this quarterly...

6 5 s r Dec - ddhgraham.com.au · ACN 102756347 AFSL or s r No. 5 6 Dec r 201 8 In this quarterly...

Date post: 18-Jan-2019
Category:
Upload: lamanh
View: 215 times
Download: 0 times
Share this document with a friend
46
Selector Australian Equities Fund Quarterly Newsletter No.56 December 2018 In this quarterly edition, we review performance and attribution for the quarter. We visit Blackmores in China and Indonesia. We profile Nearmap, and we consider the importance of leadership and culture. Photo. Gough Whitlam is remembered as Australia’s finest Labor Prime Minister. Can Bill Shorten walk in these shoes? Selector Funds Management Limited ACN 102756347 AFSL 225316 Level 8, 10 Bridge Street Sydney NSW 2000 Australia Tel 612 8090 3612 www.selectorfund.com.au
Transcript

Sele

cto

r A

ust

ralia

n E

qu

itie

s Fu

nd

Qu

arte

rly

Ne

wsl

ett

er

No

.56

De

cem

be

r 2

01

8

In this quarterly edition, we review performance and attribution for the quarter. We visit Blackmores in China and Indonesia. We profile Nearmap, and we consider the importance of leadership and culture. Photo. Gough Whitlam is remembered as Australia’s finest Labor Prime Minister. Can Bill Shorten walk in these shoes?

Selector Funds Management Limited ACN 102756347 AFSL 225316 Level 8, 10 Bridge Street Sydney NSW 2000 Australia Tel 612 8090 3612 www.selectorfund.com.au

P

Selector is a boutique fund manager. Our team, combined, have over 150 years of experience in

financial markets. We believe in long-term wealth creation and building lasting relationships with

our investors.

We focus on stock selection, the funds are high conviction, concentrated and index unaware. As a

result, the portfolios have low turnover and produce tax effective returns.

Selector has a 15-year track record of outperformance and we continue to seek businesses with

leadership qualities, run by competent management teams, underpinned by strong balance sheets

and with a focus on capital management.

Selector Australian Equities Fund Quarterly Newsletter #56

2

CONTENTS

IN BRIEF – DECEMBER QUARTER 3

PORTFOLIO OVERVIEW 5

PORTFOLIO CONTRIBUTORS 7

BLACKMORES – SITE VISIT 2018 11

NEARMAP – CHANGING THE WAY PEOPLE VIEW THE WORLD 17

WHERE NOT TO GO 29

CORPORATE SPIN 32

REGULATORY UNREST 34

2018 GLOBAL MARKET INDEX PERFORMANCE 36

TWELVE SHORT STORIES DEFINE OUR CULTURE 39

COMPANY VISIT DIARY – DECEMBER 2018 QUARTER 43

Selector Funds Management

3

IN BRIEF – DECEMBER QUARTER

Dear Investor,

Markets endured a difficult fourth quarter, reflected by

our main benchmark, the All Ordinaries Accumulation

Index retracing 8.98% over the period and contributing

to an overall negative return of 3.53% for the 2018

calendar year.

Despite Australia’s robust economic backdrop, with a

current annual GDP growth rate in excess of 3.0% and a

5.0% unemployment rate, concerns of a more muted

outlook are rising. In an environment of heightened risk,

investors are prone to react to impending trouble.

Our approach is somewhat more measured. Stealing a

line from U.S. Federal Reserve Chairman Jerome Powell,

given in a strategy update during December, “You slow

down and you maybe go a little bit less quickly, and you

feel your way more.”

It is, in our opinion, a sensible way forward that neither

rules things in or out. In the current market setting where

a broad-based sell-off has unfolded, taking advantage of

individual investment opportunities has merit.

When we find these businesses, we allocate funds in a

concentrated manner, seeking to capture as much real

earnings per share growth as possible over time. Our low

turnover, long-term approach is tax efficient and

harnesses the power of compounding investment

returns.

To this point, a host of businesses held by Selector, either

reported earnings, provided updates or held investor

days during the quarter. These included Fisher & Paykel

Healthcare, Technology One, OFX Group, Aristocrat

Leisure, Jumbo Interactive, CSL, Flight Centre Travel

Group, Altium and Nearmap.

As varied as this group is, and despite indifferent share

price performances post these updates, each continues

to execute to a long-term business plan, pursuing

leadership in their respective fields through consistent

reinvestment, often at the expense of short-term

profitability.

The progress each company has made over an extended

time frame is illustrative of this winning formula.

Furthermore, it reinforces the importance of selecting

investments purely on merit, undertaken on a case by

case basis and away from the noise of the market.

Investors who look beyond current macroeconomic

concerns and take advantage of the attractive

opportunities now on offer are likely to be well rewarded

in future years.

During the quarter we travelled with Blackmores to

attend the inaugural China International Import Expo

(CIIE), before heading to Indonesia where we reviewed

the joint venture operations run with partner Kalbe

Farma. In this newsletter we provide an overview of

these country visits as well as profiling Australian aerial

imagery specialist Nearmap, a business that has made its

way into the portfolio.

We provide some commentary on aspects of our

investment philosophy outlined in our articles titled,

“Where not to go” and “Corporate spin”. We show how

global markets performed during 2018 and also add a

recent speech given by Alibaba Vice Chairman Joe Tsai on

the values of teaching. Finally, we provide an insight to

what defines Selector in a series of short stories.

For the December quarter, the Fund delivered a gross

negative return of 13.22% compared to the All

Ordinaries Accumulation Index which posted a loss of

8.98%. For the 2018 calendar year, the Fund delivered a

gross positive return of 3.60% compared to the Index

which posted a loss of 3.53%.

We trust you find the report informative.

Regards,

Selector Investment Team

Selector Australian Equities Fund Quarterly Newsletter #56

4

“It is remarkable how much long-term advantage people

like us have gotten by trying not to be consistently stupid, instead of trying to be very intelligent.”

Charlie Munger Investor and Vice Chairman of Berkshire Hathaway

Selector Funds Management

5

PORTFOLIO OVERVIEW

Table 1: Performance as at 31 December 2018*

Inception Date: 07/12/2004 *Performance figures are historical percentages. Returns are annualised and assume the reinvestment of all distributions.

Figure 1: Gross value of $100,000 invested since inception

Table 2: Fund’s Top 10 Holdings

Top 10 December 2018 % Top 10 September 2018 %

ResMed 5.16 Altium 5.18

Jumbo Interactive 4.99 Jumbo Interactive 4.83

Altium Limited 4.95 Seek 4.74

Seek 4.22 ResMed 4.72

Reliance Worldwide Corporation 4.16 Reliance Worldwide Corporation 4.43

Infomedia 3.99 Aristocrat Leisure 4.32

Reece 3.95 Reece 4.12

Flight Centre Travel Group 3.87 Domino's Pizza Enterprises 3.85

Aristocrat Leisure 3.62 IRESS 3.33

Blackmores 3.61 Carsales.com 3.24

Total 42.52 Total 42.76

$0

$100,000

$200,000

$300,000

$400,000

$500,000

$600,000

$700,000

2004 2005 2006 2007 2008 2009 2010 2011 2012 2013 2014 2015 2016 2017 2018

SAEF returns XAOAI

FYTD 3 Month 6 Month 1 Year 3 Year 5 Year 10 Year Since

Inception

Fund (net of fees) (10.44) (13.55) (10.44) 1.91 8.70 10.97 12.74 8.89

Fund (gross of fees) (9.78) (13.22) (9.78) 3.60 11.04 14.13 16.32 11.92

All Ords. Acc. Index (7.28) (8.98) (7.28) (3.53) 6.60 5.71 9.14 7.07

Difference (gross of fees) (2.50) (4.24) (2.50) 7.13 4.44 8.42 7.18 4.85

Selector Australian Equities Fund Quarterly Newsletter #56

6

Table 3: Unit prices as at 31 December 2018

Selector employs a high conviction, index unaware, stock selection investment strategy, which typically targets 15-

25 stocks for the Fund. As shown above, the Fund’s top 10 positions usually represent a high percentage of its equity

exposure. Current and past portfolio composition has historically been very unlike that of your average “run-of-the-

mill index hugging” fund manager. Our goal remains focused on truly differentiated broad-cap businesses rather

than the closet index hugging portfolios offered by most large fund managers.

Table 4: ASX sector performance – December 2018 quarter

S&P ASX Industry Sectors Quarter Performance (%)

Materials (5.03)

Consumer Staples (6.46)

Industrials (6.76)

Health Care (8.15)

Financials (9.19)

Information Technology (14.00)

Consumer Discretionary (14.49)

Telecommunications (14.74)

Energy (21.34)

Table 5: Fund’s industry weightings

Unit Prices Entry Price Mid Price Exit Price

$1.8301 $1.8255 $1.8209

Industry group December 2018 (%) September 2018 (%)

Consumer Services 19.60 20.27

Software & Services 18.28 16.71

Health Care Equipment & Services 13.65 14.38

Cash & Other 11.70 10.95

Capital Goods 8.10 8.55

Commercial & Professional Services 6.21 6.84

Diversified Financials 5.72 4.64

Materials 5.30 5.64

Household & Personal Products 3.61 3.14

Media & Entertainment 2.69 3.24

Insurance 2.63 2.71

Automobiles & Components 1.90 2.22

Retailing 0.63 0.71

Selector Funds Management

7

PORTFOLIO CONTRIBUTORS

Figure 2: Contributors and detractors – December 2018 quarter

Top contributors

1. MYOB Group (ASX:MYO) Leveraged buyout specialist KKR returned following due

diligence with a bid of $3.40 per share for accounting

software provider MYOB Group. The offer is 37 cents

lower than the original proposal supported by the board,

that enabled access to the company’s books.

While the revision is a disappointing turn of events, it is

not altogether surprising. The collapse in equity markets

during the due diligence process and the 17.6% holding

KKR had earlier acquired, placed the MYOB board in a

weak negotiating position. Ultimately the board and its

advisors managed to extract some conditions from the

KKR team, who agreed to allow MYOB to solicit for

competing bids as well as agreeing to on sell their stake

into a superior proposal, should one emerge.

The MYOB board have recommended shareholders

accept the bid. The shares are now trading at a narrow

discount to the $3.40 offer, suggesting merger arbitrage

hedge funds are either confident the proposal will be

successful or believe there is a chance of a superior bid

emerging.

SFML wrote to the board of MYOB urging them to reject

the bid. We noted,

We believe that the offer price is inadequate based on

the information the company has provided in its outlook

presentations.

• At the $3.40 offer price the valuation of 10x 2019

EBITDA is light.

• Should you achieve the numbers management have

guided to for 2022 this multiple is circa 7x EBITDA.

MYOB has a market capitalisation of $1.98b and net debt

of $406m.

2. Technology One (ASX:TNE) Enterprise software vendor Technology One delivered

full year results for 2018, unveiling revenues up 9% to

$299m and net profits up 15% to $51m. The business is

undergoing a transition as it shifts from a perpetual

license model to a cloud powered, Software-as-a-Service

(SaaS) model.

The adoption of new accounting standards means

revenue is now recognised pro-rata over the life of the

client’s contract rather than booking license fees for

contracts up front. Cash flow will be unaffected, the

financial accounts will be simpler, and earnings more

predictable. The company has also opted to capitalise

costs associated with the development of new products,

in contrast with the prior approach of expensing all R&D.

-1.40% -1.20% -1.00% -0.80% -0.60% -0.40% -0.20% 0.00% 0.20% 0.40% 0.60%

MYOB GROUP

TECHNOLOGY ONE

NAVITAS

RESMED

JAMES HARDIE INDUSTRIES

DOMINO'S PIZZA ENTERPRISES

ARISTOCRAT LEISURE

ALTIUM

IOOF HOLDINGS

Selector Australian Equities Fund Quarterly Newsletter #56

8

Upwards of 50% of R&D will be capitalized then

amortized over 3-5 years.

We are mindful that capitalisation of development costs

is not the most conservative approach the company

could have taken, but the shift to a SaaS model is

overwhelmingly positive. Already 347 of its 1,200

customers have been successfully transferred to its SaaS

offering. As a result, annual recurring revenue has grown

22% from $139m to $169m (56% of total revenue). As

the customer base continues to convert to the SaaS

model, pre-tax profit margins will rise from 24% towards

an expected 50% over the medium term. No profit

guidance was provided for the 2019 year, but

management noted strong momentum across the

group's offerings.

Technology One has a market capitalisation of $2.05b

and net cash of $104m.

3. Navitas (ASX:NVT) Following the Navitas Board’s rejection of the

conditional, non-binding proposal from BGH Capital we

have reviewed our position in Navitas.

Our opinion of the potential of the business and its long-

term outlook is unchanged, however, the participation of

Navitas founder Rod Jones in the proposal as well as

cooperation from a number of other founding

shareholders has exposed potential conflicts of interest

in the management of the business. The risk this poses

to the strategic direction is our primary cause for

reviewing our position. We have had experience with

dysfunctional boards in past investments. This is not

something to be ignored. We have shared these views

with both management and the board via the Chair

Person.

Navitas has a market capitalisation of $1.77b and net

debt of $200m.

4. ResMed (ASX:RMD) Sleep apnea specialist ResMed reported strong first

quarter results for 2019. The group is delivering solid top

line growth and operating leverage is magnifying the

impact at the bottom line. For the quarter, group

revenue rose 12% to US$588m, while adjusted profit

after tax rose 23% to US$116.3m, equivalent to EPS of

US$0.81.

Selling into more than 120 countries, ResMed recorded

an increase in quarterly device growth of 13% to

US$324m, masks sales growth of 9% to US$217m and

revenue from digital services of US$47.5m. Margins have

risen from 20.6% to 23.6%, an illustration of the

business’s operating leverage.

The group continues to target sufferers of sleep apnea,

of which there are estimated to be 936m as well as the

Chronic Obstructive Pulmonary Disease (COPD) patient

cohort of circa 400m. A key enabler has been the

company's significant commitment to research and

development expenditure that has resulted in market

leading products and the rollout of digital health

technologies. This has enabled patients and physicians to

be better informed on the daily health outcomes of

those affected, leading to higher levels of compliance

and better treatment outcomes.

ResMed has a market capitalisation of US$16.1b and net

debt of US$300m.

Bottom contributors

1. IOOF Holdings (ASX:IFL) See accompanying article.

2. Altium (ASX:ALU) Altium released a strong result for FY18, growing

revenues 26% to US$140.2m and net profit after tax 34%

to US$37.5m. The provider of printed circuit board (PCB)

design software is the beneficiary of macroeconomic and

microeconomic tail winds. The strong demand for

Altium’s latest release, Altium Designer 18, was driven

from electronic engineers who design and develop

smart, internet connected devices. The cadence of the

design cycle has also increased rapidly, forcing designers

to turn to solutions that make the entire process faster,

more efficient and flexible.

Altium's main competitors have neglected the

increasingly important "makers" community. Although

the revenue generated from this market is limited, this

cohort of start-up designers eventually find their way

into larger companies and their familiarity with Circuit

Studio gives Altium a leg up on the incumbents including,

Mentor, Cadence and Zuken. Unlike Altium, these

competitors only focus on higher end customers with

their premium offerings.

At Altium’s November AGM, management presented

their vision of the future of the PCB lifecycle and how the

Selector Funds Management

9

company is planning to shape its involvement in the

industry. Specifically, the presentations focused on the

lack of interoperability between systems up and down

the supply chain and the difficulty with which

participants communicate and translate design

concepts. Demonstrations by the team illustrated how

Altium’s products are helping to overcome these

challenges.

Altium CEO Aram Mirkazemi has an aspirational goal of

delivering at least US$200m of revenue and EBITDA

margins of 35% by 2020, making Altium the leader in the

PCB software market. At the general meeting, Mirkazemi

expanded on this view. He is confident the PCB design

software market will become a winner takes all domain.

Like Microsoft in desktop productivity tools, and Adobe

in graphic design, the company that provides a solution

for the issues that engineers face will end up with the

lion's share of the market and the profit pool.

Furthermore, management confirmed that the issues

the industry face are significant and that Altium is best

placed to provide the necessary solutions.

Altium has a market capitalisation of US$2.1b and net

cash of US$52m.

3. Aristocrat Leisure (ASX:ALL) During November 2018, Aristocrat Leisure delivered

results for the financial year. Earnings per share before

goodwill amortisation rose 34% to $1.14, benefitting

from both the inorganic growth from acquisitions in the

digital division as well as a strong showing from the U.S.

gaming operations division. Group revenue rose 47.7%

and operating earnings grew 32.7%. In percentage

terms, of the 34% gain for the year, organic operations

delivered 17%, while acquisitions and tax benefits

provided 12% and 5% growth respectively.

Consistent investment in design and development is

generating high performing products and has led to

market share gains. This is expected to moderate,

although, management are confident they are still

underrepresented in market ship-share given, the

outperformance of Aristocrat games on casino floors.

The largest driver of growth came from the digital

division, boosted by the acquisitions of online and social

game developers, Big Fish and Plarium. Aristocrat is

leveraging game development from their traditional

businesses through digital channels, giving it a

substantial competitive edge over smaller competitors.

That said, margins surprised investors on the downside

in the digital division.

Historically high performing games which are maturing

have now entered the runoff stage of their life cycle and

new games such as Lightning Link and FaFaFa Gold are

early in their launch phases. As new games ramp up,

margins will rise. In the future, the breadth of the digital

business will allow Aristocrat to better manage the game

portfolio’s lifecycle mix.

Aristocrat has a market capitalisation of $14.7b and net

debt of $2.45b, up from September’s $0.7b level

following the recent acquisitions.

4. Domino's Pizza Enterprises (ASX:DMP) We attended the company’s investor day held at their

Brisbane headquarters during October 2018. CEO Don

Meij provided an overview of the group’s current service

offering and key competitive advantages. ANZ CEO Nick

Knight, Chief Marketing Officer Allan Collins and Chief

Digital & Technology Officer Michael Gillespie all

presented on their respective areas of focus.

A key message from the presentations was how much of

an impact technology is having on the Domino’s

business. Delivering high quality food to customers

quickly, is key to generating repeat sales and a consistent

investment in technology is helping achieve this.

Technology will only cut delivery times so far and getting

physically closer to customers is critical. To this end,

splitting store territories is an important leg of the

company’s strategy. Questions have been asked of the

approach, suggesting the strategy might lead to

cannibalisation of store sales. Domino’s findings to date

have been the opposite. Split territories not only result

in increased demand due to shorter delivery times, but

the stores profitability improves as the labour and

transportation costs per order fall substantially. Time will

tell whether this is experienced consistently across the

network, but the success so far has management

confident they can execute.

Domino’s has a market capitalisation of $3.5b and net

debt of $522m.

5. James Hardie Industries (ASX:JHX) Fibre cement building materials specialist James Hardie

Industries detracted from portfolio performance during

Selector Australian Equities Fund Quarterly Newsletter #56

10

the period after reporting results for the second quarter

of FY19. Management provided guidance which was

below the market's expectations largely due to lower

margins. Input cost inflation which is outside

management control is largely to blame, with pulp prices

up 24% and freight up 20% compared to the prior

corresponding period.

The company is part way through a succession plan

which will see Jack Truong take over from current CEO

Louis Gries towards the end of FY19. CEO Gries has

successfully built a market leading franchise by taking

share from vinyl house siding providers, but in recent

years market share gains have slowed as LP Smartside

has done a better job selling, what the company views an

inferior siding product.

Truong, who has a background working with large

multinational corporations such as 3M and Electrolux, is

expected to bring a new level of rigour, systemisation

and professional management that has been found

wanting at James Hardie as it has morphed from a small

challenger into a market leader. He is expected to re-

calibrate the sales and marketing teams to better handle

the threat of LP while continuing with the long-term goal

of gaining house cladding market share at the expense of

vinyl.

Despite the market's reaction to the result, we are

comfortable with the long-term strategy management

have in place. The recalibration that Truong will lead

should help keep the company on track to meet its

strategic goals.

James Hardie has a market capitalisation of $6.8b and

net debt of $1.3b.

Selector Funds Management

11

BLACKMORES – SITE VISIT 2018

We attended a Blackmores led investor tour of Shanghai,

China and Jakarta, Indonesia during November. Despite

a difficult and complex registration process, we managed

to secure our entry passes and joined thousands of

international visitors at the inaugural China International

Import Expo (CIIE).

Opened by Chinese President Xi Jinping on 5 November

2018, the CIIE is said to have brought together more than

3,000 foreign companies from 130 countries, in a major

initiative to promote investment opportunities within

China.

A host of well-known Australian businesses including

Blackmores, Australia Post, Chemist Warehouse and

Bellamy’s were on show. Stretching over eight halls, the

expo showcased businesses in the following industries:

1. High-end intelligent equipment

2. Consumer electronics and appliances

3. Automobile

4. Apparel, accessories and consumer goods

5. Food and agricultural products

6. Medical equipment and medical care products

Exhibit 6 was of specific interest to us.

In his Healthy China 2030 plan, President Xi Jinping

placed health reform front and centre in the Chinese

Government’s overall agenda for the next decade.

Blackmores exhibit The company’s exhibit was placed in the Medical

Equipment and Medical Care section. While not as well

located as competitor Swiss Wellness, the booth was an

excellent presentation of the company’s brand, its

history and importantly, Australia’s reputation as a clean,

green environment.

We were joined at the CIIE by Blackmores’ senior

management team which included Executive Director

and major shareholder Marcus Blackmore, CEO Richard

Henfrey, CFO Aaron Canning, Blackmores Institute

Director Dr Lesley Braun, Financial Controller and

Investor Relations Manager Dee Henz and the company’s

Deputy Head of China Raymond Chan.

Photo 1: CIIE China November 5-10

Source: SFML China trip.

Selector Australian Equities Fund Quarterly Newsletter #56

12

Photo 2: Blackmores stand CIIE November 2018

Source: SFML China trip

The clear message from all involved was the company’s

commitment to the Chinese market and the long-term

approach they favour in building a local business. This

demands investment across all facets of the business,

including registration of products, building out

operations, establishing celebrity endorsements and

implementing educational initiatives.

In crude market share terms, the Chinese Vitamins,

Dietary and Supplements (VDS) market is estimated to

be worth US$20b annually of which Blackmores

represents less than 2%.

During 2018 the company grew sales in China (net of

rebates) to $143m (including export and in country

sales), which generated operating profits of $35m. This

represented an increase of 22% over the previous year

and compares to overall group sales of $601m.

Additional sales through the daigou1 channel from

Australia are estimated to add around $60m to overall

China bound sales, bringing the total to $200m, or 33%

of total company wide sales.

The Blackmores Board travelled to China in June to meet

with e-commerce retailers, developing a first-hand

understanding of the in-country opportunity. As Marcus

Blackmore highlighted, the China opportunity is

significant, but the company must be respectful of the

rules and regulations governing the Chinese market.

Regulatory settings are fluid and subject to frequent

change. As recently as November this year, import

1 Daigous are personal shoppers for customers in mainland China, who purchase primarily luxury goods outside of China.

restrictions have given way to more relaxed settings.

Additional products have been added to the CBEC’s

positive import list and higher purchase limits have been

granted for individual shoppers buying goods offshore.

These changes support both the continuing purchase of

goods in offshore markets as well as the sale of products

directly into China’s e-commerce platforms such as

Alibaba’s TMall and Kaola.com. Post this expansion, over

1,300 products will receive preferential import

treatment, with the scope of the policy earmarked for

expansion from 15 Chinese cities to 22.

Since entering the Chinese market in 2012 with its own

Wholly Foreign-Owned Enterprise (WFOE) accreditation,

the company set about building a China based business.

Considerable resources have been invested with the

China based entity now employing 60 staff. Building a

business from the ground up is never an easy

undertaking, and in this case, made more difficult when

the operation is in a foreign land and where high-quality

staff are in short supply due to intense competition.

In our opinion, the recruitment of a high-quality country

head for the China business is the group’s highest

priority. Currently operating without one, the goal of

doubling staff over the coming year will be extremely

challenging.

While the sales numbers point to positive operational

progress, the company has also met several significant

milestones including:

1. March 2018 – Establishment of a partnership

between the Blackmores Institute and Tsinghua

University to build out further VDS accreditation

programs.

2. June 2018 – Signing a joint business plan with China’s

largest e-commerce operator Alibaba.

3. August 2018 – Signing an exclusive New Product

Development (NPD) partnership with China’s largest

digital Vitamins and Dietary Supplements (VDS)

operator Kaola.com.

The company’s aspirational goal is to become the

number one VDS importer in China. Today, the company

is the market leader in Australia, Thailand, Singapore and

Malaysia.

Selector Funds Management

13

Photo 3: Display: Flying car automobile stand

Source: SFML China trip – Automobile exhibit

China Skinny During our time in Shanghai we heard from industry

speakers including Mark Tanner, the Managing Director

of brand strategy agency China Skinny.

In his engagements with over 150 companies, Tanner has

developed various insights on China and its consumers

which he shared with us. We include a list below:

• Chinese consumers don’t relate to Australia’s flag,

boomerangs or our map. They are more familiar with

our furry animals the kangaroo and koala. They also

see Australia as being green, with all its inherent

environmental positives.

• Comparatively, the affluent Chinese consumer

attains a level of wealth at a much younger age, circa

10 years younger than counterparts in Hong Kong

and the U.S.

• The highest Chinese income earners sit within the

18-29 age bracket, a contrast to those in more

traditional markets.

• Chinese youth have an overwhelmingly positive view

(60%) on the U.S. way of life.

• 67% of Chinese people consume more products and

services from the destination country following an

overseas visit.

• Chinese born after 1990 have never experienced

hardship. They are not seen as savers, they are

prepared to spend their earnings and take on debt,

underpinned by substantial intergenerational

property holdings.

• China’s GDP growth has declined over the past

decade from more than 10% to around 6.5% per

annum. Today the main driver is consumer spending,

contributing 70% of GDP growth.

• The population of China is circa 1.4b. Cities in China

can be categorised into four tiers according to their

populations:

1. Tier One – populations greater than 15m

(includes Shanghai and Beijing).

2. Tier Two – populations between 3m and 15m.

3. Tier Three – populations between 150,000 and

3m.

4. Tier Four – populations less than 150,000.

• E-commerce growth has been driven by rapid

consumer adoption. More than 50% of consumers

undertake detailed research before purchasing

compared to 30% in the U.S.

• Within the e-commerce segment, cosmetics is the

biggest category, 36% market share.

• Around 40% of products on cross border e-

commerce sites are fake.

• A growing trend known as “New Retail” has emerged

in China, where consumers purchase products in

store with the option of free home delivery within 30

minutes. We visited the Alibaba Hema store where

this format was on show.

• Chinese consumers pay for goods and services via

smart phones, using either Alibaba’s Alipay or

Tencent’s WeChat payment platform.

• Together, Alibaba and Tencent control 7 of the top

10 online retail sites.

• Celebrity endorsement is a proven method of

building brand and consumer loyalty. Blackmores

have utilised celebrities in the past and recently

announced the appointment of well-known Chinese

male actor Shawn Dou as its newest recruit.

Selector Australian Equities Fund Quarterly Newsletter #56

14

Photo 4: Hema store –

Shanghai

Source: SFML China trip

Photo 5: Shanghai Premium –

Product Store

Source: SFML China trip

Photo 6: Shawn Dou –

Blackmores Ambassador

Source: SFML China trip

AdMaster Calvin Chan is the Chief Operating Officer at AdMaster, a

data marketing company. He noted several market

observations.

• Within China the new norm is lower GDP growth.

• Even as the economy slows, consumers are spending

more.

• The most common method of communication is

WeChat.

• DTC (Direct to Consumer) is the new normal business

model.

• Consumer spending on premium and high-end goods

and services such as travel is rising.

• Established brands need to deal with China’s

“Walled Gardens”, the companies that dominate

e-commerce and who in-turn look to extract more

from brand owners. Alibaba is seen as the most

powerful and protective of its own eco-system.

• Over 30% of online traffic is fake, making data

difficult to interpret.

Blackmores China Blackmores Deputy Head of China Raymond Chan,

presented on the region.

• As noted earlier, the group delivered net sales of

$143m during 2018 from China bound and in country

sales.

• Blackmores is a leading premium imported VDS

brand.

• Across e-commerce and retail stores the group has

over 100 stock keeping units (SKUs) across five key

categories.

• Blackmores is the preferred brand across e-

commerce channels.

• Blackmores heritage and history across the VDS

category is unmatched amongst competitors.

• Blackmores Health Institute underpins a

commitment to undertake research and invest in

education, with 40 projects underway.

• The Chinese e-commerce market is valued at

US$604b with 16% penetration of consumer spend

compared to the U.S. at US$394b with 10%

penetration.

• The dominant e-commerce players in the VDS

market are:

1. Kaola - 24%

2. Tmall Global - 20% (Alibaba)

3. VIP - 16%

4. JD Worldwide - 13%

• New distribution agreements with Kaola and Alibaba

have led to the DTC channel representing more than

50% of Blackmores sales.

• Overall e-commerce sales account for more than

90% of total sales with the balance coming from

physical store sites.

• Offline sales are expected to grow strongly in the

medium term as more product registrations are

received.

Selector Funds Management

15

• Staff numbers are set to double over the course of

2019, with a new head office required to

accommodate the increase.

• Management and the Board are committed to

driving growth and have stepped up marketing

spend during the latter part of 2018 and into 2019.

• Gross margins are set to expand but the company

has clearly articulated a desire to invest any

additional benefits into the China business.

• Blackmores has launched a new marketing campaign

message for China and Asia, “Begin, Better,

Everyday”.

Site visit Indonesia Following our China tour, we headed to Jakarta

Indonesia where we reviewed the operations of

Blackmores joint venture with Kalbe Farma. Known as PT

Kalbe Blackmores Nutrition, the joint venture has been

operational for three years.

Blackmores has a long history in Indonesia, having

established market operations in 1995. The decision to

exit some years later was an acknowledgement of the

company’s lack of operational firepower in the region.

Re-entering in 2015, the company chose to team up with

Kalbe Farma, opting to use the powerful resources of a

successful Indonesian based healthcare group.

Kalbe Farma was established in 1966, listed on the

Indonesian exchange in 1991 and has a current market

capitalisation of $6.5b.

Today Kalbe, with an employee base of 17,000 and sales

of $2b, is the largest healthcare provider in Indonesia

covering four business segments including nutrition,

consumer health, prescription pharmaceuticals and

distribution and logistics.

We were joined on the tour by the Kalbe Blackmores

team which included General Manager Dickson Susanto,

Accounting Director Ratna Li, Director Diny Elvirani and

Director and Chief Marketing Officer Ongkie Tedjasurja.

As noted earlier, the Kalbe Blackmores Joint Venture (JV)

was established in 2015, and first products launched in

2016. Beginning with eight staff and 16 product lines, the

business has expanded significantly over a relatively

short period.

Currently, the business employs 42 staff and 328 Product

Advisors, who are physically located across the various

retail pharmacy channels assisting customers with

product choice.

The JV partners have expanded the number of product

units from 16 to 42, with Fish Oil and Pregnancy Gold the

two flagship products.

The retail landscape is made up of four channels:

1. Modern Pharmacies – 378 outlets (35% market

share).

2. Modern Trade – 258 outlets including supermarkets

and baby shops (21% market share).

3. Independent Pharmacies – 26,600 stand-alone

stores (26% market share).

4. E-commerce – Blibli Tokopedia, JD.ID (18% market

share).

The most profitable and fastest growing channels are the

independents and e-commerce sites.

The Vitamins and Dietary Supplements (VDS) market in

Indonesia is valued at US$660m, with the premium VDS

segment estimated to represent circa 15% or US$100m.

This is an important market and one that the JV is aiming

to dominate. Currently the JV is ranked third with less

than 10% market share.

Indonesian market facts:

1. Indonesian population 264m.

2. 42% of population is younger than 25.

3. Jakarta is the largest city with a population of 10m.

4. Indonesian GDP sits at US$1.1b.

5. GDP growth has been consistently above 5% for

some years.

6. Growth has been driven by consumption and

government spending which are growing at 5.1% and

4.0% respectively.

7. Healthcare spend to GDP of 2.9% compares to 5.6%

in Thailand and a global average of 9.2%.

8. The VDS market grew at 9% per annum between

2014 and 2017.

9. Across Asia compound annual growth in VDS has

averaged 7% to 8%.

10. Imported products represent over 70% of the VDS

market.

11. A survey of 1,500 consumers across seven cities,

showed 60% consumed supplements continuously

over 2 years.

Selector Australian Equities Fund Quarterly Newsletter #56

16

12. Monthly spending averaged between US$10 and

US$30.

13. The VDS market is highly fragmented with Bayer the

largest player holdings a 6.1% market share.

Site visits We visited a number of stores, located in shopping malls

and off-street locations. The Blackmores marketing

presence was clearly visible with Product Advisors

located in each of the sites visited. Independent store

feedback on the Blackmores brand was strong, with

product acceptance reflected in continuing strong

double-digit annual growth

Summary The China market continues to evolve, and the

company’s long-term commitment is gaining traction

among consumers and local partners. In Indonesia,

which can be regarded as a more traditional consumer

market, the company has made significant inroads in a

short period of time.

Management are targeting profitability in all Asian

markets in 2019, with China and Indonesia offering the

greatest sales upside.

More specifically, while China continues to generate a lot

of interest among investors, the few of us that took the

time to visit Indonesia benefited from local

management’s presentation. Blackmores is positioned

very well in Indonesia, where VDS demand is growing at

a rapid clip.

Overall, the visit reinforced our positive view of the

business. Both markets are in their infancy, allowing

Blackmores to invest to gain longer term brand

acceptance. The opportunities in China and Indonesia

are multiples of their current sales and the results

generated thus far support the significant opportunities

that lie ahead in each region. SFM

Photo 7: Indonesian pharmacy outlets – Jakarta

Source: SFML China trip

Selector Funds Management

17

NEARMAP – CHANGING THE WAY PEOPLE VIEW THE WORLD

Nearmap CEO Rob Newman starts most of his

presentations to investors by explaining the photomap

provider’s purpose, “changing the way people view the

world”. As simple as it sounds, the offering is generating

traction. Their browser based, high resolution aerial

imagery offers a cost-effective solution for viewing and

analysing the world, eliminating hours of wasted time

and money spent travelling and surveying sites

physically.

In July of 2008, Nearmap was acquired by ipernica, a

listed intellectual property protection company, for $4m

in cash, 60m ipernica shares (9 cents a share at the time)

and 12.5m ipernica $0.40 strike price options.

Nearmap was described as a producer of high resolution

aerial imagery with multiple view angles at a fraction of

the cost of traditional solutions. Following the

acquisition, the company announced plans to change the

name of the listed vehicle from ipernica to Nearmap in

February of 2012. This reflected aerial imagery’s growing

importance and the future strategic focus of the

business. Plenty has changed since the acquisition but at

its core the company is a low-cost aerial imagery

specialist.

Aerial imagery The use of aerial imagery in government and business is

not a new phenomenon. A bird’s eye view provides a

unique perspective, allowing for a far more complete

understanding of an area. Whether captured by drones,

planes or satellites, aerial imagery is regularly used for

surveillance, geographical surveys and planning the

development of towns. Unsurprisingly, the cost of flight

makes large scale capture an expensive endeavour.

Consequently, aerial imagery has been used

predominantly by well-resourced organisations such as

the government and the military.

This dynamic shifted with the release of Google Maps.

Suddenly, access to high quality photomaps became a

commodity. Satellite imagery allowed companies such as

Google to provide free access for non-commercial use.

Google's service was ground breaking at the time, but it

had and still has flaws. The ability for individuals to look

down on their homes was neat, but astute users noticed

the images were months and in some cases years out of

date.

Google's services were incapable of providing images

either current enough, or of the quality required for

commercial use. Business and government users

continued to rely on either expensive satellite imagery or

bespoke photo surveys. Those surveys could only

provide the users with a view of the environment at a

single point in time and were often delivered as a

collection of individual images. Rapidly changing urban

areas quickly rendered these images ineffective.

Bespoke surveys were often conducted on the basis that

the patron owed the image rights. Even in cases where

the surveyor retained reuse rights, the absence of an

efficient delivery medium prevented easy re-sale,

hindering the improvement in the economics of the

service.

High resolution aerial imagery Enter Nearmap. The company's founder Stuart Nixon

developed a system to capture images from far higher

altitudes than aerial photo surveys were previously

capable of. The basic logic being that from higher up,

aircraft could capture the same survey area while flying

a shorter distance.

Given such a large proportion of the cost of generating

photomaps comes from aircraft charter fees, being able

to conduct the survey in less flight time improves the

overall cost.

However, flying at a higher altitude poses several

problems. Anyone who has used a pair of binoculars to

view something in the distance will know how hard it is

to stay focused on a fixed point. The further away the

point, the more difficult it is. Conducting photo surveys

at altitude requires specialised hardware and software to

compensate for the forward movement as well as

turbulence. The higher the aircraft, the more precise the

image capture needs to be.

Nearmap could have opted to compete with traditional

aerial imagery providers by marginally undercutting their

fees. Lower capture costs would have delivered the

company superior margins and allowed them to capture

market share. Instead, their strategy is to provide the

Selector Australian Equities Fund Quarterly Newsletter #56

18

imagery at a cost which makes it affordable for

businesses small and large alike.

It's worth noting that when ipernica acquired Nearmap,

their stated goal was to provide imagery covering 20% of

the world's population (700 cities) updated on at least a

monthly basis. A lofty goal to say the least.

The annual spend on aerial imagery in Australia is

estimated to be roughly $250m-$300m. Nearmap has

succeeded in selling to traditional users of aerial imagery

such as local councils and planning authorities, but a

large proportion of the company’s revenue comes from

businesses too small to pay for bespoke aerial surveys.

More than half of Nearmap's contract value of $66m is

generated from customers paying less than $50,000 in

subscription fees annually. This demonstrates the

success the company has had growing a niche within

small to medium enterprises (SMEs). Under Nearmap’s

model revenue can effectively be earned by providing an

unlimited number of customers the same image over

and over through its subscription model.

Nearmap users get access to the company’s entire

imagery library, via a web browser. A subscription also

provides the user with a complete range of digital tools.

This is a far broader offering than most providers. It is

worth exploring some of the use cases of their

subscription services to demonstrate how this broad

offering at a lower price point has created demand which

previously didn't exist.

Nearmap Solar and Roofing Onsite visits to conduct appraisals for solar panel and

roofing jobs are time consuming and costly. High-

resolution aerial imagery provides a viable alternative to

site visits.

In-built tools in MapBrowser, Nearmap's photomap

library, allow users to measure roof dimensions including

pitch and area. Frequent updates ensure images are

current and high resolution allows for precise

measurement. Quotes can be provided far more

efficiently, helping develop a strong sales pipeline.

Without needing to step foot on a site, the installer saves

on labour costs, insurance and petrol.

Photo 8: Nearmap Roofing analysis example

Source: Nearmap corporate disclosures

Selector Funds Management

19

Photo 9: Nearmap Solar analysis example

Source: Nearmap corporate disclosures

Nearmap Insurance The insurance industry relies on the use of site visits to

verify assets are authentic, assess risk and identify

potential claims, all of which require an army of

assessors. With the help of aerial imagery insurers have

been able to reduce their reliance on assessments from

employees in the field, instead relying on appraisals

conducted with Nearmap's tools.

High risk assets can be identified during quoting by

viewing property conditions over time and by using tools

such as the Flooding Tool. As a part of its surveys,

Nearmap collects elevation data which is integrated as a

data layer in the MapBrowser allowing customers to

conduct flood risk modelling.

Photo 10: Nearmap flood analysis example

Source: Nearmap corporate disclosures

Selector Australian Equities Fund Quarterly Newsletter #56

20

Photo 11: Nearmap Flood Tool analysis of Bundaberg

Source: Nearmap corporate disclosures

Photo 12: Actual impact of 2014 floods in Bundaberg, QLD

Source: Nearmap corporate disclosures

Selector Funds Management

21

Photo 13: Before and after images of damage caused by storm surge at Collaroy Beach, Sydney, NSW

Source: Nearmap corporate disclosures

Frequent updates allow for fast damage assessments.

Photo 13 shows before and after shots of the damage

caused at Collaroy beach in Sydney by storm surges on 5

June 2016. The image illustrating the damage was

captured three days later on 8 June 2016.

Nearmap Utilities Maintenance and damage assessments are part and

parcel of doing business as an owner of hard assets such

as water mains, power lines, dams, large processing

plants and mines. Traditionally these companies would

hire hundreds of employees to conduct in person surveys

of assets to identify damage, plan maintenance activity

and respond to unexpected issues.

With up to date imagery, surveys can be done with a

smaller workforce, inventories at mine sites can be

tracked using built in volume calculation tools and

environmental problems such as illegal dumping and

leaks can be acted upon quickly.

Selector Australian Equities Fund Quarterly Newsletter #56

22

Photo 14: Gorgon LNG Plant, Barrow Island, WA

Source: Nearmap corporate disclosures

Photo 15: Desalination plant at Kurnell, NSW

Source: Nearmap corporate disclosures

Selector Funds Management

23

Business model Nearmap’s business model involves customers paying a

subscription fee for access to the content. Different

subscriptions afford the customers different data

allowances. New products such as 3D layers utilise

alternative pricing models to account for differing data

densities but conceptually operate in the same manner.

Customers are charged based on consumption, rather

than a mark-up on the cost to capture the imagery, the

model utilised by traditional aerial surveyors.

One of the most important performance indicators, like

any other SaaS business is customer churn, which

measures the proportion of the licenses that lapse

annually. A healthy level of churn for SaaS businesses is

determined by factors such as gross margins and the

capital intensity of the business. Generally, churn of less

than 20% provides a long enough customer life to

generate an appropriate return on the capital invested

acquiring customers and developing the product. At a

20% churn rate the average life of a customer is five

years.

The approach taken to grow a SaaS business is somewhat

different to other traditional endeavours. An intense

focus on customer life time value (LTV) is a key driver of

business strategy. LTV is calculated by multiplying the

average annual contract value (ACV) per customer by the

expected life of the account in years. If the ACV of the

customer is $1,000 and the expected customer life five

years, the LTV will be $5,000.

The economic value of a customer is a function of the

LTV, the cost of acquiring the customer, the cost to

service the customer, and the company's cost of capital.

The larger the LTV, the higher the gross margins, and the

lower the company's overheads, the more a business can

afford to spend acquiring customers.

• Churn – Customer churn for Nearmap is particularly

low and gives rise to an average customer life of

around 13 years. The average ACV per subscription

was running at $7,500 as at 30 June 2018 giving rise

to an average customer LTV of $97,500.

• Gross margins – Nearmap earns gross margins of

94% in Australia, 27% in the U.S. and 80% at a group

level. Gross margins in the U.S. will rise towards

those earned in Australia as hosting costs remain

stable and the customer base grows.

• Operating margins – Like server hosting costs,

capture costs and company overheads are more or

less fixed. As revenue grows and gross profits reach

a level where they exceed the fixed costs, EBITDA

margins and cash flow should grow rapidly.

Despite this, it is expected that cash flow will not grow as

fast as it otherwise might, as Nearmap invests more in

sales and marketing each year to acquire customers.

Sales and marketing are the company's largest variable

costs, other than discretionary spend. This strategy

remains prudent, while customer LTV expectations hold

true and the company can acquire customers for a

sensible amount.

Figure 3: Group sales and marketing expense

Source: Nearmap company financials

The key performance metric for the customer acquisition

strategy is the sales team contribution ratio (STCR),

which compares the increase in the ACV over a 12-month

period with the cost of the sales function. The company

targets a STCR of greater than 100%, which means the

team is paying back their own cost base in under a year.

As revenue grows, Nearmap will continue to invest more

to acquire new customers if they can achieve this at a

sensible price.

5.0

10.0

15.0

20.0

25.0

2014 2015 2016 2017 2018

Selector Australian Equities Fund Quarterly Newsletter #56

24

Figure 4: STCR per division

Source: Nearmap company financials

Perhaps most importantly, the business model has

already been proven in Australia. Compare Figure 5 and

Figure 6 below, which illustrate the strengthening of

gross margins which occurs as the business units reach

scale. The Australian business is highly profitable,

earning operating profits of $22.9m on revenues of

$43m, a margin of more than 50%. In comparison, the

U.S. business lost $17.2m at the operating profit level on

revenues of $10.6m.

Figure 5: Aus division revenue and gross profit

Source: Nearmap company financials

Figure 6: U.S. division revenue and gross profit

Source: Nearmap company financials

The profitability of the Australian business is a result of

its maturity. It has been capturing images and selling the

service for more than a decade. Annual capture costs are

stable, growing in line with moderate increases in

capture operations to expand the footprint. In Australia,

the total cash capture costs amounted to $3m during

2018.

Announced in October of 2014, the expansion into the

U.S. is relatively recent and only now beginning to scale.

The first commercial sales to SME’s and local

government departments commenced in May of 2015.

In FY18 the business generated revenues of $10.6m up

146% from the $4.3m earned in FY17. ACV also rose

145% from $7m to $17.2m. Clearly the U.S. business is

still very small but the runway for growth is long.

Although the size of the U.S. aerial imagery market is far

larger ($1.3b to $2.6b), the difference in geographic size

and population density of the U.S., compared to

Australia, means the capture program is far more

expensive to fly than it is domestically, costing the

company around $13m annually. In Australia, the five

largest cities account for almost 65% of the nation’s

population. In contrast, the ten largest cities in the U.S.

account for less than 10% of the population. As

penetration in the U.S. increases, the ongoing

investment in the capture program should remain

relatively stable.

In September of 2018, the company launched an

institutional equity raising, placing 43.75m new shares at

a price of $1.60 to raise $70m. The strategic rationale for

the raising was outlined as follows:

• Increased sales and marketing investment – As

discussed, investment in sales and marketing to

acquire customers makes sense, particularly given

the low customer churn and high margins the

company earns once the business begins to mature.

• International expansion and partnerships –

Demand from larger customers and partners in areas

outside of the current capture program has given the

company confidence to expand operations into

Canada. The United Kingdom is also an attractive

market given its size and population density. With

product demand underwritten by these large

customers, expanding the operations beyond their

current scope is a low risk, value accretive strategy.

50.0%

100.0%

150.0%

200.0%

250.0%

20182H1H20172H1H20162H1H

Australian division U.S. division

75.0%

80.0%

85.0%

90.0%

95.0%

100.0%

10.0

20.0

30.0

40.0

50.0

2014 2015 2016 2017 2018

Aus division revenue and gross profit

Revenue Gross profit Gross margins

(6.4%)

27.0%

(100.0%)

(50.0%)

50.0%

100.0%

(4.0)

(2.0)

2.0

4.0

6.0

8.0

10.0

12.0

2015 2016 2017 2018

Revenue Gross profit Gross margins

Selector Funds Management

25

• Technology and product investment – Investment in

research and development is critical to maintain a

competitive advantage over aerial imagery peers.

Balance sheet strength provides the company with

the firepower to more carefully consider make

versus buy decisions.

• Strategic flexibility – Although the company has

guided that they will be cash flow breakeven in FY19,

the additional balance sheet optionality provides

flexibility that the company previously lacked.

As the business is scalable and capital intensity low,

returns on invested capital will be high if Nearmap

maintains a competitive advantage over its peers.

Competition Nearmap's value proposition is already well established

and the sales and marketing strategy is based on

demonstrating this proposition to customers. The

biggest risk the company faces is competition that

successfully emulates their offering.

Eagleview Technologies The company's closest peer is the U.S. based Eagleview

Technologies which operates an on-demand report-

based model. Eagleview offers two main services:

• Providing bespoke photomap imagery (orthogonal2

and oblique3 imagery) to 1,700 municipal, country

and state government customers (35% of revenue in

12 months to 31 March 2018). A fleet of around 115

aircraft carry out their capture program, with a

claimed coverage of around 98% of the U.S.

population. It is estimated that images are updated

around once every two years.

• Sale of 3D wall and roof measurement reports to

residential contractors (29% of revenue) and

property and casualty insurers (28% of revenue). The

reports are generated using photomap imagery

collected during bespoke surveys for municipal,

county and state governments. Unlike Nearmap,

SME users of Eagleview's products do not get direct

access to imagery and instead, request reports on

specific properties. Although the report generation

is partially automated, there are elements of manual

2 Bird’s eye view.

intervention which are conducted by offshore

outsourced business process providers.

Eagleview has a number of technological shortfalls which

give Nearmap confidence they will be able to compete

with Eagleview on their home turf. As discussed,

refreshing Eagleview's entire capture area with new

imagery takes approximately two years, using 115

aircraft. In comparison, Nearmap captures

approximately 70% of the population but is able to

update its coverage three times a year using a fleet of

less than 20 planes, delivering similar or better

resolution outcomes.

Until its recent acquisition of Spookfish, Eagleview's

capture operations were limited to flying at around

2,000-3,000 feet, using off the shelf imaging technology,

compared with the 12,000 to 14,000 feet that Nearmap

flies at.

To help close the gap, Eagleview recently purchased the

Perth based aerial imagery specialist Spookfish for

$136m. Spookfish was started by a number of ex-

Nearmap employees and while they were able to take

their learnings with them, they have struggled to adapt

them to the capture system they developed. Our

understanding is that they have faced a series of

problems with the capture of oblique imagery, which

poses issues for Eagleview due to their reliance on this

type of imagery for the generation of 3D reports.

Despite the problems Spookfish face, Eagleview's

acquisition demonstrates how seriously they take

Nearmap as a threat. Although the purchase price is

small in the scheme of listed acquisitions, the alternative

of spending $140m on systems development should give

investors an indication of the financial resources the

company is prepared to throw at research and

development. Continued investment in research and

development is therefore critical, an area we address

below.

Satellite imagery Satellites are often raised as a potential competitive

threat to Nearmap’s operations. While images available

through Google Maps lack the resolution users require,

the prospect of falling launch costs has the potential to

make satellites more affordable.

3 Imagery captured at a 40 – 45 degree angle from the horizonal.

Selector Australian Equities Fund Quarterly Newsletter #56

26

Cost effective satellite imagery is still some way off.

Specialist DigitalGlobe plans to spend US$600m on its

next generation Worldview Legion program which will

launch earth imaging satellites aboard Elon Musk's

Falcon9 SpaceX rockets. These next generation satellites

will have around 30 cm resolution (30 cm on the earth's

surface will be represented by a single pixel). In

comparison, Nearmap photomaps have a resolution of

between 5 cm and 10 cm.

Military surveillance satellites are capable of far higher

resolution images than Nearmap generates, however,

these are extremely expensive to build and launch.

Smaller satellites can be launched at a lower cost,

however, there are limits to how small telescopes can be

without compromising the image resolution.

The threat of competition from satellite imaging

companies can't be entirely dismissed but for now, a

viable competitor is a long way off.

Drone image capture Recent improvements in drone technology have made

flight and aerial image capture far more accessible.

Although they give users the ability to capture imagery

quickly, drone flight lacks the scalability of a service such

as Nearmap’s. Current regulations largely ban the use of

drones beyond line of site. A key driver of uptake is the

ability to visualise buildings remotely, something drones

are incapable of within current regulatory frameworks.

The importance of research and development Although our assessment is that Nearmap has stronger

technical capabilities than their peers, continued

investment in research and development to maintain

and grow their advantage is critical. The rate that

Nearmap can acquire customers will be determined by

the advantages of their product over competitors and

margins will be determined by how efficiently capture

programs are run.

Nearmap Chief Technology Officer Tom Celinski, who

previously worked as the Director of Software at another

of the portfolio’s investments Aristocrat Leisure, breaks

down the technology into four functional streams.

4 Individual virtual servers in Amazon’s cloud designed for running applications on the AWS infrastructure which can be scaled up and down as operations require.

Camera system

The camera system is one of the key elements of

Nearmap's intellectual property. The research and

development process has cycled through several

generations of cameras from the original HyperPod,

followed by the HyperCamera (capable of capture at

8,000 feet), the HyperCamera2 and now the second

generation HyperCamera2 which is currently being rolled

out and is capable of flying at altitudes of up to 14,000

feet.

The HyperCamera2 comprises a housing which sits inside

a plane above a viewing hole. The system simultaneously

captures photographs of varying size and at a variety of

angles while the aircraft follows a pre-determined survey

path.

The system sits on a stabilisation platform to minimise

disturbances caused by turbulence. An articulating

mirror mechanism enables the capture of images at a

variety of angles, limiting the number of cameras

required and eliminating the need for physical

movement of the camera in between each successive

shot.

The goal is to capture a large number of overlapping

images while minimising blur. The higher the cruising

altitude, the more difficult this becomes.

Currently the HyperCamera2 can be used to run surveys

from an altitude of 12,000 to 14,000 feet. Celinski has

established a development program to increase the

survey altitudes to almost jet level capture (30,000 feet)

which, if achieved, will result in a markedly more efficient

capture program. In comparison, Eagleview surveys are

conducted at between 2,000 and 3,000 feet. Spookfish

can capture from around 8,000 feet but have struggled

to accurately deliver oblique imagery at this altitude.

Image processing system

Following a photo survey, the imagery is downloaded to

hard drives and couriered to Nearmap offices, where it is

loaded to Amazon Web Services (AWS). Hundreds of

AWS compute instances4 sort through data, choosing the

best images to splice together to create the continuous

photomaps.

Selector Funds Management

27

The system also re-constructs 3D models using the

imagery and sensor data collected during the flight,

publishing this in a variety of formats. Although the use

cases for this data are prospective, there are strong

justifications for its use in fields such as radio and

microwave signal propagation modelling and

development planning which require understanding of

line of sight between discrete 3D points in space.

Client user interface design

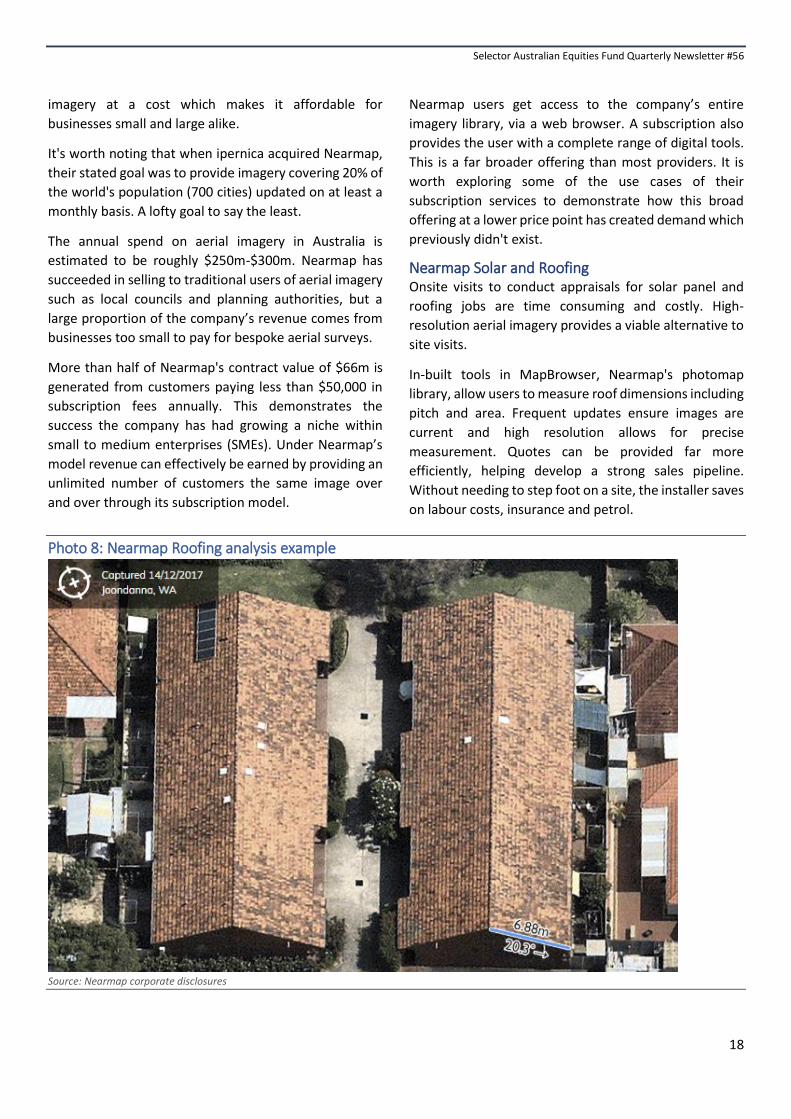
The MapBrowser interface is the subscription user's

main window into the imagery provided by Nearmap.

Central to the value proposition, the MapBrowser gives

users access to the entire photomap library and includes

tools for measurement of roof pitch, distances, flood

modelling etc.

Survey systems

Running survey flight operations isn't quite as simple as

scheduling survey locations and flight times months in

advance. Adverse weather, as well as seasonal changes

determine where and when surveys are run. To optimise

operations, a team of staff are tasked with monitoring

weather and organising the flights to ensure Nearmap

achieves appropriate frequency of coverage, while

capturing images through different seasons to allow

users to understand how the environment changes

between spring, summer, autumn and winter.

The future of aerial imagery The aerial imagery industry has now reached a tipping

point where scale is driving substantial growth beyond

the traditional use cases. Nearmap's approach to

building their business has literally been to change the

way businesses and government view and understand

the world, delivering value that was previously not

economically available to them.

The company is obviously not the first to recognise the

size of the potential market that can be tapped with the

right product and we expect them to face substantial

competition over the foreseeable future. Despite this,

we feel comfortable with the competitive position of the

company, particularly given the head start they already

have on their closest peers.

Nearmap has demonstrated the power of the business

model in the Australian market, where the scalability and

the attractiveness of the products are proven. Recent

progress indicates similar success in the U.S. is

achievable and the Nearmap management team's

confidence in the model is evident from the recent

capital raising and willingness to continue expanding

operations beyond the U.S. into Canada.

Nearmap has a market capitalization of $740m and net

cash of $17.5m at 30 June 2018, prior to the $70m raising

conducted in September. SFM

Selector Australian Equities Fund Quarterly Newsletter #56

28

Table 6: Nearmap historical timeline 2008 – 2018

Date Event

Jul 2008 Ipernica announces acquisition of geospatial imagery company Nearmap.

Feb 2010 Nearmap reports first sales to government agencies. City of Swan becomes the company’s first Government client.

Aug 2010 Nearmap founder Stuart Nixon joins ipernica Board and Simon Crowther appointed as company CEO.

Feb 2012 Ipernica announces plans to change company name to Nearmap.

Feb 2014 Launch of Nearmap Rail – a tool to help rail operators with asset management.

Apr 2014 Launch of Nearmap Solar – delivers instant client quotes and location aware power calculations without having to leave the office.

Jul 2014 Nearmap launches new FAA approved aerial camera system. HyperCamera is designed to fit in the cabin of any aircraft fitted with a standard camera hole.

Jul 2014 Launch of Nearmap Insurance.

Oct 2014 U.S. expansion announced with initial plans to capture 30% of the population and more than 100m people during FY15.

May 2016 Peter James appointed Chairman of the Board. Ross Norgard steps down as Chair and remains on Board as Non-Executive Director.

Jul 2016 Nearmap announced first imagery generated by HyperCamera2. Allows company to capture, process and publish 3D models from an altitude of 14,000 feet.

May 2017 New Zealand pilot capture program announced and confirms first commercial sale of imagery.

Jul 2017 Nearmap delivers new 3D content and oblique imagery transforming location content for a range of industries in the U.S. and Australia.

Aug 2018 Expansion of business operations to New Zealand announced. Dedicated sales, marketing and product resources established in country.

Sep 2018 Company launches institutional placement of 43.75m shares to raise $70m at $1.60.

Source: Nearmap company announcements

Selector Funds Management

29

WHERE NOT TO GO

The opening quote for this quarterly newsletter

resonates with us. As a unit we openly acknowledge that

we are not the smartest team in the room.

That said, we strongly believe in our investment

philosophy. We see it as being a sensible, patient

approach to delivering long-term performance. Our

record to date, a period stretching over 15 years is

perhaps an accurate reflection of that philosophy.

We openly discuss our ideas internally and publish our

thoughts in our monthly updates and quarterly

newsletters but avoid airing our views in the media. A

practice that, we believe, has become all too common

within our industry.

Obviously, all managers have their stated approach to

investing and we are no different. There are, however,

subtle variations that require further explanation. Below

we expand on one, namely stock selection and where not

to go.

Our bottom-up, business by business review process is

not driven by a black box or a quantitative model

selection outcome. Rather, it entails a deeper

appreciation of what makes a specific business worth

backing, including the very people entrusted to oversee

shareholder’s capital.

In our September 2017 Quarterly Newsletter, we

touched on this approach in our article titled “Culture –

Essential”. In that article we explained why we deem this

so critical to our assessment of businesses. Below we

include two extracts from that quarterly write-up.

“In business, we measure profits, cash flows, assets,

liabilities and the equity that keep the wheels turning. We

employ auditors to check the veracity of financial

statements. Accounts need to balance, and ratios must

be met but the picture that financial statements paint

rarely tell the whole story. Not everything is measurable.

In reality, financial statements are but a snapshot,

capturing a simple point in time. The long-term wellbeing

of a business is often determined by far more than just

numbers.”

and

“So, what makes an ideal leader? We would single out

one attribute; the stewardship of a company's assets and

its people, above all else. Shareholders expect their

leaders to set the right example and deploy their capital

in a sensible and disciplined manner. Leaders who

approach the task as if it were their own capital are far

more likely to make sensible decisions.”

The first quote refers to the parts of a business that are

far more difficult to measure than the pure financials.

The industry terms them qualitative attributes, leading

many to question the merits of apportioning too much

weighting in any final analysis.

The second entails an assessment of the team, both as

individuals and as a collective unit, all driving towards a

common goal.

The two combined are important, if not critical, to a

business’s ultimate long-term performance. They also

form the backbone of where we choose to go when

selecting businesses.

We are firm believers that a united team, one where

company management, employee culture and the

shareholders have clear alignment is where the greatest

long-term value can be generated.

It is also why we try to avoid those businesses where

internal conflict, including shareholder activism and

capital management programs are designed to deliver

short-term gain but rob the company of long-term

opportunities.

Below, we expand on these thoughts.

Emerging trend In recent times we have seen an increase in shareholder

activism. Led by proxy advisors who have muscled their

way into the domain of shareholder decision making.

Today, company boards are under constant pressure to

conform.

This can have unintended negative consequences. Those

who are elected to represent the best interests of the

public company, have become hostage to a host of

external demands.

This has led to some companies making changes that

appease the critics but, in the process, impair the

Selector Australian Equities Fund Quarterly Newsletter #56

30

business over the long-term. While our philosophy on

how we invest hasn’t changed, our views on which areas

to avoid have strengthened.

Where not to go Investing is represented by a diverse range of styles.

From passive to active, those that are index focused,

others index agnostic, short, long, value or growth, the

list is endless. Company boards that endeavour to satisfy

the needs of so many groups end up tying themselves in

knots.

In our pursuits, we seek businesses with leadership

qualities, run by competent management teams,

underpinned by strong balance sheets and with a focus

on capital management.

Above all, we aim to get the management piece right. We

see no point in going down a path where we have little

confidence in management’s ability or even worse,

where they have demonstrated a track record of capital

destruction.

To illustrate this point, it wouldn’t surprise many that

two stocks that have appeared in the press lately, AMP

and BHP Billiton don’t make the grade. To a lesser extent,

a third stock that is caught in a bind is Caltex Australia,

not knowing who to please.

AMP AMP has consistently fallen short of investor

expectations. They have a very long track record of

delivering poor returns. The events of the recent Royal

Commission further exposed their shortcomings.

Where some investors now see value in a weakened

share price, we simply take the opposite view and avoid.

The sale of AMP’s Life Insurance business is a case in

point. Agitated investors are questioning if fair value has

been extracted and are now threatening to call an

extraordinary general meeting to spill the board.

Shareholders who are calling the deal “stupid”, “value

destroying”, “terrible”, and a “brain explosion” are all

likely to be right in their assessment but what is even

more puzzling is why they are there in the first place.

How many bad deals do you have to do and how bad a

track record do you need before you realise the low

share price is telling you all you need to know?

It doesn't require much analysis to understand that a

business with a board that has overseen such poor

capital management decisions while presiding over a

culture that is so mis-aligned will continue to struggle

into the future until it is broken up and sold off. Hoping

to salvage value from this situation is drawing a long

bow.

Unfortunately for AMP shareholders, the writing has

been on the wall for some time, making the current

situation almost consistent with past outcomes.

BHP Billiton The clean-up at BHP Billiton following previously poor

capital allocation decisions has seen a new management

team determined to restore value. The most recent

example being the Board’s decision to return excess

funds to shareholders post the company’s exit from the

U.S. shale oil operations.

This will see some US$10.8b of dividends and capital

returned to shareholders. The decision to exit the U.S.

shale market, follows its entry in 2011.

Many shareholders have responded favourably to the

bounty of funds heading their way, but a little

perspective is required. Since embarking on this ill-fated

strategy, the company has ploughed some US$40b into

building the U.S. shale business.

The subsequent drop in oil prices during 2016 and a

reprioritisation by the newly elected management team,

led to the decision to put the assets up for sale. BP,

certainly not a new comer to the oil business, moved in

and acquired the assets, leaving BHP Billiton nursing an

overall loss of close to US$20b.

While the decision to return funds to shareholders may

be viewed in a positive light, it probably speaks more to

the pressure to return what little capital remains.

This is not the first time BHP have dropped significant

capital on ill-conceived resource projects, an aspect that

shareholders should readily consider before popping the

champagne corks.

Caltex Australia The company has done incredibly well over the years to

reduce its exposure to the low performing oil refinery

business.

Selector Funds Management

31

While selling fuel has been the backbone of the

company, the move into retail, via the Caltex outlets has

been a winning formula. Management are now

undertaking further analysis to understand the potential

of expanding their presence in this space.

In the meantime, the decision to take back control from

franchisee operators as well as analysing the effect

electric vehicles may have on the business long-term,

continues to demand management’s attention.

This led to a change in strategy regarding dividends, with

the board announcing in August 2018 the prospect of a

lower pay-out ratio. All hell then broke loose, with

prominent investors openly questioning the strategy,

demanding a higher dividend pay-out and capital

returns.

In late October the company changed tack and

confirmed the pay-out ratio would be lifted from the

intended 40%-60% range to the updated 50%-70% level

and would consider returning excess capital through

buybacks.

In making the switch CEO Julian Segal and CFO Simon

Hepworth commented that the company had been

listening to shareholders. We believe that is the problem.

Those pushing for higher a pay-out ratio might conclude

that the business is sound with a highly sustainable

earnings profile. Alternatively, it could be that they just

don't trust management to invest their capital wisely.

In this instance it is clearly the latter, which begs the

obvious question, why do these shareholders stay?

Whatever your view on Caltex, it makes little sense why

investors would remain in a business when there is a

clear lack of trust on how the business is being managed.

Management’s change of tack is not a good sign and is

reflective of the pressures powerful voices can have on a

company’s direction.

Where we choose to go For our part, we want to invest all our time and energy

on businesses where the management of the company

and the interest of shareholders are aligned.

We have no problem accepting less today for a greater

reward down the track. And we openly encourage and

support teams that acknowledge the importance of

undertaking investments ahead of the curve and who are

prepared to push back when circumstances dictate.

Investing is difficult enough without adding more layers

of complexity. Learning where not to go is a lesson worth

heeding and one we have looked to consistently apply in

our investment decision making process. SFM

Selector Australian Equities Fund Quarterly Newsletter #56

32

CORPORATE SPIN

Coca Cola Amatil’s investor briefing held in late

November provided little comfort for investors looking

for earnings clarity. We didn’t attend the event, nor have

we ever been an investor in the company, but a couple

of points are worth noting.

Shareholders deserve a few basic truths from company

management teams. One is financial transparency, the

second is honest and frank discussion about the

business, free of spin.

Having scrutinised the media release accompanying the

financial results, it is little wonder the share price sank

like a stone. Delivering sombre news to the market is

never easy and we have sympathy for those making

tough decisions, but the use of spin is a blight on Coca

Cola Amatil.

In our March 2017 Quarterly Newsletter, we highlighted

the difficulty the business was facing. A change in

consumer trends and increased competition had

crimped demand. This has impacted the group’s flagship

Beverages division, underpinned by its iconic brand

Coca-Cola.

Despite this uncertainty, management led by CEO Alison

Watkins saw fit to lift dividends and undertake a share

buy-back program while sticking with their target of mid-

single digit earnings per share growth over the medium

term. Views can differ on what constitutes the medium

term, but one to three years appears a fair period.

Fast forward to this year’s investor briefing day which

was accompanied by a 157-page presentation pack.

There is no doubting the level of disclosure and

preparedness to discuss business specifics.

Throughout the presentation the year 2014 was singled

out, the year Watkins joined the company. Four years on

and the business is still in transition. Management

described the situation as follows, “In Australian

Beverages, we will progress our Accelerated Australian

Growth Plan… In Indonesia, we will continue to deliver

our Accelerate to Transform strategy.”

Unfortunately, the update provided little in the way of

financial progress. Surely, a 157-page report could have

allocated one slide outlining financial performance since

2014. Call it a progress report, one that gives

shareholders some line of sight. In contrast, the financial

focus remained on the company’s 80% plus pay-out ratio

and the strength of its balance sheet.

Management’s summary provided little in terms of hard

numbers, relying instead on its message, “Overall, we

remain committed to our Shareholder Value Proposition

targeting a return to mid-single digit earnings growth in

the medium term.”

The outlook for 2019 is for another transitional year and

with no company guidance, analysts were left with no

option but to cut future year forecasts. Table 7 below

illustrates the summary financials since 2014 along with

analyst consensus forecasts out to 2020.

Shareholders have been offered lots of positive words,

but it would be preferable if, rather than relying on

corporate spin, management stuck more to the facts.

While management are sticking to their desire to deliver

“mid-single digit earnings growth in the medium term”

the real numbers suggest this is unlikely.

Running a publicly listed business isn’t easy which is why

we seek management teams who are prepared to speak

honestly and openly.

In singling out Coca Cola we are simply highlighting the

difficulty boards and management teams have in telling

shareholders the truth when a business is under

structural pressure.

You can only keep pushing the same message for so long.

The company’s languishing share price suggests

shareholders agree. SFM

Selector Funds Management

33

Table 7: Coca Cola Amatil financials5

2014 2015 2016 2017 2018HY 2018(e) 2019(e) 2020(e)

Revenue ($m) 4,953 5,094 5,078 4,933 2,417 4,979 5,083 5,173

EBIT pre-sig items ($m) 652 661 683 679 298 644 670 691

NPAT pre-sig items ($m) 376 393 418 416 179 388 400 413

EPS cents 49.2 51.5 54.7 55.9 24.7 53.7 55.3 57.2

DPS cents 42 43.5 46 47 21 45.3 45.9 47.3

Net Debt ($m) 1,871 1,146 992 1,337 1,453 1,494 1,455 1,404

Issued capital (m) 764 764 764 724 724 724 724 724

Share price ($) 9.32 9.30 10.12 8.51 9.20 8.19 Source: Coca Cola Amatil company financials

5 Financial year ending 31 December

Selector Australian Equities Fund Quarterly Newsletter #56

34

REGULATORY UNREST

The decision by the Australian Prudential Regulation

Authority (APRA) on 7 December to seek disqualification

proceedings against financial services group IOOF,

directors and executives, for failing to act in the best

interest of superannuation members came with little

warning.

The industry is undergoing a period of re-regulation, a

direct result of the fallout from the Royal Commission

into Misconduct in the Banking, Superannuation and

Financial Services Industry. The media coverage

surrounding the review process has been extensive,

impacting all the major retail industry players, including

the big four banks, life insurer AMP and now wealth

manager IOOF.

Turning specifically to IOOF, it would appear on our

reading that APRA and IOOF have disagreed on four

matters that occurred in the treatment of

superannuation members dating back to 2015. APRA

deems that IOOF contravened the Superannuation

Industry Supervision Act 2013 (SIS Act) by failing to act in

the best interests of members regarding errors that

occurred, referred to as breaches. It should be noted that

the breaches are not the primary issue, instead APRA is

not satisfied with how the breaches were handled.

IOOF remain confident they acted in accordance with

their legal obligations in correcting the breaches.

This appears to sit at the heart of the matter along with

APRA's desire to remove what it sees as an inherently

conflicted structure that has resulted in IOOF

undertaking a dual regulated role, in the capacity as the

Responsible Entity (RE) for IOOF managed investment

schemes and as the Registrable Superannuation Entity

(RSE) for the respective superannuation funds in

question.

In essence, APRA is arguing that wearing two hats, for

different parties, being shareholders and

superannuation members will lead to conflicted

outcomes.

APRA's concerns have merit, while IOOF has vigorously

defended its legal view that the company has acted in

the interest of both parties. The total amounts involved

in the breaches have not been outlined either by APRA

or IOOF, but the media has noted that they are small in

nature. Our understanding is that it is less than $2m. It is

also clear that any shortcomings suffered by

superannuation members since the breach was

uncovered have been rectified or “made whole.” Again,

our understanding is that superannuants have

subsequently been transferred to lower cost funds with

substantially higher reserving. In contrast, across the

four major Australian banks, the compensation and

compliance bill related to wrongdoing has already

topped $1.4b.

So why has APRA acted in such a heavy handled manner?

Deputy Chair of APRA Helen Rowell put the case forward

in her public statement that, “APRA's efforts to resolve

its concerns with IOOF have been frustrated by a

disappointing level of acceptance and responsiveness to

the issues raised by APRA, which is not the behaviour we

expect from an APRA-regulated entity.” She added,

“Furthermore, the individuals included in the proceedings

have shown a lack of understanding of their personal and

trustee obligations under the SIS Act and at law, and a

lack of contrition in relation to the breaches of the SIS Act

identified by APRA.”

At the company's recent annual general meeting held on

28 November, the Chairman George Venardos, put

forward a case that the company was responding

positively to the issues raised by the Royal Commission

and APRA. In particular, the Chairman noted the

concerns surrounding the dual regulated role and

outlined that a raft of changes were already in train.

Despite these reassuring comments, APRA saw things

differently, resulting in their actions on 7 December.

Post these events, the IOOF Board moved swiftly to deal

with the fallout. Chairman George Venardos and the

company's long-tenured Managing Director Christopher

Kelaher stepped aside pending resolution of the

proceedings. Their roles have been filled by Acting

Chairman Allan Griffiths and Acting CEO Renato Mota.

Both individuals have been with IOOF in their capacity as

a non-executive director and in wealth management

executive roles for 4 years and 15 years respectively.

In their new capacity, both Griffiths and Mota have

begun the process of mending the relationship with

APRA. The company has laid out the issues at hand and

Selector Funds Management

35

is working to address the matters as set out by APRA in

its Managed Action Plan (MAP). Elements of this plan

have already been completed, with the company having

begun the process back in September.

Further, in addressing one of the key concerns regarding

the dual role structure, significant work is required in

separating the Registrable Superannuation Entity (RSE)

and Responsible Entity (RE) functions of both IOOF and

Australian Executor Trustees into distinct legal entities.

The way forward now sits with IOOF and to an extent,

APRA. As long-term shareholders in IOOF, stretching

back over a decade, it is difficult to comprehend why

things got to this stage. While some could accuse us of

being biased in our view, it is surprising that of all the

financial breaches that have been uncovered in recent

years, including the significant fines that the major banks

have already incurred, that IOOF should be singled out

for disqualification proceedings and court action is

difficult to swallow.

And it is a view shared by others with Australian

Shareholders Association monitor Ian Curry criticising

APRA's role for taking an “overstated action” that is

“being delivered to a wider audience. It seems APRA is

looking for a soft target rather than taking on the banks,

AMP or others.”

APRA's public stand against IOOF has impacted

shareholders, leading to the company's market

capitalisation dropping over $900m in the period that

followed. Whether APRA took this into account or

considered their action necessary is for the court and

others to judge. There is no doubt that the findings from

the Royal Commission have shone the light not only on

the industry players but also on the regulators, who have

been criticised for acting slowly on regulatory matters.

It is apparent that APRA, ASIC and the ACCC now feel

compelled to act. Hopefully in their zeal to uphold the

law they take into consideration the consequences of

their actions. SFM

Selector Australian Equities Fund Quarterly Newsletter #56

36

2018 GLOBAL MARKET INDEX PERFORMANCE

Overall, the global market delivered a negative performance for the 2018 calendar year, driven in large part by the

significant losses in the final few months. Figure 7 and Figure 8 below compares the performance for the December

2018 quarter and the 2018 calendar year.

Figure 7: Global Market Index Performance for Calendar Year 2018

Source: IRESS Market Technology

Figure 8: Global Market Index Performance for December 2018 Quarter

Source: IRESS Market Technology

It is interesting to note that in the December quarter, the NASDAQ was the biggest detractor falling 17.54%, which

compares with an overall fall of 3.53% for the 2018 calendar year. In contrast, the Chinese Shanghai Composite was

one of the worst global performers for the calendar year falling 24.59% but fell in the mid-range of negative

performers for the final quarter. SFM

-25.00%

-20.00%

-15.00%

-10.00%

-5.00%

0.00%

5.00%

10.00%

15.00%

IBO

V (

BR

A)

NIF

TY (

IND

)

NC

50

(N

ZL)

NA

SDA

Q (

USA

)

DJI

(U

SA)

S&P

50

0 (

USA

)

XA

O (

AU

S)

CA

C4

0 (

FRA

)

Nik

kei (

JPN

)

FTSE

(G

BR

)

HA

NG

SEN

G (

HK

G)

DA

X (

DEU

)

SHA

(C

HN

)

-20.00%

-15.00%

-10.00%

-5.00%

0.00%

5.00%

10.00%

IBO

V (

BR

A)

NIF

TY (

IND

)

NC

50

(N

ZL)

HA

NG

SEN

G (

HK

G)

XA

O (

AU

S)

FTSE

(G

BR

)

SHA

(C

HN

)

DJI

(U

SA)

DA

X (

DEU

)

CA

C4

0 (

FRA

)

S&P

50

0 (

USA

)

Nik

kei (

JPN

)

NA

SDA

Q (

USA

)

Selector Funds Management

37

GOOD LEADERS TEACH

On November 15, 2018 Alibaba Group Vice Chairman Joe

Tsai received an Honorary Doctorate of Social Science at

the Education University of Hong Kong. Below is an

excerpt of his acceptance speech, delivered on behalf of

the Honorary Doctorate recipients to the congregation.

“Nineteen years ago, I walked into a modest second-floor

apartment in Hangzhou, China, and that visit changed

my life. I met a great teacher by the name of Jack Ma. I

not only met him, but also his disciples – who were his

students from university who followed him to start

Alibaba. And later these students became great teachers

in their own right.

Alibaba is a story of teachers. It is a story of teachers who

became leaders. It is a story of leaders who begot more

leaders.

You must be curious about how this happened, so here it

is.

We went from humble beginnings in 1999 to being one

of the largest technology companies in the world today.

As our business became more complex, as we scale our

operations from hundreds to thousands to tens of

thousands of people, we began to realize that we

couldn’t just add more people to handle all of that

growth. We must train them.

So, who was going to do that? All of that training and

mentoring. The tendency was to delegate this work to

our human resources department. But then we realized

that people development was the job of the business

leader, not the HR person. That was when we started to

appreciate that the qualities of a teacher are common to

sound leadership in business. That is, we began to realize

that good teachers make great business leaders.

You say, “oh yes I get it, big bosses always evaluate their

people, ranking them from best to worst, and as a

teacher this is what I do to my students as well.” Well,

leadership is a lot more than grading and ranking your

people.

Photo 16: Joe Tsai thank you speech after receiving honorary degree

Source: Alibaba

Selector Australian Equities Fund Quarterly Newsletter #56

38

Three things about teachers stand out to me.

First, good teachers are good communicators. Through

communication they connect with students, not only

enrich their minds but also touch their hearts. As a

business leader, if you want to lead a company, you have

to clearly communicate – excuse me, not only

communicate, but evangelize – the company’s mission,

vision and values to your employees. A company without

clear direction and a strong moral compass from its

leaders will be rudderless, with employees drifting off in

different directions and ultimately failing in either

execution or upholding ethical standards, or both.

Second, good teachers care about developing their

students, and they are willing to spend the time and

effort to make their students better. In a business, you

are constantly looking to improve the capabilities of your

talent base. The leaders who pay attention and invest

personal time to develop their people will achieve more

because with the support of a better team, you can scale

your business to new heights.

Third, good teachers have that innate sense of humility in

them. They are eager to see their student become more

successful than they are – in Chinese we say “青出于蓝”

(qing chu yu lan). The student has moved on to achieve

career success, and the teacher is thrilled to see that,

because they enjoy the fruits of what they sow. In a

business, you want your leaders to have that sense of

humility – what I call “胸怀” (xiong huai) – which is best

translated into English by Jack Welch, the legendary

chairman and CEO of General Electric. In his memoire,

which is the bible of business management, Jack Welch

said: “Grade A people hire other grade A people; grade B

people hire grade C people.”

In other words, you want your leaders to be able to hire

people who are smarter and better than they are.

Organizations improve only when you have leaders who

possess the self-awareness and humility to identify and

give young, smart people the opportunities to shine.

Develop young people and then step aside. True

leadership is about never taking credit for the success of

your team. By the same token, when great teachers are

asked to explain the secrets of their success in developing

great students, they will say all they did was unlock the

potential in their students.

We live in a very complex and challenging world. It is a

world full of frustration and discontent. The trade war

may last for a long time. As you walk out the gates of this

institution, you will be faced with unprecedented

challenges. But there are reasons to be optimistic. I am

optimistic about your future because you possess the

talent to lift up others, especially our younger generation

which is so important to the future of our society.

I’d like you to remember, no matter what profession you

end up in, your talents as a teacher – that is, your good

communication skills, your eagerness to develop people,

and your humility to let your students exceed you – will

always be in great demand. So, my final word of advice

is: don’t forget to teach, whether it is to your students or

your employees or your children. Always seize that

teaching moment to make others better. By making

others better you will make yourself better!”

Leadership As Tsai emphases, leaders must lead, and they must

teach. While not wishing to draw too long a bow, we aim

to identify management teams and company cultures

that allow the best to flourish. Successful businesses are

invariably powered by the silent majority, the staff, who

are entrusted to do the right thing. Importantly, they also

represent the face of many organisations and as such

they require a clear sense of direction and ethical

standards from those chosen to lead. Our earlier article

on Blackmores is illustrative of this direction, one wholly

endorsed by the group’s largest shareholder Marcus

Blackmore. SFM

Selector Funds Management

39

TWELVE SHORT STORIES DEFINE OUR CULTURE

We are often asked, by new clients, what differentiates

our firm? It is not an easy question to answer, because

the answer is intertwined in 12 short stories that

summarise our history. In today’s time poor world few

people have the inclination to read 12 stories, however,

short. We do, however, believe we are different. So, to

establish this point, we often emphasis one key aspect to

our approach.

• We have owned and run our own businesses for

decades. As a result, we think and act like long-term

business owners.

Our 12 short stories unfold in four stages typical of many

businesses,

• Start out small with some element of experience and

passion.

• Struggle for a long time and grow sensibly for the

right reason without reliance on debt.

• Associate with good people and try to maintain these

relationships over the long term.

• Continuously invest to improve the business.

Since inception, 15 years ago, we have grown from two

people to a team of nine. Culture was important initially,

but it was a given, rather than something that was

carefully laid out and followed, let alone communicated.

Back then our culture was based on our combined past

experiences. From the start we were determined to be

both open minded and prepared to explore new

avenues, with a simple caveat to avoid doing things we

were not comfortable with or didn’t understand.

Today, there is a need to articulate and communicate the

culture of the firm because our team is made up of

different generations, who come from diverse

backgrounds, with a variety of skill sets, views and

personal experiences.

This piece was not originally intended for the newsletter,

it was conceived as an internal discussion paper for our

team. It is a collection of the 12 stories that we draw

from when we articulate the history of the firm for

potential institutional investors and external investment

consultants carrying out due diligence or cultural

analysis.

Over the last 15 years these anecdotes have been shared

with many outsiders. Today, as a collection of short

stories they have two new purposes.

Firstly, we thought it was important to share these

stories with our insiders – our newer staff members, so

we can both teach and refine the cultural elements that

remain important to us while also building a better firm

for the future.

Secondly, in days gone by our new investors invariably

visited us. Today, with an established long-term track

record, this is no longer the case. So, we thought it would

also be informative to share our stories with the new

clients that have not had the chance to meet with us.

Finally, for the clients who have been with us for years,

we hope this adds another piece to the puzzle of

understanding how we go about investing your capital

for the long term.

Like our internal research pieces, our 12 stories are

recorded in point form. Like a good old slide show, some

dot points may be more relevant to the writer and

hopefully, some points may resonate for you, the reader.

The initial aim was to promote discussion, debate (even

arguments) and to create some of the lighter moments

that feed our firm’s internal jokes.

Perpetual story • 1983 – 88, Tony Scenna (TS) rose from ranks of

Analyst to Portfolio Manager (PM) of the Perpetual

Industrial Share Fund and Common Fund.

• A simple process was employed,

- Reading annual reports and making sense of the

published numbers,

- This was aided by tools including butcher paper

and lead pencils,

- The HP 12c (circa 1981) remains a key tool for TS

today,

- Reece Limited was added to the portfolio in the

mid 80’s and remains in Perpetual funds today.

• Perpetual performed very well post the crash of

1987 creating the platform for the future.

• TS left Perpetual in 1988 with fellow PM Chris

Bernays (to found Harper Bernays – HB) after

Perpetual added procedural layers to the investment

process.

Selector Australian Equities Fund Quarterly Newsletter #56

40

• To put this into historical context, this was prior to a

host of high-profile managers that followed at

Perpetual, including Anton Tagliaferro, Peter

Morgan, John Sevior and Matt Williams, all later

becoming household names within the funds

management industry.

The story behind PM’s coming together • TS and Corey Vincent (CHV) met in the early nineties

and formed a working relationship, Fund Manager –

Broker.

• Our separate businesses were located on the same

floor in Spring Street Sydney for nearly 10 years.

• In that time, we jointly attended hundreds of

company meetings, many we would today consider

un-investable.

• After setting out alone in 2001 to emulate what he

had seen at HB, CHV was joined by TS in 2003 and

SFM was founded from scratch,

- The 14% compound annual growth achieved

over the 14 years by HB’s long-term investors

while TS was PM was a long-term goal,

- This performance contrasted markedly with

those of transactional broking models.

The story behind our name • The name Selector reflected two ideals,

1. Selecting clients - With long-term investment horizons and

realistic expectations,

- Who understand the inherent risk of equity

investment, where markets can halve at points

in time.

2. Selecting the right stocks - Based on in-house research,

- Holding high conviction concentrated positions,

- Benefiting from real EPS growth over the long

term.

• Three years after inception, with excellent

performance, we entered the Global Financial Crisis

• Eight years after inception, two aligned equity

partners joined SFM to augment the management

team and grow the business for the right reasons,

- John Maragiannis (JM) 25 years of institutional

distribution experience.

- George Giovas (GG) 25 years of Banking and

Finance management experience.

• 10 years after inception IOOF acquired 15% of SFM

through its boutique funds program.

• 15 years after establishment our compound annual

return since inception is >12%.

The story of our staff • We seek to employ candidates we know or are well

known to our trusted associates.

• Staff are encouraged to invest in our funds over the

long-term.

• Staff are encouraged to study, and approved

education is funded by SFM.

• Senior staff receive base salary and bonus attached

to performance achieved for clients.

• Staff are our biggest single investment (cost).

• Our staff solve our problems by building technology

applications in house. We are proud of this.

• Our greatest success has come from long-term

relationships with staff.

• We offer a real pathway to portfolio management

for the right team members. This is a work in

progress.

• A business needs to grow sensibly to retain talented

staff.

A story of common sense investing • Our investment style is based on our own

experiences as business owners,

1. People are the most important ingredient, so we

focus on board, management and culture.

2. A business requires leadership qualities to grow

over the long-term.

3. We wouldn’t have debt in our business and we

prefer that to be the case in our investments.

4. Capital management is important, cash flow,

earnings, business re-investment and dividends.

• We start with a premise that many listed businesses

are not investment grade, based on the four points

listed above, so we don’t want to own them.

• Many of these (un-investable) businesses make up

an index for which we have no interest. As a result,

we are index agnostic.

• We do all our own research, so we understand

what’s happening when things go wrong. This is

often our best opportunity.

• When things go right we want to be rewarded. We

run a concentrated portfolio, so our winners make a

big difference to client returns.

Selector Funds Management

41

• This is a simple home truth – We can’t time markets,

so we don’t try. We invest for real earnings growth

which comes with time. Hence, we are long-term

investors with very low turnover, which is tax

effective.

• Our process is consistent and repeatable because we

only do things we believe in and eliminate the rest.

• Our phones ring rarely and this helps eliminate most

market noise.

The risk out story • We try to take as much risk off the table before we

invest.

• We can often watch a business for many years

before we invest,

1. The greatest risk is in the people.

2. A business with unique industry leadership

attributes is likely to be sustainable over the

long-term.

3. The balance sheet is our “get out of jail card”.

When things go wrong debt drives dilution.

4. If we get the top three right, real earnings

growth will enable re-investment and dividend

growth.

• The last thing we assess is the business valuation. We

use an all-in valuation (Buyout) of debt and equity as

you would if you bought the whole business to own

forever. We compare this to a risk-free rate, because

with equity you take on risk that needs to be

compensated for.

• We combine the Buyout with an 18-point Roadmap,

made up of qualitative and quantitative attributes

that experience has taught us are critical for long

term business viability.

• The Buyout and Roadmap drives our entry and exit

from investments.

Painting the Harbour Bridge Story • Businesses are modelled in-house.

• No information dump is used.

• The source of our data is annual reports and 4E and

4D statements, like Perpetual back in 1983.

• This process starts with the commencement of

reporting season.

• All company models in our universe are completed.

• When reporting season commences the process

starts again. Just like painting the Harbour Bridge.

The boat story • Investing is like getting into a little public boat with a

bunch of misfits,

- You do your homework then set off in uncharted

waters confident in your own understanding and

skill set.

- What you can’t prepare for are the actions of

others in the public boat (your fellow

shareholders).

- Some know more, and many know far less.

- Passengers will rock the boat, jump out at

inopportune times and sometimes just panic for

no real reason.

- Rocks are thrown at you boat by outsiders (fake

news, shorts, analyst views).

- These actions impact your journey in the short

term.

• It’s often a very long journey at sea for you and your

investment conviction, so we seek,

- A good crew (capable management),

- A good boat, (business with leadership qualities),

- Sound fuel, (clean balance sheet),

- Sensible navigation, (capital management).

• Our aim as always is a safe passage (real EPS growth).

The newsletter stories • We have been writing the newsletter for 16 years.

• When we started we had low funds under

management, very few clients and lots of time.

• We threw ourselves at our newsletter because it

gave us purpose and was the mouthpiece of our

convictions.

• Today, it’s a reflection of who we are and our

thoughts. It’s not widely read but remains very

important to us.

Worst investment story – the overvalued business vs the dud

The dud

• Imagine going to listen to a new investment listing

roadshow and learning that the prospective

investment target, a regulated educator no less, had

just overseen the death of a student, and then

continuing along the path to investing. We did that.

• The story got worse, modest debt was used to make

acquisitions and this ended up killing the business.

• It cost us 200 basis points of performance and was a

painful lesson we remember well.

Selector Australian Equities Fund Quarterly Newsletter #56

42

The over-valued business

• We sold a high multiple business that had performed

extremely well for the fund.

• We failed to understand the true pricing power of

depth and premium offers.

• The upside left on the table in the ensuing years was

well over 1000 basis points.

Running a business story • TS has 29 years’ experience running his own

business. TS was a founder at HB and SFM.

• CHV has 24 years’ experience running his own

business. CHV was a founder of broking businesses

and SFM.

• Four key learnings from being business owners drive

our investing,

- The importance of good people is paramount,

and culture is king.

- A business needs some unique attributes to be

sustainable over the long-term.

- A business with net cash rather than debt on the

balance sheet has options and is more valuable.

- Organic growth and free cashflow enables a

business to invest and grow over the long-term.

The culture of our business today • We remain a founder owned and led business.

• We invest in the funds alongside clients.

• Culture is at the forefront of how we invest, and we

attempt to apply our collective learnings of “best

practise” in our own business.

• We try to keep it simple and repeatable.

• Internally, on a cultural front, we are working

towards three simple goals,

1. Ethical conduct,

2. Business excellence,

3. Outperformance for clients and staff. SFM

Selector Funds Management

43

COMPANY VISIT DIARY – DECEMBER 2018 QUARTER

Date Company Description

3/10/2018 ALU Altium US Management Meeting

8/10/2018 OSH Oil Search Alaska Investor Tour

9/10/2018 OSH Oil Search Alaska Investor Tour

10/10/2018 OSH Oil Search Alaska Investor Tour

11/10/2018 OSH Oil Search Alaska Investor Tour

15/10/2018 IFM Infomedia Conference Call with Bart Vogel (Chairman)

15/10/2018 NVT Navitas Conference Call re takeover proposal

16/10/2018 COH Cochlear Annual General Meeting

16/10/2018 MP1 Megaport UBS Management Meeting

16/10/2018 MYO MYOB Group Conference Call re takeover proposal

16/10/2018 NVT Navitas Conference Call with Chairman

16/10/2018 NVT Navitas Conference Call with Rod Jones

17/10/2018 IPD Impedimed Annual General Meeting

18/10/2018 IPD Impedimed SFML Management Meeting

19/10/2018 DMP Domino Pizza Enterprise Investor Day - Brisbane

22/10/2018 SGM Sims Metal Management SFML Management Meeting

23/10/2018 SnapOn SnapOn UBS Conference Call

23/10/2018 PEXA PEXA Macquarie Briefing

23/10/2018 PEXA PEXA Macquarie Q&A Briefing

24/10/2018 FPH Fisher & Paykel Healthcare SFML Management Meeting

24/10/2018 FDV Frontier Digital Ventures SFML Management Meeting

24/10/2018 NEA Nearmap SFML Management Meeting

25/10/2018 BKL Blackmores Q1FY19 Results Conference Call

25/10/2018 BKL Blackmores Annual General Meeting

25/10/2018 REH Reece Annual General Meeting

26/10/2018 RMD ResMed Q1FY19 Results Conference Call

26/10/2018 IFM Infomedia Annual General Meeting

26/10/2018 CAR Carsales.com Annual General Meeting

29/10/2018 SEK SEEK SFML Management Meeting

25/10/2018 MP1 Megaport GS Tech Conference

25/10/2018 NEA Nearmap GS Tech Conference

25/10/2018 WEB Webjet GS Tech Conference

25/10/2018 WTC Wisetech Global GS Tech Conference

25/10/2018 SLC Superloop GS Tech Conference

25/10/2018 CAT Catapult Group GS Tech Conference

29/10/2018 BAP Bapcor Annual General Meeting

29/10/2018 DMP Domino Pizza Enterprise SFML Management Meeting

31/10/2018 NHF NIB Holdings Annual General Meeting

31/10/2018 NAN Nanosonics SFML Meeting

Selector Australian Equities Fund Quarterly Newsletter #56

44

Date Company Description

5/11/2018 BKL Blackmores Blackmores Asia Investor Tour

6/11/2018 BKL Blackmores Blackmores Asia Investor Tour

7/11/2018 BKL Blackmores Blackmores Asia Investor Tour

7/11/2018 ALU Altium MS Management Meeting

7/11/2018 CPU Computershare SFML Conference Call with Chairman

8/11/2018 JHX James Hardie Industries Q2FY19 Results Briefing

8/11/2018 PNV Polynovo Macquarie Life Sciences Corporate Day

8/11/2018 PXS Pharmaxis Macquarie Life Sciences Corporate Day

8/11/2018 IMM Immutep Macquarie Life Sciences Corporate Day

8/11/2018 NAN Nanosonics Macquarie Life Sciences Corporate Day

8/11/2018 TLX Telix Pharmaceuticals Macquarie Life Sciences Corporate Day

8/11/2018 SPL Starpharma Holdings Macquarie Life Sciences Corporate Day

8/11/2018 JHX James Hardie Industries Macquarie Management Meeting

8/11/2018 SGM Sims Metal Management JP Morgan Management Meeting

8/11/2018 JHX James Hardie Industries Management Meeting

9/11/2018 RHP Rhipe DB Management Meeting

9/11/2018 NAN Nanosonics Annual General Meeting

12/11/2018 WTC Wisetech Global UBS Australasia Conference

12/11/2018 MP1 Megaport UBS Australasia Conference

12/11/2018 NAN Nanosonics UBS Australasia Conference

12/11/2018 NHF NIB Holdings UBS Australasia Conference

12/11/2018 NXT Nextdc UBS Australasia Conference

12/11/2018 BRG Breville UBS Australasia Conference

13/11/2018 TNE Technology One UBS Australasia Conference

13/11/2018 BRG Breville Annual General Meeting

13/11/2018 NVT Navitas Conference Call re rejection of proposal

13/11/2018 JIN Jumbo Interactive MS Management Meeting

14/11/2018 JHX James Hardie Industries SFML Management Meeting

15/11/2018 NEA Nearmap Annual General Meeting

16/11/2018 RWC Reliance Worldwide Morgans Industry Call

16/11/2018 ALU Altium Investor Technology Day

16/11/2018 NEA Nearmap MS Post AGM Management Briefing

16/11/2018 ALU Altium Annual General Meeting

19/11/2018 OSH Oil Search PNG Investor Tour

19/11/2018 COH Cochlear SFML Conference Call with IR

19/11/2018 OFX OFX Group SFML Management Meeting

20/11/2018 OSH Oil Search PNG Investor Tour

20/11/2018 OFX OFX Group HY19 Results Conference Call

20/11/2018 TNE Technology One FY18 Results Conference Briefing

20/11/2018 OFX OFX Group SFML Management Meeting

20/11/2018 OFX OFX Group Macquarie Management Meeting

Selector Funds Management

45

Date Company Description

21/11/2018 TNE Technology One SFML Management Meeting

21/11/2018 VRT Virtus Health Annual General Meeting

21/11/2018 OSH Oil Search PNG Investor Tour

22/11/2018 OSH Oil Search PNG Investor Tour

26/11/2018 FPH Fisher & Paykel Healthcare HY19 Results Conference Call

26/11/2018 IFL IOOF Holdings SFML Meeting with Chairman

27/11/2018 OFX OFX Group SFML Meeting with Chairman

28/11/2018 COE Cooper Energy GS Emerging Energy Conference

28/11/2018 OEL Otto Energy GS Emerging Energy Conference

28/11/2018 ATS Australis Oil & Gas GS Emerging Energy Conference

28/11/2018 SXY Senex Energy GS Emerging Energy Conference

28/11/2018 NVT Navitas SFML Meeting with Chairman

29/11/2018 ALL Aristocrat Leisure FY18 Results Conference Call

30/11/2018 NEA Nearmap SFML Management Meeting

30/11/2018 ALL Aristocrat Leisure JP Morgan Management Meeting

30/11/2018 FPH Fisher & Paykel Healthcare SFML Management Meeting

3/12/2018 N/A InLoop Macquarie Tech Investor Day

3/12/2018 N/A Lendi Macquarie Tech Investor Day

3/12/2018 N/A ReadyTech Macquarie Tech Investor Day

3/12/2018 N/A BizCover Macquarie Tech Investor Day

3/12/2018 N/A Athena Macquarie Tech Investor Day

3/12/2018 N/A Healthshare Macquarie Tech Investor Day

3/12/2018 N/A :86 400 Macquarie Tech Investor Day

4/12/2018 IFL IOOF Holdings Investor Briefing

5/12/2018 CSL CSL Annual Research & Development Briefing

5/12/2018 ALL Aristocrat Leisure SFML Management Meeting

6/12/2018 FLT Flight Centre Travel Group Corporate Demonstration Meeting

6/12/2018 NVT Navitas SFML Management Meeting

7/12/2018 SGM Sims Metal Management SFML Management Meeting

10/12/2018 IFL IOOF Holdings SFML Conference Call

11/12/2018 SLC Superloop Morgans Management Meeting

11/12/2018 OFX OFX Group UBS Management Meeting

13/12/2018 NHF NIB Holdings SFML Management Meeting

19/12/2018 NAN Nanosonics SFML Management Meeting

Selector Funds Management Limited Disclaimer The information contained in this document is general information only. This document has not been prepared taking

into account any particular Investor’s or class of Investors’ investment objectives, financial situation or needs. The

Directors and our associates take no responsibility for error or omission; however, all care is taken in preparing this

document. The Directors and our associates do hold units in the fund and may hold investments in individual

companies mentioned in this document. SFM


Recommended