34
An Off-Grid Case Study PV Battery systems Simon Lannon 29 th January 2015
| Date post: | 16-Jul-2015 |
| Category: |
Technology |
| Upload: | bre |
| View: | 332 times |
| Download: | 1 times |

An Off-Grid Case Study PV Battery systems
Simon Lannon 29th January 2015

Outline
• Introduction to Solcer and the LCBE projects;
• Off Grid Case study
• Retrofitting existing dwellings
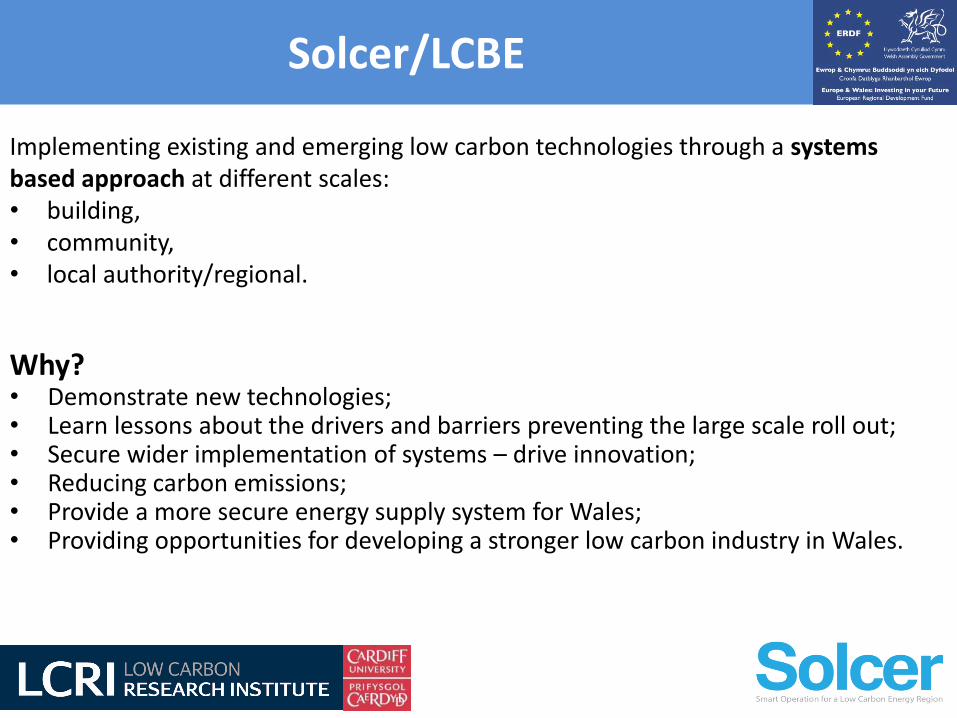
Solcer/LCBE
Implementing existing and emerging low carbon technologies through a systems
based approach at different scales:
• building,
• community,
• local authority/regional.
Why? • Demonstrate new technologies; • Learn lessons about the drivers and barriers preventing the large scale roll out; • Secure wider implementation of systems – drive innovation; • Reducing carbon emissions; • Provide a more secure energy supply system for Wales; • Providing opportunities for developing a stronger low carbon industry in Wales.

Solcer
Project team Wide range of expertise from:
• Welsh School of Architecture, Cardiff University;
• Computer Science/School of Engineering , Cardiff University;
• College of Engineering, Swansea University;
• Centre for Solar Energy Research Centre, Glyndwr University;
• Sustainable Energy Research Centre, University of South Wales.
Includes experts in building modelling, power electronics, computer science, marine
modelling, urban scale modelling, building engineers, architects, supply technology
development, energy storage technology development.

Outline Off Grid Case Study
Fully off-grid three bed farm house.
Main contractor: Self build
Lead Designer: Building Research Establishment (BRE)
Other project participants:
Caerphilly County Borough Council (RDP Energy team),
Scottish and Southern Energy (SSE),
Constructing Excellence in Wales
Monitoring has been carried out by the Welsh School of Architecture, Cardiff University.
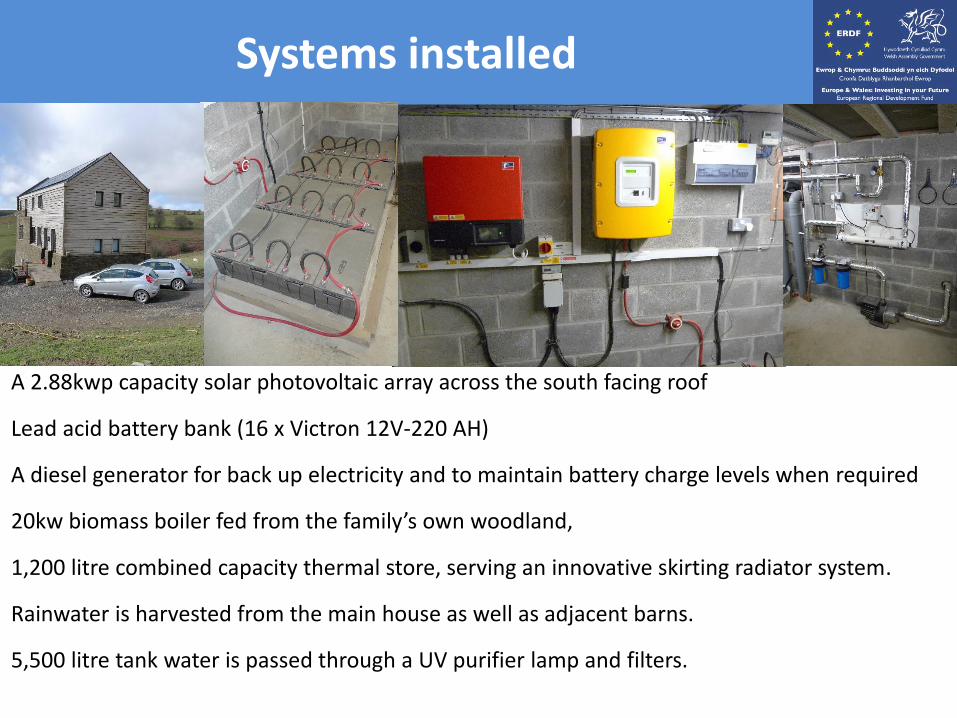
Outline Systems installed
A 2.88kwp capacity solar photovoltaic array across the south facing roof
Lead acid battery bank (16 x Victron 12V-220 AH)
A diesel generator for back up electricity and to maintain battery charge levels when required
kw io ass oiler fed fro the fa ily s ow woodla d,
1,200 litre combined capacity thermal store, serving an innovative skirting radiator system.
Rainwater is harvested from the main house as well as adjacent barns.
5,500 litre tank water is passed through a UV purifier lamp and filters.

0
100
200
300
400
500
600
Jul.13 Aug.13 Sep.13 Okt.13 Nov.13 Dez.13 Jän.14 Feb.14 Mär.14 Apr.14 Mai.14 Jun.14 Jul.14 Aug.14 Sep.14
En
erg
y k
Wh
Maes Yr Onn Electrical systems monthly totals
Diesel Generator
Appliances
PV Generation
Outline Energy Supply – Daily average

Energy Demand – Daily Average
0
200
400
600
800
1000
1200
1400
Jul.13 Aug.13 Sep.13 Okt.13 Nov.13 Dez.13 Jän.14 Feb.14 Mär.14 Apr.14 Mai.14 Jun.14 Jul.14 Aug.14 Sep.14
En
erg
y u
se k
Wh
Maes Yr Onn Energy use
Heating
Hot Water
Appliances

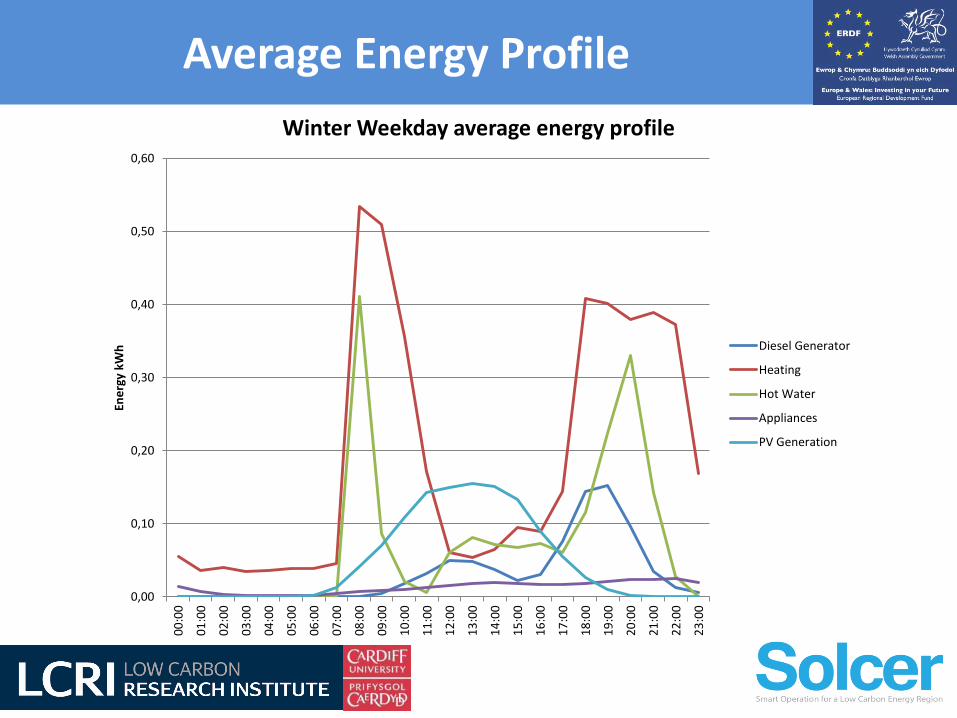
Average Energy Profile
0,00
0,10
0,20
0,30
0,40
0,50
0,60
00
:00
01
:00
02
:00
03
:00
04
:00
05
:00
06
:00
07
:00
08
:00
09
:00
10
:00
11
:00
12
:00
13
:00
14
:00
15
:00
16
:00
17
:00
18
:00
19
:00
20
:00
21
:00
22
:00
23
:00
En
erg
y k
Wh
Summer Weekday average energy profile
Diesel Generator
Heating
Hot Water
Appliances
PV Generation
0,00
0,10
0,20
0,30
0,40
0,50
0,60
00
:00
01
:00
02
:00
03
:00
04
:00
05
:00
06
:00
07
:00
08
:00
09
:00
10
:00
11
:00
12
:00
13
:00
14
:00
15
:00
16
:00
17
:00
18
:00
19
:00
20
:00
21
:00
22
:00
23
:00
En
erg
y k
Wh
Winter Weekday average energy profile
Diesel Generator
Heating
Hot Water
Appliances
PV Generation
Average Energy Profile

30
35
40
45
50
55
60
0
0,1
0,2
0,3
0,4
0,5
0,6
0,7
0,8
0,9
1
14.02.2014 00:00 15.02.2014 00:00 16.02.2014 00:00 17.02.2014 00:00 18.02.2014 00:00 19.02.2014 00:00 20.02.2014 00:00
Ba
tte
ry V
olt
ag
e (
volt
s)
Ele
ctri
cal
en
erg
y k
Wh
Voltage and Electrical energy
Diesel Generator Appliances PV Generation Battery Voltage
Energy Supply – Sample days
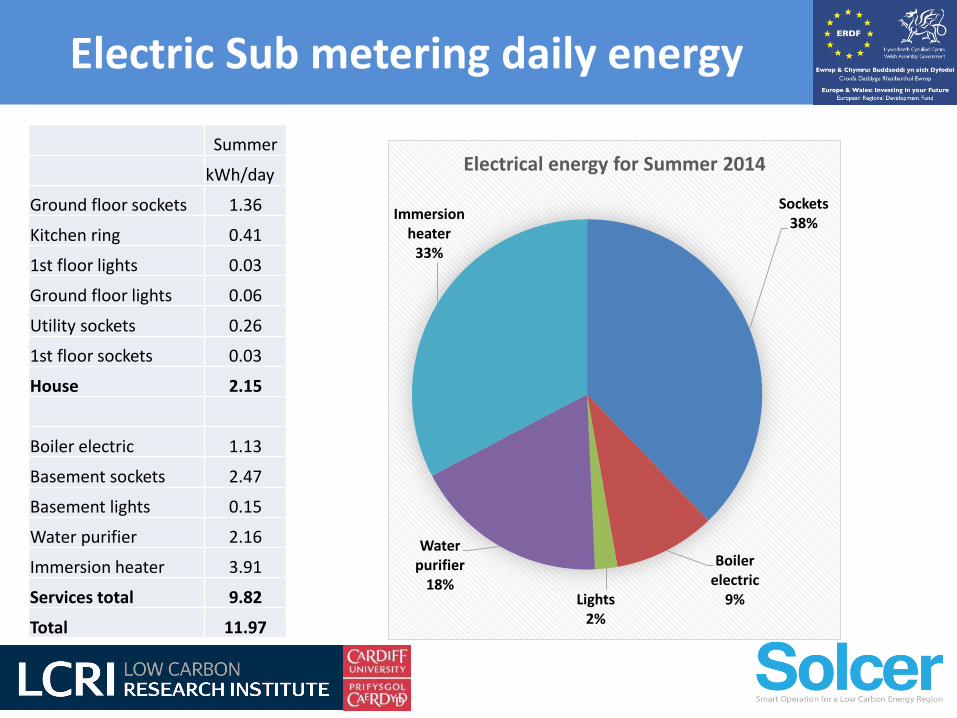
Electric Sub metering daily energy
Summer
kWh/day
Ground floor sockets 1.36
Kitchen ring 0.41
1st floor lights 0.03
Ground floor lights 0.06
Utility sockets 0.26
1st floor sockets 0.03
House 2.15
Boiler electric 1.13
Basement sockets 2.47
Basement lights 0.15
Water purifier 2.16
Immersion heater 3.91
Services total 9.82
Total 11.97
Sockets
38%
Boiler
electric
9% Lights
2%
Water
purifier
18%
Immersion
heater
33%
Electrical energy for Summer 2014

0,0
2,0
4,0
6,0
8,0
10,0
12,0
14,0
16,0
01.05.2014 01.06.2014 01.07.2014 01.08.2014 01.09.2014 01.10.2014 01.11.2014
Ele
ctri
cal
en
erg
y k
Wh
Daily electrical energy use kWh
gnd floor sockets kitchen ring 1st floor sockets utility sockets gnd floor lights
basement lights boiler electric basement sockets immersion heater water purifier
Electric Sub metering

Average over a week
0,0
1,0
2,0
3,0
4,0
5,0
6,0
7,0
8,0
04.04.2014 04.05.2014 04.06.2014 04.07.2014 04.08.2014 04.09.2014 04.10.2014
Da
ily
En
erg
y D
em
an
d k
Wh
/da
y
Weekly average
gnd floor sockets kitchen ring 1st floor lights 1st floor sockets utility sockets
gnd floor lights basement lights boiler electric
basement sockets Gas immersion heater water purifier

Water usage
0,0
10,0
20,0
30,0
40,0
50,0
60,0
70,0
80,0
90,0
100,0
Jul.13 Aug.13 Sep.13 Okt.13 Nov.13 Dez.13 Jän.14 Feb.14 Mär.14 Apr.14 Mai.14 Jun.14 Jul.14 Aug.14 Sep.14
Wa
ter
use
lit
res
pe
r d
ay
Maes Yr Onn water use litres per day per person
The standard consumption quoted by BRE is 101 litres per person per day,
for Maes Yr Onn it is on average 63 litres per day per person
Predicted consumption

UV lamp and control systems have a base load of 78W
pump has a load of 1.1Wh/l.
For May 2014 the water supply consumption including pump and UV light 8.54Wh/l
compares to the mains water supply average energy used to supply water of 0.6 Wh/l
y = 1,0918x + 13,065
R² = 0,7447
0
20
40
60
80
100
120
140
0 10 20 30 40 50 60 70 80 90 100
En
erg
y co
nsu
me
d W
h
Water drawn off (l)
Water drawn off and water system energy consumed
Water usage

Summary
• PV is dominant energy source for over half the year
• Heating demand for the year is 6,908 kWh, 65 kWh/m2
• The appliance use in the house on average is 2.0 kWh per day, the BRE report
quotes a figure of 6.7 kWh per day.
• The house monitoring has not included the services parasitic load including the
water purification energy demand
• Summer 2014 is 5.8 kWh per day
• Occupant is adapting the system to protect the batteries
• Using two thirds of the water predicted 63 litres/day/person
17

Typical Welsh end terrace
Retrofit of existing dwellings

Original property condition
• Pre 9 s
• Solid Stone Construction
• UPVC Single Glazed Windows
• Inefficient Gas Combi Boiler
• No Flat Roof/Loft Insulation
• No Fabric Insulation

• Location
• Construction type
• Likely occupancy patterns
• Historical Weather Data
Considerations for Simulation Condition
Simulation of retrofit options

Type Wall
Insulation
Window Type
Air Tightness
Heating
kWh Per annum
Heating kWh/m2
Energy Savings
Before
Solid wall 1.98 W/m2.K
Single
Glazing 4.80 W/m2.K
0.73 ACH 12,981 196.7 0%
After Solid wall
with EWI 0.32 W/m2.K
Low E
Double Glazing
2.0 W/m2.K
0.38 ACH 3,224 48.8 75%
Heating energy saving
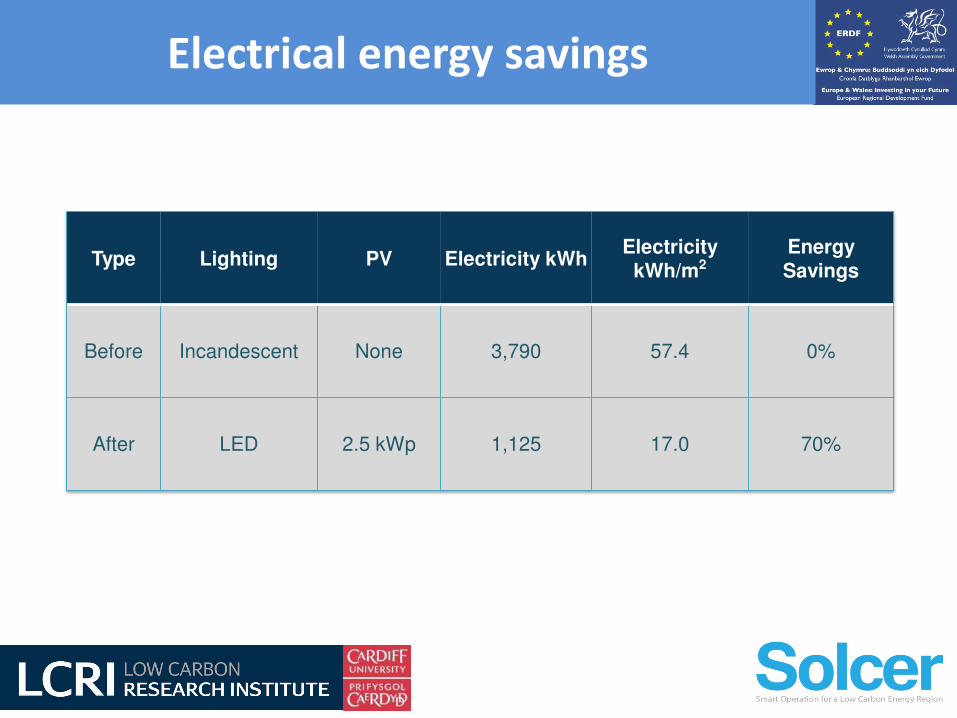
Electrical energy savings
Type Lighting PV Electricity kWh Electricity
kWh/m2 Energy
Savings
Before Incandescent None 3,790 57.4 0%
After LED 2.5 kWp 1,125 17.0 70%

Measures installed
Fabric
• EWi PRO Gutter System
• Flat Roof/Loft Insulation
• A Rated UPVC Double Glazed Windows
Systems
• GB-SOL 2.5 kWp Roof Integrated Photovoltaic Array with Battery Storage;
• EWI Pro External Wall Insulation with AeroGel Insulation on Reveals;
• EnviroVent Whole House Mechanical Ventilation with Heat Recovery.
• New A Rated Gas System Boiler
• New Water Tank – usi g surplus PV a t sell a k to grid
• Climote - Wireless Smart Heating Controls
• DC Power
• LED Lighting Circuit

Building Integrated PV
Roof tiles not required
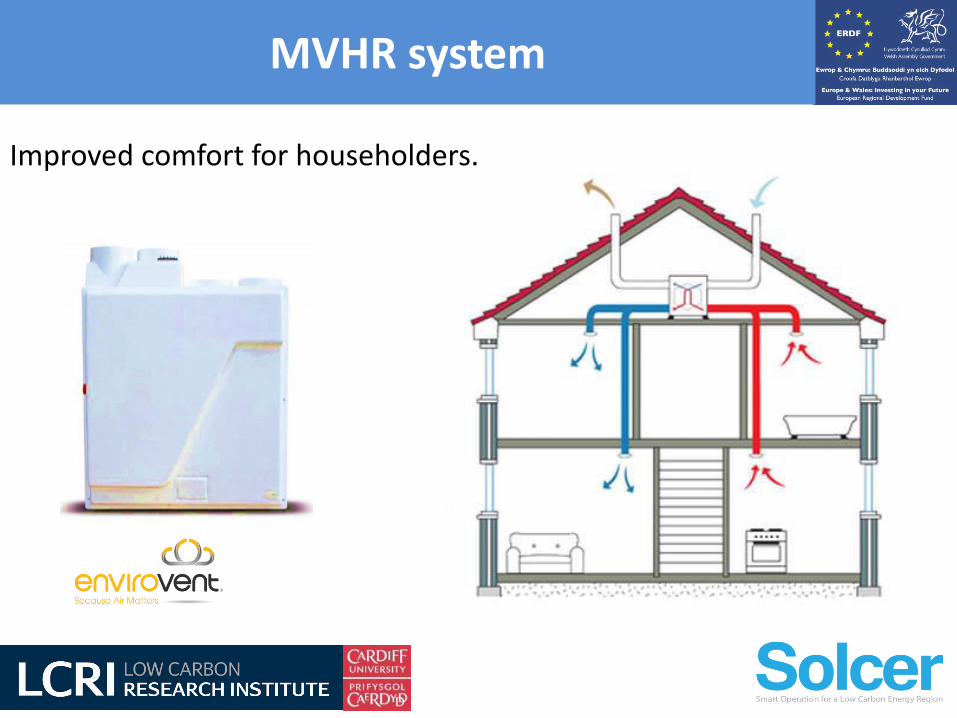
MVHR system
Improved comfort for householders.
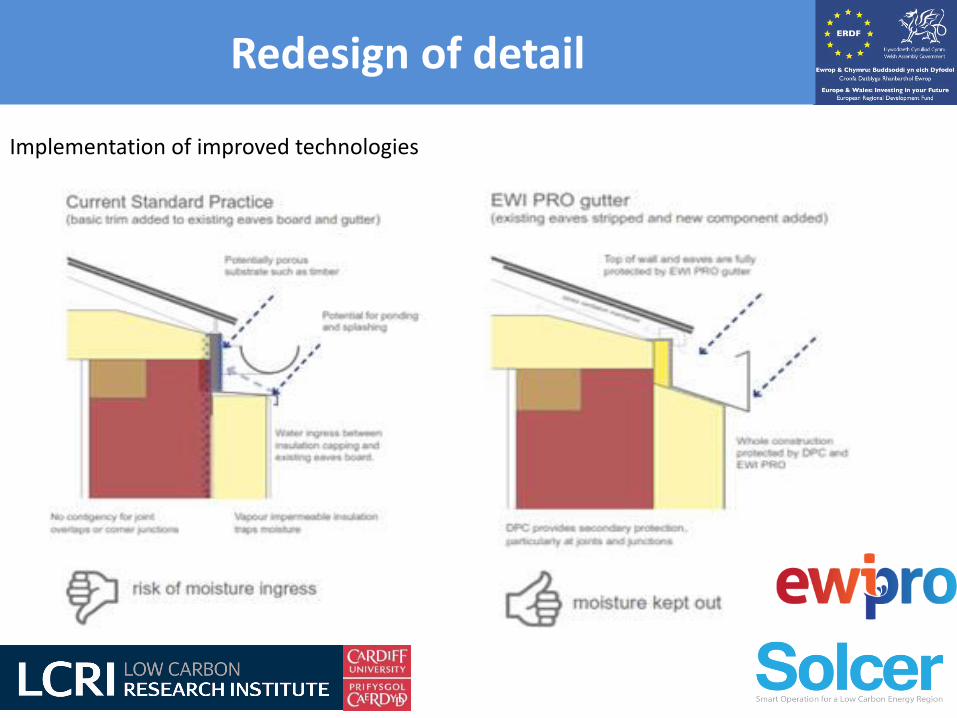
Redesign of detail
Implementation of improved technologies

• Fabric performance
• Occupant perceptions
• Appliance use diaries
• Monitoring of construction costs
• Measurement of thermal comfort
• Indoor air quality
• Local weather conditions
• Energy demand, supply and storage
Pre and post test surveys

User interfaces
Climote – wireless smart
heating controls – phone,
online or text
Electricity / Water /
Gas
Consumption Battery Status

Cost of works
System Component Cost Proportion
MVHR £3,000 11.0%
Insulation £9,740 35.6%
PV Assisted System Boiler £3,800 13. 9%
LED Lighting £150 0.5%
Photovoltaic Roof £7,180 26.3%
Battery Storage £3,460 12.7%
Total £27,330 100%

Recovering voids back into the housing stock

Initial results
0
20
40
60
80
100
120
140
160
180
So
lar
Ra
da
itio
n w
W/m
2
Reference Cell Daily average
Retrofit 1 Retrofit 2 Retrofit 3

Initia
l resu
lts
0
10
0
20
0
30
0
40
0
50
0
60
0
70
0
80
0
90
0
00:00
00:35
01:10
01:45
02:20
02:55
03:30
04:05
04:40
05:15
05:50
06:25
07:00
07:35
08:10
08:45
09:20
09:55
10:30
11:05
11:40
12:15
12:50
13:25
14:00
14:35
15:10
15:45
16:20
16:55
17:30
18:05
18:40
19:15
19:50
20:25
21:00
21:35
22:10
22:45
23:20
23:55
Solar Radiation W/m2
Re
fere
nce
Ce
ll Sa
mp
le D
ay 1
9/0
1/1
5
Re
trofit 1
Re
trofit 2
Re
trofit 3

Project staff Solcer
Ester Coma Bassas
Enrico Crobu
Heledd Iorwerth
Huw Jenkins
Xioajun Li
Kenan Zhang
Tracey Booth
Rachel Jones
LCBE
Elizabeth Doe
Richard Hall
Rhian Williams
Thank you

Websites
Solcer – www.solcer.org
LCBE – www.lcbe.cardiff.ac.uk
GB-sol - www.gb-sol.co.uk
Constructing Excellence in Wales - http://www.cewales.org.uk/buildings/
Contact details
Simon Lannon – Solcer research fellow – [email protected]
Jo Patterson – Solcer project manager – [email protected]
Thank you


