I-95 Access Study New Access to I-95 between Route 3 and the Rappahannock River Page 91 6. ANALYSIS OF PREFERRED ALTERNATIVE 6.1 Description of Preferred Alternative Alternative N5, with a full interchange, was chosen as the preferred alternative. The preferred alternative consists of several components described below. New Interchange on I-95 Alternative N5 involves a new full interchange connection to I-95 between the Virginia Welcome Center and the Rappahannock River as shown previously in Figure 5-4. The interchange provides access to the west via a new connector road. No access is provided east of I-95 because the connector road does not extend east of I-95 (there has been no established need for such a route). Directional and semi-directional ramps and flyovers provide access to and from northbound and southbound I-95 (see Figure 6-1). The SB to WB off-ramp and the EB to NB on-ramp would be two-lane directional/semi-directional ramps. The EB-NB two-lane on- ramp would cross the Rappahannock River on a separate bridge structure (immediately adjacent to the existing NB bridge), then split providing access to I-95 and Route 17, braid with the I-95 NB to Route 17 EB and WB off-ramp and then merge with NB I-95. The NB I-95 bridge over Route 17 will be replaced and widened to accommodate the on-ramp acceleration lane and provide additional vertical clearance for Route 17. The new two-lane I-95 SB to WB/NB off- ramp to the new interchange would braid with the Route 17 EB/SB to I-95 SB on-ramp and cross the Rappahannock River on a separate bridge structure (immediately adjacent to the existing SB bridge). The rest area off-ramp would diverge from the new interchange SB to WB ramp. Figure 6-1: New I-95 Interchange
Transcript
I-95 Access Study New Access to I-95 between Route 3 and the Rappahannock River
Page 91
6. ANALYSIS OF PREFERRED ALTERNATIVE
6.1 Description of Preferred Alternative Alternative N5, with a full interchange, was chosen as the preferred alternative. The preferred alternative consists of several components described below.
New Interchange on I-95
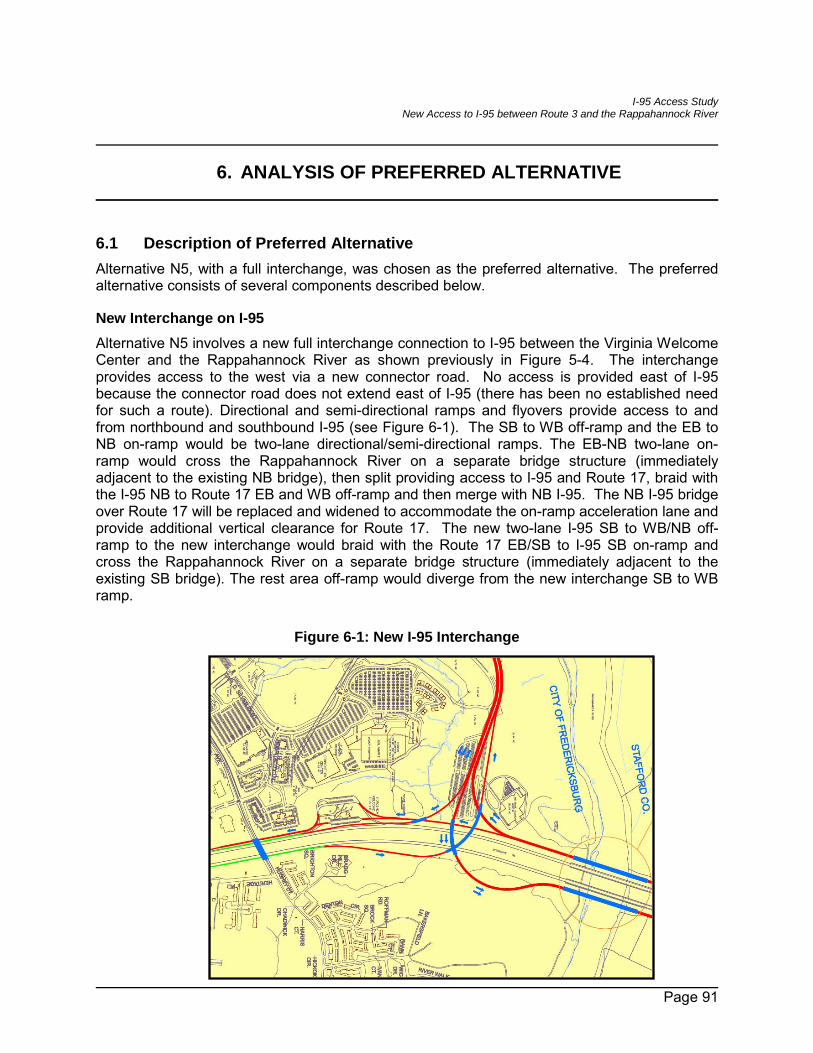
Alternative N5 involves a new full interchange connection to I-95 between the Virginia Welcome Center and the Rappahannock River as shown previously in Figure 5-4. The interchange provides access to the west via a new connector road. No access is provided east of I-95 because the connector road does not extend east of I-95 (there has been no established need for such a route). Directional and semi-directional ramps and flyovers provide access to and from northbound and southbound I-95 (see Figure 6-1). The SB to WB off-ramp and the EB to NB on-ramp would be two-lane directional/semi-directional ramps. The EB-NB two-lane on-ramp would cross the Rappahannock River on a separate bridge structure (immediately adjacent to the existing NB bridge), then split providing access to I-95 and Route 17, braid with the I-95 NB to Route 17 EB and WB off-ramp and then merge with NB I-95. The NB I-95 bridge over Route 17 will be replaced and widened to accommodate the on-ramp acceleration lane and provide additional vertical clearance for Route 17. The new two-lane I-95 SB to WB/NB off-ramp to the new interchange would braid with the Route 17 EB/SB to I-95 SB on-ramp and cross the Rappahannock River on a separate bridge structure (immediately adjacent to the existing SB bridge). The rest area off-ramp would diverge from the new interchange SB to WB ramp.
Figure 6-1: New I-95 Interchange
I-95 Access Study New Access to I-95 between Route 3 and the Rappahannock River
Page 92
The EB to SB on-ramp would be a single lane ramp that would braid with the rest area off-ramp and then merge with southbound I-95. The rest area on-ramp merge with I-95 would be shifted to the south 1400 feet. A continuous auxiliary lane would be developed between the rest area on-ramp and the SB to WB off-ramp at Route 3. A single lane NB to WB flyover ramp would cross over the EB to NB ramp, the I-95 mainline and the SB to WB ramp and connect with the proposed connector road. The south-facing ramps will require the Fall Hill Avenue bridge to be replaced so the acceleration and deceleration lanes for the ramps can be provided under the bridge. VDOT and the City of Fredericksburg have plans to widen the Fall Hill Avenue bridge to 4 lanes.
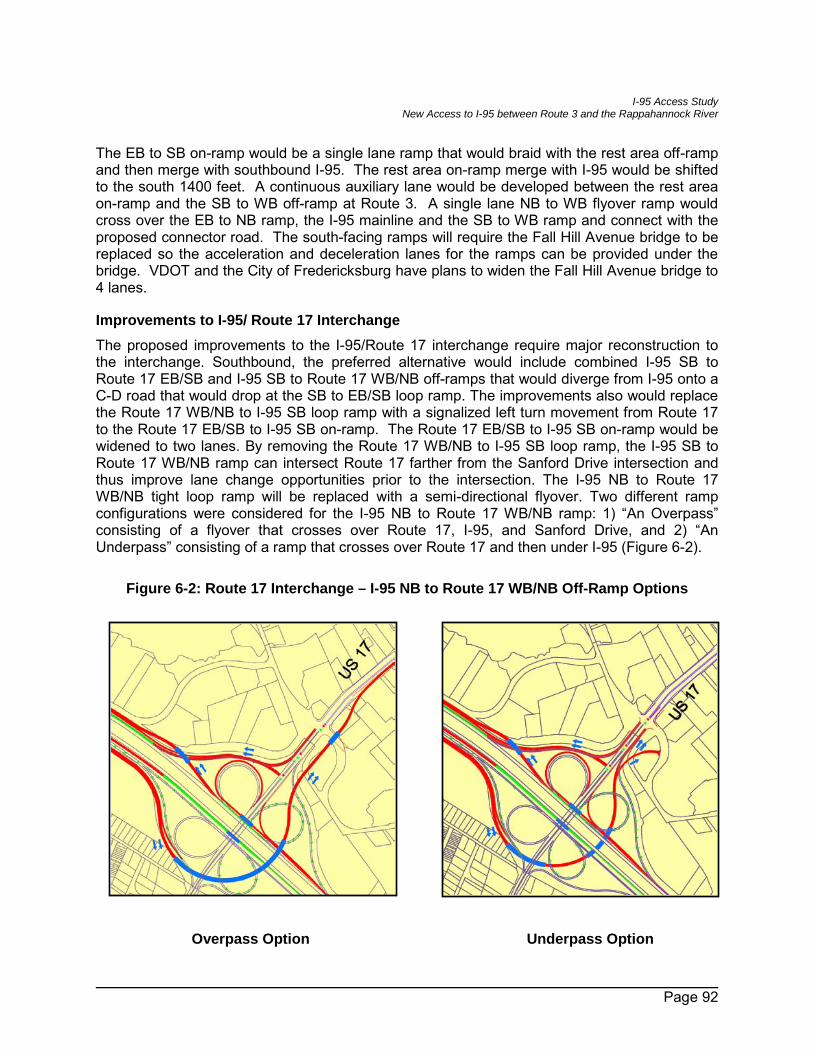
Improvements to I-95/ Route 17 Interchange The proposed improvements to the I-95/Route 17 interchange require major reconstruction to the interchange. Southbound, the preferred alternative would include combined I-95 SB to Route 17 EB/SB and I-95 SB to Route 17 WB/NB off-ramps that would diverge from I-95 onto a C-D road that would drop at the SB to EB/SB loop ramp. The improvements also would replace the Route 17 WB/NB to I-95 SB loop ramp with a signalized left turn movement from Route 17 to the Route 17 EB/SB to I-95 SB on-ramp. The Route 17 EB/SB to I-95 SB on-ramp would be widened to two lanes. By removing the Route 17 WB/NB to I-95 SB loop ramp, the I-95 SB to Route 17 WB/NB ramp can intersect Route 17 farther from the Sanford Drive intersection and thus improve lane change opportunities prior to the intersection. The I-95 NB to Route 17 WB/NB tight loop ramp will be replaced with a semi-directional flyover. Two different ramp configurations were considered for the I-95 NB to Route 17 WB/NB ramp: 1) “An Overpass” consisting of a flyover that crosses over Route 17, I-95, and Sanford Drive, and 2) “An Underpass” consisting of a ramp that crosses over Route 17 and then under I-95 (Figure 6-2).
Figure 6-2: Route 17 Interchange – I-95 NB to Route 17 WB/NB Off-Ramp Options
Overpass Option Underpass Option
I-95 Access Study New Access to I-95 between Route 3 and the Rappahannock River
Page 93
Connector Road The Connector Road will serve destinations to the west of I-95 with an ultimate terminus at Route 3 in the vicinity of Gordon Road (about 3.25 miles west of I-95). The total length of the connector road is about 4 miles. Other than the two termini of the Connector Road, only one access point (Interchange A) is proposed in the City of Fredericksburg to serve existing and future commercial and residential development in this area. This access point (Interchange A) will serve commercial areas adjacent to I-95 and is discussed in the next section. Section One of the Connector Road includes the portion from I-95 to Interchange A. Section One is proposed as a 6-lane Principal Arterial to serve the forecasted traffic demand in the year 2035. A median barrier could be considered during design for this section to reduce right-of-way. Section Two of the Connector Road includes the portion from Interchange A to Route 3. This section is proposed as a 4-lane Rural Principal Arterial with “parkway” characteristics such as landscaping, aesthetic treatments, and a multi-use trail. Figure 6-3 illustrates possible typical sections of each section of the Connector Road. The design of the connector road would accommodate open road tolling (no toll booths). Numerous factors were considered to establish the alignment of the Connector Road, such as environmental constraints, impacts to the built environment, topography, and maintenance of property access. Two alignments are currently being considered for the Connector Road as shown in Figure 6-4. Based on a preliminary review of property impacts, environmental constraints, and topography, a preferred alignment will be chosen as part of any subsequent NEPA document. A proposed development (Cornerstone Home Site) north of Route 3 proposes geometric challenges to the connector road; however, an easement has been provided for the purpose of this new roadway.
Median46’
12’12’ 12’12’
110’
CL
Westbound Eastbound
6-Lane Rural Principal Arterial with Controlled Access
4-Lane Divided Rural Principal Arterial with Controlled Access
10’
134’
19’19’
CONNECTOR ROAD TYPICAL SECTIONS
FIGURE 6-3
Median46’
CL
Design Speed = 60 M.P.H.
Design Speed = 60 M.P.H.
8’* 4’* 4’*
12’12’ 12’ 13’ 12’ 12’12’
30’
Clear Zone
13’ 10’ 6’13’
13’
Shoulder Shoulder
8’ 8’
* Additional right of way width may be required for drainage requirements, to tie into existing ground, or for horizontal curves.
I-95 Access Study New Access to I-95 between Route 3 and the Rappahannock River
Page 96
Interchange A to Commercial Areas on Connector Road The only access along the Connector Road would be to commercial areas near I-95 that includes Central Park and Celebrate Virginia. Maintaining uninterrupted flow along the Connector Road requires the access to be an interchange. Figure 6-5 shows one concept of how an interchange (Interchange A) could look at this location. (This configuration was analyzed in Section 6.4 and proved sufficient in handling the projected traffic demand at acceptable levels of service.) Interchange A could consist of an urban diamond interchange with free-flowing traffic on the Connector Road and all turns managed by traffic signals at the ramp termini. Figure 6-4 shows how Interchange A would integrate into the local land use and roadway network. The actual tie-in location with Carl D. Silver Parkway would have to be coordinated with the Celebrate Virginia development. During design additional configurations could be analyzed and evaluated. It is desirable to maximize the distance between the new I-95 ramps and the ramps for Interchange A.
Connector Road Tie In to Route 3 at Gordon Road The Connector Road will tie into Route 3 at the existing tee-intersection at Gordon Road. As discussed in Section 6.4, a grade separated connection (interchange) will be required to handle the large amount of traffic entering and exiting the Connector Road. Figure 6-6 shows one concept of how an interchange could look at this location. (This configuration was analyzed in Section 6.4 and proved sufficient in handling the projected traffic demand at acceptable levels of service.) The connector road would cross over Route 3 and tie into Gordon Road which currently drops in elevation to meet Route 3. A two-way access road would loop around the existing park and ride lot on the southwest corner of the interchange. The existing Route 3/Gordon Road signal would be removed and replaced with three smaller signals; two two-phase signals on Route 3 and a small four approach signal on the Connector Road. Ramps would provide for most movements allowed at the existing Route 3/Gordon Road intersection. The northbound left turn onto Route 3 would now occur at the Harrison Road Intersection with Route 3. As shown in the drawing, the grade separated concept will require some local road closures (Old Plank Road at Gordon Road) and will result in some redistribution of local traffic. During design additional configurations could be analyzed and evaluated. Compliance with VDOT’s access management guidelines and impacts to street closures will need to be further evaluated during design.
Figure 6-5: Interchange A Concept
I-95 Access Study New Access to I-95 between Route 3 and the Rappahannock River
Page 97
6.2 Compliance with Policies and Engineering Standards With exception to the items identified below, the proposed modifications are designed conceptually to meet or exceed current standards for Federal-aid projects on the Interstate System. The current VDOT Road Design Manual and AASHTO A Policy on Geometric Design of Highways and Streets (Green Book) guidelines served as the design standards for all design criteria. Survey data was not available to assist with the conceptual design of the proposed improvements, so as the project moves forward some refinements in the design may be required. All new lanes and shoulders on the I-95 mainline, C-D roads, and ramps will be full width. All new ramps connecting to the I-95 mainline will have design speeds of 50 mph or higher with vertical and horizontal alignments that meet or exceed the design speed. All ramp terminal spacings exceed AASHTO minimum standards. There are no limitations in providing adequate acceleration and deceleration lanes for the new I-95 ramps and C-D roads merges and diverges with I-95. Both acceleration and deceleration lanes can exceed 1000 feet in length for all ramps. Minimum ramp curve radii and design speeds are shown below for the new I-95 interchange:
• NB to WB off-ramp: 760’ radius = design speed of 50 m.p.h.
I-95 Access Study New Access to I-95 between Route 3 and the Rappahannock River
Page 98
• EB to NB on-ramp: 760’ radius = design speed of 50 m.p.h. • SB to WB off-ramp: 760’ radius = design speed of 50 m.p.h. • EB to SB off-ramp: 1000’ radius = design speed of 50 m.p.h. • All I-95 new interchange ramps have vertical grades less than 4%
The parallel C-D roads have horizontal alignments that exceed 60 m.p.h. design speeds, but do require up and downgrades of up to 6% going to and from the Rappahannock River which do not meet the 60 m.p.h. design speed. However, the braided ramps associated with each C-D road have vertical grades meeting the requirements of 4% or less. The recommendations for the Route 17 interchange will improve the geometry at the interchange by removing two tight loop ramps (the I-95 NB to Route 17 WB/NB off-ramp and the Route 17 WB/NB to I-95 SB on-ramp). The first is replaced with a directional ramp and the second with a left turn to the existing Route 17 EB/SB to I-95 SB on-ramp. However, two tight loop ramps with curve radii of approximately 250’ (~30 m.p.h. design speed) will remain. Both of these ramps (the I-95 SB to Route 17 EB/SB off-ramp and the Route 17 EB/SB to I-95 NB on-ramp) will be on C-D roads that begin or end at these ramps. There are two other ramps that would not meet our targeted standards:
• I-95 SB to Route 17 WB/NB off-ramp which will diverge from the southbound C-D road: 300’ radius = design speed of 30 m.p.h.
• I-95 NB to Route 17 WB/NB off-ramp which will diverge from the northbound C-D road 760’ radius = design speed of 50 m.p.h. The ramp has a short 6% vertical rise to get over Route 17 and a 3% downgrade.
The connector road has a design speed of 60 m.p.h. and all lane widths, shoulder widths, horizontal and vertical curves will meet VDOT and AASHTO standards.
6.3 Build Traffic Volumes for Preferred Alternative This section documents the development of the future year design traffic for the 2035 Build scenario. There was a significant amount of coordination between VDOT, FHWA, and FAMPO in developing forecast volumes for the study area. The FAMPO travel demand model was used to determine the amount of traffic that would use the new I-95 Interchange and new connector road as well as the amount of traffic that would divert from Route 3 and other roads. The resulting forecast volumes are discussed below. Detailed methodology and detailed forecast volume information can be found in the Appendix D – Preferred Alternative (page D-1). For purposes of this study it was assumed that the Connector Road would operate in a free condition (no tolls). This was deemed to be the “worse case” for purposes of designing enough capacity on the connector road, new interchanges, C-D roads and Route 17 interchange improvements. Based on the analysis in this report, the No-Build Condition represents the worst case for Route 3.
6.3.1 Connector Road and New I-95 Interchange Volumes The model was used to determine the amount of diversion to/from each of the main roads or interchanges that would occur to generate the volumes on the new I-95 interchange ramps and new connector road. Traffic is diverted from the Route 3 interchange, some Route 17 ramps, Cowan Boulevard, Fall Hill Avenue, and the US 1/Jackson Gateway Interchanges. Overall there are several major changes in traffic patterns:
I-95 Access Study New Access to I-95 between Route 3 and the Rappahannock River
Page 99
• A significant portion of traffic that uses Route 3 to travel between I-95 and the Gordon Road Area will now use the new connector road.
• A portion of traffic that uses Route 3 to travel between the Central Park/Celebrate Virginia retail areas and the Gordon Road Area will now use the new connector road.
• A portion of the traffic that travels east to I-95 and uses the Route 1 interchange (Exit 126) and then north on I-95 will now travel north on Gordon Road, cross Route 3 and travel on the new connector road to I-95. This reduces traffic on I-95 between Route 1 and Route 3.
• A portion of traffic from north of the study area that previously utilized the Route 17/I-95 Interchange and travelled east to Route 1 and then used either Fall Hill Avenue or Cowan Boulevard to access the Central Park/Celebrate Virginia retail areas will now use I-95 and the new interchange.
• A portion of the traffic from west of the study area that previously travelled east on Route 17 to Route 1 and then used either Fall Hill Avenue or Cowan Boulevard to access the Central Park/Celebrate Virginia retail areas will now get on I-95 and use the new interchange.
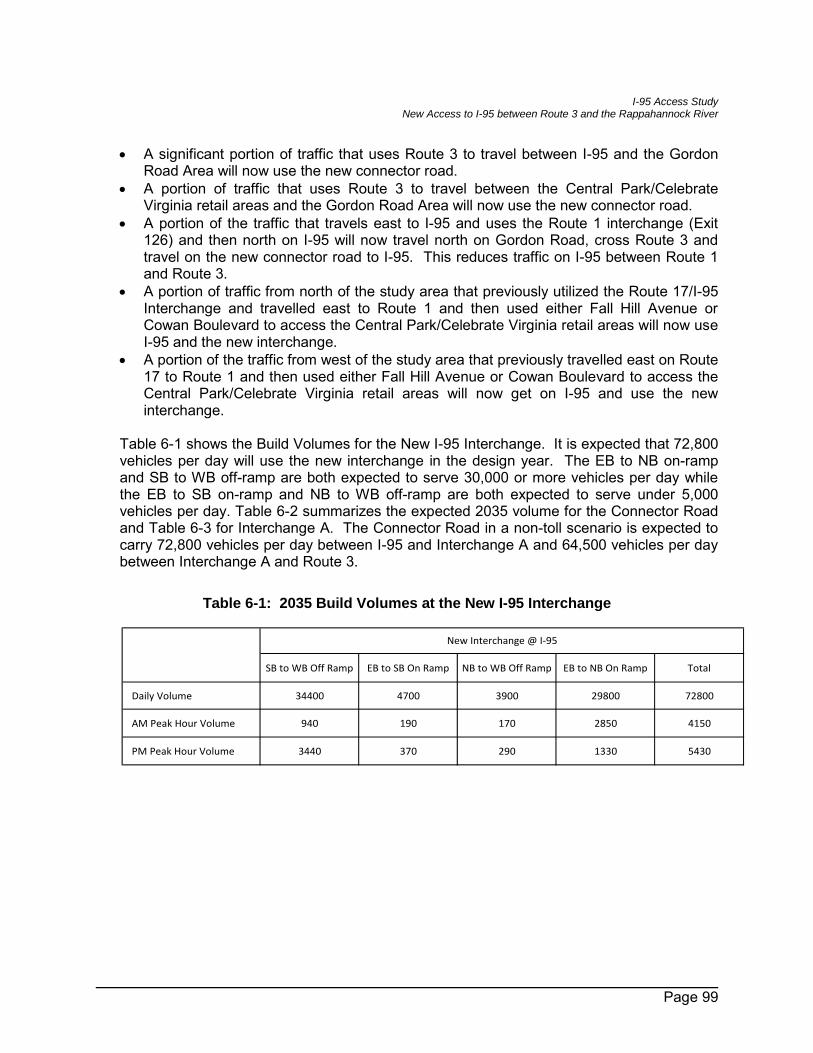
Table 6-1 shows the Build Volumes for the New I-95 Interchange. It is expected that 72,800 vehicles per day will use the new interchange in the design year. The EB to NB on-ramp and SB to WB off-ramp are both expected to serve 30,000 or more vehicles per day while the EB to SB on-ramp and NB to WB off-ramp are both expected to serve under 5,000 vehicles per day. Table 6-2 summarizes the expected 2035 volume for the Connector Road and Table 6-3 for Interchange A. The Connector Road in a non-toll scenario is expected to carry 72,800 vehicles per day between I-95 and Interchange A and 64,500 vehicles per day between Interchange A and Route 3.
Table 6-1: 2035 Build Volumes at the New I-95 Interchange
SB to WB Off Ramp EB to SB On Ramp NB to WB Off Ramp EB to NB On Ramp Total
Daily Volume 34400 4700 3900 29800 72800
AM Peak Hour Volume 940 190 170 2850 4150
PM Peak Hour Volume 3440 370 290 1330 5430
New Interchange @ I-95
I-95 Access Study New Access to I-95 between Route 3 and the Rappahannock River
Page 100
Table 6-2: 2035 Build Volumes on the New Connector Road
Table 6-3: 2035 Build Volumes at Interchange A
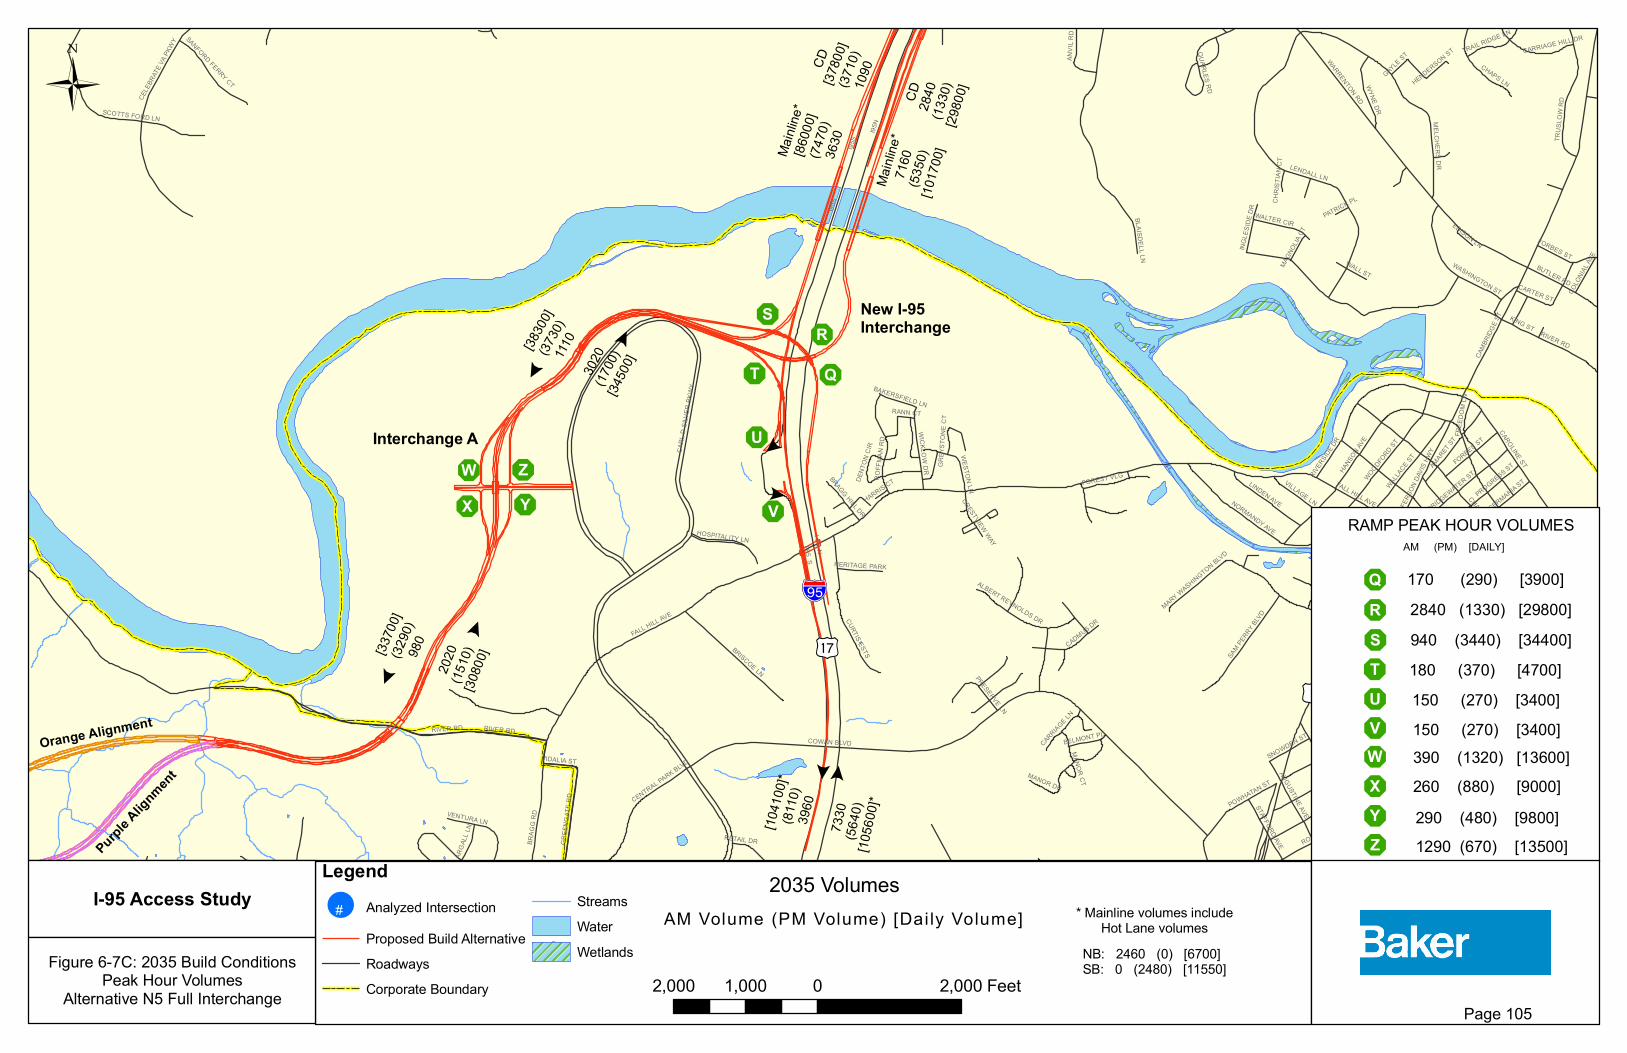
6.3.2 I-95 Mainline and Ramp Traffic Volumes 2035 Build forecast volumes were developed for the I-95 Mainline, including the existing general purpose lanes and the proposed HOT lanes using the methodology discussed in Appendix D – Preferred Alternative (page D-1). HOT lane volumes were not changed from the No-Build forecasts. The HOT lane volumes shown are consistent through the study area between the Route 3 interchange and the Route 17 Interchange. The status of the HOT lanes project is undetermined at this time; however for this study it is assumed access to and from the HOT lanes would occur north of Route 17 or south of Route 3. The resulting I-95 volumes are shown below Table 6-4. As the result of the travel pattern changes discussed in Section 6.3.1, traffic volumes on I-95 are expected to decrease south of Route 3 and increase north of Route 3 when compared to the No-Build Condition. Volumes will decrease on a majority of the Route 3 ramps due to traffic diverting to the new interchange. Some Route 3 ramps providing access east of I-95 will increase slightly from traffic using a less congested I-95 south of Route 3 instead of Route 1. Volumes will increase on some of the Route 17 ramps due to traffic using the interchange ramps instead of passing through the interchange to and from Route 1. Ramp volumes are shown in Figures 6-6B through 6-6D (in Section 6.3.3)
WB Off Ramp WB On Ramp EB Off Ramp EB On Ramp Total
Daily Volume 13600 9000 9800 13500 45900
AM Peak Hour Volume 390 260 290 1290 2230
PM Peak Hour Volume 1320 880 480 670 3350
New Interchange with Connector Road (Interchange A)
Westbound Eastbound Total Westbound Eastbound Total
Daily Volume 38300 34500 72800 33700 30800 64500
AM Peak Hour Volume 1110 3040 4150 980 2020 3000
PM Peak Hour Volume 3730 1700 5430 3290 1510 4800
Connector Road
Between I-95 and Interchange A Between Interchange A and Route 3
I-95 Access Study New Access to I-95 between Route 3 and the Rappahannock River
Page 101
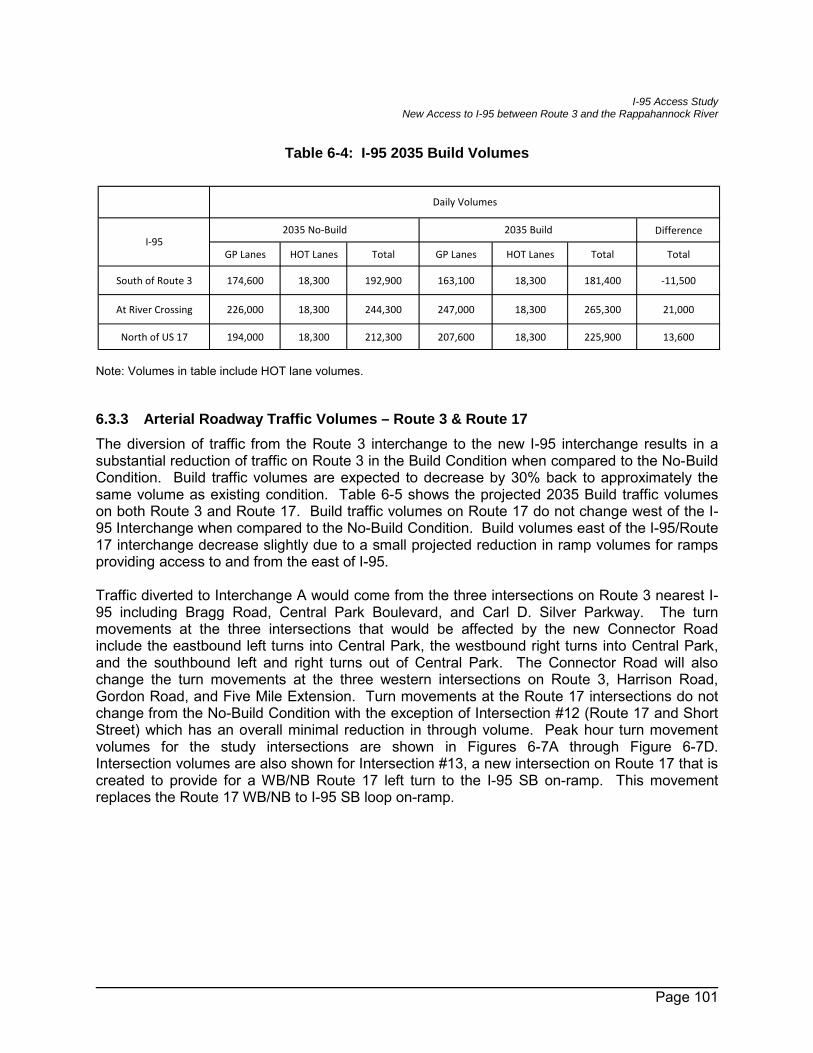
Table 6-4: I-95 2035 Build Volumes
Note: Volumes in table include HOT lane volumes.
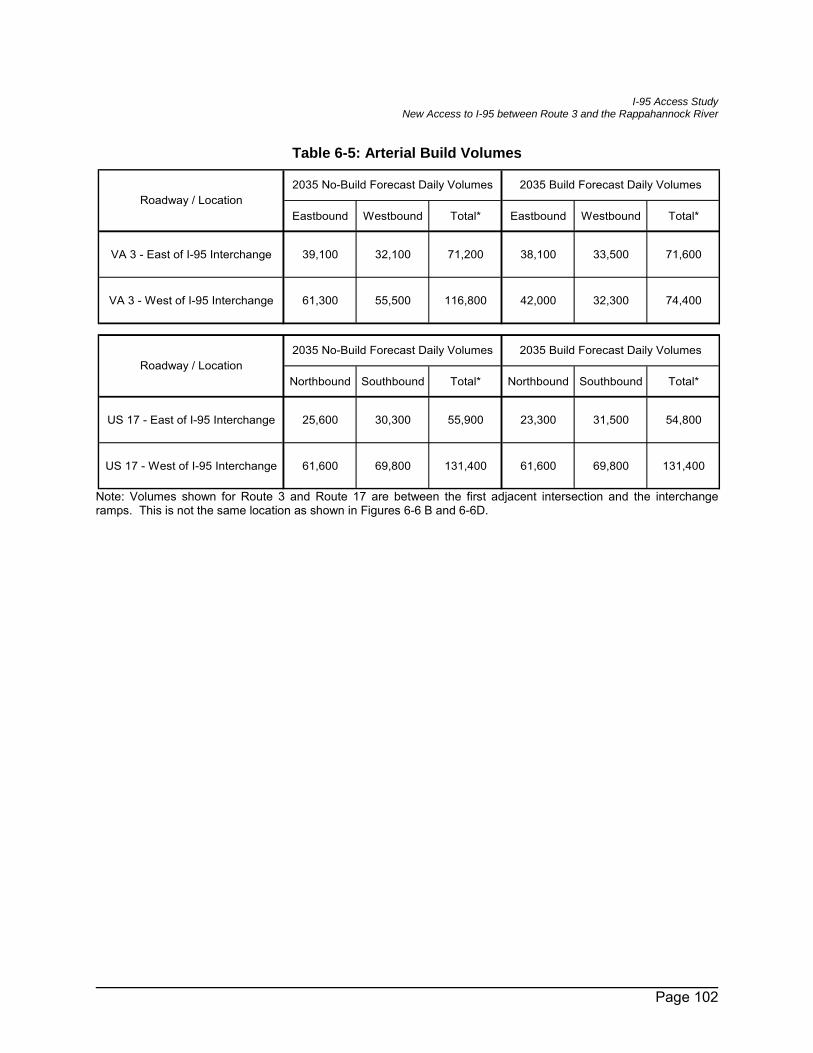
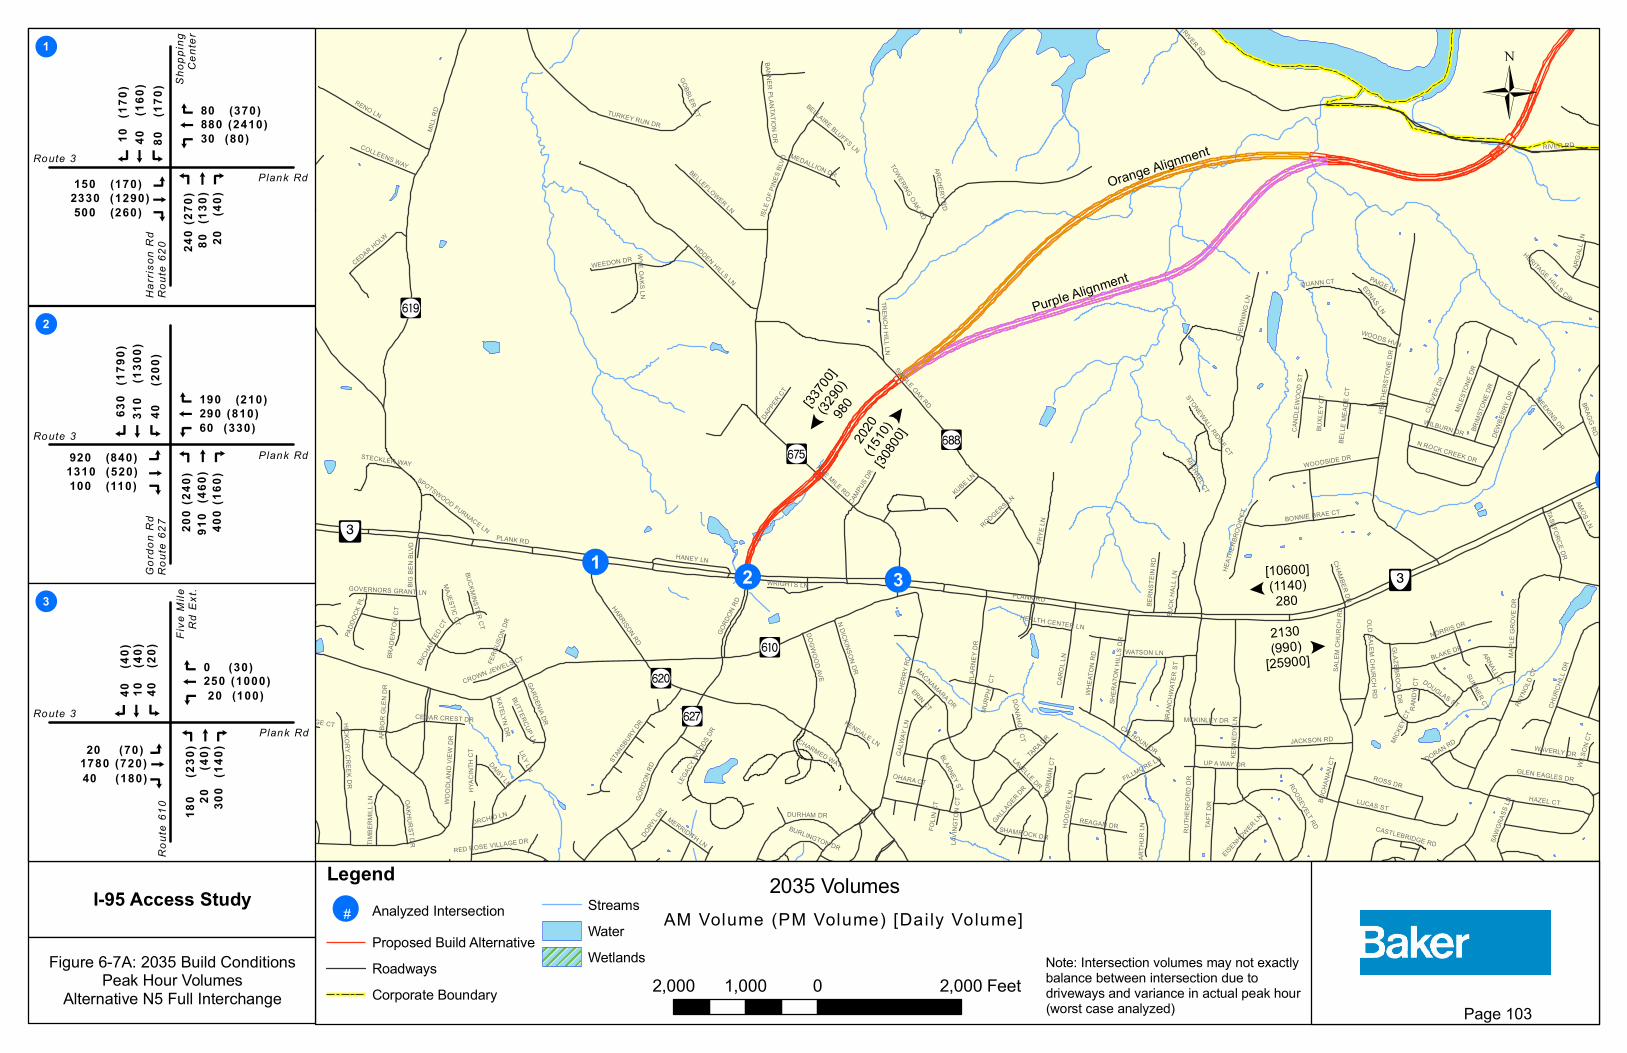
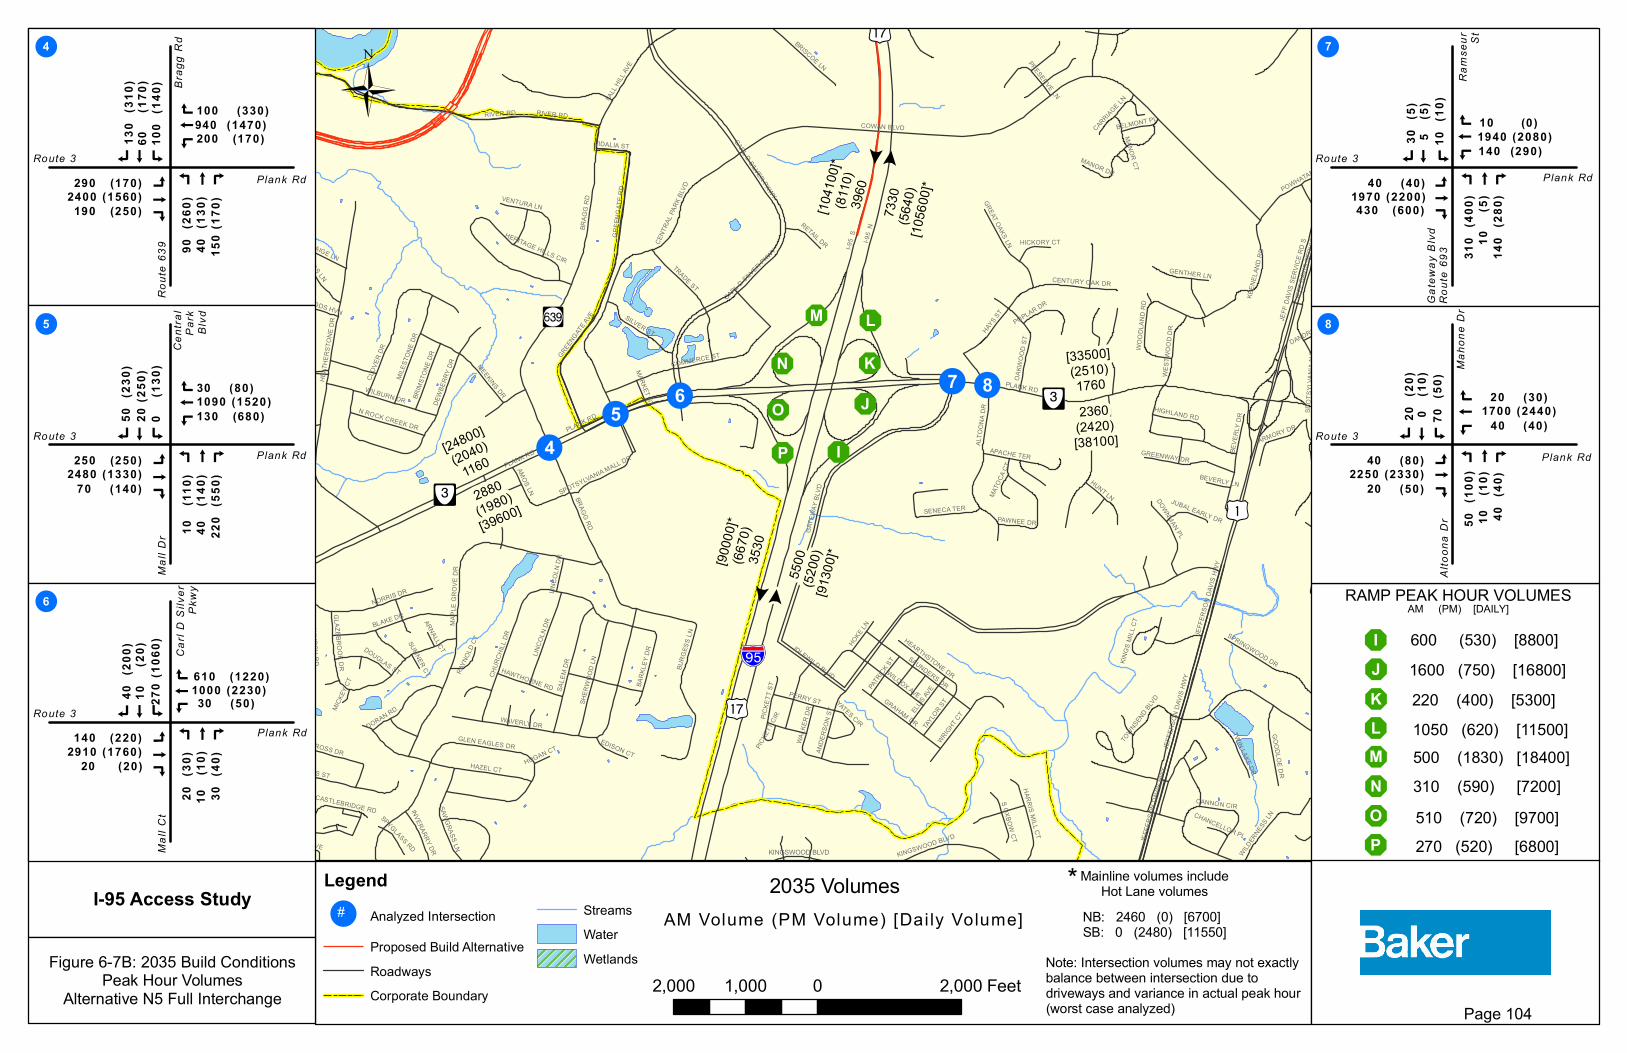
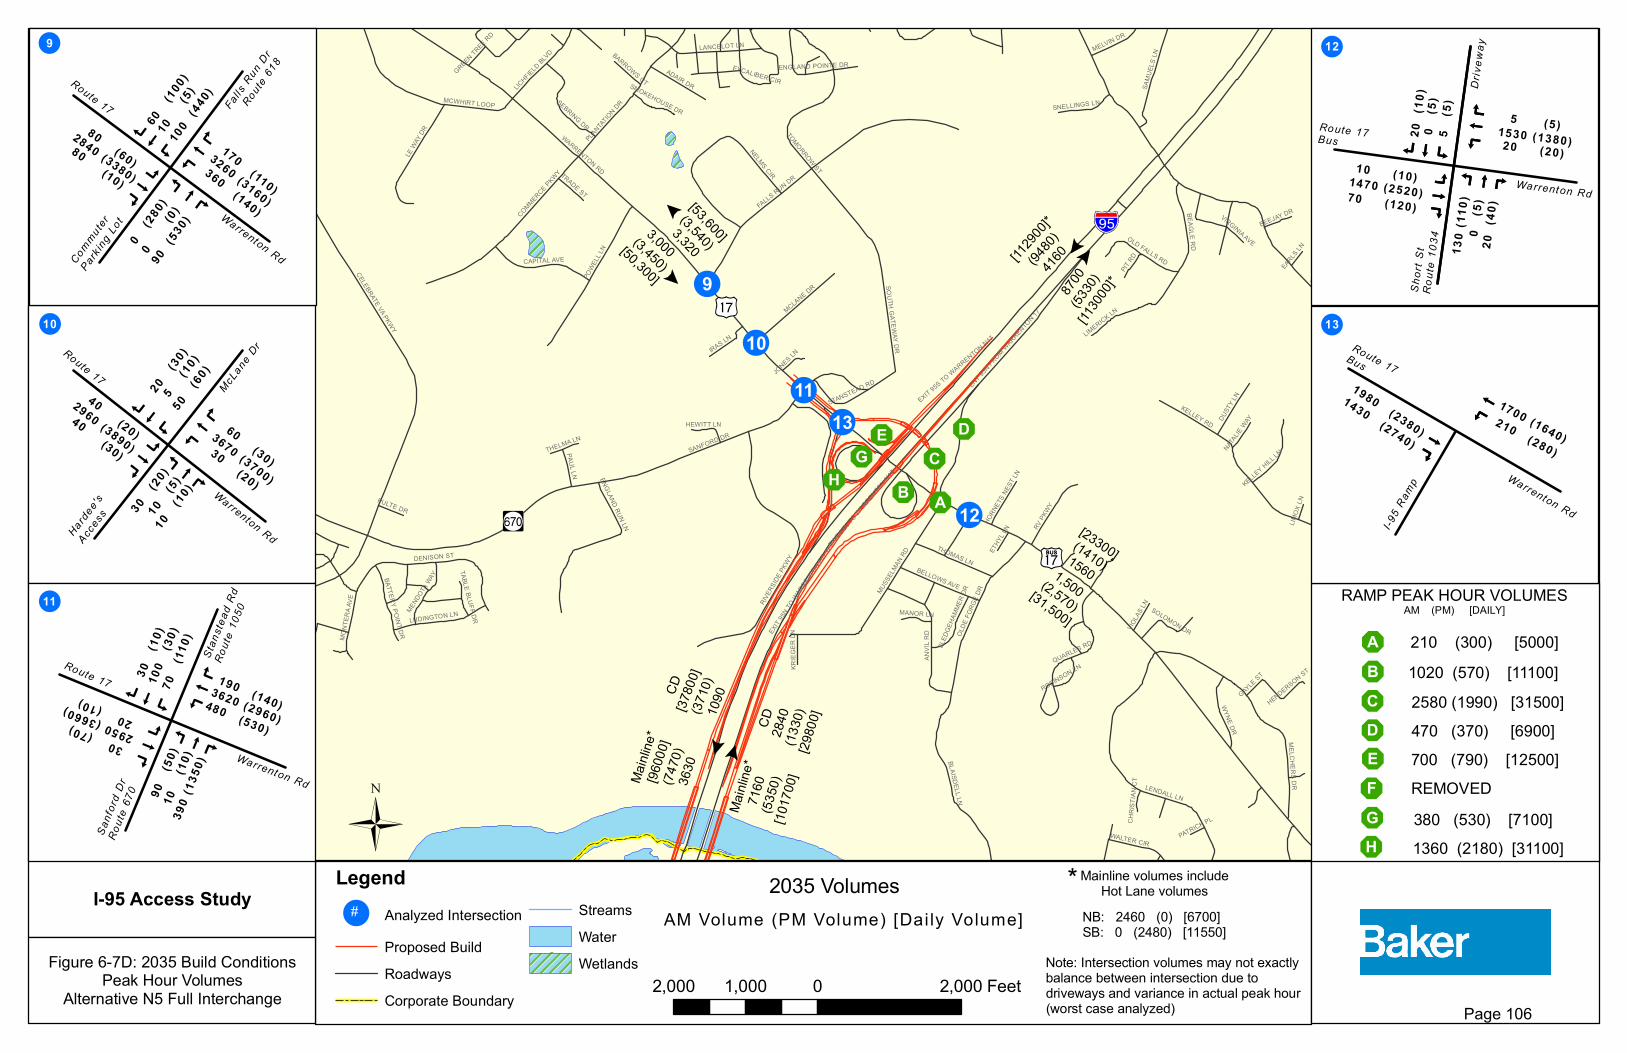
6.3.3 Arterial Roadway Traffic Volumes – Route 3 & Route 17 The diversion of traffic from the Route 3 interchange to the new I-95 interchange results in a substantial reduction of traffic on Route 3 in the Build Condition when compared to the No-Build Condition. Build traffic volumes are expected to decrease by 30% back to approximately the same volume as existing condition. Table 6-5 shows the projected 2035 Build traffic volumes on both Route 3 and Route 17. Build traffic volumes on Route 17 do not change west of the I-95 Interchange when compared to the No-Build Condition. Build volumes east of the I-95/Route 17 interchange decrease slightly due to a small projected reduction in ramp volumes for ramps providing access to and from the east of I-95. Traffic diverted to Interchange A would come from the three intersections on Route 3 nearest I-95 including Bragg Road, Central Park Boulevard, and Carl D. Silver Parkway. The turn movements at the three intersections that would be affected by the new Connector Road include the eastbound left turns into Central Park, the westbound right turns into Central Park, and the southbound left and right turns out of Central Park. The Connector Road will also change the turn movements at the three western intersections on Route 3, Harrison Road, Gordon Road, and Five Mile Extension. Turn movements at the Route 17 intersections do not change from the No-Build Condition with the exception of Intersection #12 (Route 17 and Short Street) which has an overall minimal reduction in through volume. Peak hour turn movement volumes for the study intersections are shown in Figures 6-7A through Figure 6-7D. Intersection volumes are also shown for Intersection #13, a new intersection on Route 17 that is created to provide for a WB/NB Route 17 left turn to the I-95 SB on-ramp. This movement replaces the Route 17 WB/NB to I-95 SB loop on-ramp.
Difference
GP Lanes HOT Lanes Total GP Lanes HOT Lanes Total Total
South of Route 3 174,600 18,300 192,900 163,100 18,300 181,400 -11,500
At River Crossing 226,000 18,300 244,300 247,000 18,300 265,300 21,000
North of US 17 194,000 18,300 212,300 207,600 18,300 225,900 13,600
Daily Volumes
I-952035 No-Build 2035 Build
I-95 Access Study New Access to I-95 between Route 3 and the Rappahannock River
Page 102
Table 6-5: Arterial Build Volumes
Note: Volumes shown for Route 3 and Route 17 are between the first adjacent intersection and the interchange ramps. This is not the same location as shown in Figures 6-6 B and 6-6D.
Note: Intersection volumes may not exactlybalance between intersection due todriveways and variance in actual peak hour(worst case analyzed)
*
Page 106
I-95 Access Study New Access to I-95 between Route 3 and the Rappahannock River
Page 107
6.4 Preferred Alternative Traffic Operations This section presents the traffic operations for the Preferred Alternative, N5 with a Full Interchange. The 2035 Build conditions were completed for the key intersections, I-95 Mainline, and I-95 Ramp Junctions that were analyzed for the 2008 Existing Conditions (See Chapter 2) and 2035 No-Build Conditions (See Chapter 3), as well as the new interchange and connector road. Detailed HCS output files are contained in Appendix D – Preferred Alternative (starting on Page D-32). I-95 Mainline, CD Road and Ramp Operations 2035 Build level of service analyses were also performed for the Weekday AM / PM peak hours for northbound and southbound I-95 Mainline segments and at ramp junctions (merge, diverge, and weave) in the study area using HCS+ Ramp Junction software, HCS+ Weaving Analysis software, CORSIM micro-simulation software. The 2035 Build traffic forecasts developed in Section 6.3 were used in the analyses. Findings for the mainline and ramp analyses are discussed below and shown in Figure 6-8. Detailed HCS+ mainline and ramp junction analysis reports are presented in the Appendix D – Preferred Alternative (starting on Page D-33). Northbound I-95 There is significant improvement in level of service for northbound I-95 mainline segments and ramp junctions when compared to the No-Build Conditions. Most of the segments were operating at LOS F in the AM and PM peak hours under 2035 No-Build conditions and these segments have improved to LOS C and D in the AM peak and LOS D in the PM peak. However, north of Route 17 the LOS drops from LOS E to LOS F due to the projected higher traffic volumes during the AM peak hour when compared to the No-Build condition. (Although the travel demand model shows a significant shift in traffic from Route 1 to I-95 due to the preferred alternative, it is unlikely that a significant shift would occur. Expected congestion north of Route 17 as shown in the No-Build Condition would discourage this shift until capacity improvements are made north of the interchange.) During the PM peak hour, I-95 is still expected to operate at LOS E between the new interchange and Route 3 during the PM peak hour. The new C-D road across the Rappahannock River is expected to operate at LOS D and B for the AM and PM peak hours respectively. Southbound I-95 In the southbound direction, similar improvements in LOS are expected. During the AM peak hour, movements that are predominately LOS D in the No-Build Condition become LOS A, B, or C for mainline segments and ramp junctions in the Build Condition. During the PM peak hour, movements that are predominately LOS F in the No-Build Condition become LOS D for mainline segments and ramp junctions in the Build Condition. North of Route 17, the LOS remains LOS F due to the projected higher traffic volumes during the PM peak hour when compared to the No-Build condition. (Although the travel demand model shows a significant shift in traffic from Route 1 to I-95 due to the preferred alternative, it is unlikely that a significant shift would occur. Expected congestion north of Route 17 as shown in the No-Build Condition would discourage this shift until capacity improvements are made north of the interchange.) The new C-D road across the Rappahannock River is expected to operate at LOS B and E for the AM and PM peak hours respectively. The SB to WB off-ramp at Route 3 is expected to remain at LOS F during the PM peak hour, however, the density is expected to decrease to about half that expected for the No-Build Condition.
Roadway Location Analysis TypeVehicle Density
(pc/mi/ln)
Vehicle Speed(mph)
Level of Service(LOS)
Vehicle Density
(pc/mi/ln)
Vehicle Speed(mph)
Level of Service(LOS)
I-95 NBMainline South of Route 3 Interchange
Mainline Segment 1 19.2 67.0 C 34.2 61.1 D
I-95 NB Diverge to Route 3 EB D-1 20.8 61.3 C 30.5 61.9 DRoute 3 EB Merge to I-95 NB - Weave
I-95 NB diverge to Route 3 W B - WeaveRoute 3 W B Merge to I-95 NB M-1 26.3 59.5 C 28.4 58.0 D
I-95 NBMainline
Route 3 to New Interchange(South of Rappahannock River)
Mainline Segment 2 32.5 63.5 D 39.8 57.4 E
I-95 NB Diverge to Connector Road WB D-7 27.0 62.9 C 31.0 62.6 DC/D Road across River CD-1 27.0 64.7 D 12.4 65.5 B
CD Road split to I-95 and Route 17 D-8 25.3 54.0 C 9.2 54.9 AConnector Road EB Merge to I-95 NB M-7 30.7 54.5 D 33.1 50.9 D
I-95 NBMainline
New Interchange to Route 17(North of Rappahannock River)
Mainline Segment 3 29.2 66.1 D 34.9 61.6 D
I-95 NB diverge to I-95 C/D Roadway D-2 21.8 56.5 C 22.2 57.7 CNew Ramp merge with Route 17 Ramp M-8 26.2 50.2 C 17.8 51.9 B
I-95 C/D Roadway diverge to Route 17 Bus SB D-3 29.0 55.4 D 19.8 55.2 BRoute 17 Bus NB merge to I-95 C/D Roadway M-2 16.3 47.8 B 9.9 47.9 A
I-95 C/D Roadway merge to I-95 NB M-3 40.2 29.9 F 31.5 54.3 DI-95 NBMainline North of Route 17 Interchange
I-95 Access Study New Access to I-95 between Route 3 and the Rappahannock River
Page 109
Although all the expected operational problems are not solved on I-95, significant improvements in operating conditions are expected with the construction of the Preferred Alternative. Additional mainline lanes on I-95 beyond those proposed for the C-D Roads will be required to bring deficient segments up to an acceptable LOS. Any additional lanes will need to be continuous and extend many miles north of the existing project area. The proposed preferred alternative will not prevent these further improvements from being implemented in the future.
Route 3 and Route 17 Intersection Operations The AM and PM peak hours at each of the study intersections along Route 3 and Route 17 were analyzed to identify expected deficiencies under the Build Conditions. It is assumed that the traffic signal timings and phases would be optimized in the future to best accommodate the expected 2035 Build Traffic volumes (discussed in Section 6.3). Similar to the existing conditions chapter, a brief discussion of each intersection is provided to identify the main causes of any deficiency. A summary of the 2035 Build level of service (LOS), compared to 2035 No-Build Conditions, is shown below in 6-6. Individual movements operating at LOS E or F are identified in Table 6-6 and considered operating at a “poor” level of service. HCS output files are provided in Appendix D – 2035 Build Conditions (starting on page D-99). Intersection #1 (Route 3 & Harrison Rd / Shopping Center): Delay is expected to increase slightly when compared to the No-Build Condition due to increased traffic volumes associated with traffic diverting from River Road to use the new Connector Road. Most approaches and movements during the AM peak hour are expected to operate at LOS D or better. The minor approach left turns are expected to operate at a LOS E or F. During the PM peak hour, the eastbound and westbound left turns are expected to operate at LOS E or F as well as the minor approaches. Intersection #2 (Route 3 & Gordon Rd): Due to the proposed connector road a fourth leg is added to this intersection. Overall the intersection (as an at-grade intersection) is expected to operate at LOS E and LOS F during the AM and PM peak hours respectively. It is recommended that to improve traffic operations the preferred alternative include an interchange between Route 3 and the Connector Road/Gordon Road. The traffic operations associated with the proposed interchange are discussed later in this section. Intersection #3 (Route 3 & Five Mile Rd Ext.): Overall the intersection is expected to operate significantly better when compared to the No-Build Condition. LOS F’s (in No-Build Condition) are expected to be improved to LOS C and LOS D for the AM and PM peak hours respectively. The expected reduction in volumes through the intersection is expected to reduce the delay by 77% and 55% for the AM and PM peak hours respectively. Only some minor movements are expected to operate at LOS E or F. Intersection #4 (Route 3 & Bragg Rd): Overall the intersection is expected to operate significantly better when compared to the No-Build Condition. LOS F’s (in No-Build Condition) are expected to be improved to LOS D for the AM and PM peak hours. The expected reduction in volumes through the intersection is expected to reduce the delay by 68% and 75% for the AM and PM peak hours respectively. Minor approach movements are expected to operate at LOS E or F.
I-95 Access Study New Access to I-95 between Route 3 and the Rappahannock River
Page 110
Intersection #5 (Route 3 & Mall Dr / Central Park Blvd): Overall the intersection is expected to operate significantly better when compared to the No-Build Condition. LOS Fs (in No-Build Condition) are expected to be improved to LOS D and LOS E for the AM and PM peak hours respectively. The expected reduction in volumes through the intersection is expected to reduce the delay by 73% and 55% for the AM and PM peak hours respectively. Intersection #6 (Route 3 & Mall Ct / Carl D Silver Pkwy): Overall the intersection is expected to operate significantly better when compared to the No-Build Condition. LOS F (in No-Build Condition) is expected to be improved to LOS E for the PM peak hour. The expected reduction in volumes through the intersection is expected to reduce the delay by 61% and 46% for the AM and PM peak hours respectively. Only some minor movements are expected to still operate at LOS E or F. Intersection #7 (Route 3 & Gateway Blvd / Ramseur St): Delay is expected to increase slightly when compared to the No-Build Condition due to increased traffic volumes associated with traffic diverting from Route 1 to use Route 3. Most approaches and movements during the AM peak hour are expected to operate at LOS D or better except for the left turn movements which are expected to operate at LOS E or F. Intersection #8 (Route 3 & Altoona Dr / Mahone Dr): Delay is expected to not change significantly between the Build and No-Build conditions. The AM peak hour is expected to be free from any major deficiencies at this intersection. The eastbound left, westbound thru, northbound and southbound approaches are expected to experience operational problems in the PM peak hour with the overall intersection operating at LOS E. Intersection #9 (Route 17 & Commuter Parking Lot / Falls Run Dr): Traffic volumes and operations do not change been the Build and No-Build Conditions. Overall the intersection is expected to operate at LOS E and LOS F during the AM and PM peak hours respectively. The EB and WB minor approaches are expected to remain at LOS E or F in the AM and PM peak hour. The Route 17 WB/NB and EB/SB left turns and thru movements from Route 17 are also operating at a LOS E or F. Intersection #10 (Route 17 & Hardee's Access / McLane Dr): Traffic volumes and operations do not change been the Build and No-Build Conditions. Overall the intersection is expected to operate at LOS B and LOS F during the AM and PM peak hours respectively. The Route 17 WB/NB left and Route 17 EB/SB left and minor approaches are expected to operate at LOS E or F in the AM and PM peak hours. The Route 17 EB/SB thru movement is also expected to operate at F in the PM peak hour. Intersection #11 (Route 17 & Sanford Dr): Traffic volumes and operations do not change been the Build and No-Build Conditions. Overall the intersection is expected to operate at LOS F during the AM and PM peak hours. All of the minor approach movements (NB and SB) are expected to operate at LOS E or F in the AM peak hour. The Route 17 EB/SB left and thru and WB/NB left turn movements are expected operate at LOS E or F in the AM peak hour. The route 17 EB/SB and WB/NB left turns and thru movements, along with the northbound minor right and entire southbound minor approach movements are expected to operate at LOS E or F in the PM peak hour.
I-95 Access Study New Access to I-95 between Route 3 and the Rappahannock River
Page 111
Intersection #12 (Route 17 & Short St / Driveway): Delay is expected to decrease slightly when compared to the No-Build Condition due to decreased traffic volumes associated with traffic diverting from Route 1 to I-95. Overall the intersection is expected to operate at LOS C and LOS F during AM and PM peak hours respectively. Most movements at this intersection are currently operating at LOS D or better in the AM peak hour. The northbound minor left/thru shared lane is expected to operate at LOS E in the AM peak hour. During the PM peak hour, the Route 17 EB/SB left-thru shared lane and all movements in the northbound minor approach are expected to operate at a poor LOS. Proposed Intersection #13 (Route 17 & EB to SB I-95 On-Ramp): This proposed intersection is a split intersection that should be controlled by a single controller. WB/NB Route 17 movement is uninterrupted. This intersection replaces the Route 17 WB/NB to I-95 SB on-loop ramp. The intersection is expected to operate at LOS B and LOS C during the AM and PM peak hours respectively. Generally, the intersection level of service under the Build Condition is expected to significantly improve along Route 3 because traffic volumes on Route 3 are expected to drop by approximately 30 percent when compared to the No-Build Condition. However, there are still expected to be some traffic operational problems at the intersections. Traffic operations at the Route 17 intersections are not expected to change much at all between the Build and No-Build Conditions.
Connector Road Operations
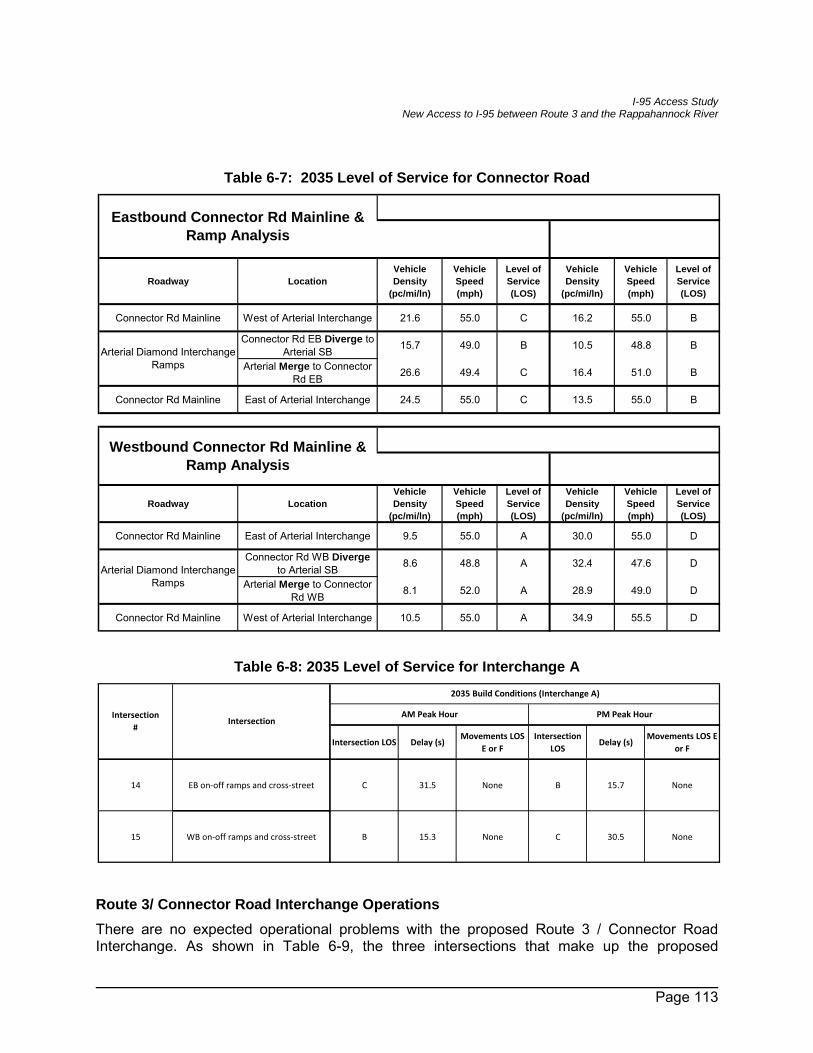
There are no significant operational problems expected with the proposed Connector Road or its interchange (Interchange A) providing access to the commercial areas near I-95. As shown in Table 6-7, the proposed Connector Road is expected to operate at LOS C or better eastbound and LOS D or better westbound with speeds of 55 mph being maintained except at Interchange A where they drop to 48 mph. The signalized intersections that will be created with a diamond interchange for Interchange A are expected to operate at LOS C or better during both peak periods (see Table 6-8). HCS output files are shown in Appendix D – Preferred Alternative (page D-126).
I-95 Access Study New Access to I-95 between Route 3 and the Rappahannock River
Page 112
Table 6-6: 2035 Build Level of Service for Study Intersections (All results are from HCS)
Intersection LOS Delay (s)Intersection
LOSDelay (s) Intersection LOS Delay (s)
Movements withLOS E or F
Intersection LOS Delay (s)Movements with
LOS E or F
1 VA 3 & Harrison Rd (Route 620) / Shopping Center C 32.7 C 34.0 D 36.0- NB Left- SB Left
C 34.5
- EB Left- WB Left
- NB Left, Thru, Right- SB Left, Right
10.1% 1.5%
2 VA 3 & Gordon Rd (Route 627) E 79.9 F 100.5 E 74.3- WB Right
- NB Left, Thru, Right - SB Right
F 244.5
- EB Left, Thru, Right- WB Left, Thru, Right
- NB Left- SB Left, Right
-7.0% 143.3%
3 VA 3 & Five Mile Rd Ext. (Route 610) F 112.2 F 99.1 C 26.0 -NB Right D 44.5- SB Left/Thru, Right
-76.8% -55.1%
4 VA 3 & Bragg Rd (Route 639) F 115.7 F 146.4 D 37.0 - NB Left, Thru, Right- SB Left, Thru, Right
D 36.5
- EB Left- WB Left
- NB Left, Thru, Right- SB Thru
-68.0% -75.1%
5 VA 3 & Mall Dr / Central Park Blvd F 117.3 F 175.9 D 31.6- EB Thru
- NB Thru/Left, RightE 79.8
- EB Thru- WB Left
- NB Left, Thru, Right-73.1% -54.6%
6 VA 3 & Mall Ct / Carl D Silver Pkwy D 41.7 F 116.8 B 16.2 - NB Right E 62.6
- EB Left- WB Left- NB Right
- SB Left, Thru, Right
-61.2% -46.4%
7 VA 3 & Gateway Blvd (Route 693) / Ramseur St C 24.4 D 44.4 C 27.9- EB Left- WB Left- NB Left,
D 48.9- EB Left- WB Left
- NB Left, Thru, Right14.3% 10.1%
8 VA 3 & Altoona Dr / Mahone Dr C 28.5 E 61.8 C 27.1 None E 64.3
- EB Left- WB Thru
- NB Left, Thru, Right- SB Left/Thru/Right
-4.9% 4.0%
9US 17 & Commuter Parking Lot / Falls Run Dr
(Route 618)E 72.5 F 152.2 E 72.5
- EB Left/Thru, Right- WB Left, Thru, Right
- WB/NB Left, Thru- EB/SB Left
F 152.2
- EB Left/Thru, Right- WB Left, Thru, Right
- WB/NB Left, Thru- EB/SB Left, Thru
0.0% 0.0%
10 US 17 & Hardee's Access / McLane Dr B 11.7 F 81.9 B 11.7
- EB Left/Thru, Right- WB Left, Thru, Right-
WB/NB Left, Thru- EB/SB Left
F 81.9
- EB Left/Thru, Right- WB Left, Thru, Right'- '-
WB/NB Left- EB/SB Left, Thru
0.0% 0.0%
11 US 17 & Sanford Dr (Route 670) F 194.9 F 488.0 F 194.9
- EB/SB Left, Thru- WB/NB Left
- NB Left, Thru, Right- SB Left, Thru, Right
F 488.0
- EB/SB Left, Thru- WB/NB Left, Thru
- NB Right- SB Left, Thru, Right
0.0% 0.0%
12 US 17 & Short St (Route 1034)/ Driveway C 21.8 F 100.1 C 20.5 - NB Left/Thru F 81.0- EB Left/Thru
- NB Left/Thru, Right-6.0% -19.1%
13 US 17 & I-95 SB on-ramp N/A N/A N/A N/A B 10.3 None C 26.2 WB/NB Left N/A N/A
Note: Intersections 1-8 major movement is EB-WB; Intersections 9-12, major movement is WB/NB-EB/SB due to the diagonal alignment of Route 17. Minor approaches at Intersections 1-8, 11-12 is NB-SB. Minor approaches at intersections 9-10 is EB-WB.
Level of service is from HCS software.
Intersection#
Intersection
2035 No-Build Conditions % Difference from No-Build
AM Peak Hour PM Peak Hour
AM Peak Hour PM Peak Hour
2035 Build Conditions - Alternative N5 with Full New Interchange
PM Peak HourAM Peak Hour
I-95 Access Study New Access to I-95 between Route 3 and the Rappahannock River
Page 113
Table 6-7: 2035 Level of Service for Connector Road
Table 6-8: 2035 Level of Service for Interchange A
Route 3/ Connector Road Interchange Operations There are no expected operational problems with the proposed Route 3 / Connector Road Interchange. As shown in Table 6-9, the three intersections that make up the proposed
Roadway LocationVehicle Density
(pc/mi/ln)
Vehicle Speed(mph)
Level of Service(LOS)
Vehicle Density
(pc/mi/ln)
Vehicle Speed(mph)
Level of Service(LOS)
Connector Rd Mainline West of Arterial Interchange 21.6 55.0 C 16.2 55.0 B
Connector Rd EB Diverge to Arterial SB 15.7 49.0 B 10.5 48.8 B
Arterial Merge to Connector Rd EB 26.6 49.4 C 16.4 51.0 B
Connector Rd Mainline East of Arterial Interchange 24.5 55.0 C 13.5 55.0 B
Roadway LocationVehicle Density
(pc/mi/ln)
Vehicle Speed(mph)
Level of Service(LOS)
Vehicle Density
(pc/mi/ln)
Vehicle Speed(mph)
Level of Service(LOS)
Connector Rd Mainline East of Arterial Interchange 9.5 55.0 A 30.0 55.0 D
Connector Rd WB Diverge to Arterial SB 8.6 48.8 A 32.4 47.6 D
Arterial Merge to Connector Rd WB 8.1 52.0 A 28.9 49.0 D
Connector Rd Mainline West of Arterial Interchange 10.5 55.0 A 34.9 55.5 D
Arterial Diamond Interchange Ramps
Eastbound Connector Rd Mainline & Ramp Analysis
Arterial Diamond Interchange Ramps
Westbound Connector Rd Mainline & Ramp Analysis
Intersection LOS Delay (s)Movements LOS
E or FIntersection
LOSDelay (s)
Movements LOS E or F
14 EB on-off ramps and cross-street C 31.5 None B 15.7 None
15 WB on-off ramps and cross-street B 15.3 None C 30.5 None
Intersection#
Intersection
2035 Build Conditions (Interchange A)
AM Peak Hour PM Peak Hour
I-95 Access Study New Access to I-95 between Route 3 and the Rappahannock River
Page 114
interchange are expected to operate at LOS D or better during both peak periods. Together the three intersections have significantly less delay and better LOS than the Gordon Road/Route 3 intersection as an at-grade intersection (see Table 6-6). Figure 6-9 shows the traffic volumes for the proposed interchange. HCS output files are shown in Appendix D – Preferred Alternative (page D-147).
Table 6-9: 2035 Level of Service for Route 3/ Connector Road Interchange
2035 Build Conditions – CORSIM Analysis CORSIM micro-simulation analysis was performed on the I-95 Mainline and on the Route 3 and Route 17 interchanges as well as the new I-95 interchange, C-D Roads and braided ramps. The base networks used for the 2035 No-Build analysis were modified to include the new build alternative improvements. Volumes were updated to reflect the build volumes discussed in Section 6.3. No global parameters or additional default values were changed from those changed during the calibration of the base year model. The CORSIM software provides a visual and analytical representation of traffic operations. CORSIM analysis results for I-95 Mainline and Ramp Junctions were generated for the same locations as those completed with HCS and shown in Figure 6-8. Note that the discrepancies in the densities and speeds are a result of the differences of the functionality of the software. The results of the CORSIM network are shown in Table 6-10. The CORSIM analysis generally confirms the results from the HCS analysis. There are significant improvements to the operations at Route 3, Route 17, and I-95 when compared to the No-Build Condition. During the PM peak hour, there are still two bottlenecks entering our study area: 1) southbound I-95 (north of Route 17) and 2) EB/SB Route 17 (west of the I-95 interchange). These bottlenecks restrict the amount of traffic that is able to enter the network and thus lower volumes than the design volumes are processed through the CORSIM model resulting in lower densities than those calculated using the HCS software.
Intersection LOS
Delay(sec/veh)
Intersection LOS
Delay(sec/veh)
A Route 3 & Access to Gordon Road (West of Interchange) A 3.8 A 7.7 None None
B Route 3 & Access to Connector Road (East of Interchange) A 9.0 B 17.5 None None
C Gordon Road & Route 3 Access / Driveway C 29.1 D 51.7 NoneEB RightWB RightNB Left
IntersectionIntersection
#
Problem Movements (LOS E or F)
PM Peak HourAM Peak Hour
AM Peak Hour
2035 Build Conditions
PM Peak Hour
?Ô
?t
?j
?{
!A
!B
!C
?ê
?ê
2
2
1
11
1 11111
11
1111
1
PLANK RD
OLD PLANK RD
HARRISON RD
HANEY LN
FIVE
MILE
RD
GO
RD
ON
RD
N D
ICK
INS
ON
DR
FIV
E M
ILE
RO
AD
EXT
D
DO
GW
OO
D AVE
WRIGHTS LN
CAM
PUS
DR
AUTU
MN
LEAF
DR
AUTU
MN
LEAF
CIR
GO
RD
ON
RD
PLANK RD
GO
RD
ON
RD
I-95 Access Study
Figure 6-9: 2035 Build ConditionsPeak Hour Volumes / Level of Service
Plank Rd
To /
Fro
mG
ord
on
Rd
!A
Route 3
31
3/1
40
(200
)100 (110)2180 (1310)
Plank Rd
!B
Route 3
Driveway
!C
Route 3Access
Go
rdo
n R
d
60 (330)920 (2600) Ü
500 0 500250 Feet
LegendRoute 3 Interchange Alternative
Roadways
Corporate Boundary
Streams
Water
Wetlands
Intersection Turn Movement Volume
/ 31
/3
1
20
(
20)
1280
(5
90)
/3
1
/3 1
20
(2
0)
40
(20
0)29
0 (1
300)
140 (420)
50 (50)20 (20)
50
(
50)
/1
31
870 (790)1350 (720)
190 (210)350 (1140)
Route 3 / Gordon Rd Interchange Option
30 (30)10 (10)10 (10)
To N
ewC
onne
ctor
Roa
dway
Go
rdo
n R
d
LeftAM Volume (PM Volume)
/13Right
Thru
!A
/11
11
Plank Rd
Plank Rd
To/From
Gordon R
d
11
1
!B
/11
/
11
1
1
Plank Rd
To N
ew
Con
nect
orR
oadw
ay
!C
/31
/31
/311
/3111
Route 3Access
Driveway
Gor
don
Rd
/
Page 115
I-95 Access Study New Access to I-95 between Route 3 and the Rappahannock River
Page 116
Table 6-10: CORSIM Analysis for N5 Alternative with Full Interchange
6.5 Preferred Alternative Safety Evaluation This section documents the anticipated safety impacts of the preferred alternative to the study area roadway network. The Preferred Alternative, as discussed in this chapter, includes the addition of the new connector roadway interchange, major modifications to the existing Route 17 Interchange, as well as adding additional C-D roads and braided ramps to connect the proposed new I-95 Interchange with the existing roadway facilities. The new connector road is expected to divert
Roadway Location Analysis Type Vehicle Density(pc/mi/ln)
Vehicle Speed(mph)
Vehicle Density
(pc/mi/ln)
Vehicle Speed(mph)
I-95 NBMainline South of Route 3 Interchange Mainline Segment 1 15.8 67.0 27.4 66.4
I-95 NB Diverge to Route 3 EB D-1 14.5 67.3 25.8 64.6Route 3 EB Merge to I-95 NB - Weave
I-95 NB diverge to Route 3 WB - WeaveRoute 3 WB Merge to I-95 NB M-1 22.2 58.1 26.8 57.4
I-95 NBMainline Route 3 to New Interchange Mainline Segment 2 24.0 64.6 30.6 60.3
I-95 NB Diverge to Connector Road WB D-7 17.9 64.8 22.2 62.5C/D Road across River CD-1 30.2 47.2 13.7 48.6
CD Road split to I-95 and Route 17 D-8 27.1 47.0 12.3 48.3Connector Road EB Merge to I-95 NB M-7 16.9 60.0 15.0 64.0
I-95 NBMainline New Interchange to Route 17 Mainline Segment 3 23.7 62.4 29.8 58.6
I-95 NB diverge to I-95 C/D Roadway D-2 27.6 40.7 24.8 53.1New Ramp merge with Route 17 Ramp M-8 19.7 45.8 16.1 47.1
I-95 C/D Roadway diverge to Route 17 Bus EB/SB D-3 23.5 47.3 19.9 47.3Route 17 Bus WB/NB merge to I-95 C/D Roadway M-2 25.4 39.6 13.2 45.1
I-95 C/D Roadway merge to I-95 NB M-3 44.9 37.9 23.6 60.4I-95 NBMainline North of Route 17 Interchange Mainline Segment 4 35.8 54.9 27.2 63.0
Roadway Location Analysis Type Vehicle Density(pc/mi/ln)
Vehicle Speed(mph)
Vehicle Density
(pc/mi/ln)
Vehicle Speed(mph)
I-95 SBMainline
North of Route 17 Interchange Mainline Segment 4 21.0 67.4 77.3 24.8
I-95 Access Study New Access to I-95 between Route 3 and the Rappahannock River
Page 117
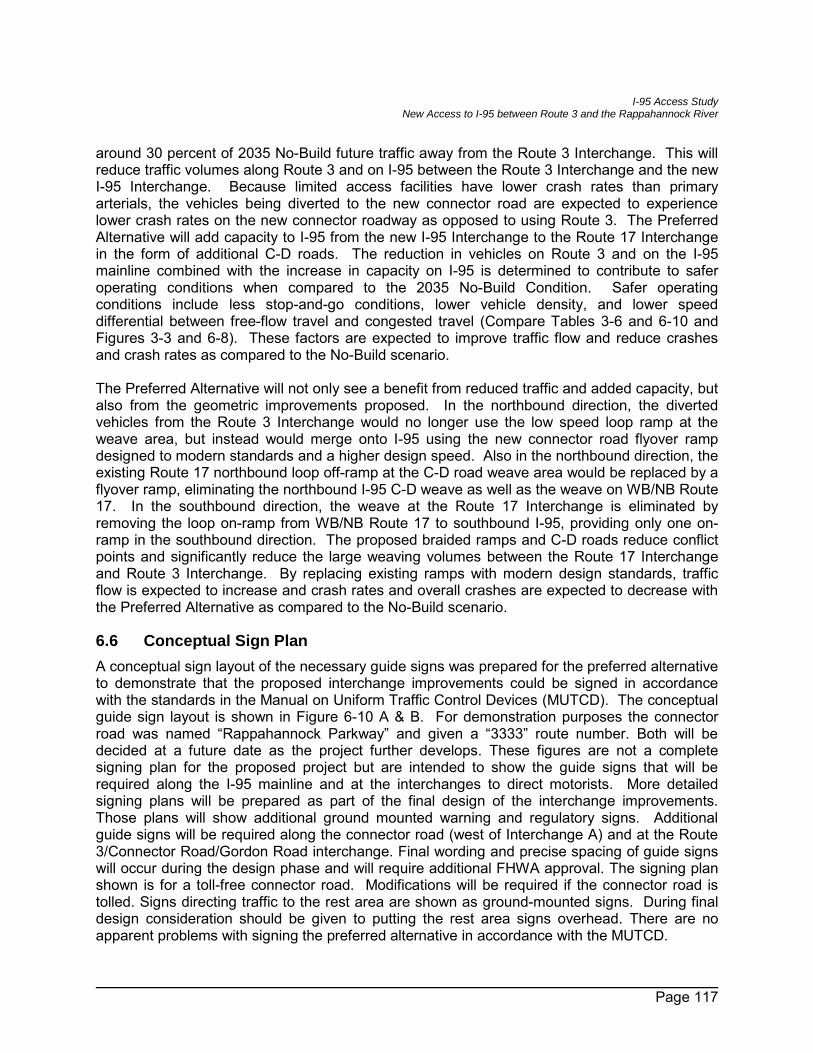
around 30 percent of 2035 No-Build future traffic away from the Route 3 Interchange. This will reduce traffic volumes along Route 3 and on I-95 between the Route 3 Interchange and the new I-95 Interchange. Because limited access facilities have lower crash rates than primary arterials, the vehicles being diverted to the new connector road are expected to experience lower crash rates on the new connector roadway as opposed to using Route 3. The Preferred Alternative will add capacity to I-95 from the new I-95 Interchange to the Route 17 Interchange in the form of additional C-D roads. The reduction in vehicles on Route 3 and on the I-95 mainline combined with the increase in capacity on I-95 is determined to contribute to safer operating conditions when compared to the 2035 No-Build Condition. Safer operating conditions include less stop-and-go conditions, lower vehicle density, and lower speed differential between free-flow travel and congested travel (Compare Tables 3-6 and 6-10 and Figures 3-3 and 6-8). These factors are expected to improve traffic flow and reduce crashes and crash rates as compared to the No-Build scenario. The Preferred Alternative will not only see a benefit from reduced traffic and added capacity, but also from the geometric improvements proposed. In the northbound direction, the diverted vehicles from the Route 3 Interchange would no longer use the low speed loop ramp at the weave area, but instead would merge onto I-95 using the new connector road flyover ramp designed to modern standards and a higher design speed. Also in the northbound direction, the existing Route 17 northbound loop off-ramp at the C-D road weave area would be replaced by a flyover ramp, eliminating the northbound I-95 C-D weave as well as the weave on WB/NB Route 17. In the southbound direction, the weave at the Route 17 Interchange is eliminated by removing the loop on-ramp from WB/NB Route 17 to southbound I-95, providing only one on-ramp in the southbound direction. The proposed braided ramps and C-D roads reduce conflict points and significantly reduce the large weaving volumes between the Route 17 Interchange and Route 3 Interchange. By replacing existing ramps with modern design standards, traffic flow is expected to increase and crash rates and overall crashes are expected to decrease with the Preferred Alternative as compared to the No-Build scenario.
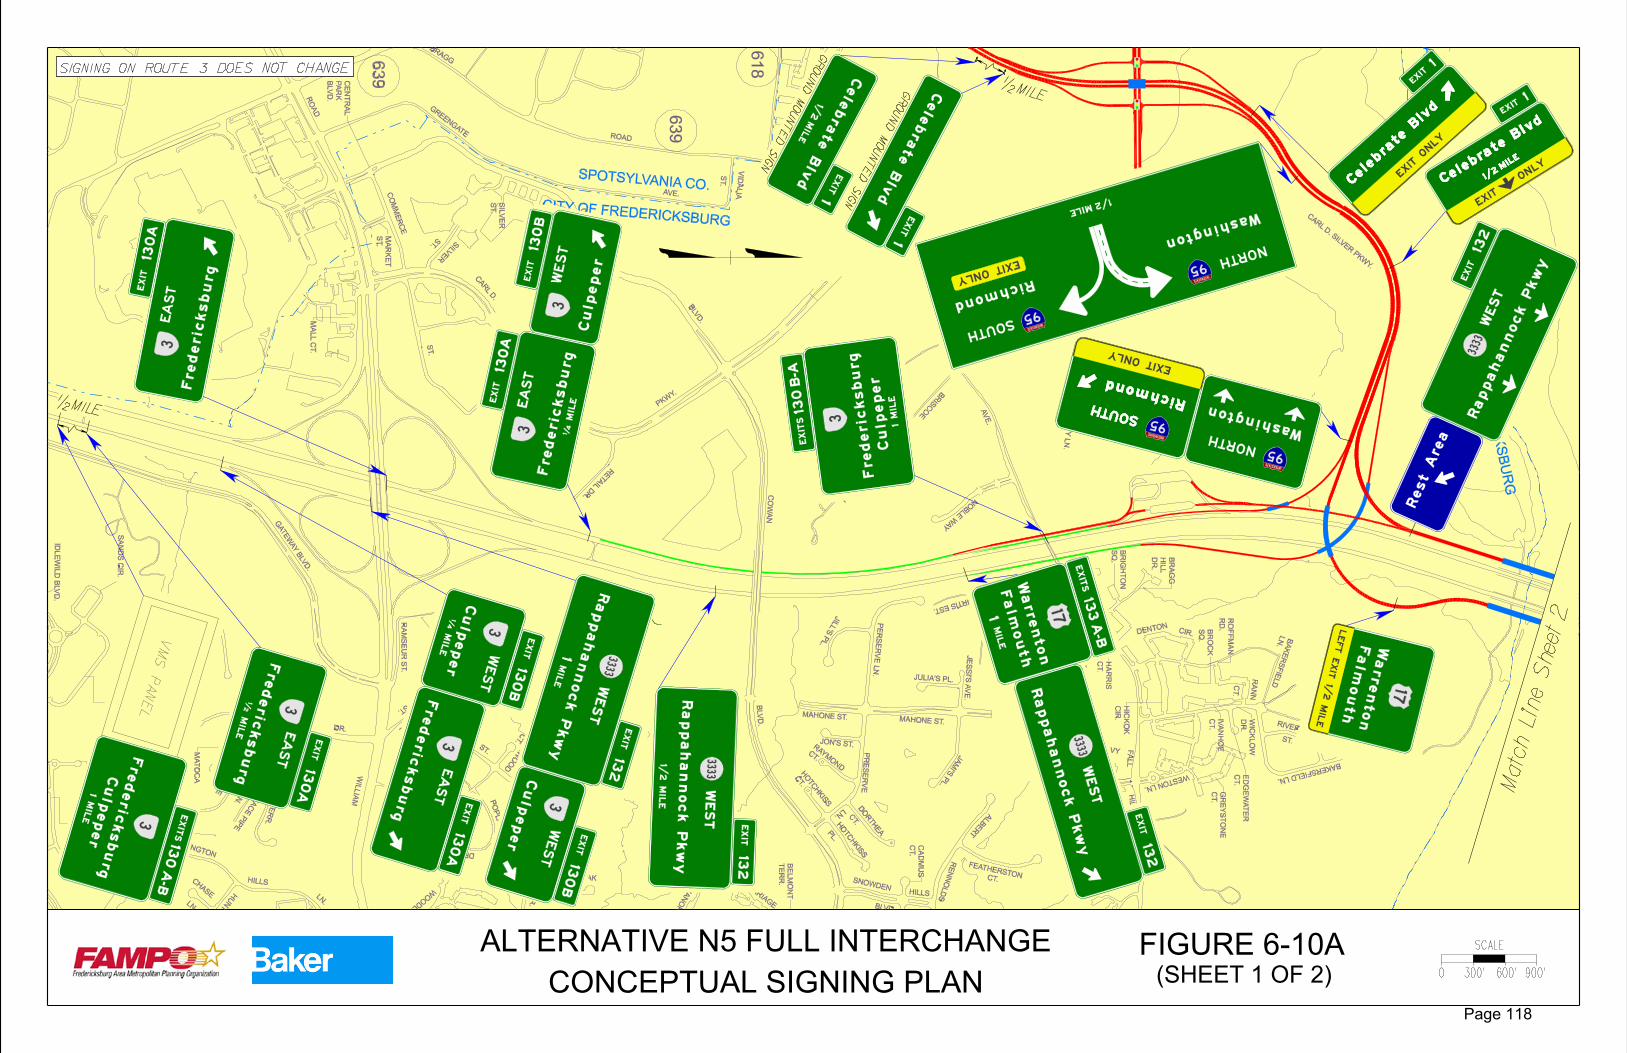
6.6 Conceptual Sign Plan A conceptual sign layout of the necessary guide signs was prepared for the preferred alternative to demonstrate that the proposed interchange improvements could be signed in accordance with the standards in the Manual on Uniform Traffic Control Devices (MUTCD). The conceptual guide sign layout is shown in Figure 6-10 A & B. For demonstration purposes the connector road was named “Rappahannock Parkway” and given a “3333” route number. Both will be decided at a future date as the project further develops. These figures are not a complete signing plan for the proposed project but are intended to show the guide signs that will be required along the I-95 mainline and at the interchanges to direct motorists. More detailed signing plans will be prepared as part of the final design of the interchange improvements. Those plans will show additional ground mounted warning and regulatory signs. Additional guide signs will be required along the connector road (west of Interchange A) and at the Route 3/Connector Road/Gordon Road interchange. Final wording and precise spacing of guide signs will occur during the design phase and will require additional FHWA approval. The signing plan shown is for a toll-free connector road. Modifications will be required if the connector road is tolled. Signs directing traffic to the rest area are shown as ground-mounted signs. During final design consideration should be given to putting the rest area signs overhead. There are no apparent problems with signing the preferred alternative in accordance with the MUTCD.
FIGURE 6-10AALTERNATIVE N5 FULL INTERCHANGECONCEPTUAL SIGNING PLAN (SHEET 1 OF 2)
Page 118
FIGURE 6-10BALTERNATIVE N5 FULL INTERCHANGECONCEPTUAL SIGNING PLAN (SHEET 2 OF 2)