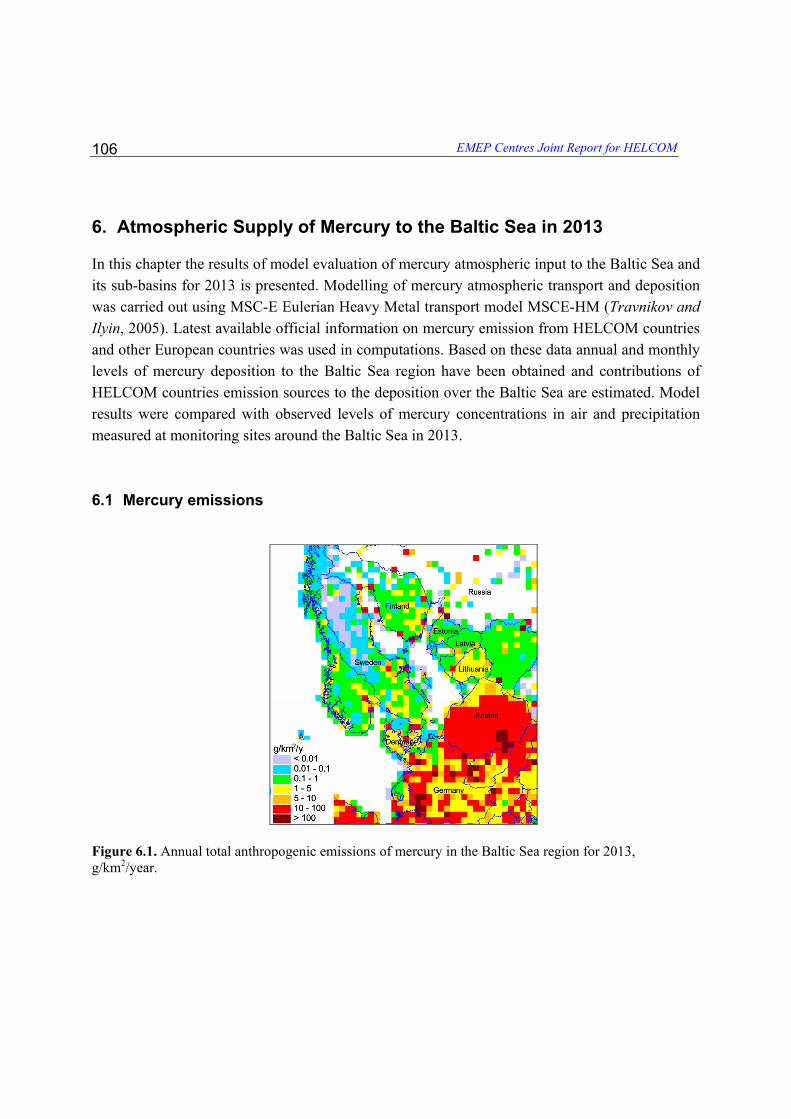
EMEP Centres Joint Report for HELCOM 106 6. Atmospheric Supply of Mercury to the Baltic Sea in 2013 In this chapter the results of model evaluation of mercury atmospheric input to the Baltic Sea and its sub-basins for 2013 is presented. Modelling of mercury atmospheric transport and deposition was carried out using MSC-E Eulerian Heavy Metal transport model MSCE-HM (Travnikov and Ilyin, 2005). Latest available official information on mercury emission from HELCOM countries and other European countries was used in computations. Based on these data annual and monthly levels of mercury deposition to the Baltic Sea region have been obtained and contributions of HELCOM countries emission sources to the deposition over the Baltic Sea are estimated. Model results were compared with observed levels of mercury concentrations in air and precipitation measured at monitoring sites around the Baltic Sea in 2013. 6.1 Mercury emissions Figure 6.1. Annual total anthropogenic emissions of mercury in the Baltic Sea region for 2013, g/km 2 /year.
Transcript
EMEP Centres Joint Report for HELCOM
106
6. Atmospheric Supply of Mercury to the Baltic Sea in 2013 In this chapter the results of model evaluation of mercury atmospheric input to the Baltic Sea and its sub-basins for 2013 is presented. Modelling of mercury atmospheric transport and deposition was carried out using MSC-E Eulerian Heavy Metal transport model MSCE-HM (Travnikov and Ilyin, 2005). Latest available official information on mercury emission from HELCOM countries and other European countries was used in computations. Based on these data annual and monthly levels of mercury deposition to the Baltic Sea region have been obtained and contributions of HELCOM countries emission sources to the deposition over the Baltic Sea are estimated. Model results were compared with observed levels of mercury concentrations in air and precipitation measured at monitoring sites around the Baltic Sea in 2013.
6.1 Mercury emissions
Figure 6.1. Annual total anthropogenic emissions of mercury in the Baltic Sea region for 2013, g/km2/year.
Atmospheric Supply of Mercury to the Baltic Sea in 2013
107
Figure 6.2. Annual mercury emission from Public Power sector for 2013, t/grid cell/y (white color means no information).
Figure 6.3. Annual mercury emission from Industry sector for 2013, t/grid cell/y (white color means no information).
Figure 6.4. Annual mercury emission from Other Stationary Combustion sector for 2013, t/grid cell/y (white color means no information).
Figure 6.5. Annual mercury emission from Fugitive Emissions sector for 2013, t/grid cell/y (white color means no information).
EMEP Centres Joint Report for HELCOM
108
Figure 6.6. Annual mercury emission from Solvents sector for 2013, t/grid cell/y (white color means no information).
Figure 6.7. Annual mercury emission from Road Transport sector for 2013, t/grid cell/y (white color means no information).
Figure 6.8. Annual mercury emission from Shipping Emissions sector for 2013, t/grid cell/y (white color means no information).
Figure 6.9. Annual mercury emission from Aviation sector for 2013, t/grid cell/y (white color means no information).
Atmospheric Supply of Mercury to the Baltic Sea in 2013
109
Figure 6.10. Annual mercury emission from Off Road sector for 2013, t/grid cell/y (white color means no information).
Figure 6.11. Annual mercury emission from Waste sector for 2013, t/grid cell/y (white color means no information).
Figure 6.12. Annual mercury emission from Agricultural Other sector for 2013, t/grid cell/y (white color means no information).
EMEP Centres Joint Report for HELCOM
110
Table 6.1. Annual total mercury anthropogenic emissions of HELCOM countries from different sectors for 2013, tonnes/year GNFR
emission sector
Sector name Denmark Estonia Finland Germany Latvia Lithuania Poland Russia Sweden
A Public Power 0.171 0.642 0.212 6.572 0.018 0.041 5.907 0.179 B Industry 0.103 0.003 0.383 2.865 0.027 0.096 2.744 0.802 0.201
C Other Stationary Combustion
0.038 0.012 0.038 0.321 0.032 0.045 1.67 0.025
D Fugitive Emissions 0.00044 1.0E-05 NA
E Solvents 0.00097 0.012 3.8E-07 0.0022 NA 4.2E-06 3.99E-07
F Road Transport 0.023 0.02 0.426 NA NA
G Shipping Emissions 0.0045 0.011 0.00015 8.3E-05 0.00014
H Aviation 1.3E-05 NA NA NE NE NE NA NE I Off Road 0.013 3.3E-05 0.016 0.00025 0.02 2.5E-06 J Waste 0.0014 0.0088 0.02 0.044 0.024 0.026 0.055 0.047
L Agricultural Other 0.00037 0.0002 NA NA
M Other NO NO NO NA NA NO NA 0.178 NO Total 0.355 0.678 0.673 10.257 0.101 0.229 10.376 0.98 0.453
NO – not occurring, an activity or process does not exist within a country. NA – not applicable, the process or activity exists but emissions are considered never to occur. NE – not estimated, emissions occur but have not been estimated or reported in this submission.
Atmospheric Supply of Mercury to the Baltic Sea in 2013
111
Hg emission, Denmark
B29%
A48%C
11%
Other2%
I4%F
6%
Hg emission, Estonia
A95%
E2%
Other 0.005%
B0.4%J
1.3%C
2%
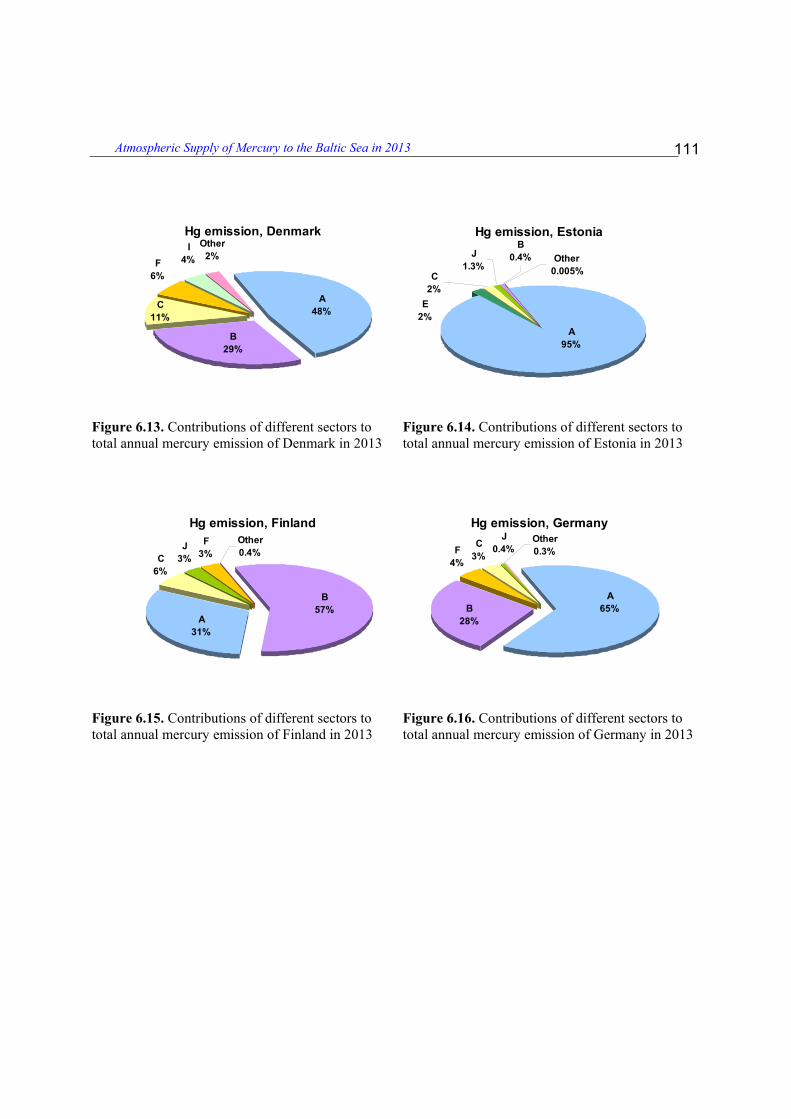
Figure 6.13. Contributions of different sectors to total annual mercury emission of Denmark in 2013
Figure 6.14. Contributions of different sectors to total annual mercury emission of Estonia in 2013
Hg emission, Finland
J3%
F3%
B57%
A31%
Other0.4%C
6%
Hg emission, Germany
F4%
C3%
J0.4%
A65%B
28%
Other0.3%
Figure 6.15. Contributions of different sectors to total annual mercury emission of Finland in 2013
Figure 6.16. Contributions of different sectors to total annual mercury emission of Germany in 2013
EMEP Centres Joint Report for HELCOM
112
Hg emission, Latvia
J24%
A18%
I0.3%
B27%
C31%
Hg emission, Lithuania
I9%
A18%
Other0.06%
C20%
B41%J
12%
Figure 6.17. Contributions of different sectors to total annual mercury emission of Latvia in 2013
Figure 6.18. Contributions of different sectors to total annual mercury emission of Lithuania in 2013
Hg emission, Poland
J0.5%
G< 0.01%
C16%
Other< 0.01%
B26%
A57%
Hg emission, Russia
B82%
M18%
Figure 6.19. Contributions of different sectors to total annual mercury emission of Poland in 2013
Figure 6.20. Contributions of different sectors to total annual mercury emission of Russia in 2013
Hg emission, Sweden
C6%
B44%
A40%
Other0.001%
J10%
G0.03%
Figure 6.21. Contributions of different sectors to total annual mercury emission of Sweden in 2013
Atmospheric Supply of Mercury to the Baltic Sea in 2013
113
Denmark Estonia
Finland Germany
Figure 6.22. Fractions of annual anthropogenic mercury emissions of HELCOM Parties deposited to the Baltic Sea in 2013 (expressed as a percent of national anthropogenic emission deposited to the particular grid cells).
EMEP Centres Joint Report for HELCOM
114
Latvia Lithuania
Poland Russia
Figure 6.22. (cont.) Fractions of annual anthropogenic mercury emissions of HELCOM Parties deposited to the Baltic Sea in 2013 (expressed as a percent of national anthropogenic emission deposited to the particular grid cells).
Atmospheric Supply of Mercury to the Baltic Sea in 2013
115
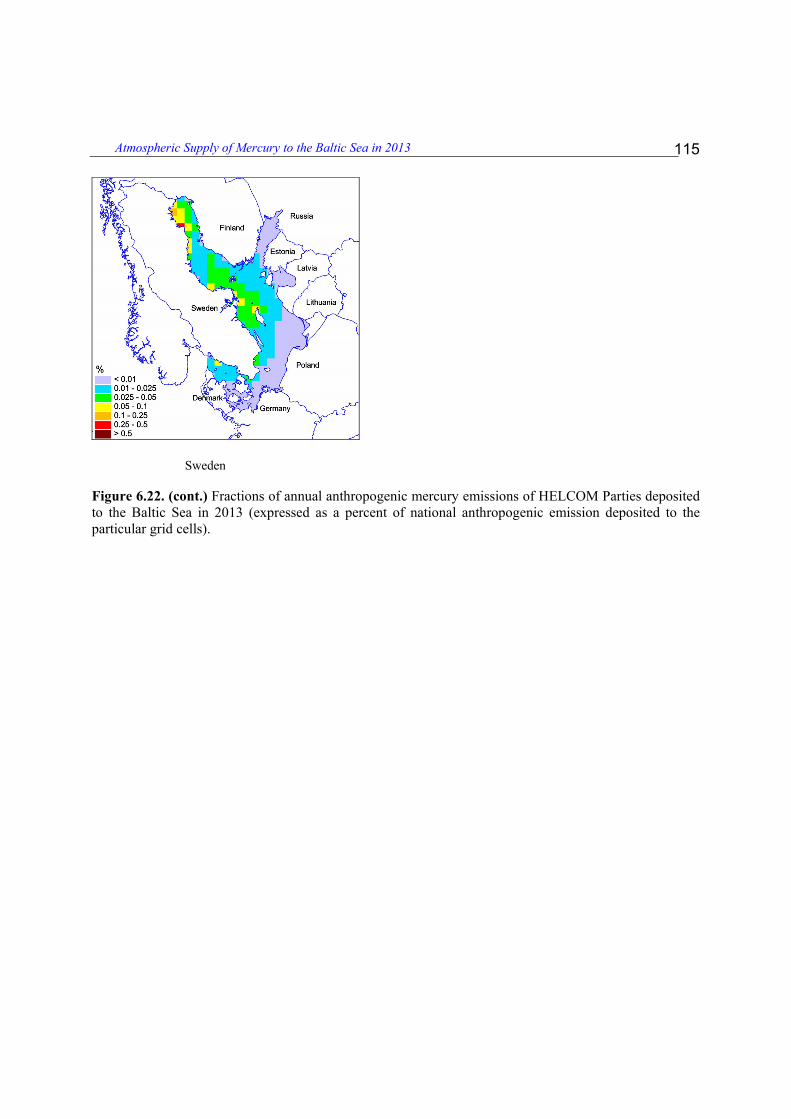
Sweden Figure 6.22. (cont.) Fractions of annual anthropogenic mercury emissions of HELCOM Parties deposited to the Baltic Sea in 2013 (expressed as a percent of national anthropogenic emission deposited to the particular grid cells).
Atmospheric Supply of Mercury to the Baltic Sea in 2013
117
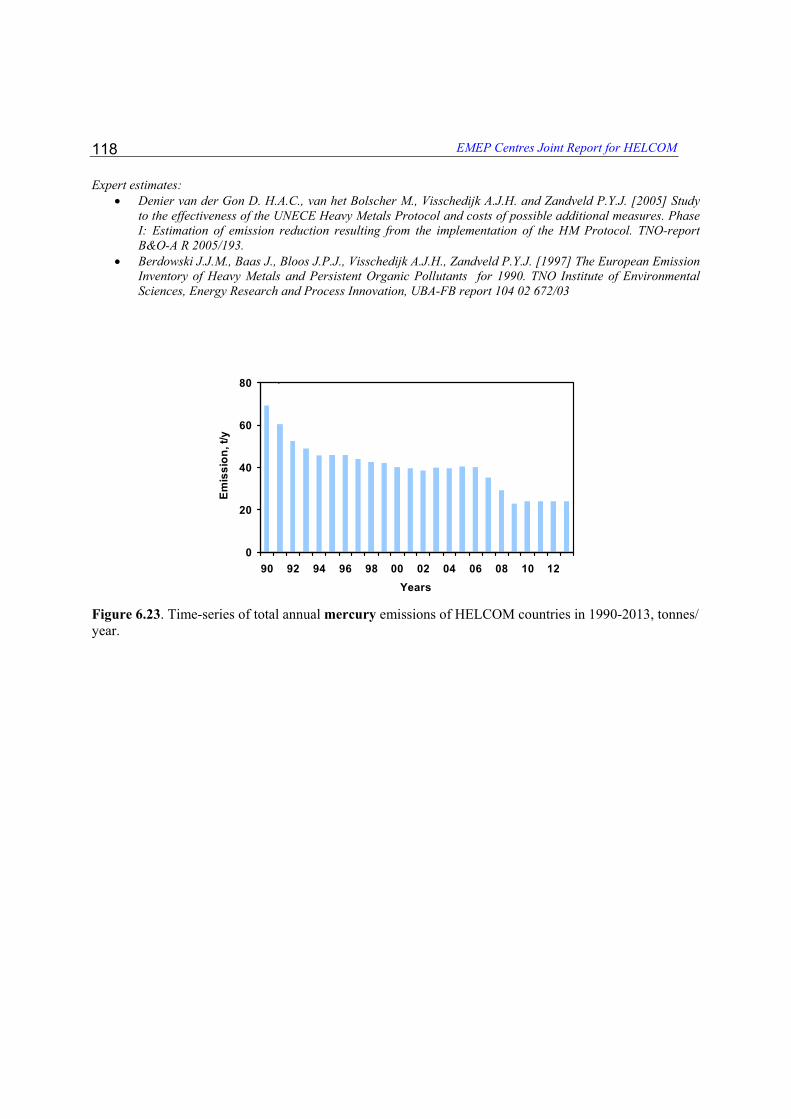
Table 6.2. Annual total anthropogenic emissions of mercury of HELCOM countries and other EMEP countries in period 1990-2013, tonnes/year. (Expert estimates of emissions are shaded) 1990 1991 1992 1993 1994 1995 1996 1997 1998 1999 2000 2001 2002 2003 2004 2005 2006 2007 2008 2009 2010 2011 2012 2013
Expert estimates: • Denier van der Gon D. H.A.C., van het Bolscher M., Visschedijk A.J.H. and Zandveld P.Y.J. [2005] Study
to the effectiveness of the UNECE Heavy Metals Protocol and costs of possible additional measures. Phase I: Estimation of emission reduction resulting from the implementation of the HM Protocol. TNO-report B&O-A R 2005/193.
• Berdowski J.J.M., Baas J., Bloos J.P.J., Visschedijk A.J.H., Zandveld P.Y.J. [1997] The European Emission Inventory of Heavy Metals and Persistent Organic Pollutants for 1990. TNO Institute of Environmental Sciences, Energy Research and Process Innovation, UBA-FB report 104 02 672/03
0
20
40
60
80
90 92 94 96 98 00 02 04 06 08 10 12Years
Emis
sion
, t/y
Figure 6.23. Time-series of total annual mercury emissions of HELCOM countries in 1990-2013, tonnes/ year.
Atmospheric Supply of Mercury to the Baltic Sea in 2013
119
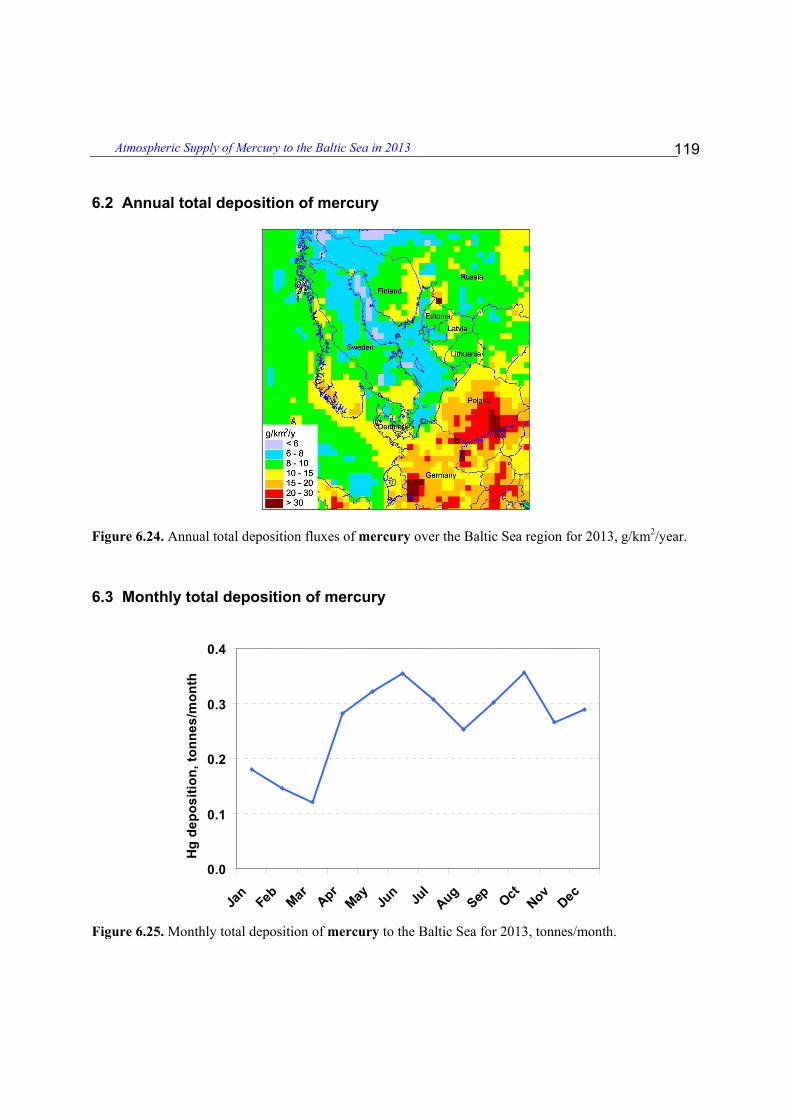
6.2 Annual total deposition of mercury
Figure 6.24. Annual total deposition fluxes of mercury over the Baltic Sea region for 2013, g/km2/year.
6.3 Monthly total deposition of mercury
0.0
0.1
0.2
0.3
0.4
Jan
Feb
Mar
Apr
May
Jun
Jul
Aug
Sep
Oct
Nov
Dec
Hg
depo
sitio
n, to
nnes
/mon
th
Figure 6.25. Monthly total deposition of mercury to the Baltic Sea for 2013, tonnes/month.
EMEP Centres Joint Report for HELCOM
120
Table 6.3. Monthly total deposition of mercury to the Baltic Sea for 2013, tonnes/month. Month Hg deposition Jan 0.18 Feb 0.15 Mar 0.12 Apr 0.28 May 0.32 Jun 0.35 Jul 0.31 Aug 0.25 Sep 0.30 Oct 0.36 Nov 0.27 Dec 0.29 6.4 Source allocation of mercury deposition
0.00
0.05
0.10
0.15
PL DE EE DK GB FI SE CZ UA FR
Hg
depo
sitio
n, to
nnes
/yea
r .
Figure 6.26. Top ten countries with the highest contribution to annual deposition of mercury over the Baltic Sea for 2013, tonnes/year.
Atmospheric Supply of Mercury to the Baltic Sea in 2013
121
0.14(5%)
0.12(4%)
0.04(1%) 0.03
(1%)0.02
(0.7%)0.02
(0.6%) 0.01(0.2%)
0.004(0.1%)
0.003(0.1%)
0.00
0.05
0.10
0.15
0.20
PL DE EE DK FI SE LT LV RU
Hg
depo
sitio
n, to
nnes
/yea
r
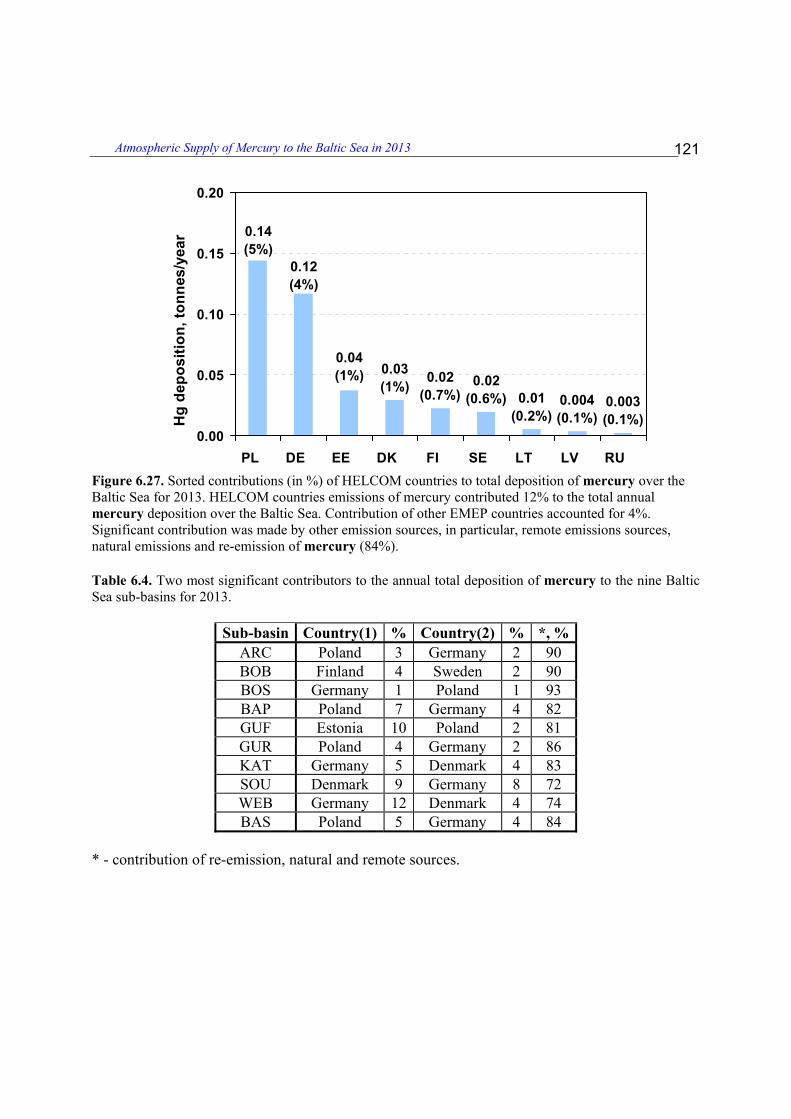
Figure 6.27. Sorted contributions (in %) of HELCOM countries to total deposition of mercury over the Baltic Sea for 2013. HELCOM countries emissions of mercury contributed 12% to the total annual mercury deposition over the Baltic Sea. Contribution of other EMEP countries accounted for 4%. Significant contribution was made by other emission sources, in particular, remote emissions sources, natural emissions and re-emission of mercury (84%). Table 6.4. Two most significant contributors to the annual total deposition of mercury to the nine Baltic Sea sub-basins for 2013.
Sub-basin Country(1) % Country(2) % *, % ARC Poland 3 Germany 2 90 BOB Finland 4 Sweden 2 90 BOS Germany 1 Poland 1 93 BAP Poland 7 Germany 4 82 GUF Estonia 10 Poland 2 81 GUR Poland 4 Germany 2 86 KAT Germany 5 Denmark 4 83 SOU Denmark 9 Germany 8 72 WEB Germany 12 Denmark 4 74 BAS Poland 5 Germany 4 84
* - contribution of re-emission, natural and remote sources.
EMEP Centres Joint Report for HELCOM
122
6.5 Comparison of model results with measurements
DE9 Hg air concentrations, ng/m3
1.0
1.5
2.0
2.5
Jan Feb Mar Apr May Jun Jul Aug Sep Oct Nov Dec
Obs Mod
Figure 6.28. Comparison of calculated monthly mean Hg concentrations in air for 2013 with measurements of the station Zingst (DE9). Units: ng / m3.
SE5 Hg air concentrations, ng/m3
1.0
1.5
2.0
2.5
Jan Feb Mar Apr May Jun Jul Aug Sep Oct Nov Dec
Obs Mod
Figure 6.29. Comparison of calculated monthly mean Hg concentrations in air for 2013 with measurements of the station Bredkälen (SE5). Units: ng / m3.
Atmospheric Supply of Mercury to the Baltic Sea in 2013
123
SE11 Hg air concentrations, ng/m3
1.0
1.5
2.0
2.5
Jan Feb Mar Apr May Jun Jul Aug Sep Oct Nov Dec
Obs Mod
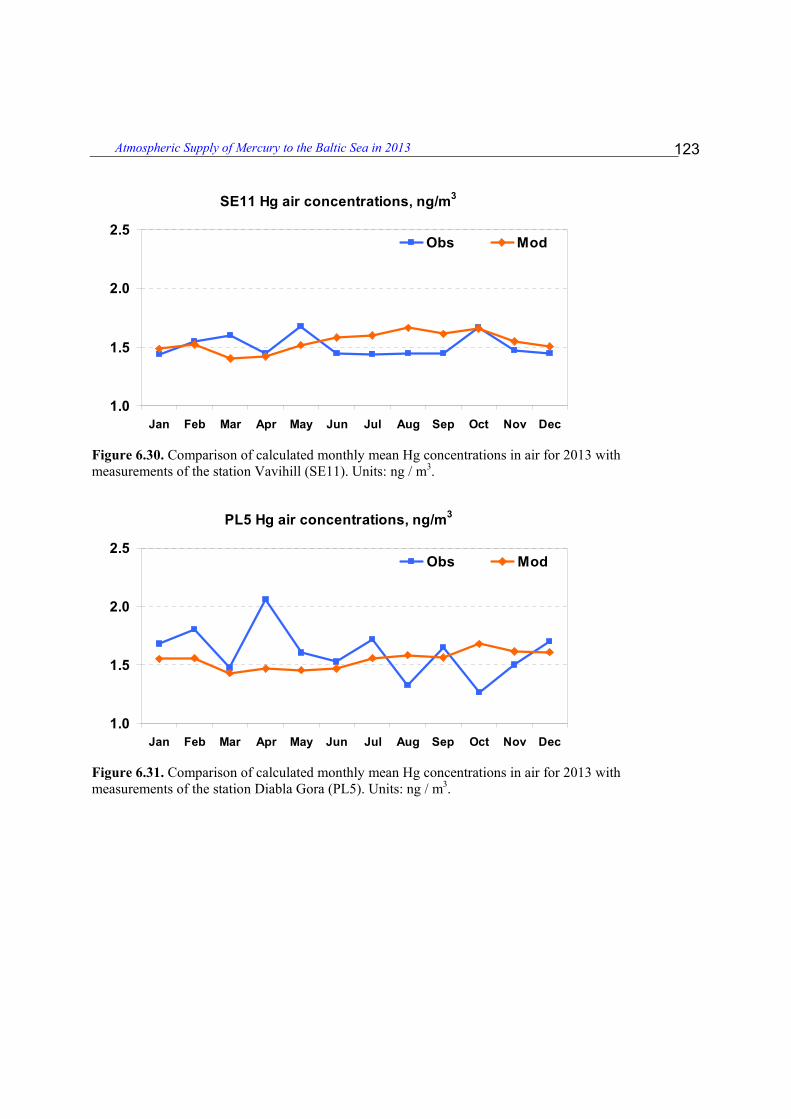
Figure 6.30. Comparison of calculated monthly mean Hg concentrations in air for 2013 with measurements of the station Vavihill (SE11). Units: ng / m3.
PL5 Hg air concentrations, ng/m3
1.0
1.5
2.0
2.5
Jan Feb Mar Apr May Jun Jul Aug Sep Oct Nov Dec
Obs Mod
Figure 6.31. Comparison of calculated monthly mean Hg concentrations in air for 2013 with measurements of the station Diabla Gora (PL5). Units: ng / m3.
EMEP Centres Joint Report for HELCOM
124
SE14 Hg air concentrations, ng/m3
1.0
1.5
2.0
2.5
Jan Feb Mar Apr May Jun Jul Aug Sep Oct Nov Dec
Obs Mod
Figure 6.32. Comparison of calculated monthly mean Hg concentrations in air for 2013 with measurements of the station Råö (SE14). Units: ng / m3.
DE9 Hg concentration in precipitation, ng/L
0
5
10
15
20
25
30
Jan Feb Mar Apr May Jun Jul Aug Sep Oct Nov Dec
Obs Mod
Figure 6.33. Comparison of calculated monthly mean Hg concentrations in precipitation for 2013 with measurements of the station Zingst (DE9). Units: ng/L.
Atmospheric Supply of Mercury to the Baltic Sea in 2013
125
SE14 Hg concentration in precipitation, ng/L
0
10
20
30
40
50
60
Jan Feb Mar Apr May Jun Jul Aug Sep Oct Nov Dec
Obs Mod
Figure 6.34. Comparison of calculated monthly mean Hg concentrations in precipitation for 2013 with measurements of the station Råö (SE14). Units: ng/L.
SE5 Hg concentration in precipitation, ng/L
0
5
10
15
20
25
30
Jan Feb Mar Apr May Jun Jul Aug Sep Oct Nov Dec
Obs Mod
Figure 6.35. Comparison of calculated monthly mean Hg concentrations in precipitation for 2013 with measurements of the station Bredkälen (SE5). Units: ng/L.
EMEP Centres Joint Report for HELCOM
126
SE11 Hg concentration in precipitation, ng/L
0
5
10
15
20
25
30
Jan Feb Mar Apr May Jun Jul Aug Sep Oct Nov Dec
Obs Mod
Figure 6.36. Comparison of calculated monthly mean Hg concentrations in precipitation for 2013 with measurements of the station Vavihill (SE11). Units: ng/L.
LV10 Hg concentration in precipitation, ng/L
0
10
20
30
40
Jan Feb Mar Apr May Jun Jul Aug Sep Oct Nov Dec
Obs Mod
Figure 6.37. Comparison of calculated monthly mean Hg concentrations in precipitation for 2013 with measurements of the station Rucava (LV10). Units: ng/L. Modelled concentrations of mercury in air and in precipitation were compared with the measurement data of 6 monitoring sites around the Baltic Sea. It can be seen that that the model values generally agree with the measured concentrations. Some deviations between simulated and observed monthly mean concentrations of mercury can be explained by the uncertainties in seasonal variation of mercury emission used in modeling (anthropogenic and natural), differences between measured precipitation amount and the one used in the model, and difficulties in
Atmospheric Supply of Mercury to the Baltic Sea in 2013
127
measurements of mercury. 6.6 Concluding remarks
• Mercury emissions from HELCOM countries have decreased from 1990 to 2013 by 65%, whereas from 2012 to 2013 emissions have slightly increased by 0.2%.
• Annual deposition of mercury to the Baltic Sea has decreased from 1990 to 2013 by 29%. Mercury deposition in 2013 was higher comparing to 2012 by 15%.
• The contribution of anthropogenic sources of HELCOM countries to total mercury deposition over the Baltic Sea was estimated to 12%. Essential contribution belongs to the global and natural sources and re-emission (84%) and anthropogenic sources of other EMEP countries (4%).
• The most significant contribution to mercury deposition over the Baltic Sea was made by Poland (5%) and Germany (4%).
• Modelling results for mercury were generally within an accuracy of 25% in comparison to measured concentrations obtained around the Baltic Sea in 2013.