Page 1
H. Lundbeck A/S
Ottiliavej 9 Tel +45 36 30 13 11 E-mail [email protected]
DK-2500 Valby, Copenhagen Fax +45 36 43 82 62 www.lundbeck.com
CVR number: 56759913
6 February 2013
Full year report 2012 Lundbeck delivers on guidance and sales of New Products increase more than 70%
H. Lundbeck A/S (Lundbeck) announces its financial results for 2012, which are in line with expectations
for the year, excluding restructuring charges. Revenue for 2012 was DKK 14,227 million, excluding
Lexapro in the US, which is an increase of 6% compared with 2011. Growth was driven primarily by
Lundbeck’s New Products*, which generated revenue of DKK 2,141 million, an increase of 71%
compared with 2011. Profits were impacted by the loss of Lexapro® revenue in the US, due to patent
expiration, and EBIT for 2012 was DKK 2,177 million, excluding restructuring costs. This corresponds to
an EBIT margin of 14.7% for the year.
Revenue from the US, excluding Lexapro, increased 29% and International Markets grew with 9%
compared with 2011
Revenue from New Products was DKK 2,141 million and increased 71%, constituting 14% of
revenue compared with 8% in 2011
Lexapro in Japan generated revenue of DKK 195 million and the positive market share momentum
continued
OnfiTM
generated full year revenue of DKK 255 million
Net profit amounted to DKK 1,107 million. The Board of Directors proposes to pay a dividend of DKK
2.00 per share, corresponding to a payout ratio of 35%
For 2013, financial guidance is DKK 14.1-14.7 billion in revenue and 1.6-2.1 billion in EBIT as
communicated on 19 December 2012
Distribution of revenue
DKK million Q4 2012 Q4 2011 Growth
Growth in local
currency FY 2012 FY 2011 Growth
Growth in local
currency
New Products* 582 374 55% 49% 2,141 1,253 71% 59%
Cipralex 1,501 1,433 5% 3% 5,827 5,957 (2%) (3%)
Ebixa 677 650 4% 4% 2,803 2,751 2% 2%
Azilect 326 309 6% 6% 1,224 1,187 3% 4%
Xenazine 322 242 33% 27% 1,197 852 40% 30%
Europe 1,960 1,907 3% 2% 7,734 7,988 (3%) (3%)
USA (excl. Lexapro) 556 418 33% 27% 2,099 1,627 29% 20%
International Markets 966 866 11% 10% 3,768 3,468 9% 7%
Total revenue 3,845 3,829 0% (1%) 14,802 16,007 (8%) (8%)
*New Products include Xenazine, Sabril, Sycrest, Lexapro (Japan), Onfi and Treanda
In connection with the full year report, Lundbeck’s President and CEO Ulf Wiinberg said:
"2012 was an exciting year for Lundbeck. We have launched two new products, and our pipeline has
shown a significant development. Going into 2013 we are planning to launch three additional new
products – BrintellixTM
, Abilify® once-monthly and Selincro
TM.”
Page 2
6 February 2013 Corporate Release No 490 page 2 of 25
CONTENTS
FINANCIAL HIGHLIGHTS AND KEY FIGURES ........................................................ 3
MANAGEMENT REVIEW.......................................................................................... 4
Financial outlook ................................................................................................... 4
Dividend ................................................................................................................ 4
Revenue ................................................................................................................ 5
Lundbeck's development portfolio ....................................................................... 11
Expenses and income ......................................................................................... 13
Cash flow ............................................................................................................ 15
Balance sheet...................................................................................................... 16
General corporate matters ................................................................................... 16
FINANCIAL STATEMENTS ..................................................................................... 19
FINANCIAL CALENDAR ......................................................................................... 23
Page 3
6 February 2013 Corporate Release No 490 page 3 of 25
FINANCIAL HIGHLIGHTS AND KEY FIGURES
2012 2011 2012 2011
Q4 Q4 Growth FY FY Growth
Financial highlights (DKK million)
Revenue 3,845 3,829 0% 14,802 16,007 (8%)
Operating profit before depreciation and amortization
(EBITDA)
447 578 (23)% 2,535 4,628 (45%)
Profit from operations (EBIT) 222 326 (32%) 1,647 3,393 (51%)
Net financials (13) (42) 68% (65) (96) 32%
Profit before tax 209 284 (26%) 1,582 3,297 (52%)
Tax 63 81 (22%) 475 1,015 (53%)
Profit for the period 146 203 (28%) 1,107 2,282 (51%)
Equity 13,198 12,776 3% 13,198 12,776 3%
Assets 21,563 20,534 5% 21,563 20,534 5%
Cash flows from operating and investing activities 562 (755) 174% 1,007 929 8%
Property, plant and equipment investments, gross 118 143 (17%) 301 419 (28%)
Key figures
EBITDA margin (%)1 11.6 15.1 (23%) 17.1 28.9 (41%)
EBIT margin (%)1 5.8 8.5 (32%) 11.1 21.2 (48%)
Return on capital employed (%) 1.6 2.4 (33%) 12.1 25.3 (52%)
Research and development ratio (%) 22.6 23.3 (3%) 19.7 20.7 (5%)
Return on equity (%)1 1.1 1.6 (31%) 8.5 19.1 (55%)
Solvency ratio (%)1 61.2 62.2 (2%) 61.2 62.2 (2%)
Capital employed (DKK million) 15,107 14,696 3% 15,107 14,696 3%
Share data
Number of shares for the calculation of EPS (million) 196.1 196.1 0% 196.1 196.1 0%
Number of shares for the calculation of DEPS (million) 196.1 196.1 0% 196.1 196.1 0%
Earnings per share (EPS) (DKK)1 0.75 1.03 (27%) 5.65 11.63 (51%)
Diluted earnings per share (DEPS) (DKK)1 0.75 1.03 (27%) 5.64 11.63 (52%)
Cash flow per share (DKK)1 3.57 1.30 175% 10.77 18.48 (42%)
Net asset value per share (DKK)1 67.29 65.14 3% 67.29 65.14 3%
Market capitalization (DKK million) 16,260 21,183 (23%) 16,260 21,183 (23%)
Share price end of period (DKK) 82.90 108.00 (23%) 82.90 108.00 (23%)
Proposed dividend per share (DKK) - - - 2.00 3.49 (43%)
Other
Number of employees (FTE) 5,541 5,736 (3%) 5,541 5,736 (3%)
1)
Definitions according to the Danish Society of Financial Analysts’ Recommendations & Financial Ratios 2010.
Page 4
6 February 2013 Corporate Release No 490 page 4 of 25
MANAGEMENT REVIEW
Financial outlook
Lundbeck is currently investing significantly in several new product launches and increased pipeline
activity. Lundbeck expects to remain profitable with significant growth in New Products replacing
revenue from mature products.
For the fiscal year 2013, Lundbeck expects revenue to be DKK 14.1-14.7 billion and profit from
operations (EBIT) to be DKK 1.6-2.1 billion, which is in accordance with the announcement on 19
December 2012 regarding the revision of Lundbeck’s long term financial plans. The outlook for 2013
includes a milestone from Takeda Pharmaceuticals Company Limited (Takeda) of USD 30 million
(approx. DKK 170 million) related to the expected launch of Brintellix in the US as well the gain from the
divestiture of non-core products in the US, announced in December 2012, of USD 100 million (approx.
DKK 570 million). Both will be recognized as Other revenue.
Financial forecast 2013
DKK billion
2013
forecast
Revenue 14.1-14.7
EBIT 1.6-2.1
Forward-looking statements
Forward-looking statements provide current expectations or forecasts for events, such as product
launches, product approvals and financial performance. Forward-looking statements are subject to risks,
uncertainties and inaccurate assumptions. Actual results may differ from expected results. Factors that
may affect future results include fluctuations in interest rates and exchange rates, a delay in or failure of
development projects, production problems, unexpected contract breaches or terminations, government-
mandated or market-driven price decreases for Lundbeck’s products, introduction of a competing
product, Lundbeck’s ability to successfully market both new and existing products, exposure to product
liability and other lawsuits, changes in reimbursement rules and governmental laws and their
interpretation and unexpected growth in costs and expenses.
Dividend
The Board of Directors will propose at the Annual General Meeting to pay a dividend of 35% of the
year’s profit after tax to shareholders of the parent company, amounting to DKK 2.00 per share.
Dividend payout is to be approved at the Annual General Meeting on 21 March 2013.
Page 5
6 February 2013 Corporate Release No 490 page 5 of 25
Revenue
Excluding Lexapro in the US, revenue for 2012 increased 6% compared with 2011. Growth was
primarily driven by an increase in revenue from New Products (Xenazine®, Sabril
®, Sycrest
®/Saphris
®,
Lexapro (Japan), Onfi and Treanda®), which increased 71% compared with 2011. New products
constitute 14% of total revenue. Total revenue, including Lexapro (that experienced patent expiration in
March 2012), was DKK 14,802 million, corresponding to a decrease of 8% compared with 2011.
Figure 1 – Revenue from New Products
Total revenue for the fourth quarter, excluding Lexapro in the US, was DKK 3,835 million, corresponding
to an increase of 18% compared with the same quarter last year. The increase was primarily driven by
strong growth in New Products as well as a milestone payment from Takeda of USD 50 million (approx.
DKK 285 million) related to the acceptance of the filing of Brintellix by the U.S. Food and Drug
Administration (FDA).
Total revenue
DKK million Q4 2012 Q4 2011 Growth
Growth in local
currency FY 2012 FY 2011 Growth
Growth in local
currency
Cipralex 1,501 1,433 5% 3% 5,827 5,957 (2%) (3%)
Ebixa 677 650 4% 4% 2,803 2,751 2% 2%
Azilect 326 309 6% 6% 1,224 1,187 3% 4%
Xenazine 322 242 33% 27% 1,197 852 40% 30%
Sabril 78 77 1% (3%) 376 309 22% 12%
Other pharmaceuticals 578 480 21% 17% 2,174 2,027 7% 4%
Other revenue 353 57 516% 478% 626 389 61% 55%
Revenue excl. Lexapro (US) 3,835 3,248 18% 16% 14,227 13,472 6% 4%
Lexapro (US) 10 581 (98%) (98%) 575 2,535 (77%) (74%)
Total revenue 3,845 3,829 0% (1%) 14,802 16,007 (8%) (8%)
Page 6
6 February 2013 Corporate Release No 490 page 6 of 25
Revenue from Cipralex® (escitalopram), for the treatment of mood disorders, was DKK 1,501 million for
the fourth quarter, an increase of 5%, or 3% in local currency, compared with the same quarter last year.
The growth was driven by increasing revenue in International Markets. In August 2011, Lexapro
(escitalopram) was launched in Japan by Lundbeck’s partners, Mochida Pharmaceuticals and Mitsubishi
Tanabe Pharma Corporation, and during the fourth quarter Lexapro generated revenue of DKK 62
million in Japan. Revenue from Lexapro in Japan is included in Cipralex revenue, International Markets.
Ebixa® (memantine), for the symptomatic treatment of Alzheimer’s disease, generated fourth quarter
revenue of DKK 677 million, an increase of 4% compared with the same period last year. Lundbeck has
the marketing rights to Ebixa in most parts of the world, except in Japan and the US.
Azilect® (rasagiline), for the treatment of Parkinson’s disease, generated revenue of DKK 326 million for
the fourth quarter, an increase of 6% compared with the same quarter last year. Sales were impacted by
the fact that the rights to Azilect in Germany were returned to Teva Pharmaceutical Industries Inc.
(Teva) in January 2012. Revenue growth excluding Germany was 24%, driven by growth in most
markets. Lundbeck has commercial rights to Azilect in most of Europe (in co-promotion with Teva in
France and the UK) and selected markets outside Europe, including six Asian countries.
Xenazine1 (tetrabenazine), for the treatment of chorea associated with Huntington’s disease, generated
revenue of DKK 322 million in the fourth quarter, an increase of 33%, or 27% in local currency,
compared with the same period last year. Lundbeck has the marketing rights for Xenazine in the US.
Sabril (vigabatrin), for the treatment of refractory complex partial seizures and infantile spasms,
generated fourth quarter revenue of DKK 78 million, an increase of 1%, compared with the same quarter
last year. As a result of health care reforms, revenue for the quarter was impacted by an increase in
provisions related to rebate obligations. The underlying growth for the quarter was 35%. Lundbeck has
the marketing rights for Sabril in the US.
Onfi (clobazam), for the treatment of Lennox Gastaut-syndrome was launched in the US in January
2012. The launch has been very successful and Onfi has been well received by physicians. Revenue for
the fourth quarter was DKK 80 million. Revenue from Onfi is recognized as part of Other
pharmaceuticals. Lundbeck has the marketing rights for Onfi in the US.
Sycrest/Saphris (asenapine) is indicated for the treatment of moderate to severe manic episodes
associated with bipolar I disorder in the EU (Sycrest), and for the treatment of schizophrenia and/or
moderate to severe manic episodes associated with bipolar I disorder outside the EU (Saphris).
Sycrest/Saphris generated revenue of DKK 33 million for the fourth quarter of 2012. Lundbeck retains
commercial rights to Sycrest/Saphris in all markets outside the US, Japan and China. Revenue from
Sycrest/Saphris is recognized as part of Other pharmaceuticals.
Revenue from Other pharmaceuticals was DKK 578 million for the fourth quarter, an increase of 21%
compared with the same period last year. The increase was primarily due to revenue from Onfi.
1 Xenazine
® is a registered trademark of Valeant International, Bermuda
Page 7
6 February 2013 Corporate Release No 490 page 7 of 25
Other revenue for the fourth quarter was DKK 353 million, compared with DKK 57 million for the same
period last year. The quarter was positively impacted by a milestone payment of USD 50 million (approx.
DKK 285 million) from Takeda related to the US filing of Brintellix.
Figure 2 – Total revenue (excl. Lexapro revenue in the US)
Excluding Lexapro in the US, Lundbeck has experienced an average revenue growth of 12%
(compound annual growth rate) in each of the last five years. This growth has been driven by the
successful commercialization of Azilect, Cipralex, Ebixa, Sabril and Xenazine. Going forward, growth will
continue to be driven by most of these products, and to a larger extent by recently launched products
such as Lexapro (Japan), Onfi, Treanda and Sycrest/Saphris, as well as other future launches.
Figure 3 - Revenue per region FY 2012 (growth in brackets) - DKKm
Page 8
6 February 2013 Corporate Release No 490 page 8 of 25
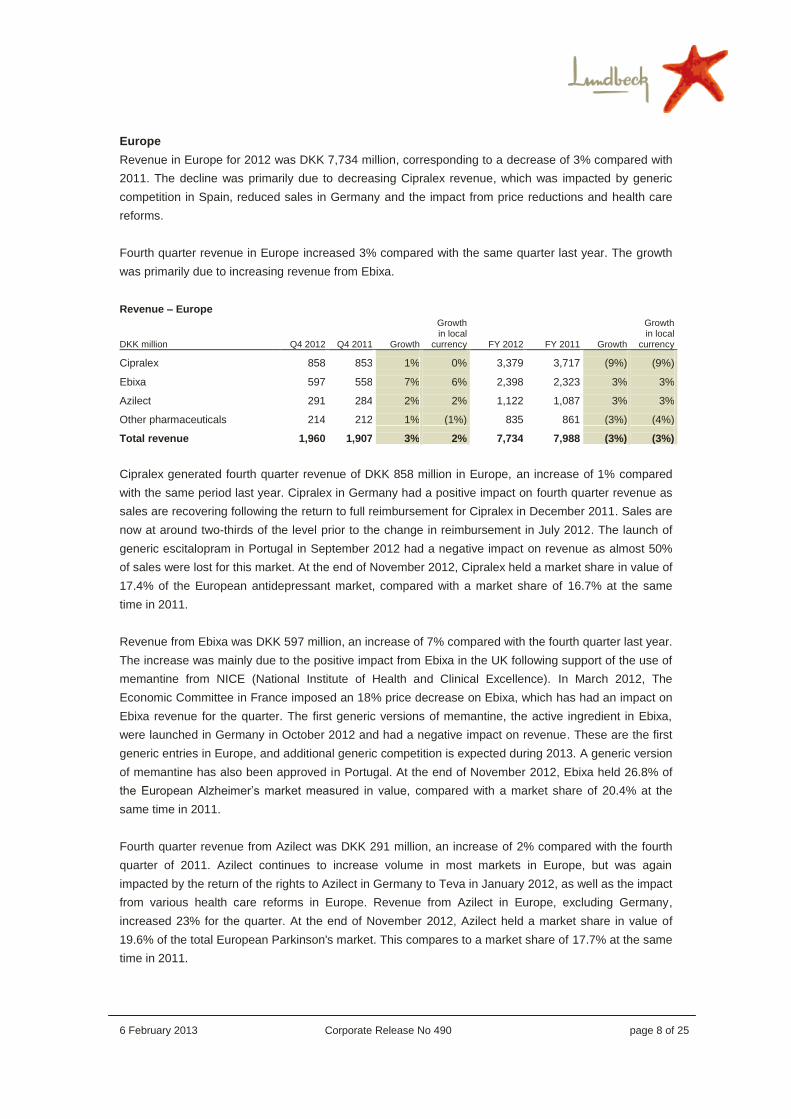
Europe
Revenue in Europe for 2012 was DKK 7,734 million, corresponding to a decrease of 3% compared with
2011. The decline was primarily due to decreasing Cipralex revenue, which was impacted by generic
competition in Spain, reduced sales in Germany and the impact from price reductions and health care
reforms.
Fourth quarter revenue in Europe increased 3% compared with the same quarter last year. The growth
was primarily due to increasing revenue from Ebixa.
Revenue – Europe
DKK million Q4 2012 Q4 2011 Growth
Growth in local
currency FY 2012 FY 2011 Growth
Growth in local
currency
Cipralex 858 853 1% 0% 3,379 3,717 (9%) (9%)
Ebixa 597 558 7% 6% 2,398 2,323 3% 3%
Azilect 291 284 2% 2% 1,122 1,087 3% 3%
Other pharmaceuticals 214 212 1% (1%) 835 861 (3%) (4%)
Total revenue 1,960 1,907 3% 2% 7,734 7,988 (3%) (3%)
Cipralex generated fourth quarter revenue of DKK 858 million in Europe, an increase of 1% compared
with the same period last year. Cipralex in Germany had a positive impact on fourth quarter revenue as
sales are recovering following the return to full reimbursement for Cipralex in December 2011. Sales are
now at around two-thirds of the level prior to the change in reimbursement in July 2012. The launch of
generic escitalopram in Portugal in September 2012 had a negative impact on revenue as almost 50%
of sales were lost for this market. At the end of November 2012, Cipralex held a market share in value of
17.4% of the European antidepressant market, compared with a market share of 16.7% at the same
time in 2011.
Revenue from Ebixa was DKK 597 million, an increase of 7% compared with the fourth quarter last year.
The increase was mainly due to the positive impact from Ebixa in the UK following support of the use of
memantine from NICE (National Institute of Health and Clinical Excellence). In March 2012, The
Economic Committee in France imposed an 18% price decrease on Ebixa, which has had an impact on
Ebixa revenue for the quarter. The first generic versions of memantine, the active ingredient in Ebixa,
were launched in Germany in October 2012 and had a negative impact on revenue. These are the first
generic entries in Europe, and additional generic competition is expected during 2013. A generic version
of memantine has also been approved in Portugal. At the end of November 2012, Ebixa held 26.8% of
the European Alzheimer’s market measured in value, compared with a market share of 20.4% at the
same time in 2011.
Fourth quarter revenue from Azilect was DKK 291 million, an increase of 2% compared with the fourth
quarter of 2011. Azilect continues to increase volume in most markets in Europe, but was again
impacted by the return of the rights to Azilect in Germany to Teva in January 2012, as well as the impact
from various health care reforms in Europe. Revenue from Azilect in Europe, excluding Germany,
increased 23% for the quarter. At the end of November 2012, Azilect held a market share in value of
19.6% of the total European Parkinson's market. This compares to a market share of 17.7% at the same
time in 2011.
Page 9
6 February 2013 Corporate Release No 490 page 9 of 25
Revenue from Other pharmaceuticals was DKK 214 million, unchanged compared with the fourth
quarter last year.
USA
Revenue in the US, excluding Lexapro, for 2012 was DKK 2,099 million, corresponding to an increase of
29% compared with 2011. The increase was driven by Xenazine, Sabril and Onfi.
Revenue – USA
DKK million Q4 2012 Q4 2011 Growth
Growth in local
currency FY 2012 FY 2011 Growth
Growth in local
currency
Xenazine 311 233 33% 28% 1,154 817 41% 31%
Sabril 78 77 1% (3%) 376 309 22% 12%
Other pharmaceuticals 167 108 56% 48% 569 501 14% 5%
Revenue excl. Lexapro 556 418 33% 27% 2,099 1,627 29% 20%
Lexapro 10 581 (98%) (98%) 575 2,535 (77%) (74%)
Total revenue 566 999 (43%) (44%) 2,674 4,162 (36%) (37%)
For the fourth quarter, revenue in the US, excluding revenue from Lexapro, was DKK 556 million, an
increase of 33% compared with the same quarter last year, even considering the disposal of three
smaller products in the fourth quarter of 2011. Lundbeck’s New Products in the US increased 51% for
the quarter.
Figure 4 – Lundbeck revenue in the US
Lundbeck’s total fourth quarter revenue in the US was DKK 566 million, a decrease of 43% compared
with the same quarter last year. Growth in New Products, Xenazine, Sabril and Onfi was offset by the
patent expiration of Lexapro, as well as the disposal of the three mature products to Akorn Inc. in
December 2011.
Page 10
6 February 2013 Corporate Release No 490 page 10 of 25
Revenue from Xenazine in the US was DKK 311 million for the quarter, an increase of 33%, or 28% in
local currency, compared with the fourth quarter last year. The positive trend from the previous quarters
continues as patient growth remains strong.
Sabril revenue for the quarter was DKK 78 million, an increase of 1%, or a decrease of 3% in local
currency, compared with the same quarter last year. As a result of health care reforms, revenue for the
quarter was impacted by an increase in provisions related to rebate obligations. The underlying growth
for the quarter was 35%.
In January 2012, Onfi was made available for prescription in the US as an adjunctive therapy for
seizures associated with Lennox-Gastaut syndrome (LGS). There has been a strong initial brand uptake
and the feedback from physicians remains positive. Onfi generated revenue of DKK 80 million for the
fourth quarter of 2012. Onfi revenue is reported as part of Other pharmaceuticals.
Fourth quarter revenue from Other pharmaceuticals in the US was DKK 167 million, an increase of 56%
compared with the same quarter last year. The increase was due to the launch of Onfi in the first quarter
of the year. Furthermore, revenue from Other pharmaceuticals was impacted by the disposal of
Nembutal®, Cogentin
® and Diuril
® to Akorn Inc. in the US in the fourth quarter last year. The transaction
was part of Lundbeck's long-term strategy to focus on newer, strategic products in its portfolio.
In December 2012, also as a part of Lundbeck’s long-term strategy to focus on newer, innovative
products, Lundbeck entered into an asset purchase agreement with Recordati S.p.A. (Recordati),
effective as of January 2013. According to the agreement, Recordati acquired a portfolio of Lundbeck's
non-core products primarily related to the US. The divested products represented annual revenue of
approx. USD 50 million in 2012.
International Markets
Revenue in International Markets, which comprises all of Lundbeck’s markets outside Europe and the
US, was DKK 3,768 million for 2012, corresponding to an increase of 9% compared with 2011. Growth
was primarily driven by an increase in Cipralex as well as Other pharmaceuticals.
For the fourth quarter, revenue in International Markets was DKK 966 million, an increase of 11%
compared with the fourth quarter 2011. Growth was driven by increased revenue from Cipralex and
Other pharmaceuticals. Significantly, revenue from Canada continued the positive momentum and
increased 29% to DKK 314 million for the quarter. For 2012, revenue in Canada was DKK 1,106 million.
Revenue – International Markets
DKK million Q4 2012 Q4 2011 Growth
Growth in local
currency FY 2012 FY 2011 Growth
Growth in local
currency
Cipralex 643 580 11% 9% 2,448 2,240 9% 8%
Ebixa 80 92 (13%) (10%) 405 428 (5%) (3%)
Azilect 35 25 41% 52% 102 100 3% 16%
Other pharmaceuticals 208 169 23% 18% 813 700 16% 12%
Total revenue 966 866 11% 10% 3,768 3,468 9% 7%
Page 11
6 February 2013 Corporate Release No 490 page 11 of 25
Cipralex generated fourth quarter revenue of DKK 643 million in International Markets, an increase of
11% compared with the fourth quarter last year, corresponding to an increase of 9% in local currency.
Cipralex sales were positively impacted by revenue from Lexapro in Japan as well as the continued
strong growth in Canada. Revenue from Japan was DKK 62 million for the fourth quarter and develops
as expected. Lexapro now holds a market share in value of 10.6% of the Japanese antidepressant
market (December 2012). While the positive momentum in market share continues, December is
typically not representative of the underlying market share development. Revenue from Cipralex in
Canada increased 31% compared with the fourth quarter last year, and the product now holds a market
share in terms of value of 23% in Canada (November 2012), compared with 18.7% at the same time last
year. Revenue in Turkey continues to be impacted by price pressure, while the increased generic
competition in Brazil also had a negative impact on sales. At the end of November 2012, Cipralex held
a market share in terms of value of 13.0% of the aggregate market for antidepressants in International
Markets2, compared with a market share of 12.2% in the same period last year.
Ebixa generated fourth quarter revenue of DKK 80 million, a decrease of 13%, or 10% in local currency.
The decrease was due to price pressure in various countries including Brazil and South Korea, as well
as quarterly fluctuations in sales. In November 2012, Ebixa held 8.1% of the total market in terms of
value of pharmaceuticals for the treatment of Alzheimer’s disease in International Markets. This
compares with a market share of 8.6% in November 2011.
Revenue from Azilect was DKK 35 million, an increase of 41% or 52% in local currency, compared with
the fourth quarter last year. The growth was primarily driven by increased sales in Turkey as well as the
launch of Azilect in Australia, Hong Kong and Thailand in 2012. Azilect is now available in a total of five
countries within International Markets.
Other pharmaceuticals generated revenue of DKK 208 million during the quarter, an increase of 23%, or
18% in local currency, compared with the same quarter last year. The growth was due to an increase in
Lundbeck’s mature products as well as quarterly fluctuations in revenue.
Lundbeck's development portfolio
Lundbeck is developing a number of new and promising pharmaceuticals for the treatment of brain
disorders. The pipeline projects are targeting areas where Lundbeck currently has a market presence
such as depression, anxiety and other psychiatric disorders, as well as new areas such as stroke and
alcohol dependence. Pipeline development in 2012 is summarized as follows:
Regulatory review
Selincro (nalmefene) is a novel opioid receptor ligand in development for the treatment of alcohol
dependence. In December 2012, the Committee for Medicinal Products for Human Use (CHMP) under
the European Medicines Agency (EMA) adopted a positive opinion and recommended marketing
authorization of Selincro for the reduction of alcohol consumption in adult patients with alcohol
2 Market shares for International Markets are based on IMS data from Australia, Brazil, Canada, China, Mexico,
Saudi Arabia, South Africa, South Korea and Turkey.
Page 12
6 February 2013 Corporate Release No 490 page 12 of 25
dependence, who maintain a high level of alcohol consumption. The CHMP opinion was based on the
results from three pivotal, randomized, double-blind, placebo-controlled clinical trials studying the effects
of 18mg Selincro in adults patients with alcohol dependence. These studies included approximately
2,000 patients diagnosed with alcohol dependence.
The final decision from The European Commission based on the CHMP recommendation is expected by
the end of the first quarter of 2013. The decision will be applicable to all 27 European Union member
states plus Iceland and Norway. Subject to the Commission’s final approval and the completion of
pricing and reimbursement discussions, Lundbeck expects to launch Selincro in its first European
markets by mid-2013.
Brintellix (vortioxetine) is an investigational multimodal antidepressant. In 2012, Lundbeck and its
partner Takeda submitted a New Drug Application (NDA) for Brintellix to the FDA, and separately
Lundbeck submitted a marketing authorization application (MAA) to the EMA and Health Canada. The
data package supporting the files is substantial, consisting of short and long term studies in major
depression using dosages from 5-20mg of Brintellix. The data package also includes studies in relapse
prevention and in elderly patients with major depression. More than 7,500 individuals have been treated
with Brintellix worldwide, including the US, across the entire clinical trial programme. According to the
timelines established by the Prescription Drug User Fee Act (PDUFA), the review of the NDA is targeted
for completion by 2 October 2013.
Abilify3 once-monthly is an intramuscular depot formulation of aripiprazole developed for the
maintenance treatment of schizophrenia. In September 2012, the resubmission of the NDA for Abilify
once-monthly was accepted by the FDA. The FDA stated that this resubmission constituted a complete
Class 2 response to their action letter of 26 July 2012. The PDUFA goal date is 28 February 2013.
Furthermore, in 2012, the European MAA was submitted and subsequently accepted by the EMA in
December.
In 2012, two new clinical phase III trials were initiated with Abilify once-monthly: for the maintenance
treatment of bipolar I disorder (600 patients) and for the acute treatment of schizophrenia (310 patients)
respectively.
Abilify once-monthly is a part of Lundbeck’s collaboration with Otsuka Pharmaceutical Co., Ltd.
(Otsuka), and Lundbeck has co-development and co-promotional rights to the product.
Clinical phase III
Desmoteplase is being developed for the treatment of ischemic stroke. The clinical phase III studies
with desmoteplase show improved patient recruitment following several initiatives to speed up the
recruitment process. A filing of desmoteplase is expected in 2014. In February 2012, Lundbeck acquired
the remaining rights to desmoteplase, and now holds the global rights to the compound.
Brexpiprazole (OPC-34712) is a novel investigational psychotherapeutic compound. As part of the
collaboration with Otsuka, Lundbeck has gained co-development and co-promotional rights to
3 Abilify
® is a trademark of Otsuka Pharmaceutical Co., Ltd.
Page 13
6 February 2013 Corporate Release No 490 page 13 of 25
brexpiprazole. The clinical phase III programme for brexpiprazole has been initiated for the treatment of
acute schizophrenia and the adjunctive treatment of major depression and the programme is
progressing according to plan. In 2012, an additional clinical phase III study in the maintenance
treatment of schizophrenia was initiated with brexpiprazole (420 patients). Brexpiprazole is a
psychotherapeutic compound developed to provide improved efficacy and tolerability, such as less
akathisia, restlessness and/or insomnia.
Clinical phase II
Lu AE58054 is a potent and selective 5-HT6 receptor antagonist. In May, it was announced that Lu
AE58054 had met its primary endpoint in a fixed dose, randomized, placebo-controlled, 24-week clinical
study in 278 patients. The study was conducted in patients suffering from moderate Alzheimer's
disease, with Lu AE58054 administered as an add-on to donepezil, a commonly used
acetylcholinesterase inhibitor. In the study, Lu AE58054 (plus donepezil) demonstrated significant
improvements in cognitive function in Alzheimer's disease compared with placebo (plus donepezil), as
assessed by the ADAS-cog score. Lu AE58054 was considered overall to be well tolerated at the
selected dose. The pivotal clinical programme with Lu AE58054 is planned to be initiated 2013.
Expenses and income
Total costs for 2012 increased by 4% to DKK 13,155 million. Costs for the year were impacted by one-
off costs of DKK 530 million related to the restructuring announced in June 2012. Costs for 2011 were
impacted by restructuring costs in R&D of DKK 410 million in the third quarter.
Total costs for the fourth quarter were DKK 3,623 million, an increase of 3% compared with the fourth
quarter last year.
Distribution of costs
DKK million Q4 2012 Q4 2011 Growth FY 2012 FY 2011 Growth
Cost of sales 854 869 (2%) 3,325 3,166 5%
Sales and distribution 1,326 1,266 5% 5,274 4,526 17%
Administration 576 475 21% 1,641 1,602 2%
Research & Development 867 893 (3%) 2,915 3,320 (12%)
Total costs 3,623 3,503 3% 13,155 12,614 4%
Cost of sales decreased 2% for the fourth quarter to DKK 854 million. This corresponds to 22% of
Lundbeck's total revenue, which is one percentage point lower compared with the same quarter last
year. Cost of sales for the period was again affected by the higher cost of goods sold due to increasing
revenue from in-licensed products (i.e. Xenazine, Azilect and Ebixa).
Sales and distribution costs for the fourth quarter were DKK 1,326 million, corresponding to 34% of
revenue and an increase of 5% compared with the same period last year. The increase in sales and
distribution costs related mainly to launch and pre-launch costs for Brintellix, Abilify once-monthly and
Onfi. Administrative expenses were DKK 576 million for the quarter and corresponded to 15% of the
total revenue for the period. The administration expenses for the quarter were impacted by increased
Page 14
6 February 2013 Corporate Release No 490 page 14 of 25
costs related to administrative support functions in new markets to support product launches as well as
increased legal costs and restructuring costs. SG&A (Selling, General and Administrative) costs were
DKK 1,902 million, compared with DKK 1,741 million in the same period last year. The SG&A margin for
the period was 49% compared with 45% in the same period last year.
R&D (Research and Development) costs for the quarter were DKK 867 million compared with DKK 893
million in the same period last year.
Operating profit before depreciation and amortization (EBITDA)
EBITDA was DKK 447 million, compared with DKK 578 million for the fourth quarter of 2011. EBITDA
margin for the period was 11.6%, down from 15.1% in the same quarter last year. EBITDA margin for
2012 was 17.1%, compared with 28.9% for 2011.
Depreciation, amortization and impairment charges
Depreciation, amortization and impairment charges, which are included in the individual expense
categories, amounted to DKK 888 million for 2012 compared with DKK 1,235 million in 2011. This
corresponds to a decrease of 28%. The decrease is primarily due to write offs in 2011 related to the
restructuring in R&D.
Depreciation, amortization and impairment charges for the fourth quarter amounted to DKK 225 million
compared with DKK 252 million in fourth quarter last year. This corresponds to a decrease of 11%.
Depreciation, amortization and impairment charges
DKK million Q4 2012 Q4 2011 Growth FY 2012 FY 2011 Growth
Cost of sales 50 53 (6%) 186 156 19%
Sales and distribution 85 101 (17%) 420 404 4%
Administration 22 17 37% 70 73 (5%)
Research & Development 68 81 (16%) 212 602 (65%)
Total depreciation, amortization and
impairment charges 225 252 (11%) 888 1,235 (28%)
Profit from operations (EBIT)
EBIT for the fourth quarter of 2012 amounted to DKK 222 million, which corresponds to a decrease of
32%, compared with the same period in 2011 (DKK 326 million). The EBIT margin for the period was
5.8%, compared with 8.5% in the same period the year before. The EBIT margin for 2012 was 11.1%,
compared with 21.2% for 2011. The EBIT margin for 2012 was primarily impacted by the loss of Lexapro
revenue as well as one-off costs of DKK 530 million related to the restructuring of the commercial
operations in Europe that was announced in June.
Net financials
Lundbeck generated a net financial expense of DKK 13 million in the fourth quarter of 2012, compared
with a net financial expense of DKK 42 million in the fourth quarter of 2011.
Net interest expenses, including realized and unrealized gains and losses on the bond portfolio,
amounted to a net expense of DKK 24 million, compared with a net expense of DKK 12 million in the
Page 15
6 February 2013 Corporate Release No 490 page 15 of 25
same period in 2011. The difference was primarily due to a lower cash position in 2012 as well as a
lower payment of interest.
Net exchange gain amounted to DKK 14 million, compared with a net loss of DKK 34 million in the fourth
quarter last year. The increase was primarily due to fluctuations in exchange rate translations of
intercompany balances denominated in USD and GBP and due to currency translation recycled from
Other Comprehensive Income.
Profit and EPS
Profit for the fourth quarter of 2012 was DKK 146 million, compared with DKK 203 million in the same
period last year. Profit for the year was DKK 1,107 million, corresponding to earnings per share (EPS) of
5.65 DKK.
Hedging
Lundbeck hedges expected income from its products through currency hedging on a rolling basis, up to
12 months in advance. As a result of Lundbeck's currency hedging policy, foreign exchange gain and
losses on hedging transactions are allocated directly to the hedged transaction. Hedging had a negative
impact on profit of DKK 12 million in the fourth quarter of 2012, compared to a situation where the
income is not hedged and is included at the current exchange rates during the period. The effect was a
DKK 3 million gain in the fourth quarter of 2011.
Cash flow
Lundbeck had a cash inflow of DKK 288 million, compared with DKK 183 million in 2011. The cash flow
for both years was impacted by milestones related to the Otsuka alliance.
For the fourth quarter, Lundbeck had a cash inflow of DKK 560 million, compared with an outflow of
DKK 755 million in the same period last year.
Cash flow
DKK million Q4 2012 Q4 2011 FY 2012 FY 2011
Cash flows from operating activities 700 255 2,112 3,624
Cash flows from investing activities (138) (1,010) (1,105) (2,695)
Cash flows from operating and investing activities 562 (755) 1,007 929
Cash flows from financing activities (2) - (719) (746)
Change in cash 560 (755) 288 183
2,2 Cash at beginning of period 2,194 3,212 2,467 2,294
Unrealized exchange adjustments for the period (7) 10 (8) (10)
Cash at end of period 2,747 2,467 2,747 2,467
Securities 1,055 1,476 1,055 1,476
Interest-bearing debt (1,909) (1,920) (1,909) (1,920)
Interest-bearing net cash and cash equivalents, end of period 1,893 2,023 1,893 2,023
Page 16
6 February 2013 Corporate Release No 490 page 16 of 25
Operating activities generated a fourth quarter cash inflow of DKK 700 million, compared with an inflow
of DKK 255 million in the same period last year. The increase was primarily due to a favorable change in
net working capital.
Cash flows from investing activities represented an outflow of DKK 138 million compared with DKK
1,010 million in the fourth quarter of 2011. Cash flows from investing activities for the fourth quarter of
2011 was impacted by the upfront payment related to the collaboration with Otsuka.
Cash as of 31 December 2012 was DKK 2,747 million. This compares with DKK 2,467 million as of 31
December 2011. At the end of December 2012, Lundbeck had a net cash position of DKK 1,893 million,
compared with a net cash position of DKK 2,023 million at the end of December 2011.
Balance sheet
As of 31 December 2012, Lundbeck had total assets of DKK 21,563 million, compared with DKK 20,534
million at the end of 2011.
As of 31 December 2012, Lundbeck's equity amounted to DKK 13,198 million, corresponding to a
solvency ratio of 61.2%, compared with 62.2% at the end of 2011.
As a consequence of employees exercising warrants, the share capital increased during the second
quarter of 2012 by DKK 2,965 (or 593 shares of nominally DKK 5). The increase was affected without
any pre-emption rights for the existing shareholders of the company or others. The shares were
subscribed in cash at DKK 102 per share. Proceeds to the company were DKK 60,486. The increase
corresponds to approximately 0.0003% of the company’s share capital. After the increase Lundbeck’s
share capital amounts to DKK 980,682,555.
At the Annual General Meeting in March 2012, the proposed dividend for 2011 of DKK 685 million or
DKK 3.49 per share was approved. The dividend was paid out in April.
General corporate matters
ADR programme
In May, Lundbeck established a sponsored Level I American Depositary Receipt (ADR) programme in
the United States with Deutsche Bank acting as the depositary bank for the programme.
Statement of Objections from the European Commission
In July 2012, the European Commission issued a Statement of Objections to Lundbeck regarding
agreements concluded with four generic competitors concerning citalopram. The Statement of
Objections does not represent the European Commission’s final decision in the matter and any final
decision by the Commission is appealable. It is Lundbeck’s view that the Group’s business practices are
consistent with all relevant national and EU competition legislation.
Page 17
6 February 2013 Corporate Release No 490 page 17 of 25
Incentive plans in the Lundbeck Group
On 1 April 2012, the Executive Management was offered to participate in a one-off Matching Warrant
Programme. Under the Matching Warrant Programme, the CEO is invited to invest up to DKK 10 million
in Lundbeck shares at the current market value, while the non-CEO members are invited to invest up to
DKK 4 million on the same terms. For each share acquired at market value, the Executive Management
member receives four warrants free of charge. The warrants vest after a period of three, four and five
years respectively, provided that employment with the Lundbeck Group is not under notice during this
period.
On 1 April 2012, the Executive Management was invited to participate in a revolving incentive plan in the
form of an equity-based scheme, equal to a maximum value (at the time of grant) of eight months' base
salary.
As part of the future changes to the structure of the long-term incentive programmes the Board of
Directors has resolved, following approval by the annual general meeting, to terminate the 2010 and
2011 long-term incentive programme for the Executive Management. Cash or shares have been
transferred, corresponding to a value of six months' salary for each participant for each programme. As
a result of the changes to the programmes, an expense of DKK 17 million has been recognized in the
income statement.
Furthermore, on 1 April 2012, 104 key employees appointed by Lundbeck’s Executive Management who
are employed by Lundbeck or one of Lundbeck’s subsidiaries were granted participation in Lundbeck’s
long-term incentive programme. The above-mentioned subsidiaries are comprised of Danish and foreign
companies in which Lundbeck directly or indirectly holds at least 50% of the shares. The members of
the company’s Board of Directors are not included in the scheme. The long-term incentive programme
for key employees consists of an equal distribution of shares and warrants.
Stock Appreciation Rights and Restricted Cash Units were issued for key employees in the US
subsidiaries, with conditions and award criteria similar to the grant made to key employees of the parent
company and its non-US subsidiaries.
The long-term incentive programs vest over a three year period, and in the financial statements the cost
will be recognized in the income statement at fair value over the vesting period. The grant is subject to
the achievement of specific market goals that include both financial and strategic targets.
To fund the long-term incentive programme granted in 2009 and the compensation payment to
Executive Management as a result of the termination of the 2010 and 2011 long-term incentive
programs, Lundbeck has purchased treasury shares with a total value of DKK 21 million, which
corresponds to 186,495 shares.
Accounting policies
Lundbeck’s accounting policies are explained in detail in the 2012 annual report also published today.
Purchase of shares for the existing Long-Term Incentive scheme
Page 18
6 February 2013 Corporate Release No 490 page 18 of 25
To finance Lundbeck's Long-Term Incentive scheme (LTI) for the executive management and key
employees in Denmark and abroad, Lundbeck will purchase the necessary 75,018 shares in full
compliance with the existing NASDAQ OMX Copenhagen rules regarding trading with treasury shares
and Lundbeck's internal rules.
The number of treasury shares included in the schemes currently amounts to less than 0.3% of the
share capital per scheme. The purchases to fund the programme will be made immediately after the
announcement of the Annual Report 2012 in order to mirror the final number needed. For the 2014 and
2015 transfer of shares, the corresponding figures are 476,881 and 220,580 shares, which is equal to
approximately DKK 42 million and DKK 20 million at the present share price.
The schemes are charged continuously to the income statement and the purchase of treasury shares
will have no effect on the income statement.
Protection of patents and other intellectual property rights
Intellectual property rights are a prerequisite for Lundbeck’s continued investments in innovative
pharmaceuticals. It is Lundbeck’s policy to enforce its granted intellectual property rights if they are
violated. Lundbeck is involved in a number of trials around the world related to defending intellectual
property rights. With regards to escitalopram, Lundbeck is presently involved in pending court trials in
Australia, Austria, Belgium, Brazil, Canada, Denmark, Greece, Hungary, the Netherlands, Portugal,
Saudi Arabia, Spain, and the UK.
Risk factors
Lundbeck’s overall risk exposure is unchanged and reflects the risk factors described in the annual
report 2012.
Conference call
Today at 2.00 pm (CET), Lundbeck will be hosting a conference call for the financial community. You
can listen to the call online at www.lundbeck.com under the investor section.
Further information
An electronic version of the 2012 annual report and further information about Lundbeck is available from
the company's website www.lundbeck.com. The printed version of the 2012 annual report will be
available on 15 March 2013.
Page 19
6 February 2013 Corporate Release No 490 page 19 of 25
FINANCIAL STATEMENTS
Income statement
2012 2011 2012 2011
DKK million Q4 Q4 FY FY
Revenue 3,845 3,829 14,802 16,007
Cost of sales 854 869 3,325 3,166
Gross profit 2,991 2,960 11,477 12,841
Sales and distribution costs 1,326 1,266 5,274 4,526
Administrative expenses 576 475 1,641 1,602
Research and development costs 867 893 2,915 3,320
Profit from operations 222 326 1,647 3,393
Net financials (13) (42) (65) (96)
Profit before tax 209 284 1,582 3,297
Tax on profit for the period 63 81 475 1,015
Profit for the period 146 203 1,107 2,282
Earnings per share (EPS) (DKK) 0.75 1.03 5.65 11.63
Diluted earnings per share (DEPS) (DKK) 0.75 1.03 5.64 11.63
Statement of comprehensive income
2012 2011 2012 2011
DKK million Q4 Q4 FY FY
Profit for the period 146 203 1,107 2,282
Currency translation, foreign subsidiaries (49) 119 (12) 31
Currency translation concerning additions to net investments in
foreign subsidiaries
(76)
182
(27)
115
Realized exchange gains/losses concerning additions to net
investments in foreign subs. (transferred to the income statement)
(16)
17
(40)
20
Adjustment, deferred exchange gains/losses, hedging 61 (63) (78) 84
Exchange gains/losses, hedging (transferred to the hedged items) 11 8 130 (127)
Exchange gains/losses, trading (transferred from hedging) 1 - 1 -
Fair value adjustment of available-for-sale financial assets (1) 3 (12) (6)
Tax on other comprehensive income 6 (36) 5 (23)
Other comprehensive income (63) 230 (33) 94
Comprehensive income 83 433 1,074 2,376
Page 20
6 February 2013 Corporate Release No 490 page 20 of 25
Balance sheet
DKK million
Assets 31.12.2012 31.12.2011
Intangible assets 9,028 8,445
Property, plant and equipment 2,793 2,814
Financial assets 561 472
Non-current assets 12,382 11,731
Inventories 1,730 1,634
Receivables 3,649 3,226
Securities 1,055 1,476
Cash 2,747 2,467
Current assets 9,181 8,803
Assets 21,563 20,534
Equity and liabilities
Share capital 980 980
Share premium 226 226
Currency translation reserve (211) (149)
Currency hedging reserve 3 (36)
Retained earnings 12,200 11,755
Equity 13,198 12,776
Provisions 1,494 1,155
Debt 1,890 1,907
Non-current liabilities 3,384 3,062
Provisions 375 222
Debt 19 13
Trade payables 1,599 1,526
Other payables 2,909 2,701
Prepayments from Forest 79 234
Current liabilities 4,981 4,696
Liabilities 8,365 7,758
Equity and liabilities 21,563 20,534
Page 21
6 February 2013 Corporate Release No 490 page 21 of 25
Statement of changes in equity at 31 December 2012
Currency Currency
DKK million Share Share translation Hedging Retained
2012 capital premium reserve reserve earnings Equity
Equity at 01.01.2012 980 226 (149) (36) 11,755 12,776
Profit for the period - - - - 1,107 1,107
Other comprehensive income - - (62) 39 (10) (33)
Comprehensive income - - (62) 39 1,097 1,074
Distributed dividends - - - - (685) (685)
Buyback of treasury shares - - - - (21) (21)
Incentive programs - - - - 54 54
Other transactions - - - - (652) (652)
Equity at 31.12.2012 980 226 (211) 3 12,200 13,198
2011
Equity at 01.01.2011 980 224 (281) (4) 10,203 11,122
Profit for the period - - - - 2,282 2,282
Other comprehensive income - - 132 (32) (6) 94
Comprehensive income - - 132 (32) 2,276 2,376
Distributed dividends - - - - (739) (739)
Capital increase through the exercise of
warrants
-
2
-
-
-
2
Buyback of treasury shares - - - - (9) (9)
Incentive programs - - - - 24 24
Other transactions - 2 - - (724) (722)
Equity at 31.12.2011 980 226 (149) (36) 11,755 12,776
Page 22
6 February 2013 Corporate Release No 490 page 22 of 25
Cash flow statement
2012 2011 2012 2011 DKK million
Q4 Q4 FY FY
Profit from operations 222 326 1,647 3,393
Adjustments 156 265 1,118 1,192
Working capital changes 753 104 183 (182)
Cash flows from operations before financial receipts and
payments
1,131
695
2,948
4,403
Financial receipts and payments (4) 14 (53) (35)
Cash flows from ordinary activities 1,127 709 2,895 4,368
Income tax paid (427) (454) (783) (744)
Cash flows from operating activities 700 255 2,112 3,624
Investments in and sale of bonds and other financial assets (6) (14) 527 (1,475)
Investments in and sale of intangible assets and property, plant
and equipment
(132)
(996)
(1,632)
(1,220)
Cash flows from investing activities (138) (1,010) (1,105) (2,695)
Cash flows from operating and investing activities 562 (755) 1,007 929
Dividends paid in the financial year - - (685) (739)
Capital contribution - - - 2
Other financing activities (2) - (34) (9)
Cash flows from financing activities (2) - (719) (746)
Change in cash 560 (755) 288 183
Cash at beginning of period 2,194 3,212 2,467 2,294
Unrealized exchange adjustments for the period (7) 10 (8) (10)
Change for the period 560 (755) 288 183
Cash at end of period 2,747 2,467 2,747 2,467
Interest-bearing net cash and cash equivalents is
composed as follows:
Cash 2,747 2,467 2,747 2,467
Securities 1,055 1,476 1,055 1,476
Interest-bearing debt (1,909) (1,920) (1,909) (1,920)
Interest-bearing net cash and cash equivalents, end of
period
1,893
2,023
1,893
2,023
Page 23
6 February 2013 Corporate Release No 490 page 23 of 25
Restatement of income statement
following change in accounting policy
Q4 2012
Q4 2011
DKK million New policy Adjustment Previous
policy
New policy Adjustment Previous
policy
Revenue 3,845 - 3,845 3,829 - 3,829
Cost of sales 854 - 854 869 - 869
Gross profit 2,991 - 2,991 2,960 - 2,960
Sales and distribution costs 1,326 (175) 1,151 1,266 (142) 1,124
Administrative expenses 576 175 751 475 142 617
Research and development costs 867 - 867 893 - 893
Profit from operations 222 - 222 326 - 326
Net financials (13) - (13) (42) - (42)
Profit before tax 209 - 209 284 - 284
- Tax on profit for the period 63 - 63 81 - 81
Profit for the period 146 - 146 203 - 203
FY 2012
FY 2011
DKK million New policy Adjustment Previous
policy New policy Adjustment Previous
policy
Revenue 14,802 - 14,802 16,007 - 16,007
Cost of sales 3,325 - 3,325 3,166 - 3,166
Gross profit 11,477 - 11,477 12,841 - 12,841
Sales and distribution costs 5,274 (644) 4,630 4,526 (509) 4,017
Administrative expenses 1,641 644 2,285 1,602 509 2,111
Research and development costs 2,915 - 2,915 3,320 - 3,320
Profit from operations 1,647 - 1,647 3,393 - 3,393
Net financials (65) - (65) (96) - (96)
Profit before tax 1,582 - 1,582 3,297 - 3,297
- - Tax on profit for the period 475 - 475 1,015 - 1,015
Profit for the period 1,107 - 1,107 2,282 - 2,282
The change in accounting policies does not have any effect on earnings per share (EPS), diluted
earnings per share (DEPS), the statement of comprehensive income, the balance sheet, the statement
of changes in equity or the cash flow statement.
Page 24
6 February 2013 Corporate Release No 490 page 24 of 25
FINANCIAL CALENDAR
6 February 2013 Deadline for Lundbeck’s receipt of shareholder proposals for the Annual
General Meeting 2013
21 March 2013 Annual General Meeting 2013
27 March 2013 Payment of annual dividend
1 May 2013 First quarter results 2013
7 August 2013 Second quarter results 2013
6 November 2013 Third quarter results 2013
CORPORATE RELEASES SINCE THE PREVIOUS QUARTERLY REPORT
21 December 2012 Otsuka and Lundbeck initiate the regulatory process for aripiprazole (once-
monthly) depot formulation in Europe
19 December 2012 Lundbeck invests significantly in product development and product launches
and has consequently revised its financial plans
14 December 2012 Lundbeck to divest a portfolio of non-core products as part of its strategy to
focus on newer, strategic CNS-products
14 December 2012 Lundbeck receives positive opinion for approval of Selincro (nalmefene) in
the European Union
12 December 2012 FDA accepts Takeda and Lundbeck's filing for review of Brintellix
(vortioxetine) for the treatment of major depression
For more information, please visit www.lundbeck.com under the investor section.
Page 25
6 February 2013 Corporate Release No 490 page 25 of 25
LUNDBECK CONTACTS
Investors: Media:
Palle Holm Olesen Simon Mehl Augustesen
Chief Specialist, Investor Relations International Media Specialist
[email protected] [email protected]
+45 36 43 24 26 +45 36 43 49 80
Magnus Thorstholm Jensen
Investor Relations Officer
[email protected]
+45 36 43 38 16
ABOUT LUNDBECK
Lundbeck is a global pharmaceutical company highly committed to improving the quality of life of people
living with brain diseases. For this purpose, Lundbeck is engaged in the entire value chain throughout
research, development, production, marketing and sales of pharmaceuticals across the world. The
company’s products are targeted at disorders such as depression and anxiety, psychotic disorders,
epilepsy, Huntington’s, Alzheimer’s and Parkinson’s diseases. Lundbeck’s pipeline consists of several
mid- to late- stage development programs.
Lundbeck employs more than 5800 people worldwide, 2,000 of whom are based in Denmark. We have
employees in 57 countries, and our products are registered in more than 100 countries. We have
research centers in Denmark, China and the United States and production facilities in Italy, France,
Mexico, China and Denmark. Lundbeck generated revenue of approximately DKK 15 billion in 2012. For
additional information, we encourage you to visit our corporate site www.lundbeck.com.


![[Product Monograph Template - Standard] - Lundbeck](https://static.documents.pub/doc/80x56/6204ee4b4c89d3190e0ca945/product-monograph-template-standard-lundbeck.jpg)


