How is our environment faring? 6 Water 158 ACT STATE OF THE ENVIRONMENT REPORT 2015 158 6 Water 6.1 Main findings Given water’s central role in society and the environment, and the pressures and challenges facing water supply in the Australian Capital Territory (ACT), it is imperative that we monitor and assess the condition of our water resources so that we can manage them effectively. Overall surface water quality is in a good state and improving relative to the previous reporting period (2007–2011), with appropriate levels of dissolved oxygen, pH, conductivity and phosphorus, faecal coliforms and suspended solids. Turbidity, chlorophyll-a and nitrogen levels are in a poorer state in urban and rural areas, compared with conservation land use areas. However, overall surface water quality has improved in the ACT compared with 2007–2011, probably due to higher rainfall in the current assessment period and effective management practices. It is likely that groundwater availability and quality are good in the ACT, with negative trends unlikely. However, if rainfall decreases or extraction increases, then groundwater availability and possibly quality may also change. Drinking water in the ACT is of very high quality and is consistently within standards described in the Australian Drinking Water Guidelines. The ACT has met its targets regarding environmental flows for its rivers. The indicators of ecological condition of waterways in the ACT are at poor levels. This is partly because sampling mainly occurs in areas heavily affected by urban or rural land use and river regulation. However, it is encouraging that, compared with 2007–2011, the number of sites rated as severely or significantly impaired has declined, and the percentage of sites rated as similar to minimally disturbed reference areas has increased from 24% to 34%. The main pressures on water resources in the ACT are land-use change, climate variability and change, and water resource development. These affect both water availability and water quality. Climate change in particular is expected to have a major impact on water resources in the ACT, exacerbating the existing effects of climate variability. Water managers are well aware of the pressures and, in 2011–2015, major progress was made in increasing the ACT’s water storage capacity and establishing integrated catchment management as a fundamental part of water cycle management in the ACT.
Transcript
158 ACT STATE OF THE ENVIRONMENT REPORT 2015158
How is our environment faring?
6 Water
158 ACT STATE OF THE ENVIRONMENT REPORT 2015158
6 Water
6.1 Main findings
Given water’s central role in society and the environment, and the pressures and challenges facing water supply in the Australian Capital Territory (ACT), it is
imperative that we monitor and assess the condition of our water resources so that we can manage them effectively.
Overall surface water quality is in a good state and improving relative to the previous reporting period (2007–2011), with appropriate levels of dissolved oxygen, pH, conductivity and phosphorus, faecal coliforms and suspended solids. Turbidity, chlorophyll-a and nitrogen levels are in a poorer state in urban and rural areas, compared with conservation land use areas. However, overall surface water quality has improved in the ACT compared with 2007–2011, probably due to higher rainfall in the current assessment period and effective management practices.
It is likely that groundwater availability and quality are good in the ACT, with negative trends unlikely. However, if rainfall decreases or extraction increases, then groundwater availability and possibly quality may also change.
Drinking water in the ACT is of very high quality and is consistently within standards described in the Australian Drinking Water Guidelines.
The ACT has met its targets regarding environmental flows for its rivers.
The indicators of ecological condition of waterways in the ACT are at poor levels. This is partly because sampling mainly occurs in areas heavily affected by urban or rural land use and river regulation. However, it is encouraging that, compared with 2007–2011, the number of sites rated as severely or significantly impaired has declined, and the percentage of sites rated as similar to minimally disturbed reference areas has increased from 24% to 34%.
The main pressures on water resources in the ACT are land-use change, climate variability and change, and water resource development. These affect both water availability and water quality. Climate change in particular is expected to have a major impact on water resources in the ACT, exacerbating the existing effects of climate variability.
Water managers are well aware of the pressures and, in 2011–2015, major progress was made in increasing the ACT’s water storage capacity and establishing integrated catchment management as a fundamental part of water cycle management in the ACT.
How is our environment faring?
159ACT STATE OF THE ENVIRONMENT REPORT 2015
6 Water
In 2011, a review of the 2004 water resource strategy, Think water, act water, found that significant achievements had been made towards the strategy’s objectives, which were focused on:
• increasing the efficiency of water use
• providing long-term reliable sources of water for the ACT and region
• promoting the development and implementation of an integrated approach to ACT – New South Wales cross-border supply and management.
The review found that the strategy had successfully guided the ACT to improved water security, and that it was timely to explore potential new strategies for the ACT’s future water needs.
In August 2014, the new strategy, ACT Water Strategy 2014–44: Striking the Balance, was released. This strategy focuses on achieving healthy catchments and water bodies; a sustainable water supply that is used efficiently; and a community that values and enjoys clean, healthy catchments. For each of these outcomes, the ACT Water Strategy identifies strategies and actions to guide water management in the ACT for the next 30 years. The strategy will be implemented through five-year implementation plans, and effectiveness of implementation will be monitored through identified targets and indicators.
6.2 IntroductionThis chapter assesses the state of the Australian Capital Territory’s (ACT’s) water resources, including trends in the quality and availability of surface water, groundwater and drinking water; and river flow and ecological condition. It also examines the major pressures affecting water in the ACT, such as land use and climate change, and how these pressures affect the ACT’s water.
This chapter will:
• describe the ACT’s water resources
• explain why water is important
• describe indicators used to assess water resource condition
• assess the limitations of current monitoring of water resource condition
• describe the current state of water resources in the ACT
• assess whether the condition of water resources is stable, improving or declining
• describe the pressures on the ACT’s water resources and the impacts these pressures are having
• assess whether the impacts from pressures are stable, increasing or decreasing
• summarise government response mechanisms.
6.2.1 What are the ACT’s water resources?
The ACT draws water from three separate catchments (Figure 6.1):
• the Cotter River Catchment and its three reservoirs: Cotter, Bendora and Corin
• the Queanbeyan River Catchment, which supplies the water held by Googong Dam in New South Wales (NSW)
• the Murrumbidgee River Catchment, via the Cotter Pumping Station and the Murrumbidgee to Googong water transfer.
The Murrumbidgee River is the major river flowing through the ACT, originating in the alpine area to the south of the ACT. All rivers and creeks in the ACT drain to the Murrumbidgee River. The longest of these are the Molonglo and Queanbeyan rivers, which originate to the south-east of the ACT and together drain through Lake Burley Griffin before flowing into the Murrumbidgee River.
How is our environment faring?
160 ACT STATE OF THE ENVIRONMENT REPORT 2015
6 Water
Source: Map provided by Icon Water
Figure 6.1 ACT water supply network
How is our environment faring?
161ACT STATE OF THE ENVIRONMENT REPORT 2015
6 Water
In urban areas, there are numerous constructed lakes and wetlands, as well as natural wetlands, including Horse Park Wetlands in Gungahlin and wetlands in conservation areas in the southern half of the ACT. There are also groundwater aquifers that store and discharge water into water bodies throughout the ACT.
6.2.2 Why is water important?Water underpins almost every aspect of life and is a vital component of the households, landscapes and urban environments of the ACT. Without enough clean water, people could go without drinking water,1 agricultural productivity could be jeopardised,2 and ecosystems could become degraded.3
Water is both a local issue and one that connects us to the global hydrological cycle. Global climate change has already affected the water cycle and is likely to affect rainfall in our region. Since the mid-1990s, late autumn and early winter rainfall has declined in south-east Australia, and it is predicted that the region will become hotter and drier in the future4-6 (see Chapter 2).
Given water’s central role in society and the environment, and the pressures and challenges facing water supply in the ACT, it is imperative that we monitor and assess the condition of our water resources so that we can manage them effectively.
Water and human wellbeing
Human wellbeing is closely tied to the availability of clean and abundant water. Water makes up around 70% of the human body and plays an essential role in biological processes.
Water is also an important component of our urban environment. Canberra’s lakes, ponds and constructed wetlands improve biodiversity, aesthetics, heat mitigation and recreational opportunities – thereby supporting human wellbeing. The many water resources in the ACT also support a range of recreational uses, as well as urban and rural activities. Water is also vital in the maintenance of sporting ovals and other green areas that contribute to the fitness, health and social wellbeing of ACT residents (see Johnstone et al7).
Production of the food and fibre that we depend on also relies on water. The ACT is located in the
south-east of the Murray–Darling Basin, one of the most important agricultural regions in the country. In 2012–13, the basin accounted for more than 70% of water used in agriculture nationally.8 The region produces more than half of Australia’s irrigated agriculture, worth $6.8 billion in 2012–13.
The effect of droughts and prolonged dry periods demonstrates our dependence on water, and how individuals, communities and economies suffer when water is in short supply. For instance, as a result of the 2002–03 drought, farm gross domestic product and rural exports dropped by around one-quarter, agricultural income fell by 46% and around 100 000 jobs were lost.9 Droughts also affect ecosystems and, ultimately, human wellbeing. For example, reduced volumes of water and higher temperatures in water bodies, rivers and streams can decrease water quality and increase the risk of algal blooms – with negative consequences for fish, stock and domestic animals, and people. Extended dry conditions can also result in habitat loss on the edges of water systems and depleted biodiversity in floodplain rivers.
Ecosystem services
The water cycle plays an integral part in the planet’s climate, chemistry and biology.1 The water cycle connects water bodies, land, biodiversity and the atmosphere through the stages of precipitation, infiltration, run-off, evaporation and transpiration. Without a functioning water cycle, many of the natural processes that enable and support life would cease to operate.
Water both provides ecosystem services and is affected by other ecosystem services. Healthy soils, terrestrial environments and aquatic ecosystems help to filter and purify water after it falls as rain and snow, before it flows into our rivers and streams, and before it is collected and distributed for human use. The quality of water can decline significantly when it passes though ecosystems and soils that have been degraded by poor management, or disturbed by events such as fire.10-13
We never know the worth of water till the well is dry.-Thomas Fuller
How is our environment faring?
162 ACT STATE OF THE ENVIRONMENT REPORT 2015
6 Water
6.2.3 How do we measure water resources?
The condition of water resources in the ACT is influenced by the different ways in which water is used, and by surrounding land use. Different land uses have different effects on water quality (eg different rates of soil erosion and sediment transport occur in areas with different land uses) and hydrology (eg impervious surfaces in urban areas increase stormwater run-off and locally reduce groundwater recharge).
There are five major land uses in the ACT (Figure 6.2). Each land-use group affects water quality differently:
• Conservation and natural environments tend to have a minimal negative impact on water quality in normal circumstances.
• Production from dryland agriculture and plantations, irrigated agriculture and plantations, and natural environments can have significant impacts on surface water and groundwater. For example, some rural activities that clear vegetation may result in soil erosion. On-farm water retention may reduce surface water in creek lines and locally deplete groundwater. There is potential for the release of agricultural chemicals and animal waste, which may add to the nutrient load of waterways. In addition, run-off following storms may have negative effects on local water quality (eg as fine sediment inputs).13
• Intensive land uses (eg urban areas) have the greatest potential for negative impact on local water quality. Fertilisers and other chemicals, organic matter, soil, oil or sewage effluent entering waterways can negatively affect the health of our freshwater environments. Urban development modifies natural drainage lines and riparian areas, and impervious surfaces alter the flow of water across urban areas. Changes can markedly reduce biodiversity, and promote conditions suitable for undesirable aquatic weeds and nuisance algae. However, water-sensitive urban design measures can ameliorate the impact of urban development on water quality and flows.
To assess how water resources in the ACT are responding to pressures from land use, climate and water resource development, we examined a range of water-related indicators that reflect the amount, quality and ecological condition of waters in the ACT.
Data on these indicators are collected at different places and times throughout the Territory to help us understand the current condition (state) of water resources in the ACT and how their condition is changing over time (trend).
The Driver–Pressure–State–Impact–Responsemodel as used in the ACT State of the Environment Report
Land
Air
cause/in�uence
Drivers
Pressures
Impacts
Responses
identify issues of concern
in�uence the relations between humans and the environment
Water
forState/trends
in�uence/modify
Biodiversity
Heritage
address aspects of concern
(�ora and fauna)
(direct and indirect)
emissions to the airshed
climate variability and change
pest species
altered �re regimes
environmental o�sets
land-use change
Surface water quality
Drinking water quality
River �ow
River condition
Groundwater quality and availability
water resource development
How is our environment faring?
163ACT STATE OF THE ENVIRONMENT REPORT 2015
6 Water
0 12 24 km
Land-use typeConservation and natural environments Production from relatively natural environmentsProduction from dryland agriculture and plantations Production from irrigated agriculture and plantationsIntensive usesWater
CREEKCREEKCREEKCREEKCREEKCREEKCREEKCREEKYA
SS RIV
ER
GO
OD
RAD
IGB
EE R
IVER
QUEANBEYAN RIVER
MU
RR
UM
BID
GE
E R
IVER
CO
TTER R
IVERC
OO
MA
CR
EEK
BREDBO RIVER
NA
AS
RIV
ER
RO
CK
FLA
T C
REE
K
BIG B
ADJA R
IVER
MO
LON
GLO
RIV
ER
NAAS CREEK
MICALO
NG CREEK
BRIDLE C
REEK
BAC
K C
REE
K
RYRIES CREEKGOODA CREEK
ORRORAL RIVER
DERRIN
GULLEN
BU
RR
A C
REE
K
BRAM
INA
CREE
K
TINPOT CREEK
GU
ISES
CR
EEK
DAIRY CREEKFL
EA
CR
EEK
KY
DR
A C
RE
EK
MU
RR
UM
BU
CC
A C
REE
K
TINDER
RY C
REEK
FAR
M C
REE
K
MIDDLE CREEK
OAKY CREEK REED
Y CR
EEK
JONES CREEK
LOC
KER
CR
EEK
ANTILLS
CR
EEK
TOM
GR
OG
GIN
S CR
EEK
BRADLEYS CREEK
KIN
GS
CR
EEK
JAG
O C
REE
K
SNOWY CREEK
BACK
CR
EEK
CREE
K
GOOGONG DAM
CO DAM
LAKE URLE GRIF N
BEND A DAM
LAKE GINNINDERRA
CO AM
BURRINJUCK AM D
RIN
B Y FI
OR
LAKE UGGE NONG
TTER D
T RA
TANTANGARA DAM
Source: Based on data sourced from the ACT Government for Dyer et al14
Figure 6.2 Upper Murrumbidgee Catchment (including the ACT) waterways and land uses
How is our environment faring?
164 ACT STATE OF THE ENVIRONMENT REPORT 2015
6 Water
6.3 Indicators6.3.1 State and trends Water supply for people is not just about natural systems. The water resource system in the ACT, as elsewhere, is made up of many interacting elements related to the environment, technology and social systems. So when thinking about water in the ACT, it is important to consider all these various aspects, including the water catchments and dams, the physical infrastructure for pumping and distributing water, the monitoring processes that maintain high water quality, and the policies that surround water management.
Drawing on research and data from monitoring, in this chapter we assess the state and trend of water resources in the ACT. Our knowledge of the current state of water resources in the ACT is derived from a range of sources, including detailed scientific studies on hydrology and specific ecological communities (eg CSIRO15 and Dyer et al14), and data from the ACT Government and Icon Water monitoring stations, which provide information on the quantity and quality of water.
The following sections describe the importance of each indicator, and current state and trends in the ACT. For each indicator, we also provide an assessment that summarises its state and trend during 2011–2015 compared with the previous State of the Environment Report (2007–2011). For each indicator, the report card includes an assessment of the confidence in the state and trend. Generally, there will be high confidence for indicators for which regular monitoring is carried out, as there is often a good spatial and temporal coverage of data to assess states and trends. Conversely, for indicators with no or little data, only a qualitative valuation of state and trend is possible, and so there will often be less confidence in this assessment.
Surface water quality
Why is this indicator important?
Unpolluted surface waters are critical for a range of social, economic and environmental needs. Poor water quality can lead to human illnesses,16 cause the closure of recreational water bodies and make habitat unsuitable for water-dependent species.17 Various economic activities are also highly dependent on unpolluted surface water (eg irrigated agriculture and recreational activities). As such, monitoring and managing surface water quality are important for ensuring the future sustainability of the ACT.
Current monitoring status and interpretation issues
In the ACT, water quality is regularly assessed and compared against regulatory guideline standards by the ACT Government, Icon Water and community groups (eg ACT Waterwatch). The regulatory guidelines have been designed to help ensure that ecosystems are protected while allowing for economic and social development. The guidelines provide a value for nine indicators to enable managers to identify when water quality is a management concern (Table 6.1). Actions must be put in place to avoid the consequences of exceeding the indicator value.
In this section, we examine the state and trends of the nine indicators for water quality in the ACT. We use data from long-term sites that have been strategically placed to monitor water quality in the ACT and surrounding Upper Murrumbidgee Catchment in areas influenced by land use (eg urban and rural) and water regulation. Measurements are collected as a part of ACT Government and Icon Water monitoring programs, which means that the majority of sites aim to assess the effects of urban and rural land use, the Lower Molonglo Water Quality Control Centre and river regulation; a few sites are in conservation land-use areas in the southern half of the ACT.
How is our environment faring?
165ACT STATE OF THE ENVIRONMENT REPORT 2015
6 Water
Table 6.1 Water quality guideline levels
Indicator Unit Guideline levelSources of water quality change
Consequences of exceeding guideline level
Conductivity µS/cm <350 Salts in rock and groundwater, sewage treatment plants
Salinity or corrosion problems where water is used
pH pH units 6–9 Catchment geology and land-use disturbances
Changes to biodynamics may release toxic metals
Dissolved oxygen
mg/L >4 Normal plant (including algal) activity and physical exchange with atmosphere through wind and water movement
Biological stress, with fish kills being the worst outcome
Turbidity NTU <10 Soil erosion by storm damage or human activity
Modification of biological light regime, poor aesthetics
Total phosphorus
mg/L <0.1 Soil erosion, urban run-off High total phosphorus, turbidity and water temperature, and low flow may lead to blue–green algae blooms
cfu/mL = colony-forming units per millilitre; µg/L = micrograms per litre; µS/cm = microsiemens per centimetre; mg/L = milligrams per litre; NTU = nephelometric turbidity unitsSources: For pH, dissolved oxygen, turbidity, total phosphorus, suspended solids, faecal coliforms and chlorophyll-a, Environment Protection
Regulation 200518; for conductivity and total nitrogen, Australian and New Zealand Environment and Conservation Council;19 and for sources of water quality change and consequences of exceeding the guideline for each indicator, adapted from the ACT Government20
How is our environment faring?
166 ACT STATE OF THE ENVIRONMENT REPORT 2015
6 Water
What does this indicator tell us?
Overall water quality in the ACT is good and has improved compared with 2007–2011, and there have been no negative trends in any water quality indicators, although some results are poor:
• Dissolved oxygen (DO) and pH measures are very good.
• Overall conductivity levels are good, but some sites show high levels.
• Overall turbidity levels are poor. Some sites have persistently poor turbidity and are always above guideline levels – this is likely a result of localised soil erosion and broader land clearing.
• Overall chlorophyll-a levels are poor. High levels of chlorophyll-a are likely from nutrient inputs from urban and rural areas, which result in active algae growth.
• Total phosphorus levels are in a very good state. Total phosphorus exceeded guideline concentrations more regularly in urban and rural areas in the northern half of the ACT, likely because of soil erosion from cleared land.
• Total nitrogen levels are in a very poor state. Inputs from fertilisers and other pollutants high in nitrogen from urban and rural areas are likely the cause of this.
There have been moderate improvements (ie a decrease in how often the guideline levels are exceeded) in turbidity, total phosphorus, total nitrogen, suspended solids, faecal coliforms and chlorophyll-a. This is encouraging (particularly for indicators currently in a poor or very poor state), and is likely the result of higher rainfall in the current assessment period and effective management practices.
Further details for each indicator are provided in the following sections.
Conductivity
Conductivity is the ability of electricity to pass through water and is a measure of the salts present in a water body. Urban run-off can be high in salts because many cleaning agents, fertilisers and surfaces (eg paint, concrete, road) contain salts, which are washed into streams during rainfall. Salts can also come from naturally occurring minerals in soils, and be mobilised by erosion and groundwater seepages during periods of drought.20
In 2011–2015, 758 conductivity measurements were made across 82 sites in the ACT and surrounding Upper Murrumbidgee Catchment (Figure 6.3).
How is our environment faring?
167ACT STATE OF THE ENVIRONMENT REPORT 2015
6 Water
0 12 24 km
N
Canberra
Percentage of measurements outside guideline
0
0–25
25–50
50–75
75–100
Note: See Table 6.1 for guideline levels.
Figure 6.3 Monitoring sites in the ACT and surrounding Upper Murrumbidgee Catchment, and how frequently conductivity levels were outside the guideline level, 2011–2015
How is our environment faring?
168 ACT STATE OF THE ENVIRONMENT REPORT 2015
6 Water
Conductivity levels exceeded guideline levels at several monitoring sites. The sites with the most guideline exceedances were located in areas influenced by urban land use (eg Yarralumla Creek, Jerrabomberra Creek, Molonglo River) or by geological features (eg Burra Creek upstream of Googong Dam). In 2011–2015, 9.5% of samples exceeded the guideline level for electrical conductivity, and there has been little change since 2007–2011 (Figure 6.4).
pH
pH refers to the degree of acidity or alkalinity of the water. A pH of 7 is neutral, a pH above 7 indicates that the water is alkaline, and a pH below 7 indicates that the water is acidic. If the pH of the water is altered substantially, there could be changes to chemical processes, which could release nutrients or toxic metals that were previously safely bound in lake or river sediments.20
In 2011–2015, 758 pH measurements were made across 82 sites in the ACT and surrounding Upper Murrumbidgee Catchment (Figure 6.5).
Per
cent
age
of s
ampl
es
0
10
20
30
40
50
60
70
80
90
100
Previous assessment period (2007–2011)
9.9
90.1
9.5
90.5
Outsideguideline
Withinguideline
Outsideguideline
Withinguideline
Current assessment period (2011–2015)
Note: See Table 6.1 for guideline levels.
Figure 6.4 Percentage of ACT water conductivity measurements outside the guideline level, 2007–2011 and 2011–2015
How is our environment faring?
169ACT STATE OF THE ENVIRONMENT REPORT 2015
6 Water
0 12 24 km
N
Canberra
Percentage of measurements outside guideline
0
0–25
25–50
50–75
75–100
Note: See Table 6.1 for guideline levels.
Figure 6.5 Monitoring sites in the ACT and surrounding Upper Murrumbidgee Catchment, and how frequently pH levels were outside the guideline level, 2011–2015
How is our environment faring?
170 ACT STATE OF THE ENVIRONMENT REPORT 2015
6 Water
Monitoring sites have recorded values outside of the 6.5–9 pH guideline range only infrequently. In 2011–2015, only 2% of samples were outside the pH guideline range, and there has been little change since 2007–2011 (Figure 6.6).
Dissolved oxygen
DO is a measure of the oxygen in the water. It is important for the maintenance of aquatic organisms; low DO levels can stress fish, which can lead to fungal infections and disease, or result directly in fish kills.21 DO concentrations are affected by turbulence, temperature (colder water can hold more dissolved oxygen), photosynthesis (during periods of sunlight,
algae and other water plants produce oxygen, while in darkness they consume oxygen) and the level of biological oxygen demand.20
In 2011–2015, 666 DO measurements were made across 82 sites in the ACT and surrounding Upper Murrumbidgee Catchment (Figure 6.7). It should be noted that DO varies throughout the day and the point sample measurements shown here will be influenced by the time of day the measurement was taken. DO should be measured during a 24-hour period to give an accurate indication of DO fluctuations in a water body. Nevertheless, the measurements presented here still give an indication of DO concentrations in water bodies throughout the ACT.
0
10
20
30
40
50
60
70
80
90
100
Per
cent
age
of s
ampl
es
Outsideguideline
Withinguideline
Outsideguideline
Withinguideline
2.0
98.0
1.9
98.1
Previous assessment period (2007–2011) Current assessment period (2011–2015)
Note: See Table 6.1 for guideline levels.
Figure 6.6 Percentage of ACT water pH measurements outside the guideline level, 2007–2011 and 2011–2015
How is our environment faring?
171ACT STATE OF THE ENVIRONMENT REPORT 2015
6 Water
0 12 24 km
N
Canberra
Percentage of measurements outside guideline
0
0–25
25–50
50–75
75–100
Note: See Table 6.1 for guideline levels.
Figure 6.7 Monitoring sites in the ACT and surrounding Upper Murrumbidgee Catchment, and how frequently dissolved oxygen concentrations were outside the guideline level, 2011–2015
How is our environment faring?
172 ACT STATE OF THE ENVIRONMENT REPORT 2015
6 Water
Only 0.4% of DO samples were below the guideline levels, and there has been little change since 2007–2011 (Figure 6.8).
Turbidity
Turbidity of a water body is related to the concentration of suspended solids, but also includes colouration. A stream may have very low levels of suspended material, but be strongly coloured – for example, the tannin-rich streams in Namadgi National Park. Canberra has soils with very fine clay particles that can
cause high turbidity levels. The small clay particles remain suspended in the water long after the heavier sediments have settled on the bottom.20 Turbidity determines the depth to which light penetrates the water, an important ecological phenomenon that affects plant growth and changes the kinds of algae present.
In 2011–2015, 757 turbidity measurements were made across 82 sites, including a wide range of freshwater habitats in the ACT and surrounding Upper Murrumbidgee Catchment (Figure 6.9).
0
10
20
30
40
50
60
70
80
90
100
1.7
98.3
0.4
99.6
Previous assessment period (2007–2011) Current assessment period (2011–2015)
Per
cent
age
of s
ampl
es
Outsideguideline
Withinguideline
Outsideguideline
Withinguideline
Note: See Table 6.1 for guideline levels.
Figure 6.8 Percentage of ACT water dissolved oxygen measurements outside the guideline level, 2007–2011 and 2011–2015
How is our environment faring?
173ACT STATE OF THE ENVIRONMENT REPORT 2015
6 Water
0 12 24 km
N
Canberra
Percentage of measurements outside guideline
0
0–25
25–50
50–75
75–100
Note: See Table 6.1 for guideline levels.
Figure 6.9 Monitoring sites in the ACT and surrounding Upper Murrumbidgee Catchment, and how frequently turbidity levels were outside the guideline level, 2011–2015
How is our environment faring?
174 ACT STATE OF THE ENVIRONMENT REPORT 2015
6 Water
Turbidity is high across many monitoring sites in the ACT. In 2011–2015, 40% of samples exceeded the turbidity guideline level; turbidity levels were higher in areas with more cleared land and soil erosion (eg urban and rural areas in the northern half of the ACT). However, the percentage of samples outside the guideline level has declined from 51.2% to 40.1% since 2007–2011 (Figure 6.10).
Turbidity can also change after weather events, such as bushfires (see Case study 6.1).
0
10
20
30
40
50
60
70
80
90
100
51.2 48.8
40.1
59.9
Previous assessment period (2007–2011) Current assessment period (2011–2015)
Per
cent
age
of s
ampl
es
Outsideguideline
Withinguideline
Outsideguideline
Withinguideline
Note: See Table 6.1 for guideline levels.
Figure 6.10 Percentage of ACT water turbidity measurements outside the guideline level, 2007–2011 and 2011–2015
How is our environment faring?
175ACT STATE OF THE ENVIRONMENT REPORT 2015
6 Water
Total phosphorus
Total phosphorus is the sum of dissolved and particulate phosphorus in the water. Phosphorus is bound within sediment particles, which means that the movement of phosphorus through the landscape and waterways is closely linked to soil erosion and sediment transport dynamics.20 A water body’s total
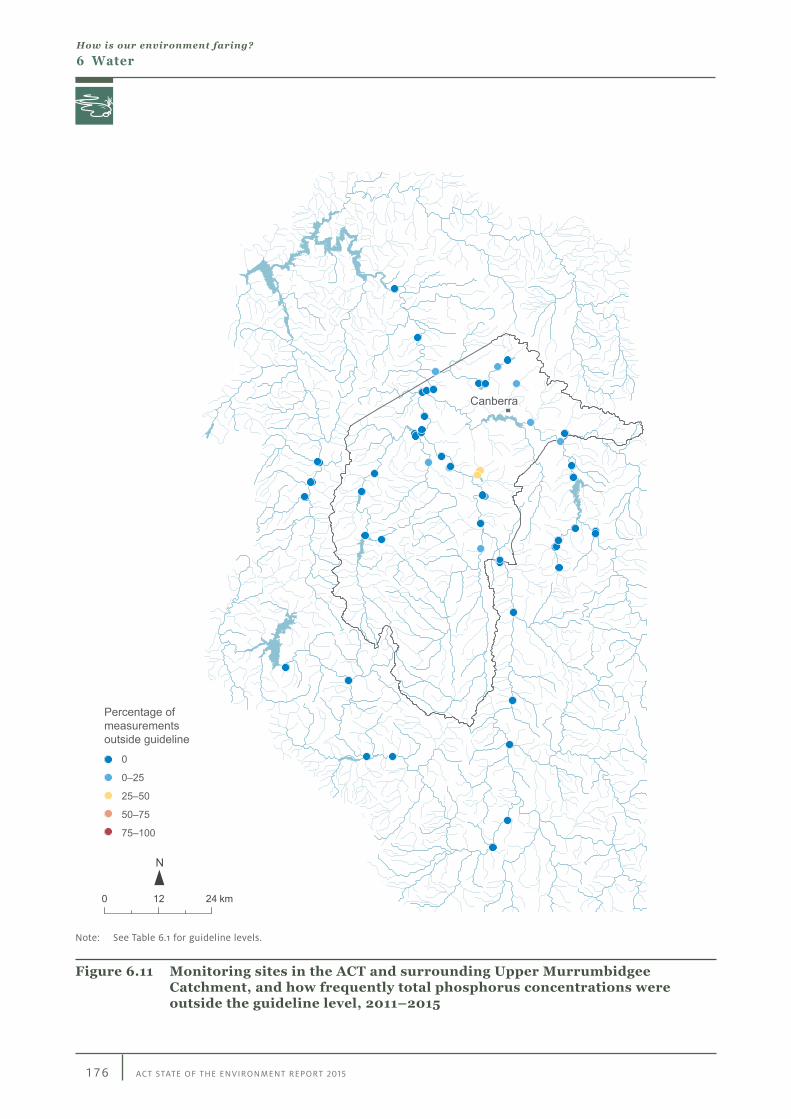
In 2011–2015, 565 total phosphorus measurements were made across 61 sites, including a wide range of freshwater habitats in the ACT and surrounding Upper Murrumbidgee Catchment (Figure 6.11).
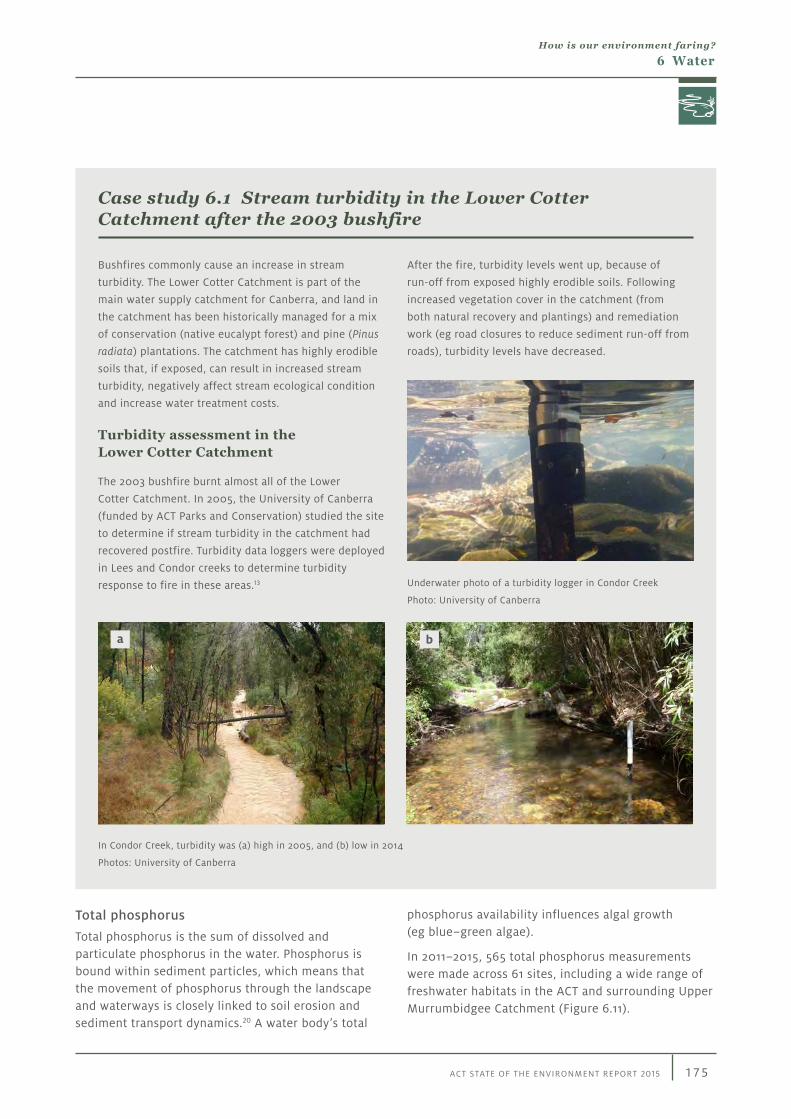
Case study 6.1 Stream turbidity in the Lower Cotter Catchment after the 2003 bushfire
Bushfires commonly cause an increase in stream
turbidity. The Lower Cotter Catchment is part of the
main water supply catchment for Canberra, and land in
the catchment has been historically managed for a mix
of conservation (native eucalypt forest) and pine (Pinus
radiata) plantations. The catchment has highly erodible
soils that, if exposed, can result in increased stream
Turbidity assessment in the Lower Cotter Catchment
The 2003 bushfire burnt almost all of the Lower
Cotter Catchment. In 2005, the University of Canberra
(funded by ACT Parks and Conservation) studied the site
to determine if stream turbidity in the catchment had
recovered postfire. Turbidity data loggers were deployed
in Lees and Condor creeks to determine turbidity
response to fire in these areas.13
After the fire, turbidity levels went up, because of
run-off from exposed highly erodible soils. Following
increased vegetation cover in the catchment (from
both natural recovery and plantings) and remediation
work (eg road closures to reduce sediment run-off from
roads), turbidity levels have decreased.
Underwater photo of a turbidity logger in Condor Creek
Photo: University of Canberra
In Condor Creek, turbidity was (a) high in 2005, and (b) low in 2014
Photos: University of Canberra
a b
How is our environment faring?
176 ACT STATE OF THE ENVIRONMENT REPORT 2015
6 Water
0 12 24 km
N
Canberra
Percentage of measurements outside guideline
0
0–25
25–50
50–75
75–100
Note: See Table 6.1 for guideline levels.
Figure 6.11 Monitoring sites in the ACT and surrounding Upper Murrumbidgee Catchment, and how frequently total phosphorus concentrations were outside the guideline level, 2011–2015
How is our environment faring?
177ACT STATE OF THE ENVIRONMENT REPORT 2015
6 Water
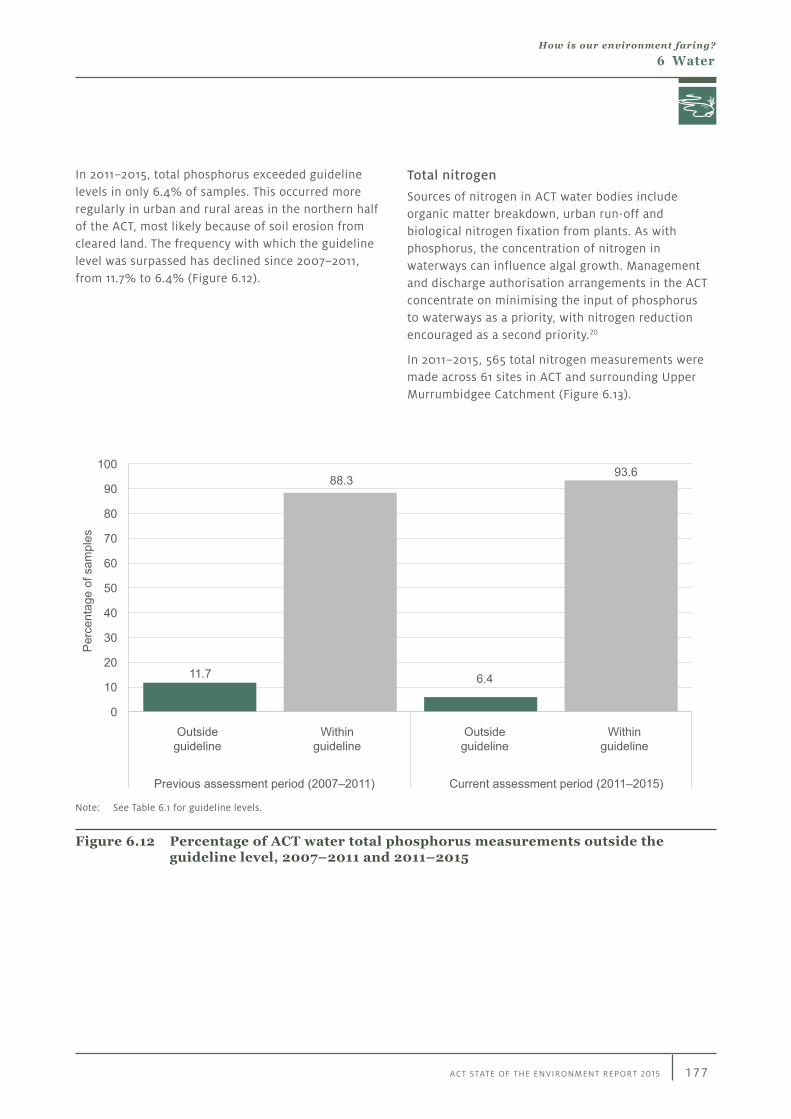
In 2011–2015, total phosphorus exceeded guideline levels in only 6.4% of samples. This occurred more regularly in urban and rural areas in the northern half of the ACT, most likely because of soil erosion from cleared land. The frequency with which the guideline level was surpassed has declined since 2007–2011, from 11.7% to 6.4% (Figure 6.12).
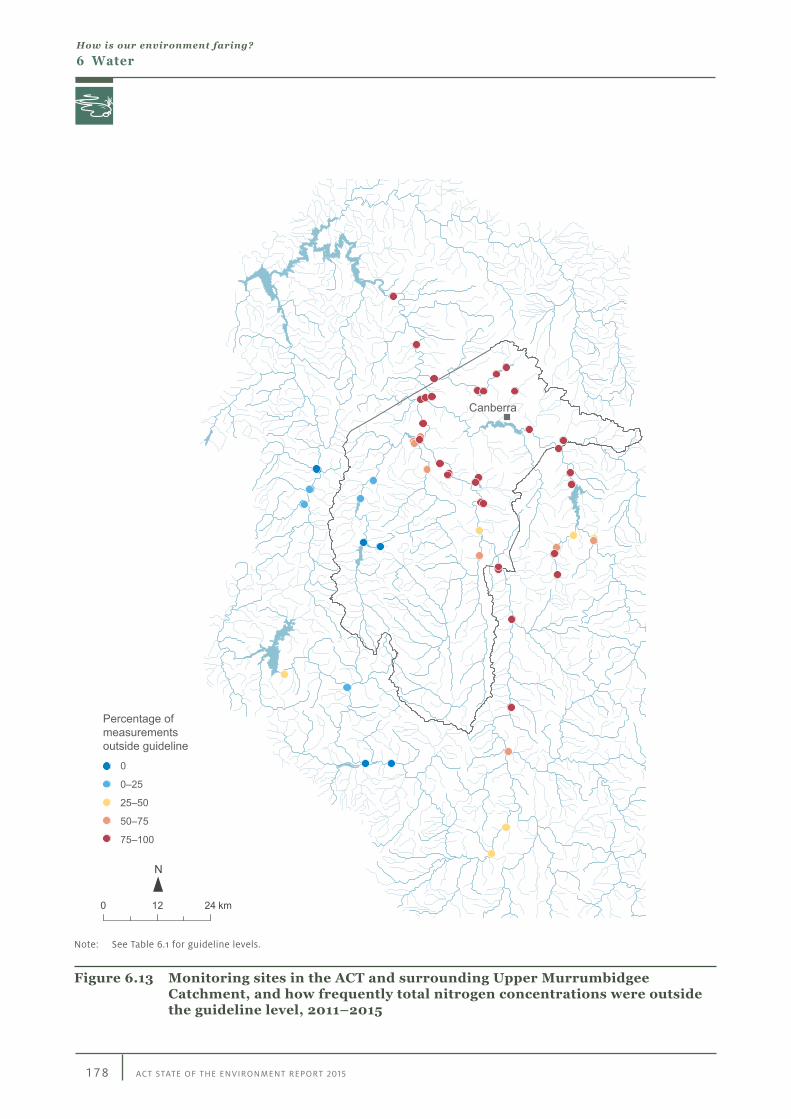
Total nitrogen
Sources of nitrogen in ACT water bodies include organic matter breakdown, urban run-off and biological nitrogen fixation from plants. As with phosphorus, the concentration of nitrogen in waterways can influence algal growth. Management and discharge authorisation arrangements in the ACT concentrate on minimising the input of phosphorus to waterways as a priority, with nitrogen reduction encouraged as a second priority.20
In 2011–2015, 565 total nitrogen measurements were made across 61 sites in ACT and surrounding Upper Murrumbidgee Catchment (Figure 6.13).
0
10
20
30
40
50
60
70
80
90
100
11.7
88.3
6.4
93.6
Previous assessment period (2007–2011) Current assessment period (2011–2015)
Per
cent
age
of s
ampl
es
Outsideguideline
Withinguideline
Outsideguideline
Withinguideline
Note: See Table 6.1 for guideline levels.
Figure 6.12 Percentage of ACT water total phosphorus measurements outside the guideline level, 2007–2011 and 2011–2015
How is our environment faring?
178 ACT STATE OF THE ENVIRONMENT REPORT 2015
6 Water
0 12 24 km
N
Canberra
Percentage of measurements outside guideline
0
0–25
25–50
50–75
75–100
Note: See Table 6.1 for guideline levels.
Figure 6.13 Monitoring sites in the ACT and surrounding Upper Murrumbidgee Catchment, and how frequently total nitrogen concentrations were outside the guideline level, 2011–2015
How is our environment faring?
179ACT STATE OF THE ENVIRONMENT REPORT 2015
6 Water
Total nitrogen guideline levels were frequently exceeded in 2011–2015, especially in rural and urban areas in the northern half of the ACT, possibly because of fertilisers and other pollutants high in nitrogen. Approximately 77% of samples exceeded the total nitrogen guideline level. This high level is, however, an improvement compared with the 83.4% of samples that were outside the guideline level in 2007–2011 (Figure 6.14).
When interpreting the total nitrogen results in the ACT, it is important to note that a generic upland region guideline value from the Australia and New Zealand Environment and Conservation Council (ANZECC) National Water Quality Management Strategy: Australian and New Zealand Guidelines for Fresh and Marine Water Quality is being used. Using values from this guideline for transition zones of the ACT, which contain both upland and lowland regions, may result in a high level of samples outside the ANZECC guideline because upland values may not be appropriate for the whole of the ACT. Nitrogen guideline levels specific for the ACT environment may need to be developed to prevent this measurement problem from continuing.
Suspended solids
All water bodies naturally carry some suspended material as organic and inorganic particles. Many land uses and activities have the potential to increase the concentrations of suspended solids in streams, which can have two major impacts on aquatic ecosystems.
Firstly, higher concentrations of suspended solids reduce light penetration into water bodies, slowing plant growth and changing the kinds of algae present. Secondly, larger amounts of suspended solids ultimately result in increased sedimentation, which may smother habitats for bottom-dwelling organisms, while increasing the potential for elevated phosphorus levels.20
In 2011–2015, 408 suspended solids measurements were made across 45 sites in the ACT and surrounding Upper Murrumbidgee Catchment (Figure 6.15).
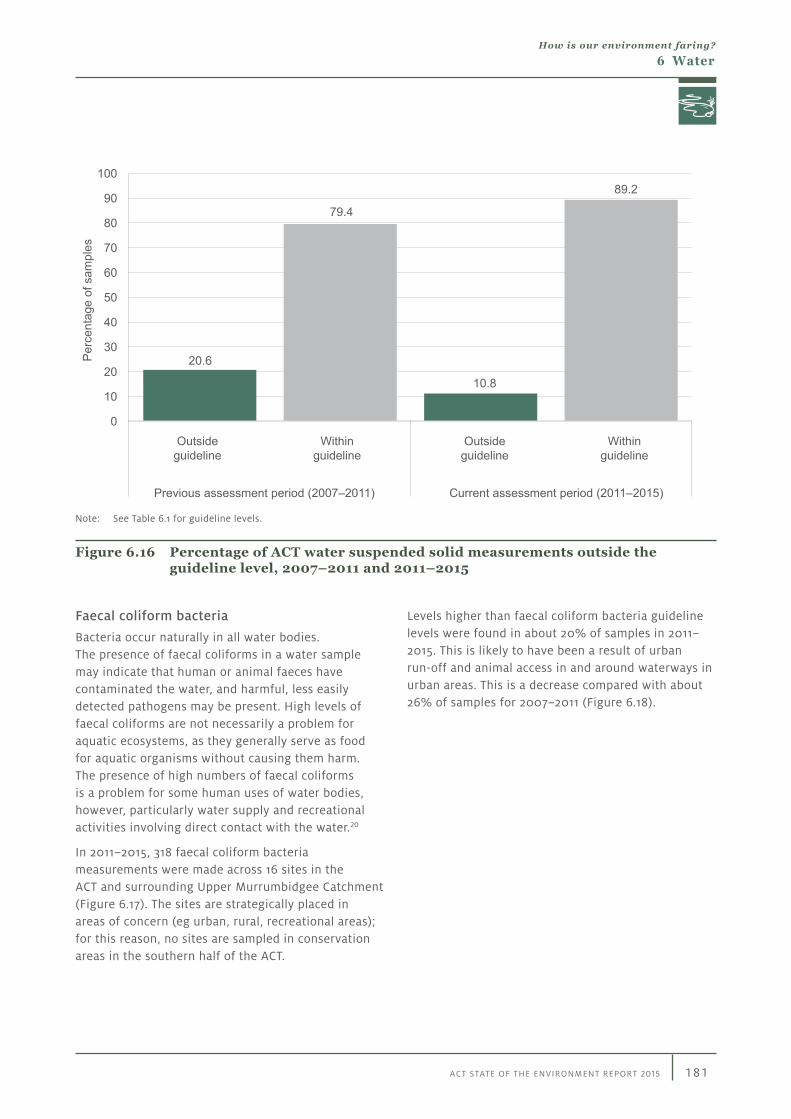
Suspended solids exceeded guideline levels in approximately 11% of samples in 2011–2015. Exceedances occurred in urban and rural areas in the northern half of the ACT because of inputs from soil erosion. This is a decrease compared with 20.6% in 2007–2011 (Figure 6.16).
0
10
20
30
40
50
60
70
80
90
100
83.4
16.6
77.2
22.8
Previous assessment period (2007–2011) Current assessment period (2011–2015)
Per
cent
age
of s
ampl
es
Outsideguideline
Withinguideline
Outsideguideline
Withinguideline
Note: See Table 6.1 for guideline levels.
Figure 6.14 Percentage of ACT water total nitrogen measurements outside the guideline level, 2007–2011 and 2011–2015
How is our environment faring?
180 ACT STATE OF THE ENVIRONMENT REPORT 2015
6 Water
0 12 24 km
N
Canberra
Percentage of measurements outside guideline
0
0–25
25–50
50–75
75–100
Note: See Table 6.1 for guideline levels.
Figure 6.15 Monitoring sites in the ACT and surrounding Upper Murrumbidgee Catchment, and how frequently suspended solid concentrations were outside the guideline level, 2011–2015
How is our environment faring?
181ACT STATE OF THE ENVIRONMENT REPORT 2015
6 Water
0
10
20
30
40
50
60
70
80
90
100
79.4
89.2
Previous assessment period (2007–2011) Current assessment period (2011–2015)
Per
cent
age
of s
ampl
es
Outsideguideline
Withinguideline
Outsideguideline
Withinguideline
20.6
10.8
Note: See Table 6.1 for guideline levels.
Figure 6.16 Percentage of ACT water suspended solid measurements outside the guideline level, 2007–2011 and 2011–2015
Faecal coliform bacteria
Bacteria occur naturally in all water bodies. The presence of faecal coliforms in a water sample may indicate that human or animal faeces have contaminated the water, and harmful, less easily detected pathogens may be present. High levels of faecal coliforms are not necessarily a problem for aquatic ecosystems, as they generally serve as food for aquatic organisms without causing them harm. The presence of high numbers of faecal coliforms is a problem for some human uses of water bodies, however, particularly water supply and recreational activities involving direct contact with the water.20
In 2011–2015, 318 faecal coliform bacteria measurements were made across 16 sites in the ACT and surrounding Upper Murrumbidgee Catchment (Figure 6.17). The sites are strategically placed in areas of concern (eg urban, rural, recreational areas); for this reason, no sites are sampled in conservation areas in the southern half of the ACT.
Levels higher than faecal coliform bacteria guideline levels were found in about 20% of samples in 2011–2015. This is likely to have been a result of urban run-off and animal access in and around waterways in urban areas. This is a decrease compared with about 26% of samples for 2007–2011 (Figure 6.18).
How is our environment faring?
182 ACT STATE OF THE ENVIRONMENT REPORT 2015
6 Water
0 12 24 km
N
Canberra
Percentage of measurements outside guideline
0
0–25
25–50
50–75
75–100
Note: See Table 6.1 for guideline levels.
Figure 6.17 Monitoring sites in the ACT and surrounding Upper Murrumbidgee Catchment, and how frequently faecal coliform concentrations were outside the guideline level, 2011–2015
How is our environment faring?
183ACT STATE OF THE ENVIRONMENT REPORT 2015
6 Water
Previous assessment period (2007–2011)
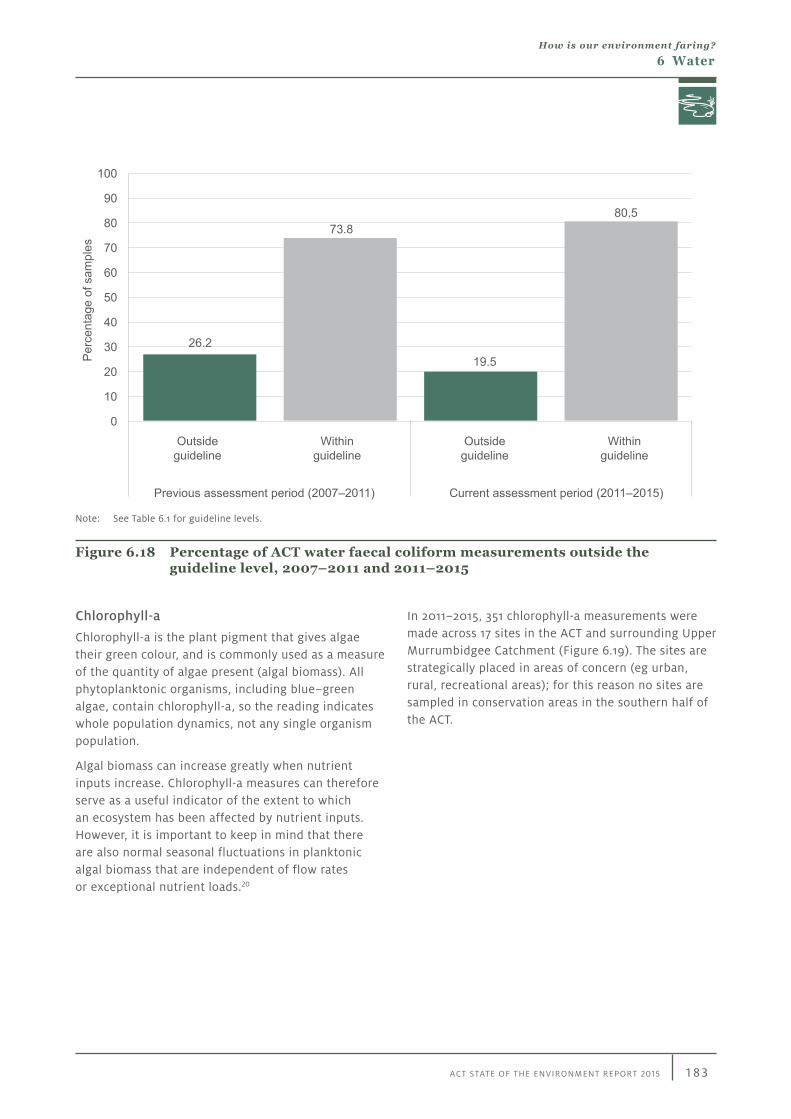
73.880.5
Current assessment period (2011–2015)
Per
cent
age
of s
ampl
es
0
10
20
30
40
50
60
70
80
90
100
Outsideguideline
Withinguideline
Outsideguideline
Withinguideline
26.219.5
Note: See Table 6.1 for guideline levels.
Figure 6.18 Percentage of ACT water faecal coliform measurements outside the guideline level, 2007–2011 and 2011–2015
Chlorophyll-a
Chlorophyll-a is the plant pigment that gives algae their green colour, and is commonly used as a measure of the quantity of algae present (algal biomass). All phytoplanktonic organisms, including blue–green algae, contain chlorophyll-a, so the reading indicates whole population dynamics, not any single organism population.
Algal biomass can increase greatly when nutrient inputs increase. Chlorophyll-a measures can therefore serve as a useful indicator of the extent to which an ecosystem has been affected by nutrient inputs. However, it is important to keep in mind that there are also normal seasonal fluctuations in planktonic algal biomass that are independent of flow rates or exceptional nutrient loads.20
In 2011–2015, 351 chlorophyll-a measurements were made across 17 sites in the ACT and surrounding Upper Murrumbidgee Catchment (Figure 6.19). The sites are strategically placed in areas of concern (eg urban, rural, recreational areas); for this reason no sites are sampled in conservation areas in the southern half of the ACT.
How is our environment faring?
184 ACT STATE OF THE ENVIRONMENT REPORT 2015
6 Water
0 12 24 km
N
Canberra
Percentage of measurements outside guideline
0
0–25
25–50
50–75
75–100
Note: See Table 6.1 for guideline levels.
Figure 6.19 Monitoring sites in the ACT and surrounding Upper Murrumbidgee Catchment, and how frequently chlorophyll-a concentrations were outside the guideline level, 2011–2015
How is our environment faring?
185ACT STATE OF THE ENVIRONMENT REPORT 2015
6 Water
Levels higher than chlorophyll-a guideline levels were found in around 31% of samples in 2011–2015, likely as a result of urban run-off with high nutrient
concentrations. This is a decrease of around 7% since 2007–2011 (Figure 6.20).
Previous assessment period (2007–2011)
61.9
68.7
Current assessment period (2011–2015)
Per
cent
age
of s
ampl
es
0
10
20
30
40
50
60
70
80
90
100
Outsideguideline
Withinguideline
Outsideguideline
Withinguideline
38.131.3
Note: See Table 6.1 for guideline levels.
Figure 6.20 Percentage of ACT water chlorophyll-a measurements outside the guideline level, 2007–2011 and 2011–2015
How is our environment faring?
186 ACT STATE OF THE ENVIRONMENT REPORT 2015
6 Water
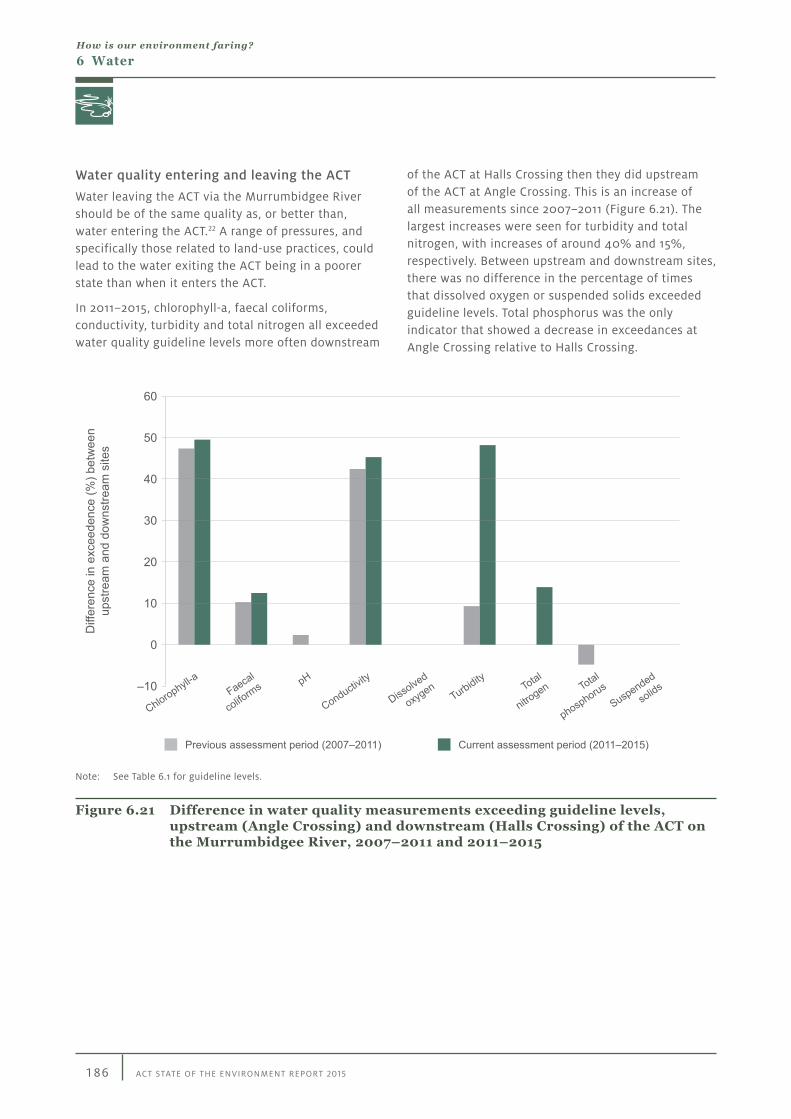
Water quality entering and leaving the ACT
Water leaving the ACT via the Murrumbidgee River should be of the same quality as, or better than, water entering the ACT.22 A range of pressures, and specifically those related to land-use practices, could lead to the water exiting the ACT being in a poorer state than when it enters the ACT.
In 2011–2015, chlorophyll-a, faecal coliforms, conductivity, turbidity and total nitrogen all exceeded water quality guideline levels more often downstream
of the ACT at Halls Crossing then they did upstream of the ACT at Angle Crossing. This is an increase of all measurements since 2007–2011 (Figure 6.21). The largest increases were seen for turbidity and total nitrogen, with increases of around 40% and 15%, respectively. Between upstream and downstream sites, there was no difference in the percentage of times that dissolved oxygen or suspended solids exceeded guideline levels. Total phosphorus was the only indicator that showed a decrease in exceedances at Angle Crossing relative to Halls Crossing.
Previous assessment period (2007–2011)
Diff
eren
ce in
exc
eede
nce
(%) b
etw
een
upst
ream
and
dow
nstre
am s
ites
Faecal
coliform
s
Chlorophyll-a pH
Conductivity
Dissolve
d
oxygen
Turbidity Total
nitrogen Total
phosphorusSuspended
solids
Current assessment period (2011–2015)
60
50
40
30
20
10
0
–10
Note: See Table 6.1 for guideline levels.
Figure 6.21 Difference in water quality measurements exceeding guideline levels, upstream (Angle Crossing) and downstream (Halls Crossing) of the ACT on the Murrumbidgee River, 2007–2011 and 2011–2015
How is our environment faring?
187ACT STATE OF THE ENVIRONMENT REPORT 2015
6 Water
Assessment summary for indicators of surface water quality state and trend
Water quality measure Assessment grade Confidence
Very poor
Poor Good Very good
In state grade
In trend grade
Conductivity
A A•pH
A A•Dissolved oxygen
A A•Turbidity
A A•Total phosphorus
A A•Total nitrogen
A A•Suspended solids
A A•Faecal coliforms
A A•Chlorophyll-a
A A•Overall surface water quality score
A A•Note: State is based on the number of sites that exceed water quality guidelines. Very good = 1–10%; Good = 11–25%; Poor = 25–49%; Very
poor = 51–100%. Trends are classified as improving (up arrow) or declining (down arrow) if there has been a 5% or greater change in the frequency that guideline levels are exceeded relative to the 2007–2011 assessment period. The overall water quality score (in bold) is the average of all measures. Overall score is the average of all water quality grades.
Recent trends •
•
Improving
Deteriorating
•
•
Stable
Unclear
Confidence A Adequate high-quality evidence and high level of consensus
A Limited evidence or limited consensus
A Evidence and consensus too low to make an assessment
How is our environment faring?
188 ACT STATE OF THE ENVIRONMENT REPORT 2015
6 Water
Groundwater availability and quality
Why is this indicator important?
The hydrogeology of the ACT is diverse, with local and intermediate groundwater flow systems of fractured rock aquifers, aeolion sands, colluvial fans, fractured basalts and upland alluvium.a Although groundwater connectivity will vary across these different hydrogeological settings, in general, connectivity between surface water bodies and groundwater is thought to be high in the ACT.15
Groundwater is a critical hydrological input for many ecosystems, as well as being an important predictable source of water for many human activities. Overall, groundwater in the ACT is a small resource compared with surface water. However, in the future, there may be some situations (eg persistent drought) in which there will be opportunities to use groundwater to help offset the demand on water supply from dams, and, as such, it is important to monitor groundwater conditions.
Ensuring high-quality groundwater is important both for the future sustainability of the environment and for water resource security. Groundwater can become polluted by a range of activities, including nitrogen from agricultural activities, hydrocarbons from petrol stations, salinisation from irrigation and tree clearing, pharmaceuticals, and industrial compounds.23 If groundwater becomes polluted, then a potential water source could be lost.24 Additionally, because of connectivity between groundwater and surface waters, pollution in groundwater can eventually end up in streams, lakes and wetlands (and vice versa).
Current monitoring status and interpretation issues
There are only limited data on groundwater availability and quality in the ACT, and it is therefore difficult to assess their state and trend. There are few long-term monitoring bores (ie continuous monitoring undertaken over several state of the environment assessment periods).
a http://data.daff.gov.au/anrdl/metadata_files/pa_agfs_r9abl_00111a00.xml
Access Canberra and the Chief Minister, Treasury and Economic Development Directorate, through the Environment Protection Authority, currently maintain 15 monitoring bores, with information from another six sites coming from interested groundwater abstractors. The monitoring bores provide information about the transmissivity (capacity for water to move through the aquifer), hydraulic conductivity, storage capacity potential and recharge rates of the various aquifer types within water management areas. Monitoring the aquifer recharge response to rainfall is seen as a critical activity that allows us to quantify potential effects of changed rainfall patterns expected from climate change. However, the information is only analysed and reported on in 3–5-year periods. There are no recent data for the current assessment period.
Other, more detailed groundwater investigations have been performed more recently. The managed aquifer reuse (MAR) project around Exhibition Park and Mitchell has tested and analysed the local effects of injecting water into the aquifer and then retrieving the water after a couple of months. MAR is being tested for use in the Inner North Reticulation Network, because it conceptually offers a more efficient way of capturing and storing stormwater run-off for later irrigation use.
What does this indicator tell us?
From the information available and data collected in previous assessment periods, it is likely that groundwater availability and quality are good in the ACT, with negative trends unlikely. However, if rainfall–groundwater recharge relationships change dramatically (eg because of persistent drought) or if extraction increases, then groundwater availability and, possibly, quality may also change.
It is likely that groundwater is being extracted at far below the rate that recharge is replenishing aquifers. For example, groundwater extraction in the ACT was approximately 0.5 gigalitres per year in 2004–05,15 which represents a very low level of stress on aquifers in the ACT. It is estimated that the extraction rate is no greater than 10% of the long-term recharge.15
Recently (April 2006 and November 2010), although before the current assessment period, groundwater recharge within the ACT’s subcatchments was assessed in detail.25. Based on Canberra’s average rainfall of 622 millimetres per year (mm/y), recharge rates of 10–28 mm/y were reported across the subcatchments of Lake Burley Griffin, Woden, Fyshwick, Woolshed Creek and Jerrabomberra Creek.25 Although this information does not directly tell us the availability of groundwater resources in the ACT, it does show that groundwater aquifers are recharging, suggesting that groundwater resources are unlikely to decline if rainfall recharge and extraction conditions remain the same.
It appears as though groundwater quality is generally good and there are no negative trends. While some monitoring has occurred, it should be noted that, because of a lack of data, there is high uncertainty in this assessment. For example, aside from two bores with high levels of electrical conductivity (salinity), possibly from deep saline aquifers, most electrical
conductivity readings are <400 microsiemens per centimetre, suggesting that groundwater salinity is generally low. Information on other potential groundwater contaminants is largely absent, and usually only collected at specific times and locations.
Although no specific data or studies are available, one potential area of future concern is nitrogen levels in groundwater. High connectivity between surface water and groundwater could mean that, over time, the high levels of total nitrogen observed in many waterways of the ACT could infiltrate into groundwater aquifers, with serious ecological consequences (eg it could alter ecological functioning and expand hypoxic zones) and human health issues (eg very high concentrations of nitrate–nitrogen in drinking water can cause diseases in infants).26,27 It must be stressed that the nitrogen levels in the ACT are far from these potentially dangerous levels. Additionally, groundwater use is low in the ACT. Nonetheless, if nitrogen levels remain high and groundwater use increases in the future, nitrogen entering groundwater may become an important issue.
Assessment summary for indicators of groundwater state and trend
Groundwater measure Assessment grade Confidence
Very poor
Poor Good Very good
In state grade
In trend grade
Groundwater availability
A A•Groundwater quality
A A•Overall groundwater score
A A•Assessment based on CSIRO.15 Trend increases or decreases refer to changes relative to 2007–2011 conditions.
Recent trends •
•
Improving
Deteriorating
•
•
Stable
Unclear
Confidence A Adequate high-quality evidence and high level of consensus
A Limited evidence or limited consensus
A Evidence and consensus too low to make an assessment
How is our environment faring?
190 ACT STATE OF THE ENVIRONMENT REPORT 2015
6 Water
Drinking water quality
Why is this indicator important?
Drinking water quality is important for the safety of consumers in the ACT. For drinking water to be safe for people in most stages of life, including children more than six months old and the very old, it should contain no harmful concentrations of chemicals or pathogenic microorganisms, and it should be aesthetically pleasing with regard to appearance, taste and odour.28
A wide range of measurable characteristics, compounds or constituents can be found in water that may affect its quality:
• physical
• microbial
• chemical, including inorganic chemicals, organic compounds and pesticides
• radiological.
Appearance, taste and odour are useful indicators of quality, because they are characteristics by which the public judges water quality. However, water that is turbid or coloured, or has an objectionable taste or odour, may not necessarily be unsafe to drink. Conversely, the absence of any unpleasant qualities does not guarantee that water is safe. The safety of water in public health terms is determined by its microbial, physical, chemical and radiological
quality; of these, microbial quality is usually the most important.
Water is treated at two water treatment plants before it is supplied for use in the ACT:
• the Mount Stromlo Water Treatment Plant treats water from the Cotter River reservoirs and the Murrumbidgee River
• the Googong Water Treatment Plant treats water from Googong Reservoir on the Queanbeyan River and water transferred via the M2G from the Murrumbidgee to Googong water security infrastructure.
Current monitoring status and interpretation issues
In the ACT, residents have access to high-quality drinking water. In 2013, 95% of Canberra residents reported that they were satisfied with the quality of drinking water, the highest level of satisfaction reported for any state or territory in Australia.29
Drinking water quality is monitored by Icon Water to ensure that it meets the ACT Public Health (Drinking Water) Code of Practice 2007 and the Australian Drinking Water Guidelines,28 and is suitable for human consumption. The code of practice also documents the notification procedures the water utility company must follow if an incident posing an imminent risk to public health occurs. The monitoring is conducted at treatment plants and from customers’ taps; each month, 84 random customer garden taps are monitored from a pool of more than 350 sites throughout Canberra suburbs.
What does this indicator tell us?
Drinking water in the ACT is of very high quality and is consistently within standards in the Australian Drinking Water Guidelines. In 2011–2015, drinking water quality, on average, met the standards in the Australian Drinking Water Guidelines. On a small number of occasions, pH, chlorine and turbidity slightly exceeded Australian Drinking Water Guidelines standards (Table 6.2). The results for 2011–2015 are similar to those for 2007–2011.
Cotter Reservoir
Photo: University of Canberra
How is our environment faring?
191ACT STATE OF THE ENVIRONMENT REPORT 2015
6 Water
Table 6.2 Drinking water quality indicators tested by Icon Water, 2011–2015
ADWG = Australian Drinking Water Guidelines; µg/L = micrograms per litre; mg/L = milligrams per litre; MPN/100 mL = most probable number per 100 millilitres; NTU = nephelometric turbidity unitsSource: Data provided by Icon Water
Table 6.2 continued
How is our environment faring?
193ACT STATE OF THE ENVIRONMENT REPORT 2015
6 Water
Assessment summary for indicators of drinking water state and trend
Drinking water quality Assessment grade Confidence
Very poor
Poor Good Very good
In state grade
In trend grade
Drinking water quality measures
A A•Drinking water quality assessment is based on data and assessments provided by Icon Water. Trend increases or decreases refer to changes relative to 2007–2011 conditions.
Recent trends •
•
Improving
Deteriorating
•
•
Stable
Unclear
Confidence A Adequate high-quality evidence and high level of consensus
A Limited evidence or limited consensus
A Evidence and consensus too low to make an assessment
River discharge (flow)
Why is this indicator important?
The amount of water flowing through our rivers is a major determinant of their ecological condition, as well as how well they are able to support human activities and needs. We rely on our waterways for a range of functions, including biodiversity and conservation, irrigation, domestic water supply and recreation opportunities. Waterways need to have sufficient flows to provide these functions. The natural flows in ACT streams are highly variable; rivers and streams naturally have periods of both very low and very high flows. Flows in our rivers also vary seasonally; higher flows usually occur in the spring months.30
In the ACT, natural flows are mainly altered by water resource development, such as the building of dams and weirs, and diversion or extraction of in-stream flows. Unnatural flow patterns, especially for long periods of time, have the potential to adversely affect aquatic biodiversity. Environmental flows are river flows necessary to maintain aquatic ecosystems and mimic natural river flows affected by water resource development. In heavily used river systems, such as in water supply catchments, environmental
flows can be delivered in ways that protect specific components of the flow regime, to help keep stream ecosystems healthy. In rivers that have Icon Water operations (Cotter, Murrumbidgee and Queanbeyan rivers), environmental flows are provided through releases and spills from the reservoirs. In other rivers, environmental flows are provided through restrictions on the amount of water that can be withdrawn.30
The ACT Environmental Flow Guidelines30 protect particular components of natural stream flow:
• base flow
• small floods (riffle maintenance flows; riffles are the shallow, fast-flowing sections of the river)
• larger floods (pool or channel-maintenance flows)
• special-purpose flows.
The base flow is the flow component contributed mostly by groundwater, and is the minimal volume of water that the stream needs to support fish, plants and insects, and protect water quality. The volume of the base flow is determined each month for each stretch of stream or river.
How is our environment faring?
194 ACT STATE OF THE ENVIRONMENT REPORT 2015
6 Water
The purpose of the small and larger floods (riffle, pool and channel-maintenance flows) is to relocate sediment deposits and maintain channel form. The movement of sediment is important for maintaining healthy aquatic ecosystems. The riffle maintenance flows scour out fine sediment that accumulates in riffles, damaging these habitats for fish, water plants and other aquatic life. The pool and channel-maintenance flows scour sediment from pools and ensure that the river maintains its natural channel form.
Special-purpose flows are flows designed for a particular ecological need – for example, the flow needed to encourage breeding of a species of fish, or to protect habitat of a frog species.30
Current monitoring status and interpretation issues
River discharge is measured at gauging stations located on rivers and streams throughout the ACT and surrounding region. Gauges are located on dammed rivers in urban areas and conservation areas, and are used to monitor river flows entering and exiting the ACT (Figure 6.22).
Spilling water and an environmental flow release from Bendora Dam in spring 2013
Photo: University of Canberra
How is our environment faring?
195ACT STATE OF THE ENVIRONMENT REPORT 2015
6 Water
Rainfall stations (ID)Climate stations Water level/flow gauging stations ACT border Catchment boundaries Water bodies Urban areas0 105 15 km
N
Source: Map provided by ACT Government and ALS Environmental
Figure 6.22 Discharge gauging stations in the ACT and surrounding region
How is our environment faring?
196 ACT STATE OF THE ENVIRONMENT REPORT 2015
6 Water
What does this indicator tell us?
Environmental flow releases
In 2011–2015, the volume of releases and spills from ACT reservoirs increased compared with 2007–2011. This is mainly because of increased rainfall following the breaking of the drought in 2010–11 and flow management during the construction of the new Cotter Dam. In both 2007–2011 and 2011–2015, minimum environmental flow releases were well exceeded in all years (Table 6.3).
River discharge across the ACT
River discharge varies greatly across the ACT. For example, in highly urbanised catchments with large areas of impervious surfaces, discharge is highly variable because of a fast response to catchment run-off (eg Sullivans Creek; Figure 6.23). River discharge in rural and unregulated mountain areas in the southern half of the ACT shows discharge peaks coinciding with increased spring discharges declining to lower flows in summer and autumn (eg Cotter River at Gingera, and Paddys River; Figures 6.24 and 6.25, respectively).
0
200
400
600
800
1000
1200
2007–2011 2011–2015
1400
Jul 2007
Jul 2008
Jul 2009
Jul 2010
Jul 2011
Jul 2012
Jul 2013
Jul 2014
Dis
char
ge (M
L/da
y)
ML/day = megalitres per day
Figure 6.23 Daily mean discharge in Sullivans Creek at Barry Drive (station number 410775), 2007–2015
How is our environment faring?
197ACT STATE OF THE ENVIRONMENT REPORT 2015
6 Water
Table 6.3 Volume of releases and spills, and minimum required environmental flows from ACT reservoirs, 2007–2015
Figure 6.24 Daily mean discharge in the Cotter River at Gingera, upstream of Corin Dam (station number 410730), 2007–2015
How is our environment faring?
198 ACT STATE OF THE ENVIRONMENT REPORT 2015
6 WaterD
isch
arge
(ML/
day)
0
1 000
2 000
3 000
4 000
5 000
6 000
7 000
8 000
9 000
10 000 2007–2011 2011–2015
Jul 2007
Jul 2008
Jul 2009
Jul 2010
Jul 2011
Jul 2012
Jul 2013
Jul 2014
ML/day = megalitres per day
Figure 6.25 Daily mean discharge in Paddys River (station number 410713), 2007–2015
Discharge downstream of dams on the Cotter and Queanbeyan rivers is provided by environmental flow releases, which include components of the natural flow regime and flow variability (eg Cotter River below Corin Dam; Figure 6.26). However, large discharges greater than approximately 1000 megalitres per day generally only occur when a dam spills.
Overall, river discharge increased across the ACT towards the end of 2011 as a result of large rainfall events.
Water entering and leaving the ACT
Similar amounts of water enter and leave the ACT, primarily because of contributions from the Cotter River Catchment and urban run-off (Figure 6.27).
How is our environment faring?
199ACT STATE OF THE ENVIRONMENT REPORT 2015
6 WaterD
isch
arge
(ML/
day)
Jul 2007
Jul 2008
Jul 2009
Jul 2010
Jul 2011
Jul 2012
Jul 2013
Jul 20140
1 000
2 000
3 000
4 000
5 000
6 000
7 000
8 000
9 000
10 000 2007–2011 2011–2015
ML/day = megalitres per day
Figure 6.26 Daily mean discharge in the Cotter River, downstream of Corin Dam (station number 410730), 2007–2015
Dis
char
ge (M
L/da
y)
0
1 000
2 000
3 000
4 000
5 000
6 000
7 000
8 000
9 000
10 000
Discharge in Discharge outJul 2007
Jul 2008
Jul 2009
Jul 2010
Jul 2011
Jul 2012
Jul 2013
Jul–2014
2007–2011 2011–2015
ML/day = megalitres per day
Figure 6.27 Total daily mean discharge measured on rivers entering and exiting the ACT, 2007–2015
How is our environment faring?
200 ACT STATE OF THE ENVIRONMENT REPORT 2015
6 Water
Assessment summary for indicators of river discharge state and trend
River discharge measure Assessment grade Confidence
Very poor
Poor Good Very good
In state grade
In trend grade
Environmental flow releases
A A•ACT river discharge
A A•Overall river discharge score
A A•River discharge assessment is based on environmental flow, and ACT river discharge data and assessment supplied by Icon Water. Trend increases or decreases refer to changes relative to 2007–2011 conditions.
Recent trends •
•
Improving
Deteriorating
•
•
Stable
Unclear
Confidence A Adequate high-quality evidence and high level of consensus
A Limited evidence or limited consensus
A Evidence and consensus too low to make an assessment
Ecological condition
Why is this indicator important?
The Australian River Assessment System (AUSRIVAS) uses aquatic macroinvertebrates to provide information about river health using nationally standardised methods and analysis protocols.31 Aquatic macroinvertebrates are a diverse range of insects, crustaceans and molluscs, which include snails, water boatmen, dragonflies, stoneflies, mayflies and aquatic worms. They are an important source of food for fish and platypus, and are involved in ecosystem processes such as nutrient cycling. They are also widespread, easy to sample and relatively immobile. Most importantly, the number and type of macroinvertebrates at a site can reflect environmental changes that influence the stream ecosystem during several months before sampling (eg changes in river flow, pollution, fine sediment addition and removal of riparian vegetation). Therefore, they provide an ‘integrated’ indicator of human effects on the stream ecosystem.
Current monitoring status and interpretation issues
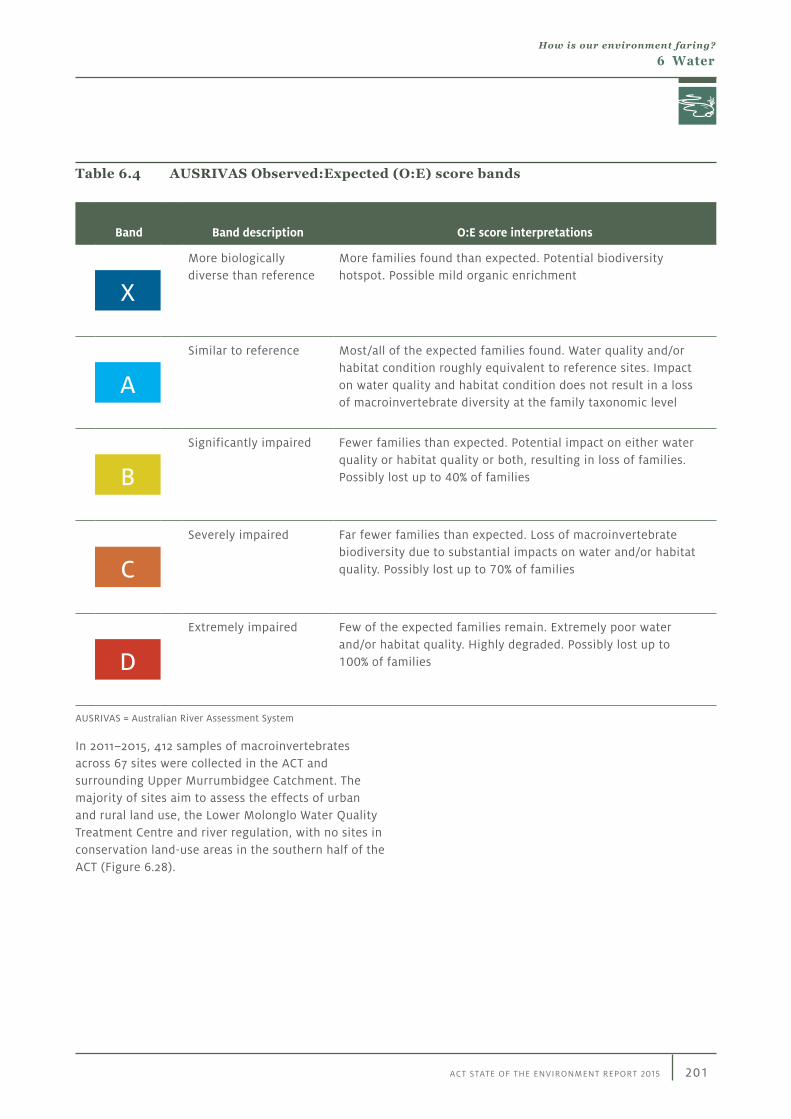
AUSRIVAS assessment scores, referred to as the Observed:Expected score (O:E score), are based on comparing the number of aquatic macroinvertebrates observed at test sites with the number expected to occur at the sites if they were undisturbed. The value of the O:E score can range from zero (indicating that none of the expected taxa were found at the site) to 1, with values close to 1 indicating that the site has a macroinvertebrate community composition similar to that expected if the site is minimally disturbed by humans (reference condition). The O:E scores are assigned to bands that describe different levels of ecological condition, ranging from ‘richer than reference’ condition (containing more families than expected) to ‘extremely impaired’ (containing very few of the expected families) (Table 6.4). Across time, O:E scores should be maintained or improved.22
More families found than expected. Potential biodiversity hotspot. Possible mild organic enrichment
X
Similar to reference Most/all of the expected families found. Water quality and/or habitat condition roughly equivalent to reference sites. Impact on water quality and habitat condition does not result in a loss of macroinvertebrate diversity at the family taxonomic level
A
Significantly impaired Fewer families than expected. Potential impact on either water quality or habitat quality or both, resulting in loss of families. Possibly lost up to 40% of familiesB
Severely impaired Far fewer families than expected. Loss of macroinvertebrate biodiversity due to substantial impacts on water and/or habitat quality. Possibly lost up to 70% of familiesC
Extremely impaired Few of the expected families remain. Extremely poor water and/or habitat quality. Highly degraded. Possibly lost up to 100% of familiesD
AUSRIVAS = Australian River Assessment System
In 2011–2015, 412 samples of macroinvertebrates across 67 sites were collected in the ACT and surrounding Upper Murrumbidgee Catchment. The majority of sites aim to assess the effects of urban and rural land use, the Lower Molonglo Water Quality Treatment Centre and river regulation, with no sites in conservation land-use areas in the southern half of the ACT (Figure 6.28).
How is our environment faring?
202 ACT STATE OF THE ENVIRONMENT REPORT 2015
6 Water
0 12 24 km
N
Canberra
X
A
B
C
D
AUSRIVAS O:Escore band
AUSRIVAS = Australian River Assessment SystemNote: See Table 6.4 for the AUSRIVAS O:E score band descriptions.
Figure 6.28 AUSRIVAS macroinvertebrate monitoring sites in the ACT and surrounding Upper Murrumbidgee Catchment, and the average AUSRIVAS Observed:Expected (O:E) score band assessment, 2011–2015
How is our environment faring?
203ACT STATE OF THE ENVIRONMENT REPORT 2015
6 Water
What does this indicator tell us?
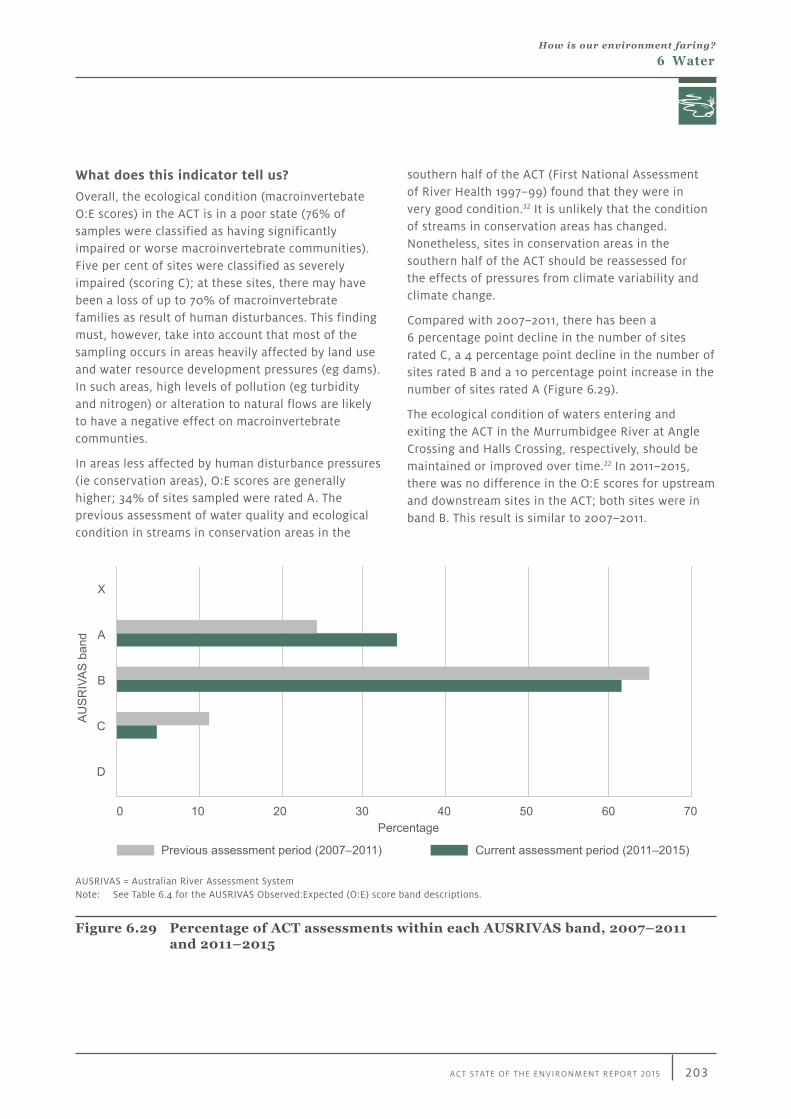
Overall, the ecological condition (macroinvertebate O:E scores) in the ACT is in a poor state (76% of samples were classified as having significantly impaired or worse macroinvertebrate communities). Five per cent of sites were classified as severely impaired (scoring C); at these sites, there may have been a loss of up to 70% of macroinvertebrate families as result of human disturbances. This finding must, however, take into account that most of the sampling occurs in areas heavily affected by land use and water resource development pressures (eg dams). In such areas, high levels of pollution (eg turbidity and nitrogen) or alteration to natural flows are likely to have a negative effect on macroinvertebrate communties.
In areas less affected by human disturbance pressures (ie conservation areas), O:E scores are generally higher; 34% of sites sampled were rated A. The previous assessment of water quality and ecological condition in streams in conservation areas in the
southern half of the ACT (First National Assessment of River Health 1997–99) found that they were in very good condition.32 It is unlikely that the condition of streams in conservation areas has changed. Nonetheless, sites in conservation areas in the southern half of the ACT should be reassessed for the effects of pressures from climate variability and climate change.
Compared with 2007–2011, there has been a 6 percentage point decline in the number of sites rated C, a 4 percentage point decline in the number of sites rated B and a 10 percentage point increase in the number of sites rated A (Figure 6.29).
The ecological condition of waters entering and exiting the ACT in the Murrumbidgee River at Angle Crossing and Halls Crossing, respectively, should be maintained or improved over time.22 In 2011–2015, there was no difference in the O:E scores for upstream and downstream sites in the ACT; both sites were in band B. This result is similar to 2007–2011.
Percentage
Current assessment period (2011–2015)Previous assessment period (2007–2011)
AU
SR
IVA
S b
and
0 10 20 30 40 50 60 70
X
A
B
C
D
AUSRIVAS = Australian River Assessment SystemNote: See Table 6.4 for the AUSRIVAS Observed:Expected (O:E) score band descriptions.
Figure 6.29 Percentage of ACT assessments within each AUSRIVAS band, 2007–2011 and 2011–2015
How is our environment faring?
204 ACT STATE OF THE ENVIRONMENT REPORT 2015
6 Water
Assessment summary for water indicators of ecological condition state and trend
A A•AUSRIVAS = Australian River Assessment SystemNotes: 1 See Table 6.4 for the AUSRIVAS Observed:Expected (O:E) score band descriptions.2. State of the ecological condition is based on the percentage of sites with an OE score of A or X. Very good = 76–100%; Good = 51–75%;
Poor = 26–50%; Very poor = 0–25%. Trends classified as improving (up arrow) or declining (down arrow) = if there has been a 5% or greater change in the frequency guideline levels are exceeded relative to 2007–2011. The overall ecological condition score (in bold) is the average of all measures. Overall score is the average of all ecological condition grades.
Recent trends •
•
Improving
Deteriorating
•
•
Stable
Unclear
Confidence A Adequate high-quality evidence and high level of consensus
A Limited evidence or limited consensus
A Evidence and consensus too low to make an assessment
6.3.2 Pressures There are many pressures on water resources in the ACT, such as pollution from agricultural and urban areas, and the extraction of water from rivers and lakes.
Although there are many types of pressures, three broad categories are covered here, which encapsulate how human activities put pressure on ACT water resources:
• land use and management
• climate variability and change
• water resource development.
We examine how each of these pressures affects water resources in general, how they may be doing so in the ACT and whether the influence of pressures on the environment is increasing or declining.
Land use and management
Why is this indicator important?
Differences in land use can have important implications for water quality and the ecological condition of water bodies in the ACT, and different land uses will require different management approaches to ensure that water quality standards are maintained. Some water resources are only minimally affected by human activities, whereas others, in areas of high rural and urban activity, often show signs of ecosystem change.33
The amount of land used for different activities (eg native vegetation conservation, agriculture, urban land development) in a catchment can have long-lasting influences on water bodies.17,34 As water moves across the land’s surface, it collects and transports materials and sediments into our waterways. Depending on the land use, this can lead to increases in turbidity, nutrient enrichment and heavy metals.17 This affects ecological conditions, and can also affect the quality of water we drink.13,17
How is our environment faring?
205ACT STATE OF THE ENVIRONMENT REPORT 2015
6 Water
Current monitoring status and interpretation issues
To assess the potential long-term consequences of ongoing poor performance in these indicators, strategies and actions that aim to improve these aspects of water quality should be a priority. The ongoing monitoring of these indicators to continue to track trends is also important. One consideration in monitoring is the placement of sampling points. Although sampling for these indicators is deliberately only undertaken in locations that are under the most pressure from intensive land use, a more comprehensive monitoring regime across the ACT (including conservation areas) would give a broader picture of the state of waterways with regard to these indicators.
What does this indicator tell us?
Pressures on surface water quality
Water quality is highly sensitive to changes in land-use practices.17 For example, increases in agricultural and urban land area can increase the amount of pollution entering waterways.17 Within the ACT, differences in land uses have been linked with water quality.14 For example, catchments with greater relative proportions of agricultural and urban land use have higher nutrient levels and salinity14 (eg Figure 6.13).
In the ACT, indicators related to land use, such as total nitrogen, turbidity and chlorophyll-a, are all in a poor state or worse, with a high percentage of samples exceeding water guideline levels. While it is difficult to link the poor state of these indicators with specific areas or events, it is likely that these conditions are, in part, caused by land-use pressures. In particular, run-off carrying sediments and pollutants (eg fertilisers) from urban and agricultural areas is likely leading to high turbidity, total nitrogen and chlorophyll-a measurements. It is important to note that all indicators in a poor state showed some small improvements relative to the previous assessment period, but without statistical analysis, it is difficult to be certain whether these small changes are a result of variability in the data or a slight abatement in land-use pressures.
Although it is possible that the pressures have lessened slightly compared with the previous reporting period, it is important to acknowledge that land-use pressures on water resources are likely to continue and, in some cases, increase as urban development grows.
Pressures on groundwater quality
Land-use influence on water quality does not stop at the surface. As water infiltrates through the soil, it recharges aquifers. As it does this, it can carry pollutants such as nitrates, pharmaceuticals and pesticides from the land’s surface into groundwater aquifers.23,35 In the ACT, groundwater is generally of high quality, and is only locally and minimally affected by pollutants.15 Although groundwaters are not as heavily used as surface waters in the ACT, it is imperative that their quality is not unduly affected by polluting processes (eg nitrogen pollution of surface waters), because connections between groundwater and surface waters could lead to unintended pollution of rivers and drinking waters. At the moment, land-use pressures on groundwater quality are likely to be low, but this may change if pollution of surface water sources persists and intensifies.
Pressures on drinking water quality
The pressure that land use places on surface water and groundwater quality is strongly linked to drinking water quality. Poor surface water and groundwater quality resulting from the intensification of agricultural and urban land uses can have catastrophic implications for the quality of drinking water. In areas with poor drinking water quality, the risk of exposure to infectious and parasitic diseases for humans greatly increases.16 In the ACT, the pressure placed on our drinking water quality by land use is minimal, because the majority of water catchments are in protected conservation areas. Management actions by Icon Water, including source water protection36 and water treatment plants, also prevent harmful contaminants from ending up in drinking water and remove them.36 Consequently, land-use pressures on drinking water quality are low.
How is our environment faring?
206 ACT STATE OF THE ENVIRONMENT REPORT 2015
6 Water
Pressures on freshwater ecological conditions
Changes to land use alter surface water quality, which can decrease the suitability of habitat for freshwater species, including macroinvertebrates and fish. Many studies have demonstrated that rivers in catchments with high relative amounts of agricultural land use have fewer sensitive macroinvertebrate and fish species than forested catchments.17,37 For the ACT’s rivers, indices of macroinvertebrate community condition decrease as the proportion of intense land uses (eg urban areas) in the catchment increases.14
Managing and, ultimately, reducing land-use pressures are therefore critical for ensuring the future ecological functioning and condition of waterways in the ACT.
In the ACT, the poor overall state of macroinvertebrate communities in 2011–2015 suggests that there are substantial land-use pressures affecting ecological condition. However, it is important to note that the macroinvertebrate indicators showed some small improvements relative to 2007–2011.
Case study 6.2 talks about managing water quality in Lake Burley Griffin.
Assessment summary for water indicators of land-use pressures
Assessment grade Confidence
Very poor (high pressure)
Very good (low pressure)
In state grade
In trend grade
Land-use pressure
A A•Note: Grade is based on average from overall surface water quality, groundwater quality and ecological condition indicator grades. Trend in
land-use pressure is based on projections of increased population growth in the ACT.b
Recent trends •
•
Improving
Deteriorating
•
•
Stable
Unclear
Confidence A Adequate high-quality evidence and high level of consensus
A Limited evidence or limited consensus
A Evidence and consensus too low to make an assessment
b http://apps.treasury.act.gov.au/demography/projections/act/total
How is our environment faring?
207ACT STATE OF THE ENVIRONMENT REPORT 2015
6 Water
Case study 6.2 Managing water quality in Lake Burley Griffin
Lake Burley Griffin is an important part of the
Murray–Darling Basin’s tributary system; it acts as a
water quality retention pond for downstream parts of
the system. Lake Burley Griffin also supports a variety
of water-based commercial and recreational uses. This
means that there is increasing pressure to provide better
water quality outcomes to support these secondary
functions and to protect the health and safety of users.
The ACT’s recreational water bodies, such as Lake
Tuggeranong, Lake Ginninderra and Yerrabi Pond, are
subject to similar demands as Lake Burley Griffin, and
the problems are expected to be similar for all of these
water bodies.
Lake Burley Griffin
Photo: ACT Government Environment and Planning Directorate
Nutrients and blue–green algae in Lake Burley Griffin
Nutrient-rich water flows into Lake Burley Griffin are
the primary cause of blue–green algae blooms in the
lake. These nutrients can build up in the lake as a result
of inflows from surrounding urban areas that carry:
• sediments and soil flowing into stormwater drains
• fertilisers and organic matter (grass clippings and leaf litter) from gardens flowing into drains
• food scraps that have been dumped into waterways
• leakages from blocked or damaged sewers and drains.
Catchment management to improve Lake Burley Griffin water quality
Water quality conditions in Lake Burley Griffin reflect
the composition of water and pollutant loads from the
rivers, creeks and drainages that enter the lake, as well
as biological, chemical and physical processes within
the lake. The ACT Commissioner for Sustainability
and the Environment has made recommendations for
management interventions to help remediate the lake’s
environmental and recreational values, such as:
• urban catchment water quality management, including assessing water-sensitive urban design effectiveness and future sites for installation (eg urban wetlands to filter pollutants entering the lake)
• rural catchment water quality management, including actions to reduce soil erosion from upstream catchments
• regular review of sewage treatment and discharge management for the Queanbeyan and Fyshwick sewage treatment plants
• consideration of the feasibility of flow releases from Googong Dam to increase river flows into the lake during low-flow summer periods, to dilute pollutants and improve water quality.
The ACT Government is implementing the recommendations
made in the Commissioner’s report through the Lake Burley
Griffin Action Plan: A Healthier, Better Functioning Lake by
2030. Specific actions being undertaken include:
• a water strategy for the ACT based on catchment management principles
• an ongoing catchment management expert panel
• a comprehensive catchment education awareness program
• a volunteer-driven Landcare program
• examination of options for enhancing water quality and vegetation monitoring to inform future actions
• water column manipulation trials
• ongoing renovation of the stormwater system, and further constructed wetlands and pollution control structures (eg gross pollutant trap maintenance and constructed wetlands to capture urban water run-off).
How is our environment faring?
208 ACT STATE OF THE ENVIRONMENT REPORT 2015
6 Water
Climate variability and change
Why is this indicator important?
Together, climate variability and change impose great pressures on water resources in the ACT. Climate impacts on water can occur over both short and long timescales. Climate variability covers shorter-term fluctuations, covering months, years and decades, whereas climate change refers to longer-term changes, from decades to centuries. Climate variability, particularly because of fluctuations in rainfall, is high across much of south-eastern Australia, including the ACT, and long and intense droughts are a recurring phenomenon.38
Current monitoring status and interpretation issues
Climate change projections across south-eastern Australia, including the ACT, are for a hotter and drier climate.4-6,39 There are climatic change projections of up to 15% decreases in spring and winter rainfall across southern Australia, including the ACT.40 In addition, an increase in average temperatures is likely to reduce soil moisture so that more water will be absorbed by dry ecosystems during rainfall events, resulting in less water entering water supply dams.41
What does this indicator tell us?
Pressures on river discharge
Climate variability and change influence the amount of water flowing into ACT rivers (river discharge) through fluctuations in rainfall and temperature.14 We can expect that projections of decreases in average rainfall under climate change will decrease river flows. In the upper Murrumbidgee River, one of the largest rivers running through the ACT, the dry climate change scenarios for 2030 project declines of 29–40% in stream flows for different parts of the river.15
During 2011–2015, climate variability and change pressures on river discharge in the ACT were minimal. Based on available data, river discharge was in a very good state. However, it is important to recognise that this assessment could change radically if there is a persistent dry period or an increase in the duration and intensity of future droughts.
Pressures on groundwater availability
Climate variability and change can alter the amount of rainfall and, in turn, the amount of water that recharges groundwater aquifers. Relative to the historical climate (1975–2005), with current development levels, groundwater recharge in the ACT could increase by 12% under wet scenarios of climate change or decline by 24% under dry scenarios of climate change by 2030.15 Although the impacts of changes in recharge on water resources will be much slower to manifest in groundwater than in surface waters, climatic pressures on groundwater still occur and thus need to be taken into account for longer-term water resource planning and management.
Currently, there is likely to be little pressure on groundwater availability from climate variability and change in the ACT. However, as with river discharge, this could change if rainfall declines.
Pressures on surface water quality
Although water resource managers tend to focus on the effects of climate on the amount of water available, climate effects on water quality should not be underestimated. Climatic variability – for example, switching from drought to flood – can have large impacts on water quality, driving complex biogeochemical process that lead to large-scale hypoxic blackwater events.39,42 Climate change in the longer term, through hydrological changes and increased water temperature, may also increase chemical and microbiological pollution, placing increased pressure on drinking water quality.39,43
In 2011–2015, although some water quality indicators were in poor condition, it is unlikely that these were strongly linked to climate variability and change. Apart from intense drought periods, and climate variability and change pressures on water quality are expected to be minimal for the ACT in the near future, with only small changes in the exceedance of water quality thresholds.14
How is our environment faring?
209ACT STATE OF THE ENVIRONMENT REPORT 2015
6 Water
Pressures on ecological condition
Climate variability and climate change both exert great pressures on freshwater ecosystems. Climate variability, acting through droughts and floods, shapes the structure and functioning of freshwater ecosystems. Drought periods can cause reductions in the amount of freshwater habitat for certain species;44 floods can reshape rivers, deliver large nutrient pulses and trigger breeding events for water-dependent species. Furthermore, although the freshwater biota of the ACT are well adapted to extremes of floods and droughts, these events could be intensified under climate change, pushing some species and communities beyond their ability to adapt.45 In the long term, the pressures of climate change on freshwater
ecosystems could lead to significant and long-lasting changes in the type and number of species present in rivers, lakes and wetlands in the ACT.
The current poor state of ecological condition (from AUSRIVAS O:E scores) may, in some way, be linked to pressures from climate variability and change. However, because macroinvertebrate responses represent an integrated measure of various disturbances, it is difficult to discern the specific role of climate variability and change. Nonetheless, the intense rainfall events at the beginning of the current reporting period may have affected some macroinvertebrate communities. Intense floods act as a physical disturbance, washing away macroinvertebrates and leading to temporary declines in their abundance and diversity.
Assessment summary for water indicators of climate variability and climate change pressures
Assessment grade Confidence
Very poor (high pressure)
Very good (low pressure)
In state grade
In trend grade
Climate variability and change
A A•Note: Grade is based on average from overall surface water quality, groundwater quality and ecological condition indicator grades. Trend in
climate pressure is based on current assessments46 and future climate projections.4-6
Recent trends •
•
Improving
Deteriorating
•
•
Stable
Unclear
Confidence A Adequate high-quality evidence and high level of consensus
A Limited evidence or limited consensus
A Evidence and consensus too low to make an assessment
How is our environment faring?
210 ACT STATE OF THE ENVIRONMENT REPORT 2015
6 Water
Water resource development
Why is this indicator important?
Water resource development (eg dams, water extraction, stream-flow regulation) is critical for supplying predictable water to agricultural activities and urban populations.
Monitoring status and interpretation issues
Although water resource development has been successfully supplying water for agricultural and urban development, in some parts of the world, we are reaching limits in terms of the amount of water we are able to extract.47 We are also increasingly degrading ecosystems by altering the natural flow regimes that species are adapted to.3 Across the globe, addressing these two problems is a key overarching goal of water resource management.
In the ACT, water resource development pressures result from dams, stream-flow regulation and water extraction. Four dams (Corin, Bendora, Cotter and Googong) are used for water supply storage for the ACT and Queanbeyan. On average, approximately 50.5 gigalitres per year of water is extracted from dams in the ACT, and it is expected that this will increase by 0.6 gigalitres per year to support population growth.48
What does this indicator tell us?
Pressures on river discharge
One of the most obvious ways that water resource development puts pressure on freshwater systems is by changing flows in rivers (ie its flow regime).3 Through damming and water extraction, water resource development changes a river’s flow regime by altering the rate, amount, timing, magnitude, frequency and duration of flows.3 Dams and water extraction in the ACT have substantially changed river flow regimes in the ACT, with decreases in the amount of flows in some areas (eg Cotter and Queanbeyan rivers), and increases in the frequency and duration of low-flow events.14
Currently, water resource development pressures on river discharge are managed through the use of environment flows. In 2011–2015, all environmental flow requirements were met, and water resource development pressures on river discharge are likely to be low.
Pressures on ecological condition
Alterations to a river’s flow regime from water resource development have important ecological consequences for freshwater species. The ecological condition of rivers is tightly linked to their flow regime.3 Changing a river’s flow regime can alter conditions required for populations of freshwater fishes, birds, macroinvertebrates and plants to persist in the long term. For example, the lifecycles of native freshwater species are adapted to a particular flow regime, which controls reproduction, migration, the amount and quality of habitat, and food availability. Globally, changes to flow regimes have been tied to declines in the number of different species that live in freshwater ecosystems. In the ACT, changes to our river flow regimes caused by river regulation have resulted in decreases in ecological condition, especially during drought.49-51
The pressure placed on ecological function by river regulation in the ACT is managed through environmental flow allocations, which have been effective in maintaining functioning ecological communities (fish, macroinvertebrates and algae).49-52 In 2011–2015, ecological condition (AUSRIVAS O:E score) downstream of dams on the Cotter River (Cotter and Corin) and Queanbeyan River (Googong Dam) was assessed as significantly impaired, but similar to reference (Bendora Dam). Therefore, it is likely that river regulation is having an influence on ecological condition, but the pressure is being offset by environmental flow releases.
Case study 6.3 shows how the Upper Murrumbidgee Fish Monitoring Program is informing water management actions.
How is our environment faring?
211ACT STATE OF THE ENVIRONMENT REPORT 2015
6 Water
Case study 6.3 Upper Murrumbidgee Fish Monitoring Program for the Murrumbidgee to Googong (M2G) pipeline impact assessment
To improve water security for the ACT, a pipeline to
transfer water from the Murrumbidgee River at Angle
Crossing to Googong Reservoir (M2G) via Burra Creek
has been constructed. The M2G infrastructure will be
able to remove up to 100 megalitres of water per day.
The Murrumbidgee River is the largest river in the ACT
region and supports a number of native fish species,
including Murray Cod, Trout Cod and Macquarie Perch.
These species are threatened by a number of existing
processes such as sedimentation and loss of habitat,
which have been exacerbated by flow reduction
following the construction of Tantangara Dam in the
Murrumbidgee’s headwaters.
The Upper Murrumbidgee Fish Monitoring Program has
an important role in assessing the effects of the M2G
abstraction scheme on the fish community of the upper
Murrumbidgee River. The results from the program are
used by the ACT Government and Icon Water to inform
management actions related to water abstraction from
the Murrumbidgee River.
The aims of the program are to:53
• assess the fish community of the upper Murrumbidgee River
• confirm the presence of threatened fish species in the upper Murrumbidgee River
• continue a baseline study of the fish community in the upper Murrumbidgee River upstream and downstream of the M2G abstraction point to enable assessment of the impacts of future M2G abstraction on fish communities (to date, M2G has not been used to extract water for supply).
Three sites are surveyed upstream of the abstraction
point, one site at the abstraction point, and three sites
below the abstraction point. The survey is conducted
every two years, and the most recent survey for which
there are available results was done in 2013.
2013 program results
In the 2013 survey, Carp dominated the fish catch,
forming more than 73% of fish biomass at each site.
Despite the dominance of Carp, threatened species
were recorded at all but one of the sites. Key findings
from the 2013 survey include:
• juvenile Murray Cod caught above and below Angle Crossing
• Macquarie Perch recorded above Angle Crossing and, for the first time in this program, at Casuarina Sands.
Juvenile Murray Cod, Carp and Macquarie Perch (left to right) captured during the 2013 survey
Photos: Mark Jekabsons, ACT Government
continued
How is our environment faring?
212 ACT STATE OF THE ENVIRONMENT REPORT 2015
6 Water
Case study 6.3 continued
M2G abstraction point at Angle Crossing on the Murrumbidgee River
Photo: University of Canberra
Boat electrofishing
Photo: Mark Jekabsons, ACT Government
Assessment summary for indicators of water resource development pressures
Assessment grade Confidence
Very poor (high pressure)
Very good (low pressure)
In state grade
In trend grade
Water resource development
A A•Grade is based on average from overall river discharge and ecological condition. Trend of water resource development pressures is based on projections from the Industry Panel regulated water and sewerage services final report.48
Recent trends •
•
Improving
Deteriorating
•
•
Stable
Unclear
Confidence A Adequate high-quality evidence and high level of consensus
A Limited evidence or limited consensus
A Evidence and consensus too low to make an assessment
How is our environment faring?
213ACT STATE OF THE ENVIRONMENT REPORT 2015
6 Water
Resilience to pressures
A resilience assessment involves looking at the systems, networks, human resources and feedback loops involved in maintaining environmental values (see Chapter 9).
A resilient water supply and management system in the ACT would mean that valued aspects of the water system are maintained or improved despite major disturbances. Pressures and shocks threatening the water system would be regarded as opportunities for innovation and adaptation. This is in contrast to vulnerable water supply and management, in which shocks and disturbances lead to dramatic negative consequences, and learning and adaptation does not occur.41
The first step to assess the resilience of the water systems in the ACT is to identify the range of values and benefits that need to be protected, as well as the pressures and risks that threaten them.
Some of the outcomes desired from management of water are well articulated and agreed to. For example, there are shared societal values regarding the need for high-quality drinking water, and adequate quantities of water to support human use, urban aesthetic values and, increasingly, the natural environment. Appropriate management of stormwater is needed to protect human health, private property, public infrastructure and downstream ecosystems. However, with the exception of clearly specified needs related to some fish species and large vertebrates, there is less clear specification of the ecological values we wish to support through water management. Processes of integrated catchment management are providing opportunities to discuss and identify desired outcomes from water management.
Some of the processes that threaten the ability to achieve the water quality and quantity outcomes we desire are well understood, while others are less so. For example, threats presented by some forms of pollution or events such as fire, drought, loss of vegetation cover and erosion are reasonably well known, whereas knowledge on other threats is still emerging. There is also growing recognition of the need to understand landscape- and regional-scale threats and relative trade-offs. Investment in projects such as the $85 million ACT Basin Priority
Project is helping us to identify and respond to some key threats. There are multiple opportunities to identify emerging or new threats, particularly with the establishment of initiatives such as the ACT and Region Catchment Coordination Committee.
As well as recognising the pressures, resilience also relies on monitoring to ensure that the impacts of pressures are identified and corrected promptly. The ACT has access to a large body of expertise in water science, with strong linkages between researchers and government agencies. In the ACT, there is good monitoring of some aspects of water quality – for example, the quality of drinking water, of water flowing from sewage treatment plants and of water in the stormwater system. Some gaps exist in monitoring of ecological quality, despite increased investment in monitoring points. There is limited monitoring of the processes that cause changes to water quality, such as changes in vegetation cover, limiting the ability to predict when a threshold is being approached, and therefore at which point water quality may be threatened.
Resilience is recognised as an important condition for a Water Sensitive City, which was developed and refined by researchers and practitioners in Australia and has been adopted as one of the goals of the National Water Initiative.41,54,55 The core principles underpinning the approach are useful for building resilience in city water systems:
• There is diversity in water sources, and diversity of centralised and decentralised infrastructure. This helps to safeguard water supply when any one or number of water sources and infrastructure fail. It is likely to involve increasing a city’s capacity to harness water from sources such as urban stormwater, groundwater, rainwater from roofs and recycled wastewater. Although the ACT currently has limited diversity in its water sources, the new water strategy, ACT Water Strategy 2014–44: Striking the Balance, aims to secure long-term water supplies and promote the sustainable use of water, and may go some way to improving resilience in this area.
How is our environment faring?
214 ACT STATE OF THE ENVIRONMENT REPORT 2015
6 Water
• Urban water systems provide ecosystem services. Water is often a critical part of green infrastructure within cities because of its amenity and aesthetic values. There is also significant opportunity to connect urban water resources and infrastructure with the ecological functioning of urban environments, in a manner that also protects downstream aquatic ecosystems. Constructed wetlands and similar initiatives are an example of how stormwater management can deliver multiple ecosystem services. The ACT has many urban water features and green spaces that contribute to ecosystem services. Although the urban lakes come under pressure from pollutants and excess nutrients that cause algal growth, there is strong government and community support for the preservation and improvement of these features.
• There is capacity within social networks and institutions to advance urban sustainable water management. Technology alone cannot deliver sustainable and resilient water systems. Community acceptance, political support and local champions are some of the social aspects that are likely to be important to adapt appropriately to the range of pressures and challenges that bear on urban water systems.41,56,57 In the ACT, there are strong and growing networks of groups discussing water issues. In particular, there is increasing use of integrated catchment management approaches that involve multiple agencies and stakeholder groups.
The ACT has many urban water features and green spaces that contribute to ecosystem services, including Dickson Wetland
Photo: ACT Government
How is our environment faring?
215ACT STATE OF THE ENVIRONMENT REPORT 2015
6 Water
6.4 Response The ACT Government manages the pressures affecting water in the ACT in a variety of ways, which are examined in detail in Chapter 10. Particular features of water management and responses from the reporting period are included in this section.
6.4.1 Legal and policy framework
At the beginning of the reporting period, the 2004 water resource strategy, Think water, act water,58 remained in place. This strategy, which came into operation during the 2000–2010 drought, focused on increasing the efficiency of water use, providing long-term reliable sources of water for the ACT and region, and promoting development and implementation of an integrated approach to ACT–NSW cross-border water supply and management.
A 2011 review of the Think water, act water strategy59 found that significant achievements had been made towards the strategy’s objectives, including:
• achievement of its water use reduction targets
• development of expanded storage capacity with an enlarged Cotter Dam
• implementation of agreements between the ACT, NSW and the Australian Government on cross-border water supply and management
• ratification of a cap on water extractions under the Murray–Darling Basin Agreement, with a base of 40 GL and provision for growth at 75% of the 2006–07 population base
• implementation of water-sensitive urban design rules covering all new developments and some extensions to existing dwellings
• implementation of a range of water efficiency programs in consultation with the community
• review of the environmental flow guidelines
• ongoing development of a catchment management framework to be applied to water supply, and rural and urban catchments across the ACT.
The review of Think water, act water considered that the strategy had successfully guided the ACT to improved water security, and that it was timely to explore potential new strategies for future water needs in the Territory.
In August 2014, the new strategy, ACT Water Strategy 2014–44: Striking the Balance, was released. It contains seven strategies:
• Achieve integrated catchment management across the ACT and region.
• Protect and restore aquatic ecosystems in urban and nonurban areas.
• Manage stormwater and flooding.
• Secure long-term water supplies.
• Manage and promote the sustainable use of water.
• Provide clean and safe water for the ACT.
• Engage the community on understanding and contributing to a more sustainable city.
An implementation plan for the first five years of the strategy has been published.60
6.4.2 Management of pressuresIn 2011–2015, major progress was made in increasing the ACT’s water storage capacity and establishing integrated catchment management as a fundamental part of the ACT’s water cycle management.
Prospects for the improvement of water quality in the ACT region were greatly improved by the announcement of an agreement between the Australian and ACT governments in February 2014 for up to $85 million to be spent on water quality improvements under the ACT Basin Priority Project. This project focuses on six priority catchments that account for 74% of total run-off and 54% of total pollutant load in ACT waterways.61
The management effectiveness assessment for this report found that there is:
• sound knowledge about water quality and the factors that influence it
• effective planning for water in the ACT.
How is our environment faring?
216 ACT STATE OF THE ENVIRONMENT REPORT 2015
6 Water
It noted the strong focus on healthy catchments and waterways, a sustainable water supply used efficiently and community engagement (see Case study 6.4). As noted in the assessment, the ACT Water Strategy is
a key initiative in delivering positive water outcomes for the ACT, but it is too early to determine if the outputs from the strategy are reducing threats to water resources.
Case study 6.4 Community water quality monitoring – Waterwatch Catchment Health Indicator Program
Upper Murrumbidgee
Waterwatch engages
with the community
to monitor, raise
awareness and educate
about, restore and protect our local waterways. A key
output of this program is the annual Catchment Health
Indicator Program (CHIP) report. The CHIP report
provides a score of waterway health using data collected
by Waterwatch volunteers. In 2013, CHIP was reviewed
by the University of Canberra, and it was recommended
that the data be displayed in smaller waterway sections
(reaches). This allows for a finer-scale assessment of
the condition of our waterways (where data exist) and
highlights areas in the catchment that are currently not
sampled.
How does CHIP work?
Waterwatch volunteers and coordinators collect data
relating to water quality (monthly), macroinvertebrates
(autumn and spring) and riparian condition (biennial).
Data on riparian condition were not included in the
2013–14 report because of funding issues, but riparian
condition data are currently being collected for the
2014–15 report. Data are collated for an individual
reach, from which a score is calculated to indicate
the health of that stretch of waterway.
2013–14 CHIP results
In 2013–14, more than 160 volunteers from four
catchment areas recorded data from 1184 water quality
surveys and 78 macroinvertebrate surveys across
184 sites. This sampling covered 63 reaches spread across
Cooma (15 reaches) and Molonglo (21 reaches), spanning
a total catchment area of 8600 square kilometres.
A range of key issues were identified as posing threats
to the health of our local waterways. High turbidity
levels due to sediments entering waterways during
rainfall events were observed, along with increased
levels of nutrients (total phosphorus and nitrates)
from both rural and urban sources. High electrical
conductivity was common; however, this in part may
be a result of the underlying natural geology of the
catchments. There was a general trend of decreasing
ecological health in the downstream reaches.
Expected outcomes of CHIP and why it is important
The CHIP approach provides a holistic indication of
waterway health by using not just water quality data
but other volunteer-collected data as well, such as
macroinvertebrates and riparian vegetation. This
fine-scale assessment should provide more meaningful
indications of catchment health. All the data and reports
will be available online for the community to access
and understand the health of their local waterway.
Information gathered by Waterwatch will be used to
assist with the $85 million ACT Basin Priority Project
to improve long-term water quality in the ACT and
Murrumbidgee River.
Waterwatch water quality monitoring on the Murrumbidgee River
Photo: Bush Heritage
How is our environment faring?
217ACT STATE OF THE ENVIRONMENT REPORT 2015
6 Water
References1. Vörösmarty CJ, Lévêque C & Revenga C (2005). Fresh
water. In: Ecosystems and human well-being: current state and trends, vol 1, Hassan R, Scholes RJ & Ash N (eds), Island Press, Washington, DC, 165–208.
2. Tilman D, Cassman KG, Matson PA, Naylor R & Polasky S (2002). Agricultural sustainability and intensive production practices. Nature 418(6898):671–677.
3. Poff NL, Allan JD, Bain MB, Karr JR, Prestegaard KL, Richter BD, Sparks RE & Stromberg JC (1997). The natural flow regime. BioScience 47(11):769–784, doi: 10.2307/1313099.
4. Bureau of Meteorology & CSIRO (2014). State of the climate 2014, Commonwealth of Australia, Canberra, www.bom.gov.au/state-of-the-climate.
5. Hennessy K, Nicholls N, Bathols J, Suppiah R & Ricketts J (2005). Climate change impacts on fire-weather in south-east Australia, CSIRO, Victoria.
6. Durack PJ, Wijffels SE & Matear RJ (2012). Ocean salinities reveal strong global water cycle intensification during 1950 to 2000. Science 336(6080):455–458, doi: 10.1126/science.1212222.
7. Johnstone P, Adamowicz RC, de Haan F, Ferguson B & Wong T (2012). Liveability and the water sensitive city: science-policy partnership for water sensitive cities, Cooperative Research Centre for Water Sensitive Cities, Melbourne, http://watersensitivecities.org.au/wp-content/uploads/2013/09/LiveabilityandtheWaterSensitiveCity.pdf.
8. Australian Bureau of Statistics (2014). Agricultural water use. In: Water use on Australian farms, 2012–13, ABS, Canberra.
9. Lu L & Hedley D (2004). Economic roundup autumn 2004: the impact of the 2002–03 drought on the economy and agricultural employment, http://archive.treasury.gov.au/documents/817/HTML/docshell.asp?URL=03_article_2.asp.
10. SEQ Catchments (n.d.). Ecosystem services: water quality, http://www.ecosystemservicesseq.com.au/step-5-services/air-quality.
11. White I, Wade A, Worthy M, Mueller N, Daniell TM & Wasson R (2006). The vulnerability of water supply catchments to bushfires: impacts of the January 2003 wildfires on the Australian Capital Territory. Australian Journal of Water Resources 10(2):179–194.
12. Smith H, Cawson J, Sheridan G & Lane P (2011). Desktop review: impact of bushfires on water quality, report for the Australian Government Department of Sustainability, Environment, Water, Population and Communities, University of Melbourne, Melbourne.
13. Harrison ET, Dyer F, Wright DW & Levings C (2014). Historical land-use influences the long-term stream turbidity response to a wildfire. Environmental Management 53(2):393–400, doi: 10.1007/s00267-013-0193-7.
14. Dyer F, El Sawah S, Lucena-Moya P, Harrison ET, Tschierschke A, Kath J, Reynoldson T & Jakeman A (2013). Predicting water quality and ecological responses, National Climate Change Adaptation Research Facility, Gold Coast.
15. CSIRO (2008). Water availability in the Murrumbidgee: report to the Australian Government from the CSIRO Murray–Darling Basin Sustainable Yields Project, Australia, 155.
16. Wu C, Maurer C, Wang Y, Xue S & Davis DL (1999). Water pollution and human health in China. Environmental Health Perspectives 107(4):251–256.
17. Allan JD (2004). Landscapes and riverscapes: the influence of land use on stream ecosystems. Annual Review of Ecology, Evolution, and Systematics 35(1):257–284, doi: doi:10.1146/annurev.ecolsys.35.120202.110122.
18. Environment Protection Regulation 2005 (ACT).
19. Australian and New Zealand Environment and Conservation Council & Agriculture and Resource Management Council of Australia and New Zealand (2000). National water quality management strategy: Australian and New Zealand guidelines for fresh and marine water quality, ANZECC & ARMCANZ, Canberra.
20. ACT Environment and Sustainable Development Directorate (2012). ACT water report, ACT Government, Canberra.
21. Boulton AJ, Brock MA, Robson BJ, Ryder DS, Chambers JM & Davis JA (2014). Australian freshwater ecology processes and management. John Wiley and Sons, West Sussex, United Kingdom.
22. ACT Environment and Planning Directorate (2014). ACT water strategy 2014–44: striking the balance. ACT Government, Canberra.
23. Lapworth DJ, Baran N, Stuart ME & Ward RS (2012). Emerging organic contaminants in groundwater: a review of sources, fate and occurrence. Environmental Pollution 163(0):287–303, doi: http://dx.doi.org/10.1016/j.envpol.2011.12.034.
24. Katic P & Grafton RQ (2011). Optimal groundwater extraction under uncertainty: resilience versus economic payoffs. Journal of Hydrology 406(3–4):215–224, doi: http://dx.doi.org/10.1016/j.jhydrol.2011.06.016.
25. Amerasinghe N, O’Brien A & Mullen I (2013). ACT groundwater recharge assessment: supplementary data collection and recharge determination for five sub-catchments in the ACT, ACT Environment and Sustainable Development Directorate, Canberra.
26. Knobeloch L, Salna B, Hogan A, Postle J & Anderson H (2000). Blue babies and nitrate-contaminated well water. Environ Health Perspect 108(7):675–678.
27. Schlesinger WH (2009). On the fate of anthropogenic nitrogen. Proceedings of the National Academy of Sciences of the United States of America 106(1):203–208, doi: 10.1073/pnas.0810193105.
28. National Health and Medical Research Council & National Resource Management Ministerial Council (2011). Australian drinking water guidelines, paper 6, National water quality management strategy. NHMRC & NRMMC, Canberra.
29. Australian Bureau of Statistics (2013). Sources of water and its uses. In: Environmental issues: water use and conservation, ABS, Canberra.
31. Nichols SJ, Coysh JL, Sloane PIW, Williams CC & Norris RH (2000). AUStralian RIVer Assessment System (AUSRIVAS) sampling and processing manual, Cooperative Research Centre for Freshwater Ecology, University of Canberra, Canberra.
32. Sloane P, Coysh J, Davies N & Norris R (2000). ACT component of the first national assessment of river health final report autumn and spring 1997, 1998, 1999, report to Department of Urban Services, Cooperative Research Centre for Freshwater Ecology, University of Canberra, Canberra.
33. Lucena-Moya P, Brawata R, Kath J, Harrison E, ElSawah S & Dyer F (2015). Discretization of continuous predictor variables in Bayesian networks: an ecological threshold approach. Environmental Modelling & Software 66(0):36–45, doi: http://dx.doi.org/10.1016/j.envsoft.2014.12.019.
34. Harding JS, Benfield EF, Bolstad PV, Helfman GS & Jones EBD (1998). Stream biodiversity: the ghost of land use past. Proceedings of the National Academy of Sciences of the United States of America 95(25):14843–14847.
35. Spalding RF & Exner ME (1993). Occurrence of nitrate in groundwater—a review. Journal of Environmental Quality 22(3):392–402, doi: 10.2134/jeq1993.00472425002200030002x.
36. ACTEW Water (2014). Annual drinking water quality report 2013–14, ACTEW Corporation Ltd, Canberra.
37. Thomson JR, Bond NR, Cunningham SC, Metzeling L, Reich P, Thompson RM & Mac Nally R (2012). The influences of climatic variation and vegetation on stream biota: lessons from the Big Dry in southeastern Australia. Global Change Biology 18(5):1582–1596, doi: 10.1111/j.1365-2486.2011.02609.x.
38. Murphy BF & Timbal B (2008). A review of recent climate variability and climate change in southeastern Australia. International Journal of Climatology 28(7):859–879, doi: 10.1002/joc.1627.
39. Leigh C, Bush A, Harrison ET, Ho SS, Luke L, Rolls RJ & Ledger ME (2014). Ecological effects of extreme climatic events on riverine ecosystems: insights from Australia. Freshwater Biology, doi: 10.1111/fwb.12515.
40. Intergovernmental Panel on Climate Change (2014). Summary for policymakers. In: Climate change 2014: impacts, adaptation, and vulnerability. Part A: Global and sectoral aspects. Contribution of Working Group II to the Fifth Assessment Report of the Intergovernmental Panel on Climate Change, Field CB, Barros VR, Dokken DJ, Mach KJ, Mastrandrea MD, Bilir TE, Chatterjee M, Ebi KL, Estrada YO, Genova RC, Girma B, Kissel ES, Levy AN, Maccraken S, Mastradrea PR & White LL (eds), Cambridge University Press, United Kingdom, 1–32.
41. Wong THF & Brown RR (2009). The water sensitive city: principles for practice. Water Science & Technology 60(3):673–682, doi: 10.2166/wst.2009.436.
42. Whitworth KL, Baldwin DS & Kerr JL (2012). Drought, floods and water quality: drivers of a severe hypoxic blackwater event in a major river system (the southern Murray–Darling Basin, Australia). Journal of Hydrology 450–451(0):190–198, doi: http://dx.doi.org/10.1016/j.jhydrol.2012.04.057.
43. Delpla I, Jung AV, Baures E, Clement M & Thomas O (2009). Impacts of climate change on surface water quality in relation to drinking water production. Environment International 35(8):1225–1233, doi: http://dx.doi.org/10.1016/j.envint.2009.07.001.
44. Lake PS (2003). Ecological effects of perturbation by drought in flowing waters. Freshwater Biology 48(7):1161–1172, doi: 10.1046/j.1365-2427.2003.01086.x.
45. CSIRO & Bureau of Meteorology (2015). Climate change in Australia: information for australia’s natural resource management regions – technical report, Australia.
46. Steffen W (2015). Quantifying the impact of climate change on extreme heat in Australia, Climate Council of Australia, Sydney.
47. Gleick PH & Palaniappan M (2010). Peak water limits to freshwater withdrawal and use. Proceedings of the National Academy of Sciences 107(25):11155–11162, doi: 10.1073/pnas.1004812107.
48. Industry Panel (2015). Industry Panel Review of the Independent Competition and Regulatory Commission’s 2013 Price Direction for Regulated Water and Sewerage Services in the ACT, ACT Government, Canberra.
49. Chester H & Norris R (2006). Dams and flow in the Cotter River, Australia: effects on instream trophic structure and benthic metabolism. Hydrobiologia 572(1):275–286, doi: 10.1007/s10750-006-0219-8.
50. Nichols S, Norris R, Maher W & Thoms M (2006). Ecological effects of serial impoundment on the Cotter River, Australia. Hydrobiologia 572(1):255–273, doi: 10.1007/s10750-005-0995-6.
51. White HL, Nichols SJ, Robinson WA & Norris RH (2012). More for less: a study of environmental flows during drought in two Australian rivers. Freshwater Biology 57(4):858–873, doi: 10.1111/j.1365-2427.2011.02732.x.
52. Broadhurst BT, Dyer JG, Ebner BC, Thiem JD & Pridmore PA (2011). Response of Two-Spined Blackfish Gadopsis bispinosus to short-term flow fluctuations in an upland Australian stream. Hydrobiologia 673(1):63–77, doi: 10.1007/s10750-011-0750-0.
53. Beitzel M, Evans L & Jekabsons M (2013). Baseline fish monitoring program of the Murrumbidgee River for the Murrumbidgee to Googong Water Transfer Project, Conservation Planning and Research, ACT Government, Canberra.
54. Water for Liveability Centre (n.d.). Defining water sensitive cities, www.waterforliveability.org.au/?page_id=1695.
55. Water for Liveability Centre (n.d.). What is a water sensitive city, www.waterforliveability.org.au/?page_id=1706.
56. Brown RR & Farrelly MA (2009). Delivering sustainable urban water management: a review of the hurdles we face. Water Science & Technology 59(5):839–846, doi: 10.2166/wst.2009.028.
57. Brown RR, Keath N & Wong THF (2009). Urban water management in cities: historical, current and future regimes. Water Science & Technology 59(5):847–855, doi: 10.2166/wst.2009.029.
58. ACT Government (2004). Think water, act water strategy, ACT Government, Canberra.
59. ACT Environment and Sustainable Development Directorate (2012). Review of think water, act water, ACT Government, Canberra, www.environment.act.gov.au/__data/assets/pdf_file/0004/575878/TWAW_Review.pdf.
60. ACT Environment and Planning Directorate (2014). ACT water strategy 2014–44: implementation plan 1 (2014–2018), ACT Government, Canberra, www.environment.act.gov.au/water/water-strategies-and-plans/act_water_strategy/draft-act-water-strategy-implementation-plan-1-2014-18.