19
60 th AMEU CONVENTION TOWARDS SUSTAINABLE REDs PRESENTED BY DR WILLIE DE BEER, COO: EDI HOLDINGS 17 OCTOBER 2007
| Date post: | 28-Dec-2015 |
| Category: |
Documents |
| Upload: | brook-stokes |
| View: | 219 times |
| Download: | 3 times |

60th AMEU CONVENTIONTOWARDS SUSTAINABLE REDs
PRESENTED BY
DR WILLIE DE BEER, COO: EDI HOLDINGS
17 OCTOBER 2007

17 October 2007 Slide 2
Presentation Content
Introduction
Global EDI Reform Drivers
South Africa: EDI Context
Business Model
RED Sustainability
Brief Summary
RED Value Proposition
Global EDI Reform Assessment
Progress Towards Sustainable REDs
Conclusion
17 October 2007 Slide 3
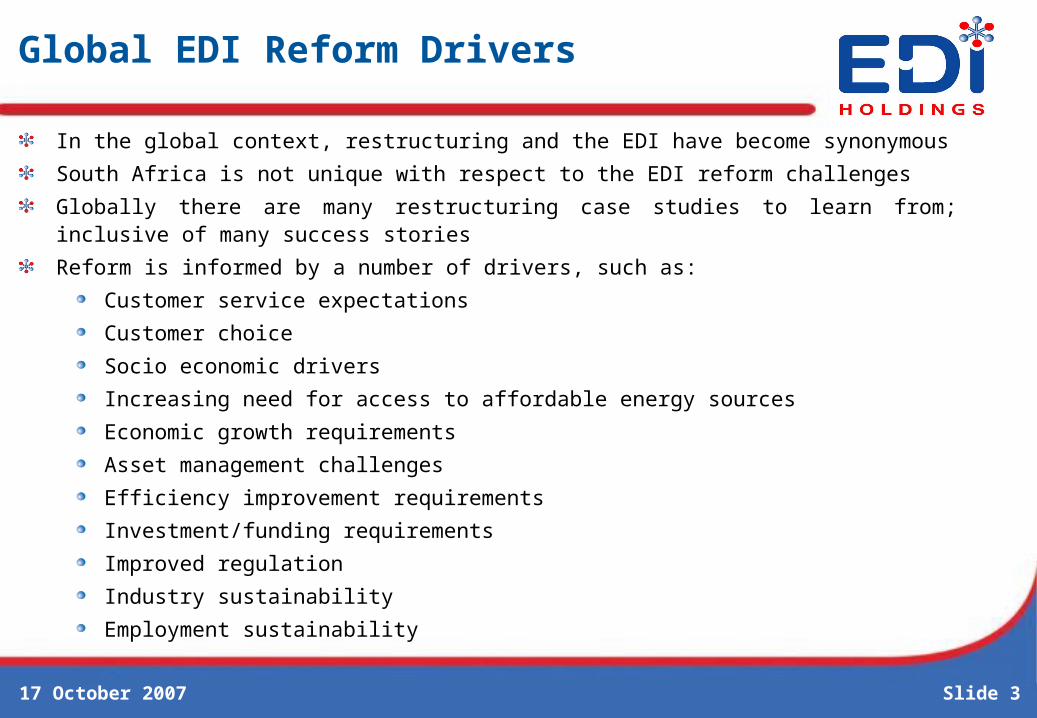
Global EDI Reform Drivers
In the global context, restructuring and the EDI have become synonymous
South Africa is not unique with respect to the EDI reform challenges
Globally there are many restructuring case studies to learn from; inclusive of many success stories
Reform is informed by a number of drivers, such as:
Customer service expectations
Customer choice
Socio economic drivers
Increasing need for access to affordable energy sources
Economic growth requirements
Asset management challenges
Efficiency improvement requirements
Investment/funding requirements
Improved regulation
Industry sustainability
Employment sustainability

17 October 2007 Slide 4
South Africa: EDI Context
The ESI is dominated by Eskom
The EDI in South Africa is confronted with:
Significant inconsistency from a customer service and product offering perspective
Free Basic Electricity
Access to electricity
High level of fragmentation and inefficiencies
Inadequate maintenance, refurbishment and investment in network capacity
Increase in security of supply and reliability challenges
Distribution component of ESI value chain suspect
Demand Side Management (DSM)
Challenges to attract, train and retain resources
Two important differences with respect to EDI restructuring in South Africa:
It takes place in a voluntary environment
There are no privatisation motives
Current asset owners will be the future RED shareholders

17 October 2007 Slide 5
NERSA Report: EDI Maintenance Perspective
Source: NERSA Independent Technical Audit
E=Excellent; VG=Very Good; G=Good; NI=Needs Improvement
Distributor Reliability Control Maintenance Networks Skills Funding
Eskom Region G VG VG-E G-VG VG-E G
Eskom Region G VG VG-E G-VG VG-E G
Metro 1 G VG VG-E VG G G
Metro 2 G VG G G-VG G NI
Metro 3 G G-VG G-VG G-VG G G
Metro 4 G-VG NI I NI G G
Metro 5 NI NI G G-VG NI NI
Municipality 1 NI NI G NI NI NI
Municipality 2 NI NI NI NI G NI
Municipality 3 NI NI NI NI NI NI
Municipality 4 NI NI NI NI NI NI

17 October 2007 Slide 6
EDI: Maintenance and Refurbishment Requirement
0.1
0.6
1.1
1.6
2.1
2.6
R b
illi
on
Required 1.8 2 2 2.2 2.3 2.5
Current 0.4 0.5 0.6 0.63 0.66 0.7
Yr1 Yr2 Yr3 Yr4 Yr5 Yr6

17 October 2007 Slide 7
CREATING SHAREHOLDER
AND CUSTOMER VALUE
REVENUE
EFFIENCY AND CONTINIOUS
BUSINESS IMPROVEMENT
OPERATING & CAPITAL EXPENDITURE
Business Model: RED Sustainability
RED FINANCIALRED FINANCIAL
SUSTAINABILITYSUSTAINABILITY
17 October 2007 Slide 8
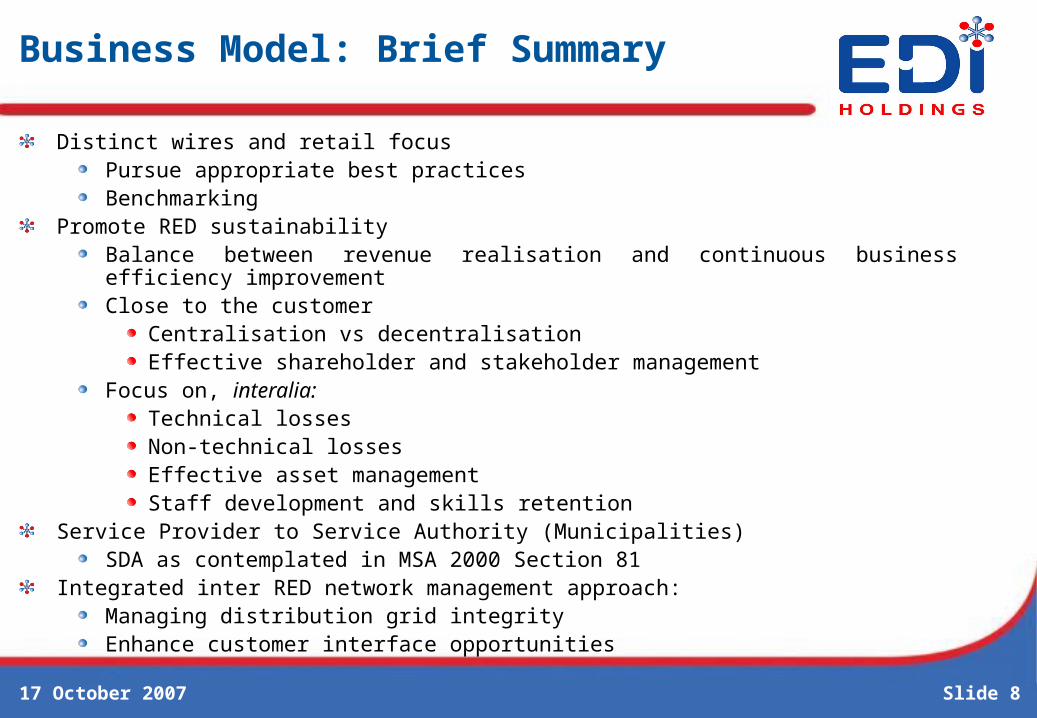
Business Model: Brief Summary
Distinct wires and retail focusPursue appropriate best practicesBenchmarking
Promote RED sustainabilityBalance between revenue realisation and continuous business efficiency improvementClose to the customer
Centralisation vs decentralisationEffective shareholder and stakeholder management
Focus on, interalia:Technical lossesNon-technical lossesEffective asset managementStaff development and skills retention
Service Provider to Service Authority (Municipalities) SDA as contemplated in MSA 2000 Section 81
Integrated inter RED network management approach:Managing distribution grid integrityEnhance customer interface opportunities
17 October 2007 Slide 9
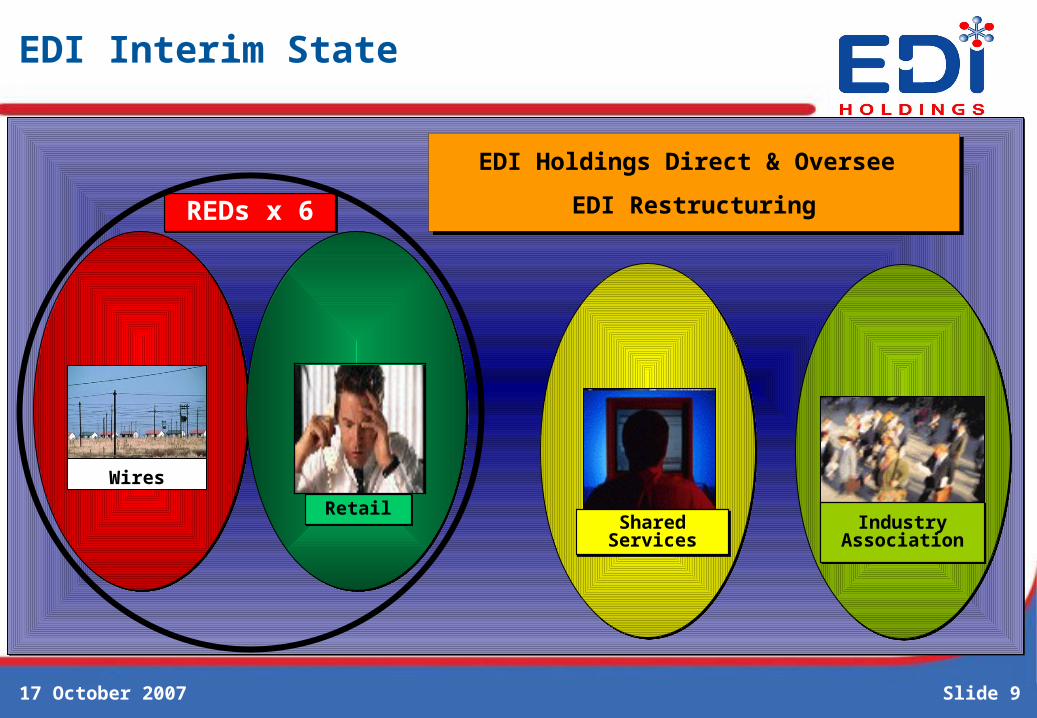
EDI Holdings Direct & Oversee
EDI Restructuring
EDI Holdings Direct & Oversee
EDI Restructuring
EDI Interim State
REDs x 6REDs x 6
Wires
RetailRetailShared
ServicesShared
ServicesIndustry
AssociationIndustry
Association

17 October 2007 Slide 10
RED Value Proposition: Brief Summary
Current Asset Owners
Shareholding in a sustainable business
Derive revenue from a sustainable business
Protection of credit rating
Assets managed in a prudent manner
Customers
Consistency in customer service practices and service offerings
Improved service delivery
Transparent tariffs
Predictable pricing signals
Well regulated industry
Staff
Skills development opportunities
Employment in a sustainable industry

17 October 2007 Slide 11
Staff: Indicative Age Profile
0
5
10
15
20
25
30
35
40
%
0-30 31-40 41-50 51-65
Age Group
17 October 2007 Slide 12
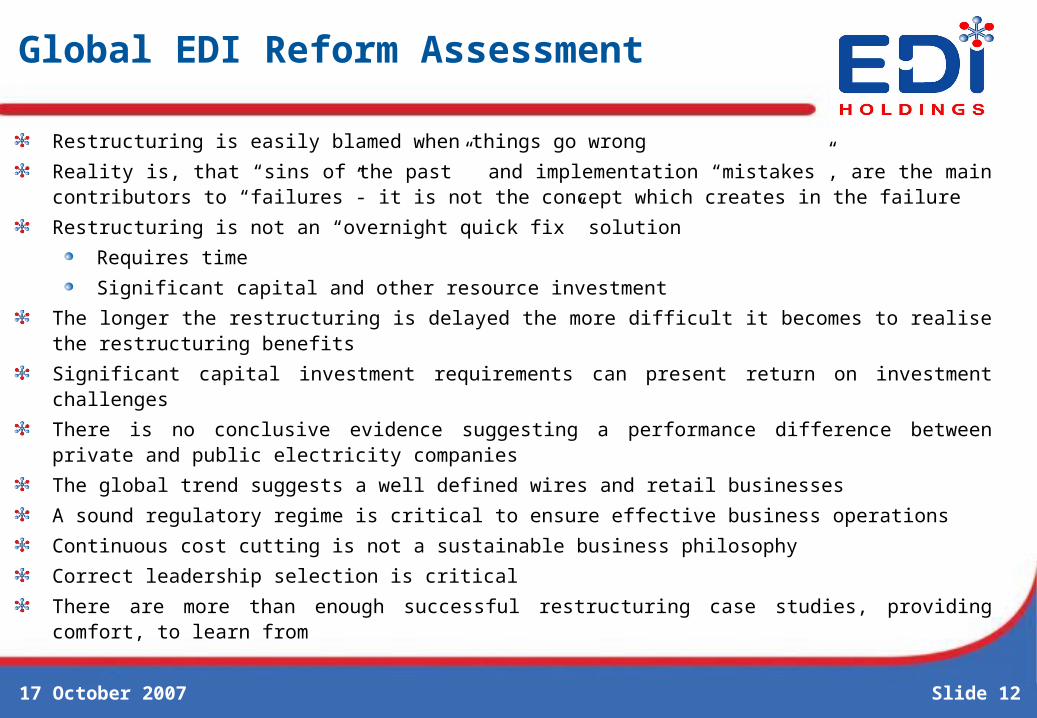
Global EDI Reform Assessment
Restructuring is easily blamed when things go wrong
Reality is, that “sins of the past” and implementation “mistakes”, are the main contributors to “failures”- it is not the concept which creates in the failure
Restructuring is not an “overnight quick fix” solution
Requires time
Significant capital and other resource investment
The longer the restructuring is delayed the more difficult it becomes to realise the restructuring benefits
Significant capital investment requirements can present return on investment challenges
There is no conclusive evidence suggesting a performance difference between private and public electricity companies
The global trend suggests a well defined wires and retail businesses
A sound regulatory regime is critical to ensure effective business operations
Continuous cost cutting is not a sustainable business philosophy
Correct leadership selection is critical
There are more than enough successful restructuring case studies, providing comfort, to learn from
17 October 2007 Slide 13
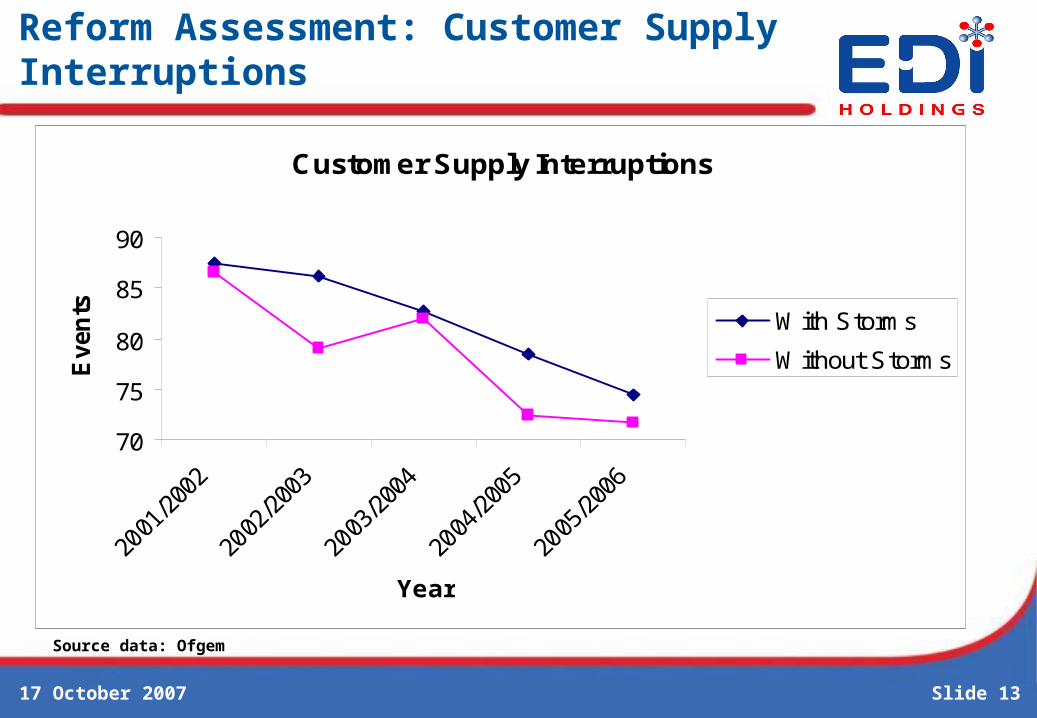
Reform Assessment: Customer Supply Interruptions
Customer Supply Interruptions
70
75
80
85
90
Year
Even
ts With Storms
Without Storms
Source data: Ofgem
17 October 2007 Slide 14
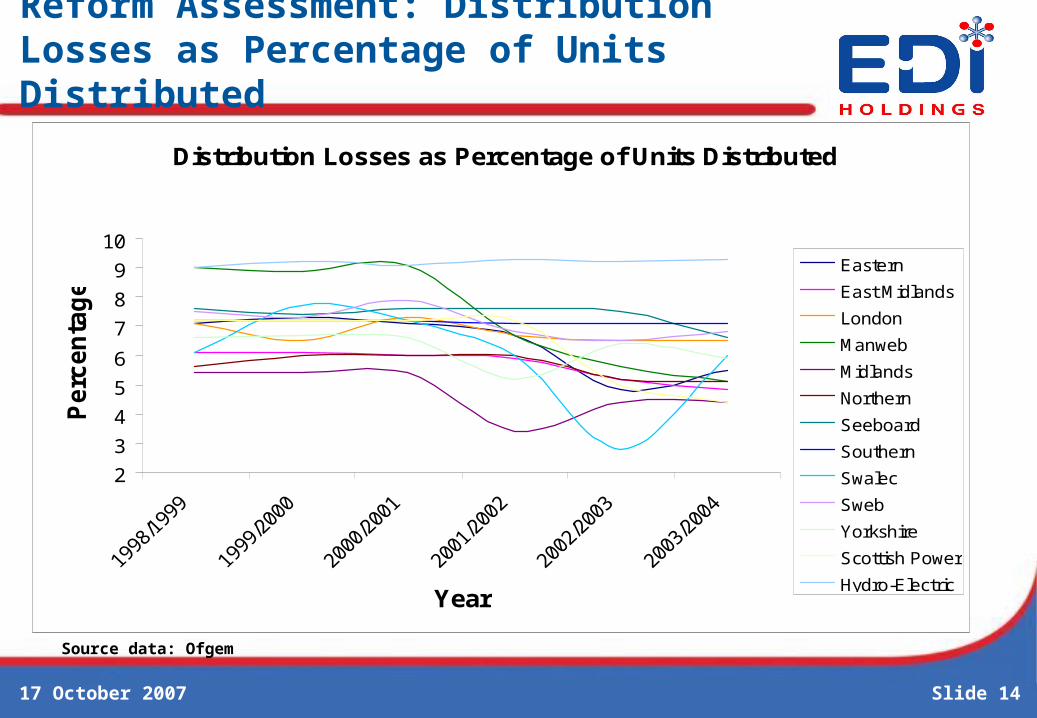
Reform Assessment: Distribution Losses as Percentage of Units Distributed
Distribution Losses as Percentage of Units Distributed
2
3
4
5
6
7
8
9
10
Year
Perc
en
tag
e
Eastern
East Midlands
London
Manweb
Midlands
Northern
Seeboard
Southern
Swalec
Sweb
Yorkshire
Scottish Power
Hydro-Electric
Source data: Ofgem
17 October 2007 Slide 15Slide 15
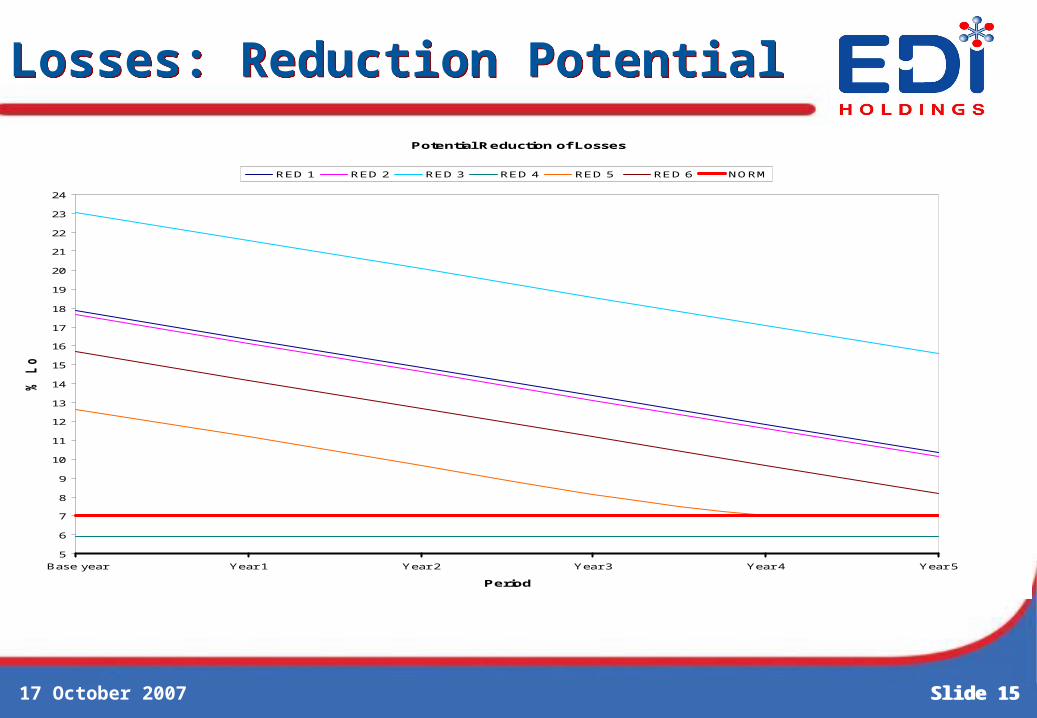
Losses: Reduction PotentialLosses: Reduction Potential
Potential Reduction of Losses
5
6
7
8
9
10
11
12
13
14
15
16
17
18
19
20
21
22
23
24
Base year Year 1 Year 2 Year 3 Year 4 Year 5
Period
% L
oss
RED 1 RED 2 RED 3 RED 4 RED 5 RED 6 NORM
17 October 2007 Slide 16
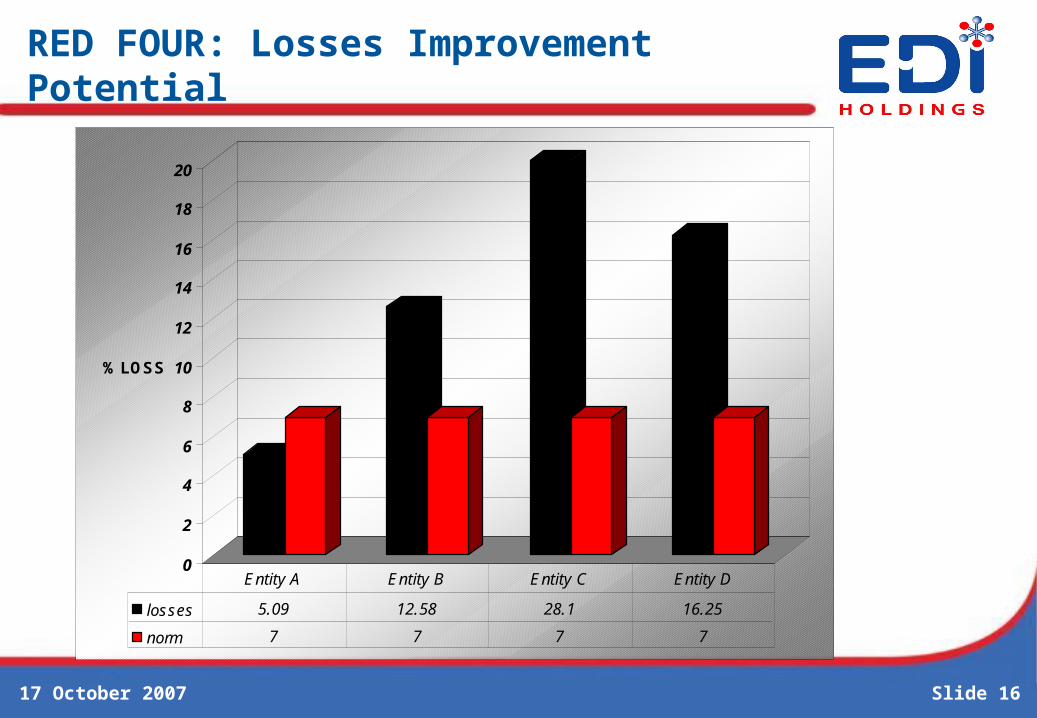
RED FOUR: Losses Improvement Potential
0
2
4
6
8
10
12
14
16
18
20
% LOSS
losses 5.09 12.58 28.1 16.25
norm 7 7 7 7
Entity A Entity B Entity C Entity D

17 October 2007 Slide 17
Progress Towards Sustainable REDs
2003 to 2004 2005 to 2006 2007 to Date
o EDI Holdings establishedo Eskom Distribution ringfenced
within Eskom Holdingso Boundaries for the six REDs
definedo Eskom and SALGA signed the
accession to the co-operative agreement
o EDI Holdings developed various tools to reduce cost and to facilitate the restructuring process
o Eskom Distribution (7 Regions) aligned with the boundaries of the six REDs
o RED project governance structures implemented
o Transitional Labour Relation Structure (TLRS) established
o Metros and numerous municipalities started the MSA Sect 78 process and business ringfencing
o NERSA approved (April 2006) through the MYPD R1.2bn over a 3 year period to assist in funding some of the EDI restructuring costs
o 25th October 2006 Cabinet reconfirmed support to the creation of six wall to wall REDs as Public Entities
o RED 1 was established (June 2005)as a Municipal Entity wholly owned by the City of Cape Town
o Municipal electricity business asset transfer enabling mechanism approved by National Treasury
o Eskom Distribution 95% ringfenced
o Boundary energy metering installed as per the six RED footprint
o 78 Municipalities (ITD) signed the accession to the co-operative agreement
o Six Regional Engagement Forums (REF) established to enhance participation in the RED establishment process
o RTLRS roll out in progresso City of Cape Town took a
resolution to liquidate RED 1o Extensive progress towards a
REDs system solution o MFPF Act promulgated

17 October 2007 Slide 18
Conclusion
The EDI in its current format will not be able to underpin the projected economic growth or
provide customers with a reliable electricity supply
There is a need to define the market rules and to establish the market
The critical reform success factors must be addressed
It is essential that South Africa continuous with the EDI restructuring journey
The restructured EDI must be positioned in such a way that it will be able to effectively respond
to any future market structure
Based on the global experience and having considered the proposed RED model for South
Africa; all indications are that the EDI restructuring in South Africa could go down in history as
an example of a successful transformation business case

THANK YOUTHANK YOU
www.ediholdings.co.za


![AMEU newsletter - Oct 2019 · 2020. 8. 5. · AMEU NEWS November 2019 [2] The July 2019 meetings of the AMEU and SARPA KZN Branches took place on the 11th and 12th at the Riverside](https://static.documents.pub/doc/80x56/602ffb5c1edcf402f85adebf/ameu-newsletter-oct-2019-2020-8-5-ameu-news-november-2019-2-the-july-2019.jpg)


