OUTLINEThe Equation of MotionIndications for Mechanical VentilationComplications of Mechanical VentilationVentilator Settings Monitoring the Mechanically Ventilated PatientChoosing Ventilator Settings for Different Forms of Respiratory FailureVentilatory Support Involves Trade-OffsLiberation from Mechanical Ventilation
Mechanical Ventilation
C H A P T E R
Dean R. HessNeil R. MacIntyre
OBJECTIVES1. List the indications for and complications of
mechanical ventilation. 2. Discuss issues related to ventilator-associated
lung injury. 3. Select appropriate ventilator settings. 4. List parameters that should be monitored during
mechanical ventilation. 5. Discuss issues related to liberation from
INTRODUCTIONMechanical ventilation is an important life support technology that is an integral component of critical care. Mechanical ventilation can be applied as nega-tive pressure to the outside of the thorax (e.g., the iron lung) or, most often, as positive pressure to the airway. The desired effect of positive pressure ventila-tion is to maintain adequate levels of PaO2 and PaCO2 while also unloading the inspiratory muscles. Mechani-cal ventilation is a life-sustaining technology, but rec-ognition is growing that when used incorrectly, it can increase morbidity and mortality. Positive pressure ventilation is provided in intensive care units (ICUs), subacute facilities, long-term care facilities, and the home. Positive pressure ventilation can be invasive (i.e., with an endotracheal tube or tracheostomy tube) or noninvasive (e.g., with a face mask). This chapter addresses invasive positive pressure ventilation as it is applied in adults with acute respiratory failure. Modern ventilators used in the intensive care unit are microprocessor controlled and available from several manufacturers (Figure 22–1 and Figure 22–2).
462
60038_CH22_462_500.pdf 46260038_CH22_462_500.pdf 462 11/1/10 11:05 AM11/1/10 11:05 AM
The Equation of MotionPositive pressure, when applied at the air-way opening, interacts with respiratory system (lung and chest wall) compliance, airways resistance, respiratory system inertance, and tissue resistance to produce gas flow into the lung. Inertance and tissue resistance are small and their effects are usually ignored. The interactions of airway pressure (Paw), respiratory muscle pres-sure (Pmus), flow, and volume with respi-ratory system mechanics can be expressed as the equation of motion:
For spontaneous breathing, Paw � 0 and all of the pressure required for ventilation is provided by the respiratory muscles. For full ventilatory support, Pmus � 0 and all of the pressure required for ventilation is provided by the ventilator. For partial ventilatory support, both the ventilator and the respiratory muscles contribute to ventilation.
For full ventilatory support, the ventilator controls either the pressure or the flow and volume applied to the airway. The equation of motion predicts that Paw will vary for a given resistance and compliance if flow and volume are controlled (volume-targeted ventilation). The equation of motion also predicts that flow and volume will vary for a given resistance and compliance if Paw is controlled (pressure-targeted ventilation).
An important point to remember in considering the equation of motion is that in the setting of high minute ventilation, long inspiratory-to-expiratory time ratios, and prolonged expiratory time constants (e.g., as seen in obstructive lung disease), the lungs may not return to the baseline circuit pressure during exhalation. This creates auto-PEEP, which must be counteracted by Pmus and Paw in the equation of motion to affect flow and volume delivery.
Indications for Mechanical VentilationMechanical ventilation is indicated in many situations (Box 22–1).1 Goals of mechanical ventilation are shown in Box 22–2. Although these conditions are useful in the determination of whether mechanical ventilation is needed, clinical judgment is as important as strict adherence to absolute guidelines. One indication for mechanical ventilation is imminent acute respiratory failure; in such cases, initiating mechanical ventilation may prevent overt respiratory failure and respiratory arrest. On the other hand, depression of respiratory drive
FIGURE 22–2 Modern ventilators are electronically and pneumatically controlled. The inspiratory valves control flow, pressure, and FIO2 to the patient. The expiratory valve is closed during the inspiratory phase and the inspiratory valve is closed during the expiratory phase. The expiratory valve controls positive end-expiratory pressure (PEEP). The inspiratory and expiratory valves are controlled by the microprocessor. Sensors measure pressure and flow, which are displayed as numeric and graphic data and determine when an alarm condition is generated.
BOX 22–1
Indications for Mechanical Ventilation
ApneaAcute ventilatory failure (e.g.,
rising Paco2 with acidosis, respiratory muscle dysfunc-tion, excessive ventilatory load, altered central ventila-tory drive)
from drug overdose or from anesthesia involved with major surgery is an indication that does not involve primary respiratory system failure. In short, mechanical ventilation is required when the patient’s capabilities to ventilate the lung and/or effect gas transport across the alveolocapillary interface is compromised to the point that the patient’s life is threatened.
Complications of Mechanical VentilationMechanical ventilation is not a benign therapy, and it can have major effects on the body’s homeostasis (Box 22–3).2 In addition to the serious complications reviewed here associated with positive pressure applied
CHAPTER 22 Mechanical Ventilation464
60038_CH22_462_500.pdf 46460038_CH22_462_500.pdf 464 11/1/10 11:05 AM11/1/10 11:05 AM
to the lungs,3 intubated mechanically ventilated patients also are at risk for complications associated with the use of artificial airways,4 the most serious being accidental disconnection and the development of pneumonia from compromised natural airway defenses. Mechanically ventilated patients are also at risk for gastrointestinal
bleeding5 and often are given antacids, proton pump inhibitors, or histamine (H2) blockers to prevent this complication. The nutritional needs of mechanically ventilated patients play an important role in preventing or promoting complications.6 Undernourished patients are at risk for respiratory muscle weakness and pneumo-nia. An excessive caloric intake, on the other hand, may increase carbon dioxide (CO2) production, which can markedly increase the patient’s ventilatory requirements. Sleep deprivation in mechanically ventilated patients has recently become recognized.7
Ventilator-Induced Lung InjuryThe application of positive pressure to the airways can create lung injury under a variety of circumstances. Pulmonary barotrauma (e.g., subcutaneous emphy-sema, pneumothorax, pneumomediastinum) is one of the most serious complications of excessive pressure and volume delivery to the lung and is a consequence of alveolar overdistention to the point of rupture (Figure 22–3).3 How-ever, even when the lung is not distended to the point of rupture, exces-sive transpulmonary stretching pressures
BOX 22–2
Goals of Mechanical VentilationProvide adequate oxygenationProvide adequate alveolar
beyond the normal maximum (i.e., 30 to 35 cm H2O) can produce a parenchymal lung injury not associated with extra-alveolar air (ventilator-induced lung injury [VILI]).8 Importantly, it is the physical stretching and dis-tention of alveolar structures that causes the injury. This concept has been demonstrated in numerous animal models in which limiting alveolar expansion (e.g., with chest strapping) prevents lung injury even in the face of very high applied airway pressures.8
Clinical trials have confirmed these animal observa-tions and indicate that ventilator strategies exposing injured human lungs to transpulmonary pressuresin excess of 30 to 35 cm H2O are associated with lung injury.9–12 Of note is that this injury may be more than simply the result of excessive end-inspiratory alveo-lar stretch. Excessive tidal stretch (i.e., repetitive tidal volumes greater than 9 mL/kg), even in the setting of maximal transpulmonary pressures less than 30 cm H2O, may contribute to VILI.9,10,13 This provides the rationale for using lung-protective ventilator strategies that limit tidal volume and end-inspiratory distending pressures.
Importantly, this approach may require acceptance of less than normal values for pH and Pao2 in exchange for lower (and safer) distending pressures.
VILI also can result from the cyclical opening of an alveolus during inhalation and closure during exhalation (cyclical atelectasis producing atelectrauma).14,15 Indeed, pressures at the junction between an open and a closed alveolus may exceed 100 cm H2O during this process.16
This injury is reduced with the use of smaller tidal vol-umes and may be ameliorated by optimal lung recruit-ment and an expiratory pressure that prevents alveolar derecruitment. Positive end-expiratory pressure (PEEP), however, can be a two-edged sword. If an increase in PEEP results in an increase in alveolar recruitment, then the stress (distribution of pressure) in the lungs is reduced. If, on the other hand, an increase in PEEP increases end-inspiratory transpulmonary pressure, then the strain (change in size of the lungs during inflation) on the lungs is increased.17 Other ventilatory pattern factors may also be involved in the development of VILI. These include frequency of stretch18 and the acceleration or velocity of stretch.19 Vascular pressure elevations may also contribute to VILI.20
VILI is manifest pathologically as diffuse alveolar damage,7,8,15 and it increases inflammatory cytokines in the lungs (biotrauma).21–24 VILI is also associated with systemic cytokine release and bacterial transloca-tion24 that are implicated in the systemic inflammatory response with multiorgan dysfunction that increases mortality. The way in which the lungs are ventilated may therefore play a role in systemic inflammation (Figure 22–4).
Oxygen ToxicityOxygen concentrations approaching 100% are known to cause oxidant injuries in airways and lung parenchyma.25
Much of the data supporting the concept of oxygen toxic-ity, however, have come from animals that often have quite different tolerances to oxygen than humans. It is unclear
what the safe oxygen concentration or duration of exposure is in sick humans, such as those with acute lung injury (ALI) or acute respiratory distress syn-drome (ARDS). Many authorities have argued that a fraction of inspired oxygen (Fio2) less than 0.4 is safe for prolonged periods of time and that a Fio2 greater than 0.80 should be avoided. However, VILI may be more important clini-cally than oxygen toxicity. In one large study (ARDSnet), survival was greater in patients with ALI/ARDS who were ventilated with a lower tidal volume, presumably avoiding significant VILI, despite the fact that the required Fio2was higher in the group receiving the lower tidal volumes.
FIGURE 22–4 Mechanical ventilation can result in biochemical and biophysical injury to the lungs, which may result in multisystem organ failure. MODS, multiple organ dysfunction syndrome. Adapted from Slutsky AS, Trembly L. Multiple system organ failure: is mechanical ventilation a contributing factor? Am J Respir Crit Care Med. 1998;157:1721–1725.
FIGURE 22–3 Computed tomography scan of the thorax of a mechanically ventilated patient with severe barotrauma. Note the presence of pneumothorax, pneumomediastinum, and subcutaneous emphysema.
CHAPTER 22 Mechanical Ventilation466
60038_CH22_462_500.pdf 46660038_CH22_462_500.pdf 466 11/1/10 11:05 AM11/1/10 11:05 AM
Ventilator-Associated PneumoniaThe natural laryngeal mechanism that protects the lower respiratory tract from aspiration is compromised by an endotracheal tube. This permits oropharyngeal debris to leak into the airways. The endotracheal tube also impairs the cough reflex and serves as a potential portal for pathogens to enter the lungs. The underlying disease process makes the lungs prone to infection. Finally, heavy antibiotic use in the ICU and the presence of very sick patients in close proximity to each other are risk factors for antibiotic-resistant infection.
Preventing ventilator-associated pneumonia (VAP) is important because it is associated with morbidity and mortality.26 VAP prevention has become an impor-tant priority in the mechanically ventilated patient.26–29
Hand washing, elevating the head of the bed, and care-fully choosing antibiotic regimens can have important preventive effects. Circuit changes only when vis-ibly contaminated appear to be helpful.30 Endotracheal tubes that provide continuous drainage of subglottic secretions, endotracheal tubes with specialized cuff designs, and endotracheal tubes made with antimicro-bial materials are other ways of reducing lung contami-nation with oropharyngeal material. However, these tubes are more expensive and their cost-effectiveness is controversial.31
Auto-PEEPAuto-PEEP (also known as intrinsic PEEP or air trap-ping) is the result of the lungs not returning to the base-line proximal airway pressure at end-exhalation. The determinants of auto-PEEP are high minute volume, long inspiratory-to-expiratory time relationships, and long expiratory time constants (i.e., obstructed airways and high-compliance alveolar units). Auto-PEEP raises all intrathoracic pressures, which can affect gas delivery, hemodynamics, end-inspiratory distention (and thus VILI), and patient breath triggering. Although some-times desired in long inspiratory time ventilatory strate-gies, auto-PEEP is generally to be avoided because it is difficult to recognize and to predict its effects.
Hemodynamic Effects of Positive Pressure VentilationBecause positive pressure ventilation increases intratho-racic pressure, it can reduce venous return, which may result in decreased cardiac output and a drop in arterial blood pressure. Fluid administration and drug therapy (such as with vasopressors and inotropes) may be nec-essary to maintain cardiac output, blood pressure, and urine output under these circumstances. Mechanical ventilation also can cause an increase in plasma antidi-uretic hormone (ADH) and a decrease in atrial natri-uretic peptide (ANP), which may reduce urine output and promote fluid retention.32
As intrathoracic pressure increases with positive pressure ventilation, right ventricular filling decreases and cardiac output decreases. This is the rationale for using volume repletion to maintain cardiac output in the setting of high intrathoracic pressure. The effect of reduced cardiac filling on cardiac output may be par-tially counteracted by better left ventricular function due to elevated intrathoracic pressures, which reduce left ventricular afterload.33 In patients with left heart failure, the reduced cardiac fill-ing and reduced left ven-tricular afterload effects of elevated intrathoracic pressure may actually improve cardiac func-tion such that intratho-racic pressure removal may produce left ven-tricular failure if positive pressure ventilation is removed.34
Intrathoracic pres-sure can also influence distribution of perfusion, as described by the West model of pulmonary perfusion. In the supine human lung, blood flow is greatest in zone 3. As intra-alveolar pres-sure rises, there is an increase in zone 2 and zone 1 (dead space) regions, creating high ventilation-perfusion (V�/Q� ) units. Dyspnea, anxiety, and discomfort associated with inadequate ventilatory support can lead to stress-related catecholamine release, with increases in myocardial oxygen demands and risk of dysrhythmias.34 In addition, coronary blood vessel oxygen delivery can be compro-mised by inadequate gas exchange from the lung injury coupled with low mixed venous Po2 due to high oxygen consumption demands by the inspiratory muscles.
Ventilator SettingsVolume Control Versus Pressure ControlWith volume control ventilation (VCV), the ventila-tor controls the inspiratory flow (Figure 22–5). The tidal volume is deter-mined by the flow and the inspiratory time. In practice, however, the flow and tidal volume are set on the ventila-tor. With VCV the tidal volume is delivered regardless of resistance or compliance, and the peak airway pressure varies (Box 22–4). VCV should be used when-ever a constant tidal vol-ume is important in the
RESPIRATORY RECAPIndications for and Complications of Mechanical Ventilation » Mechanical ventilation
is indicated to support oxygenation and ventilation of patients with acute respiratory failure.
» A number of complications are possible with mechanical ventilation, and efforts must be made to minimize these conditions.
RESPIRATORY RECAPVolume Control Versus Pressure Control Ventilation » Volume control: Ventilation
remains constant with changes in respiratory mechanics, but airway and plateau pressures can fluctuate.
» Pressure control: Ventilation fluctuates with changes in respiratory mechanics, but pressure is limited to the peak pressure set on the ventilator.
Ventilator Settings 467
60038_CH22_462_500.pdf 46760038_CH22_462_500.pdf 467 11/1/10 11:05 AM11/1/10 11:05 AM
FIGURE 22–5 (A) Constant-flow (square wave) volume control ventilation. (B) Descending ramp-flow volume control ventilation.
maintenance of a desired Paco2, such as with an acute head injury. The principal disadvantage of VCV is that it can produce a high peak alveolar pressure and areas of overdistention in the lungs. Also, because the inspiratory flow is fixed, VCV can cause patient–ventilator asyn-chrony, particularly if the inspiratory flow is set too low. With VCV, the set flow can be constant or a descending
ramp. A descending ramp flow pattern produces a longer inspiratory time unless the peak flow is increased.
With pressure cont ro l ven t i la t ion (PCV)(Figure 22–6), the airway pressure is set and remains constant despite changes in resistance and compliance. Box 22–5 lists factors that affect the tidal volume with PCV. The principal advantage of PCV is that it prevents
CHAPTER 22 Mechanical Ventilation468
60038_CH22_462_500.pdf 46860038_CH22_462_500.pdf 468 11/1/10 11:05 AM11/1/10 11:05 AM
localized alveolar overdistention with changes in resis-tance and compliance; the peak alveolar pressure can-not be greater than the pressure set on the ventilator. Because the flow can vary with PCV, this mode may
Flow
(L/m
in)
Pres
sure
(cm
H2O
) Vo
lum
e (m
L)
2
40
0
–40
–80 4 6 8 10 12 14
2 Time (s)
800
600
400
200
0 4 6 8 10 12 14
2
50 40 30 20 10
0 4 6 8 10 12 14
FIGURE 22–6 Pressure control ventilation.
BOX 22–4
Factors That Affect Peak Inspiratory Pressure (PIP) with Volume Control Ventilation
Peak inspiratory flow setting: A higher flow setting increases the PIP.
Inspiratory flow pattern: PIP is lower with descending ramp flow.
Positive end-expiratory pressure (PEEP): An increase in PEEP increases the PIP.
Auto-PEEP: Auto-PEEP increases the PIP.
Tidal volume (Vt): An increase in Vt results in a higher PIP.
Resistance: Greater airways resis-tance results in a higher PIP.
Compliance: Decreased compli-ance results in a higher PIP.
BOX 22–5
Factors That Affect Tidal Volume (VT) with Pressure Control Ventilation
Driving pressure: A higher driving pres-sure (difference between peak inspi-ratory pressure and PEEP) increases the Vt.
Auto-PEEP: An increase in auto-PEEP reduces the Vt.
Inspiratory time: An increase in inspira-tory time increases the Vt if inspi-ratory flow is present; after flow decreases to zero, further increases in the time do not affect the Vt.
Compliance: Decreased compliance decreases the Vt.
Resistance: Increased resistance decreases the Vt; after flow decreases to zero, resistance no longer affects the delivered Vt.
Patient effort: Greater inspiratory effort by the patient increases the Vt.
improve patient–ventilator synchrony.35,36 The choice of VCV or PCV often is determined by clinician or institutional bias, and both modes have advantages and disadvantages (Table 22–1).37
Ventilator Settings 469
60038_CH22_462_500.pdf 46960038_CH22_462_500.pdf 469 11/1/10 11:05 AM11/1/10 11:05 AM
■ TABLE 22–1 Advantages and Disadvantages of Volume Control and Pressure Control Ventilation
Type Advantages Disadvantages
Volume control ventilation
Constant tidal volume (VT) with changes in resistance and compliance
Type of ventilation familiar to most clinicians
Increased plateau pressure (Pplat) with decreasing compliance (alveolar overdistention)
Fixed inspiratory flow may cause asynchrony
Pressure control ventilation
Reduced risk of overdistention with changes in compliance.
Variable flow improves synchrony in some patients
Changes in VT with changes in resistance and compliance
Less familiar type of ventilation for most clinicians
Ventilator ModeOptions for breath delivery are referred to as modes of ventilation.38–41 Traditional modes include continu-
ous mandatory ventila-tion (CMV), also called assist/control (A/C), synchronized intermit-tent mandatory ven-tilation (SIMV), and pressure support venti-lation (PSV). The choice of mode often is based on institutional policy or the clinician’s bias. No one mode is clearly superior; each has its advantages and disad-vantages (Table 22–2).
Continuous manda-tory ventilation (CMV)(or assist/control ven-tilation) delivers a set volume or pressure and a minimum respiratory rate (Figure 22–7). The patient can trigger addi-
tional breaths above the minimum rate, but the set volume or pressure remains constant. When mechani-cal ventilation is begun, it often is best to use CMV (assist/control) to produce nearly complete respira-tory muscle rest (i.e., full ventila-tory support). Regardless of the mode used, the goal is to strike a balance between excessive respiratory muscle rest, which promotes atrophy, and exces-sive respiratory muscle activ-ity, which promotes fatigue—or, put more simply, to avoid the extremes of too much rest and too much exercise.
Continuous positive airway pressure (CPAP) is a sponta-neous breathing mode (Fig-ure 22–8). The airway pressure is usually but not necessarily greater than atmospheric pres-sure. CPAP is commonly used as a means of maintaining alveolar recruitment in mild to moder-ate forms of pulmonary edema and parenchymal lung injury. CPAP often is used to evaluate a patient’s ability to breathe spon-taneously before extubation.
Pressure support ventilation (PSV) (Figure 22–9) is a spontaneous breathing mode in which patient effort is augmented by a clinician-determined level of pressure during inspiration.42 Although the clinician sets the level of pressure support, the patient sets the respiratory rate, inspiratory flow, and inspiratory time. The Vt is deter-mined by the level of pressure support, the amount of patient effort, and the resistance and compliance of the patient’s respiratory system.
Pressure support ventilation is a frequently used mode of mechanical ventilation. However, because it is patient triggered, PSV is not an appropriate mode for patients who do not have an adequate respiratory drive. PSV normally is flow cycled, with secondary cycling mechanisms of pressure and time. Although PSV often is considered a simple mode of ventilation, it can be quite complex (Figure 22–10). First, the ventilator must recognize the patient’s inspiratory effort, which depends on the ventilator’s trigger sensitivity and the amount of auto-PEEP. Second, the ventilator must deliver an appropriate flow at the onset of inspiration. A flow that is too high can produce a pressure overshoot, and a flow that is too low can result in patient flow starvation and asynchrony. Third, the ventilator must appropriately
cycle to the expiratory phase without the need for active exhalation.
The flow at which the ventilator cycles to the expira-tory phase during PSV can be a fixed absolute flow, a flow based on the peak inspiratory flow, or a flow based on peak inspiratory flow and elapsed inspiratory time. Several studies have reported asynchrony with PSV in individuals with airflow obstruction, such as chronic obstructive pulmonary disease (COPD).43,44 With airflow obstruction, the inspiratory flow decreases slowly during PSV, and the flow necessary to cycle may not be reached; this course of action stimulates active exhalation to pres-sure cycle the breath. The problem increases with higher levels of PSV and with higher levels of airflow obstruc-tion. On newer ventilators, the termination flow can
Ventilator Settings 471
60038_CH22_462_500.pdf 47160038_CH22_462_500.pdf 471 11/1/10 11:05 AM11/1/10 11:05 AM
exceeds the termination flow at which the ventilator cycles, either active exhalation occurs to terminate inspi-ration, or a prolonged inspiratory time is applied. With a leak, either PCV or a ventilator that allows an adjustable termination flow should be used. Another option is to
Flow
(L/m
in)
Pres
sure
(cm
H2O
) Vo
lum
e (m
L)
2
40 30 20 10
0 –10 –20 –30 –40 –50
4 6 8 10 12 14
2 Time (s)
600 500 400 300 200 100
0 4 6 8 10 12 14
2
24 20 16 12
8 4 0
4 6 8 10 12 14
FIGURE 22–8 Continuous positive airway pressure.
FIGURE 22–9 Pressure support ventilation.
be adjusted to a level appropriate for the patient (Figure 22–11).
Another concern with PSV is leaks in the system, such as with a bronchopleural fistula, uncuffed airway, or mask leak with noninvasive ventilation. If the leak
Flow
(L/m
in)
Pres
sure
(cm
H2O
) Vo
lum
e (m
L)
2
60 40 20
0 –20 –40 –60
4 6 8 10 12 14
2 Time (s)
600 500 400 300 200 100
0 4 6 8 10 12 14
2
24 20 16 12
8 4 0
4
Trigger
6 8 10 12 14
CHAPTER 22 Mechanical Ventilation472
60038_CH22_462_500.pdf 47260038_CH22_462_500.pdf 472 11/1/10 11:05 AM11/1/10 11:05 AM
set a maximum inspiratory time during PSV such that the breath can be time cycled at a clinician-determined setting. This secondary cycle typically has been fixed at a prolonged time to prevent untoward effects of long inspiratory times. Some new ventilators allow both the flow cycle and time cycle to be set.
The flow at the onset of the inspiratory phase may also be important during PCV or PSV. This is called rise time and refers to the time required for the ventilator to reach the set pressure at the onset of inspiration. Flows that are too high or too low at the onset of inspiration can cause asynchrony. Most ventilators allow adjustment of the rise time during PSV (Figure 22–12). The rise time should be adjusted to the patient’s comfort, and ventilator graph-ics may be useful as a guide to this setting. However, a high inspiratory flow at the onset of inspiration may not be beneficial.45 If the flow is higher at the onset of inspiration, the inspiratory phase may be prematurely terminated during PSV if the ventilator cycles to the expiratory phase at a flow that is a fraction of the peak inspiratory flow.
Sleep fragmentation may be more likely during PSV than during CMV because there is no backup rate.46 Cen-tral apnea during PSV results in an alarm, which awakens the patient. The pattern of awakening and breathing with sleeping and apnea results in periodic breathing and sleep disruption. This complication of PSV can be addressed by switching to CMV or by using a lower level of pressure support. With CMV, there is a mini-mum respiratory rate set. With a lower level of pressure support, Paco2 will likely be greater, and the associated respiratory drive will decrease the risk of apnea.
FIGURE 22–10 Design characteristics of a pressure-supported breath. In this example, baseline pressure (i.e., PEEP) is set at 5 cm H2O and pressure support is set at 15 cm H2O (PIP 20 cm H2O). The inspiratory pressure is triggered at point A by a patient effort resulting in an airway pressure decrease. Demand valve sensitivity and responsiveness are characterized by the depth and duration of this negative pressure. The rise to pressure (line B) is provided by a fixed high initial flow delivery into the airway. Note that if flows exceed patient demand, initial pressure exceeds set level (B1), whereas if flows are less than patient demand, a very slow (concave) rise to pressure can occur (B2). The plateau of pressure support (line C) is maintained by servo control of flow. A smooth plateau reflects appropriate responsiveness to patient demand; fluctuations would reflect less responsiveness of the servo mechanisms. Termination of pressure support occurs at point D and should coincide with the end of the spontaneous inspiratory effort. If termination is delayed, the patient actively exhales (bump in pressure above plateau) (D1); if termination is premature, the patient will have continued inspiratory efforts (D2). Modified from MacIntyre N, et al. The Nagoya conference on system design and patient-ventilator interactions during pressure support ventilation. Chest. 1990;97:1463–1466.
2
21
1
Time
Prox
imal
Air
way
Pre
ssur
e (c
m H
2O)
20
15
10
5A
B
C
D
FIGURE 22–11 Effect of changing the flow termination criteria (cycle off flow as a percentage of peak flow) during pressure support ventilation. Note the effect on inspiratory time.
Time (s)
100 80 60 40 20
0 –20 –40 –60 –80
10%
1
20
15
10
5
0 2
Flow
(L/m
in)
Pres
sure
(cm
H2O
)
100 80 60 40 20
0 –20 –40 –60 –80
25%
1
20
15
10
5
0 2
100 80 60 40 20
0 –20 –40 –60 –80
50%
1
20
15
10
5
0 2
Ventilator Settings 473
60038_CH22_462_500.pdf 47360038_CH22_462_500.pdf 473 11/1/10 11:05 AM11/1/10 11:05 AM
Synchronized intermittent mandatory ventilation (SIMV) (Figure 22–13) provides mandatory breaths (VCV or PCV) that are interspersed with spontaneous breaths. The mandatory breaths are delivered at the
set rate, and the spontaneous breaths may be pressure sup-ported (Figure 22–14). The intent is to provide respiratory muscle rest during mandatory breaths and respiratory mus-cle exercise with the inter-vening breaths. However, it has been shown that con-siderable inspiratory effort occurs with both the manda-tory breaths and the interven-ing spontaneous breaths. As the level of SIMV support is reduced, the work of breath-ing increases for both manda-tory and spontaneous breaths (Figure 22–15).47 This effect can be ameliorated with the addition of pressure support, which results in unloading of both mandatory and sponta-neous breaths.48
On newer ventilators, a volume feedback mechanism for pressure-controlled or pressure-supported breaths
exists.49,50 This is called adaptive pressure control. The desired tidal volume is set on the ventilator, but the breath type is actually pressure control or pressure support. The ventilator then adjusts the inspiratory
FIGURE 22–12 Effect of changing rise time during pressure support ventilation. Note the effect on peak flow.
pressure to deliver the set minimal target tidal volume (Figure 22–16). If tidal volume increases, the machine decreases the inspiratory pressure, and if tidal volume decreases, the machine increases the inspiratory pres-sure. This mode goes by the following names: pressure regulated volume control (Maquet Servo-i), AutoFlow (Dräger), adaptive pressure ventilation (Hamilton Gali-leo), volume control plus (Puritan Bennett), and volume targeted pressure control or pressure controlled volume
guaranteed (General Electric). Volume support is a volume feedback mode in which the breath type is only pressure support.50
Because breath delivery during these volume feedback modes is pressure controlled, tidal volume will vary with changes in respiratory system compliance, airway resistance, and patient effort. If changes in lung mechanics cause the tidal volume to change, the ventilator adjusts the pres-sure setting in an attempt to restore the tidal volume. However, it is important to realize that providing a vol-ume guarantee negates the pressure-limiting feature of a clinician-set pressure control level (i.e., worsening respira-tory system mechanics will increase the applied pressure). Another potential problem
with these approaches is that if the patient’s demand increases and produces a larger tidal volume, the pres-sure level will diminish, a change that may not be appro-priate for a patient in respiratory failure.
Airway pressure release ventilation (APRV) is a time-cycled, pressure-controlled mode of ventilatory support.51 It is a modification of SIMV with an active exhalation valve that allows the patient to breathe spon-taneously throughout the ventilator-imposed pressures (with or without PSV). Because APRV is often used with a long inspiratory-to-expiratory timing pattern, most of the spontaneous breaths will occur during the long lung inflation period (Figure 22–17). APRV is available under a variety of proprietary trade names: APRV (Dräger), BiLevel (Puritan Bennett), BiVent (Sie-mens), BiPhasic (Avea), PCV� (Dräger), and DuoPAP (Hamilton).50
APRV uses different terminology to describe breath delivery phases. Lung inflation depends on the high airway pressure setting (Phigh). The duration of this inflation is termed Thigh. Oxygenation is thus heavily influenced by Phigh, Thigh, and Fio2. The magnitude and duration of lung deflation is determined by the pres-sure release level (Plow) and the release time (Tlow). The ventilator-determined tidal volume is thus dependent on lung compliance, airways resistance, and the dura-tion and timing of this pressure release maneuver. The timing and magnitude of this tidal volume coupled with the patient’s spontaneous breathing determine alveolar ventilation (Paco2). As noted earlier, Thigh is
FIGURE 22–14 Synchronized intermittent mandatory ventilation with pressure support of spontaneous breaths.
Pressure-support breath
Mandatory breath
Flow
(L/m
in)
Pres
sure
(cm
H2O
) Vo
lum
e (m
L)
2
60 40 20
0 –20 –40 –60
4 6 8 10 12 14
2 Time (s)
800
600
400
200
0 4 6 8 10 12 14
2
24 20 16 12
8 4 0
4 6 8 10 12 14
FIGURE 22–15 Synchronized intermittent mandatory ventilation. Note that the esophageal (i.e., pleural) pressure change for the mandatory breath is nearly as great as that for the spontaneous breaths.
Mandatorybreath
Spontaneousbreath
Spontaneousbreaths
Flow
Time
Volu
me
Airw
ayPr
essu
reEs
opha
geal
Pres
sure
Ventilator Settings 475
60038_CH22_462_500.pdf 47560038_CH22_462_500.pdf 475 11/1/10 11:05 AM11/1/10 11:05 AM
usually much greater than Tlow; thus, in the absence of spontaneous breathing, APRV is functionally the same as pressure-controlled inverse ratio ventilation. To sus-tain optimal recruitment with APRV, the greater part of the total time cycle (80% to 95%) usually occurs at Phigh, whereas in order to minimize derecruitment, the time spent at Plow is brief (0.2–0.8 second in adults). If Tlow is too short, exhalation may be incomplete and intrinsic PEEP may result.
Spontaneous breathing during APRV results from dia-phragm contraction, which should result in recruitment of dependent alveoli, thus reducing shunt and improving oxygenation. The spontaneous efforts also may enhance both recruitment and cardiac filling as compared with other controlled forms of support. The long inflation phase also recruits more slowly, filling alveoli and raises mean airway pressure without increasing applied PEEP. Improved gas
exchange, often with lower maximal set airway pressures than CMV, has been demonstrated with APRV.51 How-ever, the end-inspiratory alveolar distention in APRV is not necessarily less than that provided during other forms of support, and it could be substantially higher, because spontaneous tidal volumes can occur while the lung is fully inflated with the APRV set pressure. Randomized con-trolled trials comparing APRV with other lung-protective strategies have shown no difference in outcome.52,53
Adaptive support ventilation (ASV) automatically selects tidal volume and frequency for mandatory breaths and the tidal volume for spontaneous breaths on the basis of the respiratory system mechanics and target minute ventilation. ASV delivers pressure-controlled breaths using an adaptive scheme, in which the mechanical work of breathing is minimized. The ventilator selects a tidal volume and frequency that the patient’s brain stem would theoretically select. The ventilator calculates the required minute ventilation based on the patient’s ideal body weight and estimated dead space volume (2.2 mL/kg). The clinician sets a target percentage of minute ven-tilation that the ventilator will support; for example, higher than 100% if the patient has increased ventilatory requirements (e.g., because of sepsis or increased dead space), or less than 100% during ventilator liberation. The ventilator measures the expiratory time constant and uses this along with the estimated dead space to determine an optimal breathing frequency in terms of the work of breathing. The target tidal volume is calcu-lated as the minute ventilation divided by the frequency, and the pressure limit is adjusted to achieve an average delivered tidal volume equal to the target. The ventila-tor also adjusts the inspiration-to-expiration (I:E) ratio to avoid air trapping. ASV has been shown to supply
FIGURE 22–16 (A) Effect of adaptive pressure control with a compliance increase or respiratory effort increase. (B) Effect of adaptive pressure control with a compliance decrease or respiratory effort decrease. From Branson RD, Johannigman JA. The role of ventilator graphics when setting dual-control modes. Respir Care. 2005;50:187–201. Reprinted with permission.
40
0
Pres
sure
(cm
H2O
)Vo
lum
e (m
L)
40 seconds
40 seconds
40 seconds
80
0
Flow
(L/m
in)
Pres
sure
(cm
H2O
)Vo
lum
e (m
L)Fl
ow (L
/min
)
1000
0
–80
40
0
80
0
1000
0
–80
40 seconds
40 seconds
40 seconds
(A) (B)
FIGURE 22–17 Airway pressure release ventilation.
Paw
Phigh
Time
Plow
Tlow Thigh
CHAPTER 22 Mechanical Ventilation476
60038_CH22_462_500.pdf 47660038_CH22_462_500.pdf 476 11/1/10 11:05 AM11/1/10 11:05 AM
reasonable ventilatory support in a variety of patients with respiratory failure.54–58 However, outcome stud-ies in patients with acute respiratory failure comparing ASV with conven-tional lung-protective strategies have not been reported.
Tube compensation (TC) is designed to overcome the flow-resistive work of breathing imposed by an endotracheal tube or trache-ostomy tube.58–61 It measures the resistance of the artificial airway and applies a pressure proportional to that resistance. The clinician can set the fraction of tube resistance for which compensation is desired (e.g., 50% compensation rather than full compensation). Although it has been shown that TC can effectively compensate for resistance through the artificial airway, it has not been shown to improve outcome.61
Proportional assist ventilation (PAV) is a positive-feedback con-trol mode that provides ventilatory support in proportion to the neural output of the respiratory center.50 The ventilator monitors respiratory drive as the inspiratory flow of the patient, integrates flow to volume, measures elastance and resistance, and then calculates the pressure required from the equation of motion. Using this calculated pressure and the tidal volume, the ventilator calculates work of breathing (WoB): WoB � ∫P � V. These calculations occur every 5 ms during breath delivery, and thus the applied pressure and inspiratory time vary breath by breath and within the breath (Figure 22–18). The ventilator estimates resistance and elastance (or compliance) by applying end-inspiratory and end-expiratory pause maneuvers of 300 ms every 4 to 10 seconds. The clinician adjusts the percentage of support (from 5% to 95%), which allows the work to be partitioned between the ventilator and the patient. Typically, the percentage of support is set so that the work of breathing is in the range of 0.5 to 1.0 joules per liter. If the percentage of support is high, patient work of breathing may be inappropriately low and excessive volume and pressure may be applied (runaway phenom-enon). If the percentage of support is too low, patient work of breathing may be excessive.
PAV applies a pressure that will vary from breath to breath depending upon changes in the patient’s elas-tance, resistance, and flow demand. This differs from PSV or PCV, in which the level of applied pressure is constant regardless of demand, and from VCV, in which the level of pressure decreases when demand increases
(Figure 22–19).62 The cycle criterion for PAV is flow and is adjustable by the clinician, similar to pressure support ventilation. PAV requires the presence of an intact ven-tilatory drive and a functional neuromuscular system. PAV is only available on one ventilator in the United States (PAV�, Puritan Bennett 840) and cannot be used with noninvasive ventilation because leaks prevent accurate determination of respiratory mechanics. PAV may be more comfortable compared with other modes,63
FIGURE 22–18 Proportional assist ventilation. From Marantz S, Patrick W, Webster K, et al. Response of ventilator-dependent patients to different levels of proportional assist. J Appl Physiol. 1996;80:397–403. Reprinted with permission.
15
0
5 seconds
Pres
sure
(cm
H2O
)
75
0
–75 Fl
ow (L
/min
)
0.50
0.25
0
Volu
me
(L)
FIGURE 22–19 Effect of patient effort on the amount of support provided with various ventilator modes.
Supp
ort
PAV/NAVA
APC/ASV
PSV/PCV
VolumecontrolEffort/drive
Ventilator Settings 477
60038_CH22_462_500.pdf 47760038_CH22_462_500.pdf 477 11/1/10 11:05 AM11/1/10 11:05 AM
and it may be associated with better patient–ventilator synchrony and sleep.64 Whether PAV improves clinical outcomes remains to be determined.
Neurally adjusted ventilatory assist (NAVA) is trig-gered, limited, and cycled by the electrical activity of the diaphragm (diaphragmatic EMG). The neural drive is transformed into ventilatory output (neuro-ventilatory coupling). The diaphragmatic EMG is measured by a multiple-array esophageal electrode, which is ampli-fied to determine the support level (NAVA gain). The cycle-off is commonly set at 80% of peak inspiratory activity. The level of assistance is adjusted in response to changes in neural drive, respiratory system mechanics, inspiratory muscle function, and behavioral influences. Because the trigger is based on diaphragmatic activity rather than pressure or flow, triggering is not adversely affected in patients with flow limitation and auto-PEEP. NAVA is only available on the Servo-i ventilator. Small clinical studies have demonstrated improved trigger and cycle synchrony with NAVA,65 but data demonstrating improved outcomes are lacking. Another concern with NAVA is the expense associated with the esophageal catheter and the invasive nature of its placement.
High-frequency oscillatory ventilation (HFOV) uses very high breathing frequencies66 (up to 900 breaths/min in the adult) coupled with very small tidal volumes to provide gas exchange in the lungs. HFOV literally vibrates a bias flow of gas delivered at the proximal end of the endotracheal tube and effects gas transport through complex nonconvective gas transport mechanisms. At the alveolar level, the substantial mean pressure func-tions as high-level CPAP. The potential advantages to HFOV are twofold. First, the very small alveolar pressure swings minimize overdistension and derecruitment. Sec-ond, the high mean airway pressure maintains alveolar patency and prevents derecruitment. Experience with HFOV in neonatal and pediatric respiratory failure is generally positive, but experience in the adult is limited. Its use is usually reserved for refractory hypoxemic respi-ratory failure. Whether its use is associated with better patient outcomes is yet to be determined.
Breath TriggeringPositive pressure breaths can be either time triggered (breaths delivered according to a clinician-set rate or timer) or patient triggered (breaths triggered by either a change in circuit pressure or flow resulting from patient effort). The patient effort required to trigger the venti-lator is an imposed load for the patient. Pressure trig-gering occurs because of a pressure drop in the system (Figure 22–20). The pressure level at which the ventila-tor is triggered is set so that the trigger effort is minimal but auto-triggering is unlikely (typically this is 1 to 2 cm H2O below the PEEP or CPAP). Flow triggering is an alternative to pressure triggering. With flow triggering the ventilator responds to a change in flow rather than a drop in pressure at the airway. With some ventilators, a pneumotachometer is placed between the ventilator circuit and the patient to measure inspiratory flow. In other ventilators, a background or base flow and flow sensitivity are set. When the flow in the expiratory cir-cuit decreases by the amount of the flow sensitivity, the ventilator is triggered. For example, if the base flow is set at 10 L/min and the flow sensitiv-ity is set at 3 L/min, the ventila-tor triggers when the f low in the expiratory circuit drops to 7 L/min (the assumption is that the patient has inhaled at 3 L/min). Flow trig-gering has been shown to reduce the work of breath-ing with CPAP.67 However, it may not be superior to pressure triggering with pressure-supported breaths or mandatory breaths.68 Neither pressure triggering nor flow triggering may be effective if significant auto-PEEP is present. Regardless of whether pressure triggering or flow triggering is used, the current generation of ven-tilators is more responsive to patient effort, and differ-ences between pressure and flow triggering are minor.69
RESPIRATORY RECAPTypes of Ventilator Triggering » Ventilator self-triggers when
a set time is reached. » Patient triggers the ventilator
Tidal VolumeTidal volume is selected to provide an adequate Paco2but avoid alveolar overdistention, decreased cardiac output, and auto-PEEP.70 Tidal volume is directly set in VCV but is determined by the driving pressure and inspiratory time in PCV and PSV. As noted earlier, large tidal volumes increase mortality in patients with ALI or ARDS and increase the risk of developing ALI or ARDS in patients with previously normal lungs.10,71 A tidal volume should be chosen that maintains plateau pres-sure (Pplat) below 30 cm H2O (assuming a near-normal chest wall compliance), or perhaps higher if chest wall compliance is severely reduced (e.g., morbid obesity, anasarca, ascites). Tidal volume should be selected based on predicted body weight (PBW), which is deter-mined by height and sex:
A reasonable starting point for most patients with respi-ratory failure is 6 mL/kg PBW.
Respiratory RateA respiratory rate is chosen to provide an acceptable minute ventilation, as follows:
V�e � Vt � f
where f is the respiratory rate, V�e is the minute ven-tilation, and Vt is the tidal volume. A rate of 15 to 25 breaths/min is used when mechanical ventilation is initiated. If a smaller tidal volume is selected to pre-vent alveolar overdistention, a higher respiratory rate may be required (25 to 35 breaths/min). The respira-tory rate may be limited by the development of auto-PEEP. The minute ventilation that produces a normal Paco2 without risk for lung injury or auto-PEEP may not be possible, and the Paco2 thus is allowed to increase (permissive hypercapnia).
Inspiratory TimeFor patient-triggered mandatory breaths, the inspiratory time should be short (1.5 seconds or less) to improve ventilator–patient synchrony. A shorter inspiratory time requires a higher inspiratory flow, which increases the peak inspiratory pressure (PIP) but does not greatly affect the Pplat. Increasing the inspiratory time increases the mean airway pressure (P–aw), which may improve oxygenation in some patients with ARDS. When long inspiratory times are used (over 1.5 seconds) and spon-taneous breaths are not permitted, paralysis or sedation (or both) often is required. Long inspiratory times also can cause auto-PEEP and may result in hemodynamic instability because of the elevated P–aw or the auto-PEEP. Although inverse ratio ventilation has been advocated
to improve oxygenation, unless it is coupled with the ability to spontane-ously breathe (see the discussion of APRV ear-lier in this chapter), this extreme (and potentially hazardous) form of ven-tilation is seldom neces-sary to achieve adequate oxygenation.
The I:E ratio is the relationship between inspiratory time and expiratory time. For example, an inspiratory time of 2 seconds with an expiratory time of 4 seconds produces an I:E ratio of 1:2 and a respiratory rate of 10 breaths/min. With VCV, the peak inspiratory flow, flow pattern, and tidal volume are the principal determinants of inspiratory time and the I:E ratio. With PCV, the inspiratory time, I:E ratio, or percent-age inspiratory time are set directly. In both VCV and PCV, the principal determinant of expiratory time is the respiratory rate.
Inspiratory Flow PatternFor VCV, the inspiratory flow pattern can be constant or descending ramp. For the same inspiratory time, the PIP is greater with constant flow than with descending ramp flow; the P–aw is greater with ramp flow than with con-stant flow; and gas distribution is better with a descend-ing ramp flow pattern. Because the flow is greater at the beginning of inspiration, patient– ventilator synchrony may be better with a descending ramp flow pattern. Although the choice of flow pattern often is based on clinician bias or the capabilities of a specific ventilator, descending ramp flow may be desirable compared with other inspiratory flow patterns. An end-inspiratory pause can be set to improve distribution of ventilation, but this prolongs inspiration and may have a deleterious effect on hemodynamics and auto-PEEP.
The inspiratory flow decreases exponentially with PCV and PSV. The peak flow and rate of flow decrease depend on the driving pressure, airways resistance, lung compliance, and patient effort. With high resistance, flow decreases slowly. With a low compliance and long inspiratory time, flow decreases more rapidly, and a period of zero flow may be present at end-inhalation (Figure 22–21).
Positive End-Expiratory Pressure Because critical care patients are often immobile and supine, with compromised cough ability, it is common to use low-level PEEP (3 to 5 cm H2O) with all mechani-cally ventilated patients to prevent atelectasis. In patients with ALI or ARDS, more substantial levels of PEEP may be required to maintain alveolar recruitment. An appro-priate PEEP level to maintain alveolar recruitment is
RESPIRATORY RECAPSettings for Tidal Volume, Respiratory Rate, and Inspiratory Time » Tidal volume: Set to avoid
overdistention » Respiratory rate: Set for
desired partial pressure of arterial carbon dioxide (PaCO2)
» Inspiratory time: Set to avoid auto-PEEP and hemodynamic compromise
Ventilator Settings 479
60038_CH22_462_500.pdf 47960038_CH22_462_500.pdf 479 11/1/10 11:06 AM11/1/10 11:06 AM
also part of a lung- protective strategy. PEEP should be used cautiously in patients with unilateral disease, because it may overdistend the more compliant lung, causing shunting of blood to the less compliant lung.
PEEP also may be use-ful to improve triggering by patients experiencing auto-PEEP.72–75 Auto-PEEP func-tions as a threshold pressure
that must be overcome before the pressure (or flow) decreases at the airway to trigger the ventilator. Increas-ing the set PEEP to a level near the auto-PEEP may improve the patient’s ability to trigger the ventilator (Figure 22–22). Whenever PEEP is used to overcome the effect of auto-PEEP on triggering, PIP and Pplat must be monitored to ensure that increasing the set PEEP does not contribute to further hyperinflation.
Other uses of PEEP include preload and after-load reduction in the setting of left heart failure, pneumatic splinting in the setting of airway mala-cia, and facilitation of leak speech with cuff defla-tion in patients with a tracheostomy.76
Mean Airway PressureAcross all modes, oxygenation and cardiac effects of mechanical ventilation often correlate best with the mean airway pressure (P–aw). Indeed, P–aw is a key component of the oxygenation index (OI � 100 � [P–aw � Fio2]/Pao2) that often is used as a more accurate reflection of gas transport impairment. Factors that affect the P–aw during mechanical ventilation are the PIP, PEEP, I:E ratio, respiratory rate, and inspiratory flow pattern. Most patients can be managed with mean P values less than 15 to 20 cm H2O.
Recruitment ManeuversA recruitment maneuver (RM) is an intentional tran-sient increase in transpulmonary pressure to promote reopening of unstable collapsed alveoli and thereby improve gas exchange.77 However, although use of the maneuver is physiologically reasonable, there have been no randomized controlled trials demon-strating an outcome benefit from this improvement in gas exchange. RMs are probably best reserved for the setting of refractory hypoxemia in patients with ARDS.78 A variety of techniques have been described as recruitment maneuvers (Table 22–3). It is uncer-tain whether any one approach is superior to the others. After performing an RM, it is important to set PEEP to a level that retains recruitment. If the lungs are already maximally recruited as the result of PEEP, the benefits of an RM are likely minimal.
RESPIRATORY RECAPUses of Positive End-Expiratory Pressure » Maintain alveolar
recruitment » Counterbalance
auto-PEEP » Reduce preload and
afterload » Pneumatic splinting of the
airway » Facilitation of leak speech
■ TABLE 22–3 Different Lung Recruitment Maneuvers
Recruitment Maneuver Method
Sustained high-pressure inflation
Sustained inflation delivered by increasing PEEP to 30–50 cm H2O for 20–40 seconds
Intermittent sigh Periodic sighs with a tidal volume reaching Pplat of 45 cm H2O
Extended sigh Stepwise increase in PEEP by 5 cm H2O with a simultaneous stepwise decrease in tidal volume over 2 minutes leading to a CPAP level of 30 cm H2O for 30 seconds
Intermittent PEEP increase
Intermittent increase in PEEP from baseline to higher level
Pressure control � PEEP
Pressure control ventilation of 10–15 cm H2O with PEEP of 25–30 cm H2O to reach a peak inspiratory pressure of 40–45 cm H2O for 2 minutes
FIGURE 22–21 Flow waveforms during pressure control ventilation: low resistance and low compliance (A), and high resistance and high compliance (B).
(A)
Time
Flow
(L/m
in)
150
100
50
0
–50
–100
–150
(B)
TimeFl
ow (L
/min
)
150
100
50
0
–50
–100
–150
FIGURE 22–22 Trigger effort is increased when auto-PEEP is present. To trigger the ventilator, the patient’s effort must first overcome the level of auto-PEEP that is present. Increasing the set PEEP level may raise the trigger level closer to the total PEEP, thus improving the ability of the patient to trigger the ventilator. However, this method should not be used if raising the set PEEP level results in an increase in the total PEEP.
Trigger effort = 11 cm H2O
Sensitivity–1 cm H2O
Sensitivity–1 cm H2O
Auto-PEEP 10 cm H2O
PEEP 10 cm H2O
Trigger effort = 4 cm H2O
PEEP 7 cm H2O
Auto-PEEP 3 cm H2O
PEEP 10 cm H2O
CHAPTER 22 Mechanical Ventilation480
60038_CH22_462_500.pdf 48060038_CH22_462_500.pdf 480 11/1/10 11:06 AM11/1/10 11:06 AM
Importantly, an RM can produce injury in the form of hemodynamic compromise and barotrauma.
Inspired Oxygen Concentration An Fio2 of 1.0 is commonly used when mechanical venti-lation is initiated. Pulse oximetry (Spo2) is useful to guide titration of the Fio2 (and PEEP) provided periodic blood gas measurements are obtained to confirm the pulse
oximetry results. A target Spo2 of 88% or higher usually provides a partial pressure of arterial oxygen (Pao2) of 60 mm Hg or h igher. Although it is common practice to wait 20 to 30
minutes after the Fio2 is changed before arterial blood gas measurements are obtained, 10 minutes may be adequate unless the patient has obstructive lung disease, which requires a longer equilibration time.79
SighSome ventilators are capable of providing periodic sigh volumes.80 The rationale for use of sighs is that the periodic hyperinflation reduces the risk of atelectasis. Indeed, a sigh is actually a very brief RM. For many years the use of sighs during mechanical ventilation was not considered important. However, several studies of patients with ARDS have reported improved alveolar recruitment with the use of sighs.81,82
AlarmsIt is particularly important that all alarms be correctly set on the ventilator. The most important alarm is the patient-disconnect alarm, which can be a low pres-sure alarm or a low exhaled volume alarm (or both). A sensitive alarm should detect not only disconnection but also leaks in the system. The ability to detect a leak depends on the site where the volume is measured (Fig-ure 22–23). Other alarms set on the ventilator include those for high pressure, I:E ratio, Fio2, and loss of PEEP. To detect changes in resistance and compliance, the peak airway pressure alarm is important with VCV, and the low exhaled volume alarm with PCV or PSV.
CircuitBecause of the gas compression in the ventilator circuit and the compliance of the ventilator circuit tubing, as much as 3 to 5 mL/cm H2O can be compressed in the ventilator circuit. In other words, at an airway pres-sure of 25 cm H2O above PEEP, about 100 mL of the gas delivered from the ventilator is not delivered to the patient. If the ventilator is set to deliver 500 mL, only
400 mL is delivered to the patient. For patients ventilated with a small tidal volume, the compressible gas volume can greatly affect alveolar ventilation. Some ventilators adjust for the effects of compressible volume such that the volume chosen by the clinician is the actual delivered Vt after correction for the effect of compressible volume. The effects of compressible volume on the delivered Vt, auto-PEEP, plateau pressure, and mixed exhaled partial pressure of carbon dioxide (Pe–co2) are shown in Equation 22–1.
The mechanical dead space of the circuit should also be considered. Mechanical dead space is that part of the ventilator circuit through which the patient rebreathes and thus becomes an extension of the patient’s anatomic dead space. Alveolar ventilation is zero if the sum of the volume loss in the circuit and the mechanical dead space is greater than the Vt set on the ventilator.
HumidificationBecause the function of the upper airway is bypassed when endotracheal and tracheostomy tubes are used, the inspired gas must be filtered, warmed, and humidi-fied before delivery to the patient. All ventilator circuits include a filter in the inspiratory limb and an active or passive humidifier. An active humidifier typically humid-ifies the inspired gas by passing it over or bubbling it through a heated water bath. When an active humidifier is used, the ventilator circuit may be heated to prevent excessive condensation in the circuit. A passive humidi-fier uses an artificial nose (heat and moisture exchanger) to collect heat and humidity from the patient’s exhaled gas and returns that to the patient on the next inhala-tion. Regardless of the humidification technique used, condensation should be seen in the inspiratory ventila-tor circuit or the proximal endotracheal tube or both, which indicates that the inspired gas is fully saturated with water vapor.
with 100% oxygen. » Titrate the FIO2 to maintain an
acceptable arterial oxygen saturation as measured by pulse oximetry.
FIGURE 22–23 The ability to detect a leak depends on the site where volume is measured. If the volume on the inspiratory limb is greater than the volume on the expiratory limb, then there is a leak in the system (circuit or patient). If the inspired volume at the patient is greater than the expired volume at the patient, there is a leak in the patient (e.g., around the cuff of the endotracheal tube or a bronchopleural fistula).
Ventilator Humidifer
Volume
Volume
Volume
Patient
Expired gas
Inspired gas
Ventilator Settings 481
60038_CH22_462_500.pdf 48160038_CH22_462_500.pdf 481 11/1/10 11:06 AM11/1/10 11:06 AM
Monitoring the Mechanically Ventilated PatientIt is important to monitor the function of the mechanical ventilator frequently, including checking the ventilator settings and alarm systems, the humidifier and circuitry, and the patient’s airway.
Physical AssessmentAsymmetric chest motion may indicate main stem (endobronchial) intubation, pneumothorax, or atel-ectasis. Paradoxical chest motion may be seen with flail chest or respiratory muscle dysfunction. Retractions may occur if the inspiratory flow or sensitivity is inap-propriately set or if the airway is ob s t r uc te d . I f the patient is not breathing in syn-chrony with the ventilator (i.e., is bucking the venti-lator), the settings on the ventilator may not be appro-priate or the pa-tient may need sedation or analgesia or both. A patient respiratory rate greater than the trigger rate on the ventilator may indicate the presence of auto-PEEP com-promising triggering. In conjunction with inspection, the chest can be palpated to assess the symmetry of chest movement. Palpation of the tracheal position can help detect pneumothorax. Crepitation indicates sub-cutaneous emphysema. Percussion can be useful in the detection of unilateral hyperresonance or tympany with a pneumothorax. Unilateral decreased breath sounds may indicate bronchial intubation, pneumothorax, atel-ectasis, or pleural effusion. An end-inspiratory squeak over the trachea usually indicates insufficient air in the artificial airway cuff.
Blood Gas MeasurementsThe earliest indicators of hypoxemia often are changes in the patient’s clinical status (e.g., restlessness and con-fusion, changes in level of consciousness, tachycardia or bradycardia, changes in blood pressure, tachypnea, bucking the ven-t i lator, c yano-sis). The most commonly used a ss e ssment o f oxygenation is the partial pressure of arterial oxygen. A low Pao2 indi-cates hypoxemia
RESPIRATORY RECAPMethods of Humidification with Mechanical Ventilation » Active humidification: Heated
humidifier » Passive humidification:
Artificial nose » The presence of condensate
in the inspiratory circuit near the patient indicates adequate humidification.
and a dysfunction in the lungs’ ability to oxygenate arte-rial blood. The Pao2 must always be interpreted in rela-tion to the Fio2 (and often the mean airway pressure). In mechanically ventilated patients, a number of factors can affect the Pao2, such as a change in the Fio2, the PEEP level, or the patient’s lung function (Figure 22–24).
The mixed venous oxygenation (Pv–o2 or Sv–o2) is a better indicator of tissue oxygenation. A Pv–o2 less than 35 mm Hg (or Sv–o2 less than 70%) indicates tissue hypoxia. The Paco2 is determined by carbon dioxide production (V�co2) and the alveolar ventilation (V�a). If the V�co2 is constant, the Paco2 varies inversely with the V�a. The minute ventilation (V�e) affects the Paco2 indi-rectly because of the relationship between the V�e and the V�a. An increase in the V�e decreases the Paco2, and a decrease in the V�e increases the Paco2. This is illustrated by the following relationship:
Paco2 � (V�co2 � 0.863) / (V�e � [1 � Vd/Vt])
where Paco2 is the partial pressure of arterial carbon dioxide, V�co2 is carbon dioxide production, V�e is minute ventilation, and Vd/Vt is the ratio of dead space to tidal volume. Figure 22–25 shows the factors that determine the Paco2 during mechanical ventilation.
The use of noninvasive monitors may reduce the need for arterial blood gas determinations, because they allow continuous assessment between blood gas measurements. Pulse oximetry can be used to titrate an appropriate Fio2 and PEEP. Continuous pulse oximetry
has become the standard of care in mechanically venti-lated patients. End-tidal Pco2 is used to monitor carbon dioxide levels noninvasively. In patients with normal lungs, end-tidal Pco2 closely approximates the Paco2. However, in patients with an elevated Vd/Vt, there can be a large and inconsistent gradient between the Paco2and the end-tidal Pco2. For this reason, monitoring end-tidal Pco2 is of limited value for the assessment of the Paco2 during mechanical ventilation. End-tidal Pco2 is useful to differentiate tracheal intubation from esopha-geal intubation.
Lung MechanicsMonitoring of the peak pressure, Pplat, and auto-PEEP is particularly important. Pplat is measured by applica-tion of an end-inspiratory pause of 0.5 to 1.5 seconds, and auto-PEEP is determined by application of an end-expiratory pause of 0.5 to 1.5 seconds (Figure 22–26). During PCV the inspiratory flow often decreases to a no-flow period at end-inspiration. In this case, the peak pressure and Pplat are equivalent. Both Pplat and auto-PEEP can be accurately measured only when the patient is not exerting effort.
To avoid overdistention and lung injury, the goal is to maintain Pplat below 30 cm H2O (and lower if possible). To assist in this and to minimize unnecessary cardiac effects and triggering difficulties, auto-PEEP should be as low as possible, preferably zero. Importantly, these circuit measurements of respiratory system pressures all assume normal chest wall compliance in order for them to be a reasonable estimate of transpulmonary pressures (i.e., a normal chest wall compliance will have little effect on the measured airway pressures). In the setting of abnormal, very low chest wall com-pliance (e.g., obesity, ascites), these airway pressure
FIGURE 22–24 Factors affecting PaO2 during mechanical ventilation.
FIO2 Paw Lungfunction
PaO2
PEEP I:E ratio
FIGURE 22–25 Factors affecting PaCO2 during mechanical ventilation.
PaCO2
fVT
TETl
VA = VE VDVCO2 –
FIGURE 22–26 Airway pressure waveform during volume control ventilation. An end-inspiratory and an end-expiratory breath hold is applied to measure plateau pressure and auto-PEEP. Note that the difference between peak inspiratory pressure and plateau pressure is determined by the flow setting on the ventilator and airways resistance. Note that the difference between plateau pressure and total PEEP is determined by the tidal volume setting on the ventilator and the total level of PEEP (including auto-PEEP).
PEEP
PIP
Resistanceflow
Pplat
Auto-PEEPTotal-PEEP
Compliancetidal volume
Monitoring the Mechanically Ventilated Patient 483
60038_CH22_462_500.pdf 48360038_CH22_462_500.pdf 483 11/1/10 11:06 AM11/1/10 11:06 AM
measurements may be profoundly affected by chest wall stiffness and these effects need to be subtracted from the airway pressure to determine true transpulmonary pressure. This can be done directly with an esophageal pressure measurement or estimated by an experienced clinician. The use of esophageal pressures for both estimating true transpulmonary pressures and assess-ing the triggering loads from auto-PEEP is described in more detail next.
Auto-PEEP has other manifestations that can be mon-itored. The patient’s breathing pattern can be observed; if exhalation is still occurring when the next breath is delivered, auto-PEEP is present. Inspiratory efforts that do not trigger the ventilator suggest the presence of auto-PEEP. From the flow graphics on the ventilator, it can be observed that expiratory flow does not return to zero before the subsequent breath is delivered when auto-PEEP is present.
The inflation pressure–volume (PV) curve of the respiratory system can be used to set the ventilator.83
For patients with ARDS, the PV curve is sigmoidal (Figure 22–27). A lower inflection point presumably represents the pressure at which a large number of alveoli are recruited, or opened. An upper inflection point presumably represents the pressure at which a large number of alveoli are overdistended. Therefore, it would seem reasonable to set the PEEP above the lower inflection point and the Pplat below the upper inflection point. Because there is hysteresis in the PV curve (i.e., it is shifted leftward during deflation), some argue that the ideal PEEP setting should be determined during the deflation phase of the PV plot.
The traditional PV curve is measured as a series of plateau pressures during small incremental changes in inspiratory and expiratory volumes from a super syringe (Figure 22–28). The inflation PV curve can also be mea-sured when a slow (e.g., 5 to 10 L/min), constant flow is set on the ventilator and the ventilator display of the PV curve is observed. This slow flow effectively eliminates
the effects of resistance on the pressure measurement. The role of the PV curve in setting the ventilator cur-rently is unclear. Although its use is physiologically attractive, more experience is needed with these mea-surements before the PV curve can be recommended for routine use in setting the ventilator.
The stress index is a method to assess the level of PEEP to avoid overdistension and underrecruitment (Figure 22–29).84 This approach uses the shape of the pressure–time curve during constant-flow tidal volume delivery. If the compliance is worsening as the lungs are inflated (upward concavity, stress index � 1), this suggests overdistension, and the recommendation is to decrease PEEP or tidal volume. If the compliance is improving as the lungs are inflated (downward concav-ity, stress index � 1), this suggests further potential for recruitment, and the recommendation is to increase PEEP. The ideal stress index is 1, in which there is a linear increase in pressure with constant-flow inflation of the lungs.
Esophageal pressure is measured from a thin-walled balloon, which contains a small volume of air (�1 mL), placed into the lower esophagus (Figure 22–30).85
Esophageal pressure changes reflect changes in pleural pressure, but the absolute esophageal pressure does not reflect absolute pleural pressure. Changes in esophageal pressure can be used to assess respiratory effort and patient work of breathing during spontaneous breath-ing and patient-triggered modes of ventilation, to assess chest wall compliance during full ventilatory support, and to assess auto-PEEP during spontaneous breathing
FIGURE 22–27 Pressure–volume curve for normal lungs (solid circles) and ARDS (open circles). Note the presence of a lower and upper inflection point on the pressure–volume curve for ARDS.
10 40 Airway Pressure (cm H2O)
Volu
me
Abov
e FR
C (L
) 1.6
1.2
0.8
0.4
0.0 20
Upper inflection point
Lower inflection point
30
FIGURE 22–28 Super syringe technique to measure pressure–volume curve.
10
Calibrated syringe
Pressure manometer
Patient
Filter
Pressure (cm H2O)
Volu
me
(mL)
1000 900 800 700 600 500 400 300 200 100
0 20 30
CHAPTER 22 Mechanical Ventilation484
60038_CH22_462_500.pdf 48460038_CH22_462_500.pdf 484 11/1/10 11:06 AM11/1/10 11:06 AM
Stress index < 1 Stress index = 1 Stress index > 1
Tidal Recruitment Overdistention
FIGURE 22–30 Position of esophageal balloon to measure changes in intrapleural pressure.
Catheter
Esophagealballoon
and patient-triggered modes of ventilation. If exhala-tion is passive, the change in esophageal (i.e., pleural) pressure required to reverse flow at the proximal airway (i.e., to trigger the ventilator) reflects the amount of auto-PEEP. Negative esophageal pressure changes that produce no flow at the airway indicate failed trigger efforts; in other words, the patient’s inspiratory efforts are insufficient to overcome the level of auto-PEEP and trigger the ventilator (Figure 22–31). Clinically, this is
FIGURE 22–31 Auto-PEEP. Note the amount of effort required to trigger the ventilator, represented by the amount of decrease in esophageal pressure required for triggering. Also note the presence of an inspiratory effort that does not trigger the ventilator.
Flow
(L/s
)Vo
lum
e (L
)Pr
essu
re(c
m H
2O)
Pes
(cm
H2O
)
1
0
0
0
0
30
20
0.8
Estimation of auto-PEEP
Missedtrigger effort
Time
Monitoring the Mechanically Ventilated Patient 485
60038_CH22_462_500.pdf 48560038_CH22_462_500.pdf 485 11/1/10 11:06 AM11/1/10 11:06 AM
Changes in esophageal pressure, relative to changes in alveolar pressure, can be used to calculate transpul-monary pressure (lung stress). This may allow more precise setting of tidal volume (and Pplat) in patients with reduced chest wall compliance. In this case, trans-pulmonary pressure (difference between Pplat and Pes) is targeted at less than 27 cm H2O.
The use of an esophageal balloon has been advocated to allow more precise setting of PEEP.86 If pleural pressure is high relative to alveolar pressure (i.e., PEEP), then there may be a potential for derecruitment. With this approach, PEEP is increased until the transpulmonary pressure is
positive (i.e., PEEP is greater than esophageal pressure) (Figure 22–33). This is most likely with a decrease in chest wall compliance, such as occurs with abdominal compartment syndrome, pleural effusion, or obesity. In this case, it is desirable to keep PEEP greater than pleural pressure. Unfortunately, artifacts in esophageal pressure, especially in supine critically ill patients, make it very diffi-cult to measure absolute pleural pressure accurately.87,88 In patients with abdominal compartment syndrome, bladder pressure may be useful to assess intra-abdominal pres-sure, the potential collapsing effect on the lungs, and the amount of PEEP necessary to counterbalance this effect.89
FIGURE 22–32 Calculation of chest wall compliance. The esophageal pressure increases by 5 cm H2O with a tidal volume of 350 mL in a passively ventilated patient.
Volu
me
(mL)
1
Airway pressure
Esophageal pressure
Ccw = VT/Pes= 350 mL/5 cm H2O = 70 mL/cm H2O
Time (s)
400
300
200
100
0 2 3 4 5
1 2 3 4 5
1 2 3 4 5
Paw
(cm
H2O
)Pe
s (c
m H
2O) 32
24
16
8
0
Flow
(L/m
in)
6040200
–20–40–60
FIGURE 22–33 Airway and esophageal pressures in a passively ventilated patient. In this case, the transpulmonary pressure during exhalation is positive because PEEP is greater than the esophageal pressure.
2
40
30
20
10
0
60
40
20
0
–20
–40
4 6 8
Time (s)
10 12 14
2 4 6 8 10 12 14
Paw
(cm
H2O
)Pe
s (c
m H
2O)
Flow
(L/m
in)
CHAPTER 22 Mechanical Ventilation486
60038_CH22_462_500.pdf 48660038_CH22_462_500.pdf 486 11/1/10 11:06 AM11/1/10 11:06 AM
In patients with obstructive lung disease, it may be use-ful to monitor the flow–volume curve during mechanical ventilation (Figure 22–34). The flow–volume curve may provide insight into the severity of airflow obstruction and response to bronchodilator administration.90
Hemodynamics Because positive pressure ventilation can affect cardiac function, it is important to assess hemodynamics during mechanical ventilation. At a minimum, the arterial blood pressure and heart rate should be measured frequently. When the high airway pressures needed to support oxy-genation adversely affect cardiac performance, hemody-namics may need to be supported with fluid, inotropes, and pressors. The role of the pulmonary artery cath-eter in mechanical ventilation is unclear, and its use has declined in recent years.
It is important to appreciate the effect of positive pres-sure ventilation on hemodynamic assessments. During positive pressure ventilation, pleural pressure increases during inhalation by an amount determined by lung compliance and chest wall compliance:89
Ppl/Pplat � Cl / (Cl � Ccw)
where Ppl is the change in pleural pressure, Pplat is the change in alveolar pressure, Cl is lung com-pliance, and Ccw is chest wall compliance. By con-vention, hemodynamic measurements are made at end-exhalation (i.e., when transpulmonary pressures
are lowest) to account for the respiratory varia-tion in pleural pressure. At end-exhalation, mea-surements such as the pulmonary artery wedge pressure, pulmonary artery pressure, and central venous pressure are affected by the amount of PEEP transmitted to the pleural space, which is determined by lung compliance and chest wall compliance. In patients with normal chest wall compliance (over 150 mL/cm H2O) and decreased lung compliance (under 50 mL/cm H2O), less than one-fourth of the alveolar pressure is transmitted to the pleural space.
In addition to esophageal pressure measure-ments, changes in the pleural pressure can also be estimated through observation of the respiratory variation in the thoracic vascular catheter pres-sure measurements (i.e., the central venous pressure, pulmonary artery pressure, and pul-monary artery occlusion pressure). With a stiff chest wall, the esophageal pressure or vascular pressure shows greater fluctuation during the respiratory cycle, and greater effects of positive pressure ventilation on hemodynamics can be expected.
Patient–Ventilator Interactions: Synchrony and AsynchronyDuring any patient-triggered breath, the patient’s effort must interact with the ventilator’s gas delivery algorithm. These interactions are considered synchronous when ventilator flow is in phase with patient effort. In contrast, asynchronous interactions occur when these processes are out of phase. At its worse, asynchrony appears as if the patient is fighting or bucking the ventilator. How-ever, asynchrony often is much more subtle. Failure of the patient to breathe in synchrony with the ventilator decreases patient comfort and increases both the work of breathing and the oxygen cost of breathing. Asynchrony often leads to increased sedation needs and has been associated with longer time on mechanical ventilation.91,92
Asynchrony can be categorized as trigger asynchrony, flow asynchrony, cycle asynchrony, and mode asynchrony.
Trigger asynchrony occurs when the patient has dif-ficulty triggering the ventilator or the ventilator auto-triggers. The ventilator trigger sensitivity should be as sensitive as possible without causing auto-triggering. Inability of the patient to trigger can be caused by an insensitive trigger setting on the ventilator, which can be corrected by reduction of the pressure or flow required for the patient to trigger the ventilator. Inabil-ity to trigger also can be due to respiratory muscle weakness. Perhaps the most common cause of failure to trigger is auto-PEEP in patients with obstructive airway disease. As noted earlier, auto-PEEP can be reduced by lowering minute ventilation, shortening the I:E ratio, or reducing airway obstruction through administration of
FIGURE 22–34 Flow–volume loops showing a response to bronchodilator administration. The expiratory limb of the curve is concave in patients with expiratory flow limitation. Administration of a bronchodilator aerosol leads to improvement in expiratory flow. From MacIntyre NM, Branson RD. Mechanical Ventilation. WB Saunders; 2001:17.
Volume (mL)
200 400 600 900
Inspiration
Expiration
After bronchodilator
Before bronchodilator
Flow
(L/m
in)
60
45
30
15
0
–15
–30
–45
–60
Monitoring the Mechanically Ventilated Patient 487
60038_CH22_462_500.pdf 48760038_CH22_462_500.pdf 487 11/1/10 11:06 AM11/1/10 11:06 AM
bronchodilators and clearing of secretions. Using PEEP to counterbalance auto-PEEP and thus reduce the trig-gering load can be effective for patients with COPD, but this technique is not effective if the auto-PEEP is primarily the result of a high minute ventilation and insufficient expiratory time. Whenever PEEP is used to counterbalance auto-PEEP, care must be taken to avoid hyperinflation with the PEEP. When the attempt is to counterbalance auto-PEEP with PEEP, the clinician should monitor the peak inspiratory pressure as PEEP is increased. If the PIP rises above the desired threshold or increases by a value greater than the increase in PEEP, overdistention should be suspected.
Another form of trigger asynchrony is auto-trigger-ing. Auto-triggering causes the ventilator to trigger in response to an artifact. One artifact that can produce auto-triggering is cardiac oscillations.93 This is addressed
by adjusting the trigger sensitivity. Other causes of auto-triggering include excessive water condensation in the ventilator circuit and leaks in the circuit. These causes of auto-triggering are addressed by draining the circuit and correcting the leak.
Flow asynchrony occurs when the ventilator does not meet the patient’s inspiratory flow demand. Lack of synchrony can be detected by evaluating the airway pressure waveform. With asynchrony, the pressure waveform with each breath differs from every other, and there is breath-to-breath variability in the peak airway pressure (Figure 22–35). A good way to detect asynchrony is to compare patient-triggered breaths with a breath delivered via the manual breath control. Comparing the shape of the mandatory and sponta-neous breaths on the pressure–time waveform can demonstrate the effects of patient effort (i.e., a vigorous
FIGURE 22–35 (A) The inspiratory effort of the patient is not met by fixed flow from the ventilator during pressure control ventilation. The dashed line represents the airway pressure curve that would result from passive inflation, and the shaded area represents the work done by the patient against the insufficient flow from the ventilator. (B) When the flow setting of the ventilator is increased, the patient is more synchronous with the ventilator.
2
40
30
20
10
04 6 8
Time (s)
Time (s)
10 12 14
2
605040302010
0–10–20–30–40–50
4 6 8 10 12 14
2
24 20 16 12
8 4 0
–4 –8
4 6 8 10 12 14
2
40 30 20 10
0 –10 –20 –30 –40 –50
4 6 8 10 12 14
Paw
(cm
H2O
)Pe
s (c
m H
2O)
Flow
(L/m
in)
Paw
(cm
H2O
)Pe
s (c
m H
2O)
Flow
(L/m
in)
(A)
(B)
CHAPTER 22 Mechanical Ventilation488
60038_CH22_462_500.pdf 48860038_CH22_462_500.pdf 488 11/1/10 11:06 AM11/1/10 11:06 AM
FIGURE 22–36 Patient–ventilator asynchrony in a patient receiving pressure control ventilation. From Kallet RH, Campbell AR, Dicker RA, et al. Work of breathing during lung-protective ventilation in patients with acute lung injury and acute respiratory distress syndrome: a comparison between volume and pressure-regulated breathing modes. Respir Care. 2005;50:1623–1631. Reprinted with permission.
Flow
(L/s
)
Time (s)Vo
lum
e (L
)Pa
w(c
m H
2O)
Pes
(cm
H2O
)
1
0.8
30
40
FIGURE 22–37 Double-triggering. Note that the patient receives two breaths in rapid succession. Adapted from Pohlman MC, et al. Excessive tidal volume from breath stacking during lung-protective ventilation for acute lung injury. Crit Care Med. 2008;36:3019–3023.
Inha
latio
nEx
hala
tionFl
ow Time
patient effort literally sucks the airway pressure graphic downward). Clinical signs of asynchrony include tachy-pnea, retractions, and chest-abdominal paradox. Flow asynchrony can be corrected by an increase in the flow setting or change in the inspiratory flow pattern during VCV, by changing from VCV to PCV,35,36,94 or by an increase in the pressure setting or the rise time set-ting during PCV or PSV. However, asynchrony can also occur with PCV (Figure 22–36).95 For patients who have a high respiratory drive because of anxi-ety or pain, flow asynchrony may be improved by appropriate use of sedation or analgesia.95
Cycle asynchrony occurs when the neural inspira-tory time of the patient does not match the inspira-tory time setting on the ventilator. If the inspiratory time is too short, the patient might double-trigger the ventilator (Figure 22–37). During volume con-trol ventilation, this can cause breath stacking, such that the patient is effectively receiving a tidal volume twice what is set. If the inspiratory time is too long, the patient will actively exhale against the ventilator-delivered breath. Cycle asynchrony can occur during PSV in patients with obstructive lung disease or when a leak is present. Cycle asynchrony during PSV can be corrected by lowering the pressure support level, by an increase in the termination flow setting on newer-generation ventilators, or by use of pressure control instead of pressure support (pressure control causes inspiration to be time cycled rather than flow cycled). Cycle asynchrony is recognized as activation of the expiratory (abdominal) muscles during the inspiratory phase; this can be detected clinically by palpation of the patient’s abdo-men. Cycle asynchrony can also be detected by observation of the ventilator graphics (Fig-ure 22–38).
Mode asynchrony occurs when the ventila-tor delivers different breath types. With SIMV, for example, some breath types are manda-tory and others are spontaneous. Because the patient’s respiratory center cannot adapt to varying breath types, asynchrony can develop between the patient and the ventilator. Another form of mode asynchrony occurs with adap-tive pressure control, in which the ventilator reduces support when the patient’s efforts result in a tidal volume that exceeds the set tidal volume.49,97
SedationAnxiety is a common cause of failure to breathe in synchrony with the ventilator. In these cases pharmacologic support may be necessary in the form of analgesics (narcot-ics), sedatives (benzodiazepines), or (rarely) paralyzing agents. When short-term sedation
is necessary to bring a patient into synchrony with the ventilator, propofol may be useful. When ventilation requires long inspiratory times and high airway pres-sures, pharmacologic control of the patient’s breathing is almost always necessary.
FIGURE 22–38 Airway pressure and flow waveforms illustrating active exhalation during pressure support ventilation. Note that the flow does not decelerate to the flow termination criterion of the ventilator (5 L/min for this specific ventilator). Also note the presence of a pressure spike at the end of each inspiration, indicating that the ventilator is pressure cycling rather than flow cycling. Modified from Branson RD. Modes of ventilator operation. In: MacIntyre NR, Branson RD, eds. Mechanical Ventilation. Philadelphia: WB Saunders; 2000. Copyright Elsevier 2000.
Flow
(L/m
in)
2
Time (s)
60
–60 4 6 7 10
Pressure spike
Flow = 35 L/min
12
Pres
sure
(cm
H2O
)
2
30
–10 4 6 7 10 12
Monitoring the Mechanically Ventilated Patient 489
60038_CH22_462_500.pdf 48960038_CH22_462_500.pdf 489 11/1/10 11:06 AM11/1/10 11:06 AM
It must be remembered that all forms of respiratory suppression are associated with adverse side effects. It is most important that disconnect alarms be properly set when the patient’s ability to breathe spontane-ously is pharmacologically suppressed. Significant problems with pharmacologic suppression of respira-tion have been reported, such as long-term respira-tory muscle weakness after use of paralyzing agents during mechanical ventilation.98,99 It has been shown that assessment of the patient’s response to a daily trial of sedation cessation significantly reduces the days of mechanical ventilation.100 This suggests that many mechanically ventilated patients are excessively sedated and that this excessive sedation prolongs the course of mechanical ventilation.100,101
Choosing Ventilator Settings for Different Forms of Respiratory FailureALI and ARDS (Parenchymal Lung Injury)With ALI and ARDS, lung compliance is low and lung vol-ume is decreased. It is important to realize, however, that there are often marked regional differences in the degree of alveolar involvement. Whereas some alveoli may be col-lapsed or consolidated, others may be hyperinflated and others may be normal. The tidal volume will preferentially go to the regions with the more normal mechanics. A normal tidal volume may thus be distributed preferentially to the healthier regions of the lungs, resulting in potential for regional overdistention injury. Parenchymal injury can also affect the airways, which can contribute to reduced regional ventilation to injured lung units. Gas exchange abnormalities with ALI and ARDS are a consequence of alveolar flooding and/or collapse, resulting in V�/Q� mismatching and shunts. The low-V�/Q� regions result in hypoxemia, and the high-V�/Q� regions result in increased dead space and hypercarbia.
Frequency–tidal volume settings for ALI and ARDS focus on limiting end-inspiratory alveolar stretch, which has been shown to improve patient outcomes.10–18,102 This has been most convincingly demonstrated by the ARDS Network Trial, which reported a 10% absolute reduction in mortality with a ventilator strat-egy using a Vt of 6 mL/kg ideal body weight compared with 12 mL/kg.12 Thus, initial Vt should be 6 mL/kg. Moreover, strong consideration should be given to further reducing the Vt if Pplat, adjusted for the effect of excessive chest wall stiffness, exceeds 30 cm H2O. The Vt can be increased to as much as 8 mL/kg if there is marked asynchrony or
severe acidosis, provided that the Pplat does not exceed 30 cm H2O. Respiratory rate is adjusted to control pH. The potential for air trapping in parenchymal lung injury is low if the breathing frequency is less than 35 breaths/min. An increased inspiratory time, and even inverse ratio ven-tilation (e.g., APRV), can be used to increase Pao2 with refractory hypoxemia. The mechanisms for improved oxygenation with inverse ratio ventilation include longer gas mixing time, recruitment of slowly filling alveoli, and development of auto-PEEP.
Although imaging or mechanical techniques to guide proper PEEP settings have physiologic appeal, they are technically challenging and not practical for routine use. Thus, most clinicians rely on various gas exchange criteria to guide PEEP and Fio2 titrations. This involves the use of algorithms designed to provide adequate oxygenation (Pao2 55 to 80 mm Hg or Spo2 of 88% to 95%) while minimizing Fio2. An example would be the National Institutes of Health’s ARDS Network PEEP/Fio2 algorithm (Figure 22–39).12,103 Note that this PEEP/Fio2 algorithm attempts to balance pressure administration (PEEP) with Spo2 or Pao2 and with Fio2. Randomized controlled trials have compared various gas exchange strategies for setting PEEP in conjunc-tion with low Vt strategies and have reported that both aggressive (i.e., 13 to 15 cm H2O PEEP) and conserva-tive (i.e., 7 to 9 cm H2O) approaches have comparable outcomes.103–105 In terms of hospital survival, however, a recent meta-analysis of these studies suggests that higher levels of PEEP may be beneficial for patients with ARDS (Pao2/Fio2 200 mm Hg), whereas higher levels of PEEP are not beneficial (and may produce harm) in patients with ALI (Pao2/Fio2 � 200 mm Hg).105,106
Some mechanical approaches to setting PEEP are practiced in ICUs where the staff has considerable experi-ence managing ALI and ARDS (Box 22–6). These include titration to the highest compliance,107 titration to a pres-sure greater than the lower inflection point of the pres-sure–volume curve,83 and the best stress index.84 PEEP should be avoided that results in a Pplat above 30 cm H2O. Higher levels of PEEP should be reserved for cases where
FIGURE 22–39 (A) Low-PEEP strategy used in the ARDSnet study. (B) High-PEEP strategy used in the ARDSnet study. In each case, combinations of PEEP and FIO2 were used to maintain a PaO2 of 55 to 80 mm Hg or SpO2 of 88% to 95%.
0.3
5
0.4
5
0.4
8
0.5
8
0.5
10
0.6
10
0.7
10
0.7
12
0.7
14
0.8
14
0.9
14
0.9
16
0.9
18
1.0
18–24
FIO2
PEEP
Lower PEEP Strategy
Higher PEEP Strategy
(A)
(B)
0.3
5
0.3
8
0.3
10
0.3
12
0.3
14
0.4
14
0.4
16
0.5
16
0.5
18
0.5–0.8
20
0.8
22
0.9
22
1.0
22
1.0
24
FIO2
PEEP
CHAPTER 22 Mechanical Ventilation490
60038_CH22_462_500.pdf 49060038_CH22_462_500.pdf 490 11/1/10 11:06 AM11/1/10 11:06 AM
lung recruitment can be demonstrated. In the setting of refractory hypoxemia, recruitment maneuvers may be used, followed by a level of PEEP to maintain alveolar recruitment. When setting PEEP in patients with ALI or ARDS, the hemodynamic effects of the increased intra-thoracic pressure should also be monitored.
Obstructive Lung DiseaseRespiratory failure from airflow obstruction is due to increases in airway resistance. This increases the pres-sure required for airflow, which may overload inspira-tory muscles, producing a ventilatory pump failure with spontaneous minute ventilation inadequate for gas exchange. In addition, the narrowed airways create regions of lung that cannot properly empty, and auto-PEEP is produced. These regions of overinflation create dead space and put inspiratory muscles at a substantial
mechanical disadvantage, which further worsens muscle function. Overinflated regions may also compress more healthy regions of the lung, impairing V�/Q� matching. Regions of air trapping and intrinsic PEEP also function as a threshold load to trigger mechanical breaths.
Noninvasive ventilation (NIV) is standard first-line therapy in patients with COPD and has been shown to improve outcomes by reducing the need for endotra-cheal intubation and improving survival in this patient population.108 NIV has also been used in other forms of obstructive lung disease (e.g., asthma, cystic fibrosis), but there is less evidence for better outcomes in these patient populations. Invasive ventilatory support is usu-ally reserved for those who fail NIV or in those in whom NIV is contraindicated.
Tidal volume should be sufficiently low (e.g., 6 mL/kg) to ensure that Pplat values are below 30 cm H2O. The set rate is used to control pH. However, the elevated airways resistance and the low elastic recoil pressure with emphysema increase the potential for air trapping, and this limits the range of breath rates available. Per-missive hypercapnia may be an appropriate trade-off to limit overdistention. The inspiratory time in obstructive lung disease is set as low as possible to minimize the development of air trapping. As noted earlier, judicious application of PEEP (up to 75% to 85% of auto-PEEP) can counterbalance auto-PEEP to facilitate triggering.109 Use of a low-density gas (e.g., helium–oxygen mix-tures [heliox]) is another technique that can be used to decrease auto-PEEP.
Neuromuscular DiseaseThe risk of VILI is generally less in a patient with neuro-muscular failure, because lung mechanics are often near normal and regional overdistention is thus less likely to occur. Higher tidal volumes may thus be used to improve comfort, maintain recruitment, prevent atelectasis, and avoid hypercarbia that may adversely affect central nervous system function. However, tidal volume should not exceed 10 mL/kg, and Pplat should be kept below 30 cm H2O.110 Low levels of PEEP are often beneficial for preventing atelectasis. If patients with neuromuscular disease develop ALI or ARDS, they should be managed using ventilator strategies incorporating lower tidal vol-umes and higher levels of PEEP.
Ventilatory Support Involves Trade-OffsTo provide adequate support yet minimize VILI, mechan-ical ventilation goals must involve trade-offs. The need for potentially injurious ventilating pressures, volumes, and supplemental O2 must be weighed against the ben-efits of better gas exchange. Accordingly, pH goals as low as 7.15 and Pao2 goals as low as 55 mm Hg are often considered acceptable if necessary to protect the lungs from VILI.111 Ventilator settings are thus selected
BOX 22–6
Methods for Selecting PEEPIncremental PEEP: This approach
uses combinations of PEEP and Fio2 to achieve the desired level of oxygenation or the highest compliance.
Decremental PEEP: This approach begins with a high level of PEEP (e.g., 20 cm H2O), after which PEEP is decreased in a stepwise fashion until dere-cruitment occurs, typically with a decrease in Pao2 and decrease in compliance.
Stress index measurement: The pressure–time curve is observed during constant-flow inhalation for signs of tidal recruitment and overdistention.
Esophageal pressure measure-ment: This method estimates the intrapleural pressure by using an esophageal balloon to measure the esophageal pres-sure and subsequently deter-mine the optimal level of PEEP required.
Pressure–volume curve guidance: PEEP is set slightly greater than the lower inflection point.
Ventilatory Support Involves Trade-Offs 491
60038_CH22_462_500.pdf 49160038_CH22_462_500.pdf 491 11/1/10 11:06 AM11/1/10 11:06 AM
to provide an adequate, but not necessarily normal, level of gas exchange while meeting the goals of enough PEEP to maintain alveolar recruitment and avoidance of a PEEP–tidal volume combination that unnecessarily overdistends alveoli at end-inspiration.103–106 This has led to ventilatory strategies such as permissive hypercapnia, permissive hypoxemia, and permissive atelectasis.
Liberation from Mechanical VentilationAn important aspect of the management of patients receiving mechanical ventilation is recognizing when the patient is ready to be liberated from the ventilator and extubating the patient at that point. Evidence-based clinical practice guidelines have been published related to liberation from mechanical ventilation; Box 22–7 lists the recommendations from these guidelines.112
Respiratory MusclesFor successful liberation from the ventilator, the load placed on the respiratory muscles must be balanced by the muscles’ ability to meet that load (Figure 22–40). Respiratory muscle fatigue occurs if the load placed on the muscles is excessive, if the muscles are weak, or if the duty cycle (the inspiratory time relative to total cycle time) is too long. Common causes of a high load are high airways resistance, low lung compliance, and high minute ventilation. In addition, malposition of the diaphragm from air trapping compromises inspiratory muscle function. Diminished respiratory muscle func-tion may also be the result of disease, disuse, malnu-trition, hypoxia, or electrolyte imbalance. The clinical signs of respiratory muscle fatigue are tachypnea, abnor-mal respiratory movements (respiratory alternans and abdominal paradox), and an increase in Paco2.113
Because the maximum inspiratory pressure (Pimax) is a good indicator of overall respiratory muscle strength,
a low Pimax may predict respiratory muscle fatigue. The Pimax is measured by attachment of an aner-oid manometer to the endotracheal or tracheostomy tube. The patient then forcibly inhales after maximum exhalation. When the Pimax is measured, it is recom-mended that a unidirectional valve be used and that the airway be completely obstructed for 20 to 25 seconds (Figure 22–41). A Pimax more negative than –20 cm H2O suggests adequate inspiratory muscle strength. However, if the patient has high airways resistance or
FIGURE 22–40 Respiratory muscle performance is determined by the balance between the load that is placed on the respiratory muscles and the ability of the muscles to meet that load.
Pain and anxiety Sepsis Increased dead space Excessive feeding
FIGURE 22–41 The one-way valve system used to measure maximum inspiratory pressure. The patient is connected at A, the manometer (B) is connected at C, and the patient exhales through D. Port E is occluded during the measurement. In this way, maximum inspiratory pressure is measured at functional residual capacity. From Kacmarek RM, Cycyk-Chapman MC, Young PJ, Romagnoli DM. Determination of maximal inspiratory pressure: a clinical study literature review. Respir Care. 1989;34:868–878. Reprinted with permission.
30 45 15
0 60B
C
D
A
E
CHAPTER 22 Mechanical Ventilation492
60038_CH22_462_500.pdf 49260038_CH22_462_500.pdf 492 11/1/10 11:06 AM11/1/10 11:06 AM
Evidence-Based Guidelines for Discontinuing Ventilatory Support Recommendation 1: In patients requiring mechanical ventilation for more than 24 hours, a search for
all the causes that may be contributing to ventilator dependence should be undertaken. This is particularly true in the patient who has failed attempts at withdrawing the mechanical ventilator. Reversing all possible ventilatory and nonventilatory issues should be an integral part of the venti-lator discontinuation process.
Recommendation 2: Patients receiving mechanical ventilation for respiratory failure should undergo a formal assessment of discontinuation potential if the following criteria are satisfied: (1) evidence for some reversal of the underlying cause for respiratory failure, (2) adequate oxygenation and pH, (3) hemodynamic stability, and (4) the capability to initiate an inspiratory effort.
Recommendation 3: Formal discontinuation assessments for patients receiving mechanical ventilation for respiratory failure should be performed during spontaneous breathing rather than while the patient is still receiving substantial ventilatory support. An initial brief period of spontaneous breathing can be used to assess the capability of continuing onto a formal spontaneous breathing trial (SBT). The cri-teria with which to assess patient tolerance during SBTs are the respiratory pattern, the adequacy of gas exchange, hemodynamic stability, and subjective comfort. The tolerance of SBTs lasting 30 to 120 minutes should prompt consideration for permanent ventilator discontinuation.
Recommendation 4: The removal of the artificial airway from a patient who has successfully been discontinued from ventilatory support should be based on assessments of airway patency and the ability of the patient to protect the airway.
Recommendation 5: Patients receiving mechanical ventilation for respiratory failure who fail an SBT should have the cause for the failed SBT determined. Once reversible causes for failure are cor-rected, subsequent SBTs should be performed every 24 hours.
Recommendation 6: Patients receiving mechanical ventilation for respiratory failure who fail an SBT should receive a stable, nonfatiguing, comfortable form of ventilatory support.
Recommendation 7: Anesthesia/sedation strategies and ventilator management aimed at early extuba-tion should be used in postsurgical patients.
Recommendation 8: Weaning/discontinuation protocols that are designed for nonphysician health-care professionals should be developed and implemented by intensive care units. Protocols aimed at optimizing sedation also should be developed and implemented.
Recommendation 9: Tracheostomy should be considered after an initial period of stabilization on the ventilator when it becomes apparent that the patient will require prolonged ventilator assistance. Tracheostomy then should be performed when the patient appears likely to gain one or more of the benefits ascribed to the procedure. Patients who may derive particular benefit from early trache-ostomy are the following: those requiring high levels of sedation to tolerate a translaryngeal tube; those with marginal respiratory mechanics (often manifested as tachypnea) in whom a tracheostomy tube having lower resistance might reduce the risk of muscle overload; those who may derive psy-chological benefit from the ability to eat orally, communicate by articulated speech, and experience enhanced mobility; and those in whom enhanced mobility may assist physical therapy efforts.
Recommendation 10: Unless there is evidence for clearly irreversible disease (e.g., high spinal cord injury or advanced amyotrophic lateral sclerosis), a patient requiring prolonged mechanical venti-latory support for respiratory failure should not be considered permanently ventilator dependent until 3 months of ventilator liberation attempts have failed.
Recommendation 11: Critical care practitioners should familiarize themselves with facilities in their com-munities, or units in hospitals they staff, that specialize in managing patients who require prolonged dependence on mechanical ventilation. Such familiarization should include reviewing published peer-reviewed data from those units, if available. When medically stable for transfer, patients who have failed ventilator discontinuation attempts in the intensive care unit should be transferred to those facilities that have demonstrated success and safety in accomplishing ventilator discontinuation.
Recommendation 12: Ventilator liberation strategies in the prolonged mechanical ventilation patient should be slow paced and should include gradually lengthening self-breathing trials.
Modified from MacIntyre NR, Cook DJ, Ely EW Jr, et al. Evidence-based guidelines for weaning and discontinuing ventilatory sup-port: a collective task force facilitated by the American College of Chest Physicians; the American Association for Respiratory Care; and the American College of Critical Care Medicine. Chest. 2001;120:375S–396S
Liberation from Mechanical Ventilation 493
60038_CH22_462_500.pdf 49360038_CH22_462_500.pdf 493 11/1/10 11:06 AM11/1/10 11:06 AM
low compliance, a Pimax of –20 cm H2O may not be adequate for unassisted breathing.
The respiratory muscles should be rested if fatigue occurs, and a rest period of 24 hours or longer may be required.114 Respiratory muscle rest usually is provided by ventilatory support high enough to provide patient comfort and still allow some inspiratory efforts. Impor-tantly, total rest (i.e., no inspiratory muscle activity with controlled mechanical ventilation) can also be harmful, because muscle atrophy has been shown to develop in as little as 24 hours under these conditions.98 If respiratory muscle fatigue is the result of an excessive load, the load should be reduced before attempts are made to liberate the patient from the ventilator. This is done with provi-sion of therapy that can increase lung compliance or reduce airways resistance.
The tension–time index has been used to predict diaphragmatic fatigue (Figure 22–42).115 The tension–time index is calculated as the product of the contractile force (Pdi/Pdi–max) and contraction duration (duty cycle, Ti/Ttot). This requires measurement of the mean transdiaphragmatic pressure (Pdi), the transdiaphrag-matic pressure with maximum inhalation (Pdi–max), the inspiratory time (Ti), and the total respiratory cycle time (Ttot). A tension-time index over 0.15 is predic-tive of respiratory muscle fatigue. Measurement of the transdiaphragmatic pressure requires esophageal and gastric pressure measurements, which are almost never performed in mechanically ventilated patients. A simpler form of tension-time index is the pressure–time index (PTI),116 which can be determined more readily with equipment available in the critical care unit. It is calcu-lated as follows:
PTI � (Pbreath/Pimax) � (Ti/Ttot)
where Pbreath is the pressure required to generate a spontaneous breath. The Pbreath can be determined with esophageal balloon measurements during a short trial of spontaneous breathing.
Assessing Readiness for LiberationA number of factors should be improved before an attempt is made to liberate the patient from the ventilator (Box 22–8). Weaning parameters117,118 often are used to assess liberation potential and are divided into two cat-egories: parameters affected by lung mechanics, and gas exchange parameters. The spontaneous Vt (� 5 mL/kg), respiratory rate (� 30 breaths/min), minute ventilation (� 12 L/min), vital capacity (� 15 mL/kg), and the Pimax (� –20 cm H2O) have been used as predictors of success. The rapid shallow breathing index (RSBI)119 is calculated by division of the spontaneous respiratory rate by the Vt (in liters). An RSBI less than 105 has been used as predictive of successful ventilator liberation, and an RSBI greater than 105 has been used to predict failure. An increase in Vd/Vt (which should be less than 0.6) and an increase in V�co2 and V�o2 imply an increased ventilatory requirement.
Despite the many weaning parameters that have been reported, however, no criterion is better at predicting extubation readiness than a spontaneous breathing trial (SBT) with an integrated assessment focusing on the respiratory pattern, gas exchange, hemodynamics, and comfort. In fact, overreliance on weaning parameters
BOX 22–8
Criteria Assessed to Determine Readiness for Ventilator Discontinuation (Liberation)
Evidence for some reversal of the underlying cause for respira-tory failure
Adequate oxygenation (e.g., Pao2/Fio2 ratio � 150 to 200; PEEP 5 to 8 cm H2O; Fio2 0.4 to 0.5) and pH (e.g., � 7.25)
Hemodynamic stability, as defined by the absence of active myocardial ischemia and the absence of clinically significant hypotension (i.e., requiring no vasopressor therapy or therapy with only low-dose vasopressors)
The capability to initiate an inspi-ratory effort
FIGURE 22–42 Tension-time index; note that the fatigue threshold is a tension-time index of about 0.15 to 0.18. From Grassino A, Macklem PT. Respiratory muscle fatigue and ventilatory failure. Ann Rev Med. 1984;35:625–647. Reprinted with permission.
0.2
Pdi/Pdi–max
TI /
Tto
t
1.0
0.8
0.6
0.4
0.2
0 0.4 0.6 0.8
T Tdi
Fatigue zone
Nonfatigue zone
Fatigue threshold
1.0
CHAPTER 22 Mechanical Ventilation494
60038_CH22_462_500.pdf 49460038_CH22_462_500.pdf 494 11/1/10 11:06 AM11/1/10 11:06 AM
may result in prolonged stay on the ventilator.120 It also is important to reduce or temporarily discontinue seda-tion in preparation of ventilator liberation; this has been reported to decrease both days of ventilation and mortality.100,121
Approaches to LiberationTwo prospective, randomized, controlled trials com-pared SIMV weaning (i.e., gradual reduction in manda-tory breath rate), PSV weaning (i.e., gradual reduction in the level of PSV), and daily (or twice daily) SBT.122,123 In these studies, after meeting screening criteria, an SBT was performed. Both studies reported that the major-ity of patients were successfully extubated after the first SBT. In those who failed the initial SBT, no difference in outcome (duration of ventilation) was seen between the T piece and PSV methods. However, both the SBT and PSV methods were superior to SIMV in both studies. Although newer-generation ventilators feature modes intended to facilitate weaning (e.g., SmartCare, adaptive support ventilation, volume support), evidence is lacking that these modes hasten ventilator liberation compared with use of a daily SBT.
The traditional approach to an SBT uses a T piece, in which the patient is removed from the ventilator, and humidified supplemental oxygen is provided. Humidified gas typically is provided as a heated or cool aerosol of water from a large-volume nebulizer. For patients with reactive airways, this aerosol may induce bronchospasm. In such cases a humidification system that does not generate an aerosol should be used, such as a heated passover humidifier. Passive humidifiers (e.g., artificial noses, heat and moisture exchangers) should be avoided because of their dead space and resistive workload.
The SBT can be conducted with-out removal of the patient from the ventilator, and this approach has several advan-tages. No addi-tional equipment is required, and if the patient fails the SBT, ventila-tory support can be quickly rees-tablished. All the monitoring func-tions and alarms
on the ventilator are available during the SBT, which may allow prompt recognition that the patient is failing the SBT. Most of the literature related to ventilator lib-eration studies using a traditional SBT, although several
studies allowed performance of the SBT with the patient attached to the ventilator.124–126
The SBT can be performed with no positive pressure applied to the airway, with a low level of CPAP (5 cm H2O), or with a low level of PSV (5 to 8 cm H2O). Pro-ponents of the CPAP approach argue that this maintains functional residual capacity at a level similar to that after extubation. It is argued that, in a patient with obstructive lung disease, this low level of CPAP maintains airway patency if the patient cannot control exhalation because of the presence of the artificial airway. In patients with marginal left ventricular function, however, a low level of positive intrathoracic pressure may support the failing heart. Such patients may tolerate a CPAP trial but then develop congestive heart failure when extubated.34 Also, a low level of CPAP may counterbalance auto-PEEP in patients with COPD, resulting in a successful SBT, but respiratory failure soon after extubation.
Proponents of the low-level PSV approach argue that this overcomes the resistance to breathing through the artificial airway. However, this argument fails to recognize that the upper airway of an intubated patient typically is swollen and inflamed, such that, at least in one study, the resistance through the upper airway after extubation was similar to that seen with the endotracheal tube in place.127 Resistance through the artificial airway is affected by many factors, including the patient’s inspi-ratory flow, the inner diameter of the tube, whether the tube is an endotracheal or tracheostomy tube, and the presence of secretions in the tube. This makes it difficult to choose an appropriate level of pressure support to overcome tube resistance. However, one study reported similar outcomes when the SBT was performed with a T piece and with 7 cm H2O PSV.128 Similar outcomes of an SBT have also been reported with or without the use of tube compensation during an SBT.62
Similar outcomes are likely with a 2-hour SBT or a 30-minute SBT.129 In the acute care setting, tolerance of an SBT of 30 minutes to 2 hours duration should prompt consideration for extubation. For chronically ventilator-dependent patients with a tracheostomy, the length of each SBT is increased, with alternating periods of ven-tilatory support and SBT. In this case, the goal may be daytime liberation with nocturnal ventilation.
Recognition of a Failed Spontaneous Breathing TrialA failed SBT is discomforting for the patient and may induce significant cardiopulmonary distress. Commonly listed criteria for discontinuation of an SBT include tachy-pnea (respiratory rate over 35 breaths/min for 5 minutes or longer); hypoxemia (Spo2 below 90%); tachycardia (heart rate over 140 beats/min or a sustained increase above 20%); bradycardia (sustained decrease in the heart rate of over 20%); hypertension (systolic blood pres-sure over 180 mm Hg); hypotension (systolic blood
RESPIRATORY RECAPLiberation from Mechanical Ventilation » Regularly assess for
liberation readiness. » Perform a spontaneous
breathing trial to assess readiness for extubation.
» If a spontaneous breathing trial is not tolerated, assess for causes of failure.
» Do not use synchronized intermittent mechanical ventilation (SIMV) as a weaning mode.
» Use protocols to improve successful liberation.
Liberation from Mechanical Ventilation 495
60038_CH22_462_500.pdf 49560038_CH22_462_500.pdf 495 11/1/10 11:06 AM11/1/10 11:06 AM
pressure under 90 mm Hg); and agitation, diaphore-sis, or anxiety. In some patients the last three factors are not caused by SBT failure and can be appropriately treated with verbal reassurance or pharmacologic support. When SBT failure is recognized, ventilatory support should be promptly reestablished.
Causes of Spontaneous Breathing Trial FailureWhen an SBT fails, the reason should be identified and corrected before another SBT is performed. There are a variety of physiologic and technical rea-sons why patients fail an SBT. An excessive respiratory muscle load may be the cause. High airways resistance and low compliance contribute to the increased effort necessary to breathe. Auto-PEEP may delay liberation in patients with COPD, because it increases the pleu-ral pressure needed to initiate inhalation. Electrolyte imbalance may cause respiratory muscle weakness. Inadequate levels of potassium, magnesium, phos-phate, and calcium impair ventilatory muscle func-tion. Appropriate nutritional support often improves the ventilator discontinuation process, but care should be taken to avoid overfeeding, because excessive caloric ingestion elevates carbon dioxide production. Failure of any major organ system can result in failure to liberate the patient from the ventilator. Fever and infection are of particular concern because they increase both oxygen consumption and carbon dioxide production, resulting in an increased ventilatory requirement. Cardiac dysfunc-tion can delay liberation until appropriate management of cardiovascular status has occurred.
Once the patient has been judged to no longer need mechanical ventilatory support, attention then turns to the need for the artificial airway. This requires a different set of assessments that focus on the patient’s ability to protect the natural airway. Key parameters include cough strength and the need for suctioning (i.e., suctioning requirements exceeding every 2 hours should preclude extubation). Although the ability to follow commands is desirable before extubation, it is not essential in patients otherwise able to protect the airway.
In appropriately selected patients (e.g., those recover-ing from a COPD exacerbation), extubation to NIV may reduce the duration of mechanical ventilation.130–132 Extu-bation to NIV can also be considered to prevent extuba-tion failure in patients at risk, such as those with COPD, cardiac disease, or others at risk for extubation failure. However, NIV is generally not recommended to rescue a failed extubation.133,134 If the patient fails extubation, consideration should be given to emergent reintubation.
Ventilator Discontinuation (Weaning) ProtocolsVentilator discontinuation (weaning) protocols have become increasingly popular in recent years, and these protocols typically are implemented by respiratory
therapists and nurses. Studies have reported improved outcomes when protocols are used.124–126,134,135 Fig-ure 22–43 presents the elements of an effective protocol. From these elements incorporating best evidence, a specific protocol can be developed that meets the local culture of the ICU. Note that the use of an SBT is central to the protocol.
KEY POINTS• Efforts should be made to avoid complications
during mechanical ventilation.• Forms of ventilator-induced lung injury include
alveolar overdistention and repetitive opening and closing.
• Volume control ventilation maintains minute ventilation but allows airway pressure and plateau pressure to fluctuate.
• Pressure control ventilation allows minute venti-lation to fluctuate, but airway pressure is limited to the peak pressure set on the ventilator.
• Modes on modern ventilators include continuous mandatory ventilation, synchronized intermit-tent mandatory ventilation, pressure support ventilation, continuous positive airway pressure, adaptive pressure control, adaptive support ven-tilation, airway pressure release ventilation, tube compensation, proportional assist ventilation, neurally adjusted ventilatory assist, and high-frequency oscillatory ventilation.
• The tidal volume should be set to avoid overdis-tention lung injury: 6 mL/kg PBW is a suggested initial setting.
• The respiratory rate and I:E ratio are set to con-trol the Paco2 and to avoid hemodynamic com-promise and auto-PEEP.
FIGURE 22–43 An evidence-based approach to ventilator discontinuation and extubation.
Full or partial ventilatory support
Assess readiness
Spontaneous breathing trialFail
Comfort
Evaluate for extubation
Extubate or trach
Upper airway patent?Aspiration risk?Able to clear secretions?
Success
Determinecause offailure
Disease resolutionAdequate gas exchangeHemodynamic stabilityAbility to breathe
CHAPTER 22 Mechanical Ventilation496
60038_CH22_462_500.pdf 49660038_CH22_462_500.pdf 496 11/1/10 11:06 AM11/1/10 11:06 AM
• The Fio2 initially should be set at 1 and then weaned per pulse oximetry to maintain an Spo2 over 88%.
• PEEP should be set to avoid alveolar derecruit-ment for patients with ARDS and to counterbal-ance auto-PEEP in patients with COPD.
• The following should be monitored in the mechanically ventilated patient: physical signs and symptoms, blood gas measurements, lung mechanics, hemodynamics, patient–ventilator synchrony, and sedation.
• The most important aspect of liberation from mechanical ventilation is assessment for readiness.
• A spontaneous breathing trial identifies most patients who are ready for liberation from mechanical ventilation.
• The poorest outcomes from the ventilator discon-tinuation process have been reported with SIMV.
• For patients who do not tolerate a spontane-ous breathing trial, ventilatory support should be reestablished and the cause of the failure identified.
REFERENCES1. Pierson DJ. Indications for mechanical ventilation in adults with
acute respiratory failure. Respir Care. 2002;47:249–265.2. Matlu GM, Factor P. Complications of mechanical ventilation.
Respir Care Clin North Am. 2000;6:213–252.3. Pierson DJ. Alveolar rupture during mechanical ventilation: role
of PEEP, peak airway pressure, and distending volume. Respir Care. 1988;33:472–484.
4. Stauffer JL. Complications of endotracheal intubation and tra-cheostomy. Respir Care. 1999;44:828–843.
5. Ali T, Harty RF. Stress-induced ulcer bleeding in critically ill patients. Gastroenterol Clin North Am. 2009;38:245–265.
6. Oltermann MH. Nutrition support in the acutely ventilated patient. Respir Care Clin North Am. 2006;12:533–545.
7. Parthasarathy S, Tobin MJ. Sleep in the intensive care unit. Intensive Care Med. 2004;30:197–206.
8. Dreyfuss D, Savmon G. Ventilator induced lung injury: les-sons from experimental studies Am J Respir Crit Care Med. 1998;157:294–323.
9. Jia X, Malhotra A, Saeed M, et al. Fisk Factors for ARDS in patients receiving mechanical ventilation for � 48 h. Chest. 2008;133:853–861.
10. Yilmaz M, Keegan MT, Iscimen R, et al. Toward the prevention of acute lung injury: protocol-guided limitation of large tidal volume ventilation and inappropriate transfusion. Crit Care Med. 2007;35:1660–1666.
11. Villar J, Kacmarek RM, Perez-Mendez L, Aguirre-Jaime A. A high positive end-expiratory pressure, low tidal volume ventila-tory strategy improves outcome in persistent acute respiratory distress syndrome: a randomized, controlled trial. Crit Care Med. 2006;34:1311–1318.
12. NIH ARDS Network. Ventilation with lower tidal volumes as compared with traditional tidal volumes for acute lung injury and the acute respiratory distress syndrome. N Engl J Med. 2000;342:1301–1308.
13. Hager DN, Krishnan JA, Hayden DL, Brower RG, ARDS Clinical Trials Network. Tidal volume reduction in patients with acute lung injury when plateau pressures are not high. Am J Respir Crit Care Med. 2005;172:1241–1245.
14. Webb HJH, Tierney DF. Experimental pulmonary edema due to intermittent positive pressure ventilation with high inflation pressures: protection by positive end-expiratory pressure. Am Rev Respir Dis. 1974;110:556–565.
15. Crotti S, Mascheroni D, Caironi P, et al. Recruitment and dere-cruitment during acute respiratory failure. Am J Respir Crit Care Med. 2001;164:131–140.
16. Mead J, Takishima T, Leith D. Stress distribution in lungs: a model of pulmonary elasticity. J Appl Physiol. 1970;28:596–608.
17. Chiumello D, Carlesso E, Cadringher P, et al. Lung stress and strain during mechanical ventilation for acute respiratory dis-tress syndrome. Am J Respir Crit Care Med. 2008;178:346–355.
18. Vaporidi K, Voloudakis G, Priniannakis G, et al. Effects of respiratory rate on ventilator-induced lung injury at a con-stant Paco2 in a mouse model of normal lung. Crit Care Med. 2008;36:1277–1283.
19. Rich BR, Reickert CA, Sawada S, et al. Effect of rate and inspiratory flow on ventilator induced lung injury. J Trauma. 2000;49:903–911.
20. Marini JJ, Hotchkiss JR, Broccard AF. Bench-to-bedside review: microvascular and airspace linkage in ventilator-induced lung injury. Crit Care (London). 2003;7:435–444.
21. Trembly L, Valenza F, Ribiero SP, Li J, Slutsky AS. Injurious ven-tilatory strategies increase cytokines and C-fos M-RNA expres-sion in an isolated rat lung model. J Clin Invest. 1997;99:944–952.
22. Ranieri VM, Suter PM, Tortorella C, et al. Effect of mechanical ventilation on inflammatory mediators in patients with acute respiratory distress syndrome: a randomized controlled trial. JAMA. 1999;282:54–61.
23. Slutsky AS, Trembly L. Multiple system organ failure: is mechan-ical ventilation a contributing factor? Am J Respir Crit Care Med. 1998;157:1721–1725.
24. Nahum A, Hoyt J, Schmitz L, et al. Effect of mechanical ventila-tion strategy on dissemination of intertracheally instilled E coliin dogs. Crit Care Med. 1997;25:1733–1743.
25. Durbin CG, Wallace KK. Oxygen toxicity in the critically ill patient. Respir Care. 1993;38:739–753.
26. Kollef MH. Prevention of hospital-associated pneumo-nia and ventilator-associated pneumonia. Crit Care Med. 2004;32:1396–1405.
27. Wip C, Napolitano L. Bundles to prevent ventilator-associated pneumonia: how valuable are they? Curr Opin Infect Dis. 2009;22:159–166.
28. Zilberberg MD, Shorr AF, Kollef MH. Implementing quality improvements in the intensive care unit: ventilator bundle as an example. Crit Care Med. 2009;37:305–309.
29. Kollef MH. Prevention of hospital-associated pneumo-nia and ventilator-associated pneumonia. Crit Care Med. 2004;32:1396–1405.
30. Han J, Liu Y. Effect of ventilator circuit changes on ventilator-associated pneumonia: a systematic review and meta-analysis. Respir Care. 2010;55:467–474.
31. Gentile MA, Siobal MS. Are specialized endotracheal tubes and heat-and-moisture exchangers cost-effective in preventing ventilator associated pneumonia? Respir Care. 2010;55:184–196.
32. Perreault T, Gutkowska J. Role of atrial natriuretic factor in lung physiology and pathology. Am J Respir Crit Care Med. 1995;151:226–242.
33. Pinsky MR, Summer WR, Wise RA, et al. Augmentation of cardiac function by elevation of intrathoracic pressure. J Appl Physiol. 1983;54:450–455.
34. Lemaire F, Teboul JL, Cinotti L, et al. Acute left ventricular dys-function during unsuccessful weaning from mechanical ventila-tion. Anesthesiology. 1988;69:171–179.
35. Cinnella G, Conti G, Lofaso F, et al. Effects of assisted ven-tilation on the work of breathing: volume-controlled versus pressure-controlled ventilation. Am J Respir Crit Care Med. 1996;153:1025–1033.
References 497
60038_CH22_462_500.pdf 49760038_CH22_462_500.pdf 497 11/1/10 11:06 AM11/1/10 11:06 AM
36. MacIntyre NR, McConnell R, Cheng KG, et al. Patient-venti-lator flow dyssynchrony: flow-limited versus pressure-limited breaths. Crit Care Med. 1997;25:1671–1677.
37. MacIntyre NR, Sessler CN. Are there benefits or harm from pressure targeting during lung-protective ventilation? Respir Care. 2010;55:175–180.
38. Branson RD, Chatburn RL. Technical description and clas-sification of modes of ventilator operation. Respir Care. 1992;37:1026–1044.
39. Chatburn RL. Classification of mechanical ventilators. Respir Care. 1992;37:1009–1025.
40. Chatburn RL. Classification of ventilator modes: update and proposal for implementation. Respir Care. 2007;52:301–323.
41. Chatburn RL, Primiano FP Jr. A new system for understanding modes of mechanical ventilation. Respir Care. 2001;46:604–621.
42. Hess DR. Ventilator waveforms and the physiology of pressure support ventilation. Respir Care. 2005;50:166–186.
43. Jubran A, Van de Graaff WB, Tobin MJ. Variability of patient-ventilator interaction with pressure support ventilation in patients with chronic obstructive pulmonary disease. Am J Respir Crit Care Med. 1995;152:129–136.
44. Parthasarathy S, Jubran A, Tobin MJ. Cycling of inspiratory and expiratory muscle groups with the ventilator in airflow limita-tion. Am J Respir Crit Care Med. 1998;158:1471–1478.
45. Jubran A. Inspiratory flow: more may not be better. Crit Care Med. 1999;27:670–671.
46. Parthasarathy S, Tobin MJ. Effect of ventilator mode on sleep quality in critically ill patients. Am J Respir Crit Care Med. 2002;166:1423–1429.
47. Marini JJ, Smith TC, Lamb VJ. External work output and force generation during synchronized intermittent mechanical venti-lation: effect of machine assistance on breathing effort. Am Rev Respir Dis. 1988;138:1169–1179.
48. Leung P, Jubran A, Tobin MJ. Comparison of assisted ventilator modes on triggering, patient effort, and dyspnea. Am J Respir Crit Care Med. 1997;155:1940–1948.
49. Branson RD, Chatburn RL. Controversies in the critical care setting. Should adaptive pressure control modes be utilized for virtually all patients receiving mechanical ventilation? Respir Care. 2007;52:478–488.
50. Mireles-Cabodevila E, Diaz-Guzman E, Heresi GA, Chatburn RL. Alternative modes of mechanical ventilation: a review for the hospitalist. Cleve Clin J Med. 2009;76:417–430.
51. Habashi NM. Other approaches to open-lung ventilation: airway pressure release ventilation. Crit Care Med. 2005;33(3 suppl):S228–S240.
52. Varpula T, Valta P, Niemi R, et al. Airway pressure release venti-lation as a primary ventilatory mode in acute respiratory distress syndrome. Acta Anaesth Scand. 2004;48:722–731.
53. Varpula T, Valta P, Markkola A, et al. The effects of ventila-tory mode on lung aeration assessed with computer tomog-raphy: a randomized controlled study. J Intensive Care Med. 2009;24:122–130.
54. Gruber PC, Gomersall CD, Leung PE, et al. Randomized con-trolled trial comparing adaptive-support ventilation with pressure-regulated volume-controlled ventilation with auto-mode in weaning patients after cardiac surgery. Anesthesiology. 2008;109:81–87.
55. Tassaux D, Dalmas E, Gratadour P, Jolliet P. Patient-ventilator interactions during partial ventilatory support: a preliminary study comparing the effects of adaptive support ventilation with synchronized intermittent mandatory ventilation plus inspira-tory pressure support. Crit Care Med. 2002;30:801–807.
56. Jaber S, Sebbane M, Verzilli D, et al. Adaptive support and pres-sure support ventilation behavior in response to increased ven-tilatory demand. Anesthesiology. 2009;110:620–627.
57. Sulemanji D, Marchese A, Garbarini P, et al. Adaptive sup-port ventilation: an appropriate mechanical ventilation strat-
egy for acute respiratory distress syndrome? Anesthesiology. 2009;111:863–870.
59. Cohen JD, Shapiro M, Grozovski E, et al. Extubation outcome following a spontaneous breathing trial with automatic tube compensation versus continuous positive airway pressure. Crit Care Med. 2006;34:682–686.
60. Elsasser S, Guttmann J, Stocker R, et al. Accuracy of automatic tube compensation in new-generation mechanical ventilators. Crit Care Med. 2003;31:2619–2626.
61. Haberthür C, Mols G, Elsasser S, et al. Extubation after breath-ing trials with automatic tube compensation, T-tube, or pressure support ventilation. Acta Anaesthesiol Scand. 2002;46:973–979.
62. Marantz S, Patrick W, Webster K, et al. Response of ventilator-dependent patients to different levels of proportional assist. J Appl Physiol. 1996;80:397–403.
63. Gay PC, Hess DR, Hill NS. Noninvasive proportional assist ventilation for acute respiratory insufficiency. Comparison with pressure support ventilation. Am J Respir Crit Care Med. 2001;164:1606–1611.
64. Bosma K, Ferreyra G, Ambrogio C, et al. Patient-ventilator inter-action and sleep in mechanically ventilated patients: pressure support versus proportional assist ventilation. Crit Care Med. 2007;35:1048–1054.
66. Fessler HE, Hess DR. Respiratory controversies in the critical care setting. Does high-frequency ventilation offer benefits over conventional ventilation in adult patients with acute respiratory distress syndrome? Respir Care. 2007;52:595–608.
67. Branson RD, Campbell RS, Davis D, et al. Comparison of pres-sure and flow triggering systems during continuous positive airway pressure. Chest. 1994;106:540–544.
68. Goulet RL, Hess D, Kacmarek RM. Flow versus pressure triggering in mechanically ventilated adult patients. Chest. 1997;111:1649–1653.
69. Aslanian P, El Atrous S, Isabey D, et al. Effects of flow trigger-ing on breathing effort during partial ventilatory support. Am J Respir Crit Care Med. 1998;157:135–139.
70. MacIntyre NR. Is there a best way to set tidal volume for mechan-ical ventilatory support? Clin Chest Med. 2008;29:225–231.
71. Gajic O, Dara SI, Mendez JL, et al. Ventilator-associated lung injury in patients without acute lung injury at the onset of mechanical ventilation. Crit Care Med. 2004;32:1817–1824.
72. MacIntyre NR, McConnell R, Cheng KC. Applied PEEP reduces the inspiratory load of intrinsic PEEP during pressure support. Chest. 1997;1111:188–193.
73. Smith TC, Marini JJ. Impact of PEEP on lung mechanics and work of breathing in severe airflow obstruction. J Appl Physiol. 1988;65:1488–1499.
74. Petrof BJ, Lagare M, Goldberg P, et al. Continuous positive airway pressure reduces work of breathing and dyspnea during weaning from mechanical ventilation in severe chronic obstruc-tive pulmonary disease. Am Rev Respir Dis. 1990;141:281–289.
76. Hoit JD, Banzett RB, Lohmeier HL, et al. Clinical ventilator adjustments that improve speech. Chest. 2003;124:1512–1521.
77. Hess DR, Bigatello LM. Lung recruitment: the role of recruit-ment maneuvers. Respir Care. 2002;47:308–318.
78. Fan E, Wilcox ME, Brower RG, et al. Recruitment maneuvers for acute lung injury: a systematic review. Am J Respir Crit Care Med. 2008;178:1156–1163.
79. Hess D, Good C, Didyoung R, et al. The validity of assessing arte-rial blood gases 10 minutes after an Fio2 change in mechanically
CHAPTER 22 Mechanical Ventilation498
60038_CH22_462_500.pdf 49860038_CH22_462_500.pdf 498 11/1/10 11:06 AM11/1/10 11:06 AM
ventilated patients without chronic pulmonary disease. Respir Care. 1985;30:1037–1041.
80. Branson RD, Campbell RS. Sighs: wasted breath or breath of fresh air? Respir Care. 1992;37:462–468.
81. Pelosi P, Cadringher P, Bottino N, et al. Sigh in acute respiratory distress syndrome. Am J Respir Crit Care Med. 1999;159:872–880.
82. Badet M, Bayle F, Richard JC, Guérin C. Comparison of optimal positive end-expiratory pressure and recruitment maneuvers during lung-protective mechanical ventilation in patients with acute lung injury/acute respiratory distress syndrome. Respir Care. 2009;54:847–854.
83. Harris RS. Pressure-volume curves of the respiratory system. Respir Care. 2005;50:78–99.
84. Grasso S, Stripoli T, De Michele M, et al. ARDSnet ventilatory protocol and alveolar hyperinflation: role of positive end-expi-ratory pressure. Am J Respir Crit Care Med. 2007;176:761–767.
88. Talmor DS, Fessler HE. Are esophageal pressure measure-ments important in clinical decision-making in mechanically ventilated patients? Respir Care. 2010;55:162–172.
89. Hess DR, Bigatello LM. The chest wall in acute lung injury/acute respiratory distress syndrome. Curr Opin Crit Care. 2008;14:94–102.
90. Dhand R. Ventilator graphics and respiratory mechan-ics in the patient with obstructive lung disease. Respir Care. 2005;50:246–261.
91. de Wit M, Miller KB, Green DA, et al. Ineffective triggering predicts increased duration of mechanical ventilation. Crit Care Med. 2009;37:2740–2745.
92. Thille AW, Rodriguez P, Cabello B, et al. Patient-ventilator asyn-chrony during assisted mechanical ventilation. Intensive Care Med. 2006;32:1515–1522.
93. Imanaka H, Nishimura M, Takeuchi M, et al. Autotrigger-ing caused by cardiogenic oscillation during flow-triggered mechanical ventilation. Crit Care Med. 2000;28:402–407.
94. Yang LY, Huang YC, Macintyre NR. Patient-ventilator synchrony during pressure-targeted versus flow-targeted small tidal vol-ume assisted ventilation. J Crit Care. 2007;22:252–257.
95. Kallet RH, Campbell AR, Dicker RA, et al. Work of breathing during lung-protective ventilation in patients with acute lung injury and acute respiratory distress syndrome: a comparison between volume and pressure-regulated breathing modes. Respir Care. 2005;50:1623–1631.
96. Hess DR, Thompson BT. Patient-ventilator dyssynchrony during lung protective ventilation: what’s a clinician to do? Crit Care Med. 2006;34:231–233.
97. Branson RD, Johannigman JA. The role of ventilator graphics when setting dual-control modes. Respir Care. 2005;50:187–201.
98. Levine S, Nguyen T, Taylor N, et al. Rapid disuse atrophy of dia-phragm fibers in mechanically ventilated humans. N Engl J Med. 2008;358:1327–1335.
99. Hermans G, De Jonghe B, Bruyninckx F, Van den Berghe G. Clinical review: critical illness polyneuropathy and myopathy.Crit Care. 2008;12:238.
100. Girard TD, Kress JP, Fuchs BD, et al. Efficacy and safety of a paired sedation and ventilator weaning protocol for mechani-cally ventilated patients in intensive care (Awakening and Breathing Controlled trial): a randomised controlled trial. Lan-cet. 2008;371(9607):126–134.
101. Strøm T, Martinussen T, Toft P. A protocol of no sedation for critically ill patients receiving mechanical ventilation: a ran-domised trial. Lancet. 2010;375:475–480.
102. Amato MB, Barbas CSV, Medievos DM, et al. Effect of a protec-tive ventilation strategy on mortality in ARDS. N Engl J Med. 1998;338:347–354.
103. Brower RG, Lanken PN, MacIntyre N, et al. Higher versus lower positive end-expiratory pressures in patients with the acute respiratory distress syndrome. N Engl J Med. 2004;351:327–336.
104. Meade MO, Cook DJ, Guyatt GH, et al. Ventilation strategy using low tidal volumes, recruitment maneuvers, and high positive end-expiratory pressure for acute lung injury and acute respiratory distress syndrome: a randomized controlled trial. JAMA. 2008;299:637–645.
105. Briel M, Meade M, Mercat A, et al. Higher vs lower positive end-expiratory pressure in patients with acute lung injury and acute respiratory distress syndrome: systematic review and meta-analysis. JAMA. 2010;303:865–873.
106. Mercat A, Richard JC, Vielle B, et al. Positive end-expiratory pressure setting in adults with acute lung injury and acute respi-ratory distress syndrome: a randomized controlled trial. JAMA. 2008;299:646–655.
107. Suter PM, Fairley HB, Isenberg MD. Optimic end expiratory pressure in patients with acute pulmonary failure. N Engl J Med. 1975;292:284–289.
108. Nava S, Hill N. Non-invasive ventilation in acute respiratory failure. Lancet. 2009;374:250–259.
109. Medoff BD. Invasive and noninvasive ventilation in patients with asthma. Respir Care. 2008;53:740–750.
110. Mascia L, Zavala E, Bosma K, et al. High tidal volume is associ-ated with the development of acute lung injury after severe brain injury: an international observational study. Crit Care Med. 2007;35:1815–1820.
111. Hickling KG, Walsh J, Henderson S, Jackson R. Low mortality rate in adult respiratory distress syndrome using low-volume, pressure-limited ventilation with permissive hypercapnia: a pro-spective study. Crit Care Med. 1994;22:1568–1578.
112. MacIntyre NR, Cook DJ, Ely EW Jr, et al. Evidence-based guide-lines for weaning and discontinuing ventilatory support: a col-lective task force facilitated by the American College of Chest Physicians; the American Association for Respiratory Care; and the American College of Critical Care Medicine. Chest. 2001;120(6 suppl):375S–395S.
113. Cohen CA, Zagelbaum G, Gross D, et al. Clinical manifestations of inspiratory muscle fatigue. Am J Med. 1982;73:308–316.
114. Laghi F, D’Alfonso N, Tobin MJ. Pattern of recovery from dia-phragmatic fatigue over 24 hours. J Appl Physiol. 1995;79:539–546.
115. Stoller JK. Physiologic rationale for resting the ventilatory muscles. Respir Care. 1991;36:290–296.
116. Jabour ER, Rabil DM, Truwitt JD, et al. Evaluation of a new wean-ing index based on ventilatory endurance and the efficiency of gas exchange. Am Rev Respir Dis. 1991;144:531–537.
117. Epstein SK. Weaning parameters. Respir Care Clin North Am. 2000;6:253–301.
118. Meade M, Guyatt G, Cook D, et al. Predicting success in weaning from mechanical ventilation. Chest. 2001;120(6 suppl):400S–424S.
119. Yang KL, Tobin MJ. A prospective study of indices predicting the outcome of trials of weaning from mechanical ventilation. N Engl J Med. 1991;324:1445–1450.
120. Tanios MA, Nevins ML, Hendra KP, et al. A randomized, con-trolled trial of the role of weaning predictors in clinical decision making. Crit Care Med. 2006;34:2530–2535.
121. Kress JP, Pohlman AS, O’Connor MF, et al. Daily interruption of sedative infusions in critically ill patients undergoing mechani-cal ventilation. N Engl J Med. 2000;342:1471–1477.
122. Esteban A, Frutos F, Tobin MJ, et al. A comparison of four meth-ods of weaning patients from mechanical ventilation. N Engl J Med. 1995;6:345–350.
123. Brochard L, Rauss A, Benito S, et al. Comparison of three methods of gradual withdrawal from ventilatory support during
References 499
60038_CH22_462_500.pdf 49960038_CH22_462_500.pdf 499 11/1/10 11:06 AM11/1/10 11:06 AM
weaning from mechanical ventilation. Am J Respir Crit Care Med. 1994;150:896–903.
124. Ely EW, Baker AM, Dunagan DP, et al. Effect of the duration of mechanical ventilation on identifying patients capable of breath-ing spontaneously. N Engl J Med. 1996;335:1864–1869.
125. Ely EW, Bennett PA, Bowton DL, et al. Large-scale implemen-tation of a respiratory therapist-driven protocol for ventilator weaning. Am J Respir Crit Care Med. 1999;159:439–446.
126. Robertson TE, Mann HJ, Hyzy R, et al. Multicenter implemen-tation of a consensus-developed, evidence-based, spontaneous breathing trial protocol. Crit Care Med. 2008;36:2753–2762.
127. Straus C, Louis B, Isabey D, et al. Contribution of the endotra-cheal tube and the upper airway to breathing workload. Am J Respir Crit Care Med. 1998;157:23–30.
128. Esteban A, Alia I, Gordo F, et al. Extubation outcome after spontaneous breathing trials with T-tube or pressure-support ventilation. Am J Respir Crit Care Med. 1997;156:459–465.
129. Esteban E, Alia I, Tobin MJ, et al. Effect of spontaneous breathing trial duration on outcome of attempts to discontinue mechanical ventilation. Am J Respir Crit Care Med. 1999;159:512–518.
130. Girault C, Daudenthun I, Chevron V, et al. Noninvasive ventila-tion as a systematic extubation and weaning technique in acute
on chronic respiratory failure: a prospective, randomized, con-trolled study. Am J Respir Crit Care Med. 1999;160:86–92.
131. Nava S, Ambrosino N, Clini E, et al. Noninvasive mechanical ventilation in the weaning of patients with respiratory failure due to chronic obstructive pulmonary disease: a randomized, controlled trial. Ann Intern Med. 1998;128:721–728.
132. Esteban A, Frutos-Vivar F, Ferguson ND, et al. Noninvasive positive-pressure ventilation for respiratory failure after extuba-tion. N Engl J Med. 2004;350:2452–2460.
133. Keenan SP, Powers C, McCormack DG, Block G. Noninvasive positive-pressure ventilation for postextubation respiratory dis-tress: a randomized controlled trial. JAMA. 2002;287:3238–3244.
134. Marelich GP, Murin S, Battistella F, et al. Protocol weaning of mechanical ventilation in medical and surgical patients by respiratory care practitioners and nurses: effect on weaning time and incidence of ventilator-associated pneumonia. Chest. 2000;118:459–467.
135. Ely EW, Meade MO, Haponik EF, et al. Mechanical ventilator weaning protocols driven by nonphysician health-care profes-sionals: evidence-based clinical practice guidelines. Chest. 2001;120(6 suppl):454S–463S.
CHAPTER 22 Mechanical Ventilation500
60038_CH22_462_500.pdf 50060038_CH22_462_500.pdf 500 11/1/10 11:06 AM11/1/10 11:06 AM


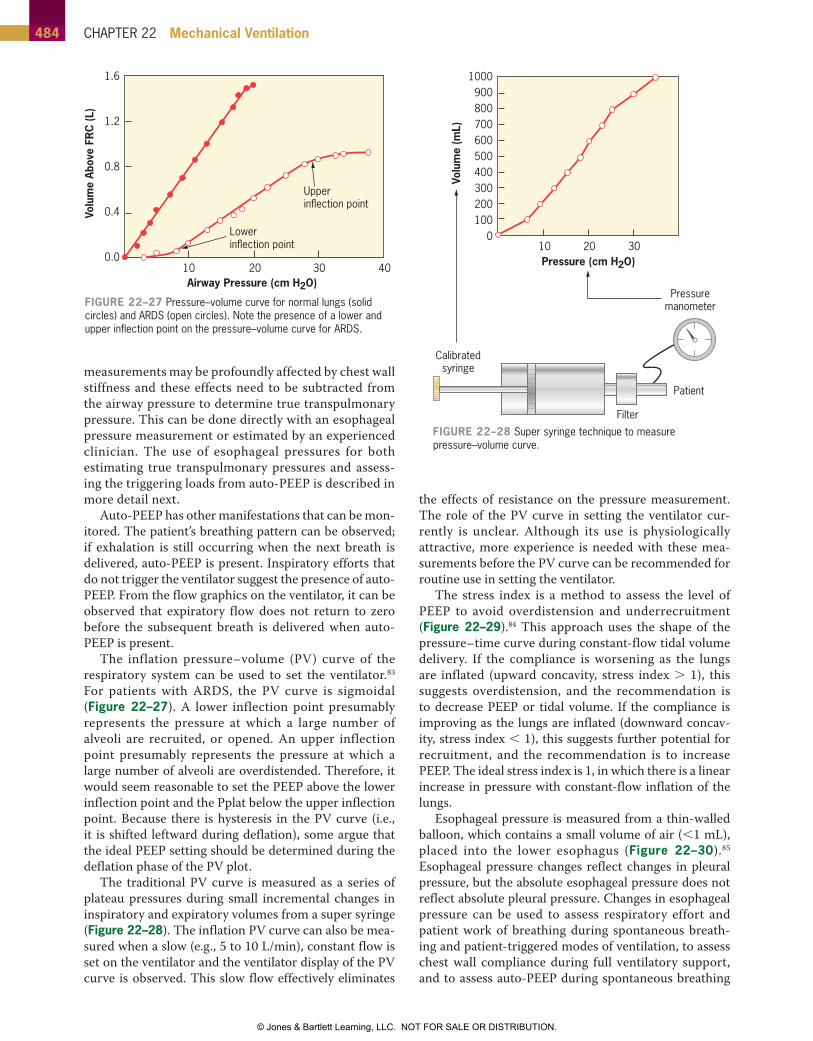


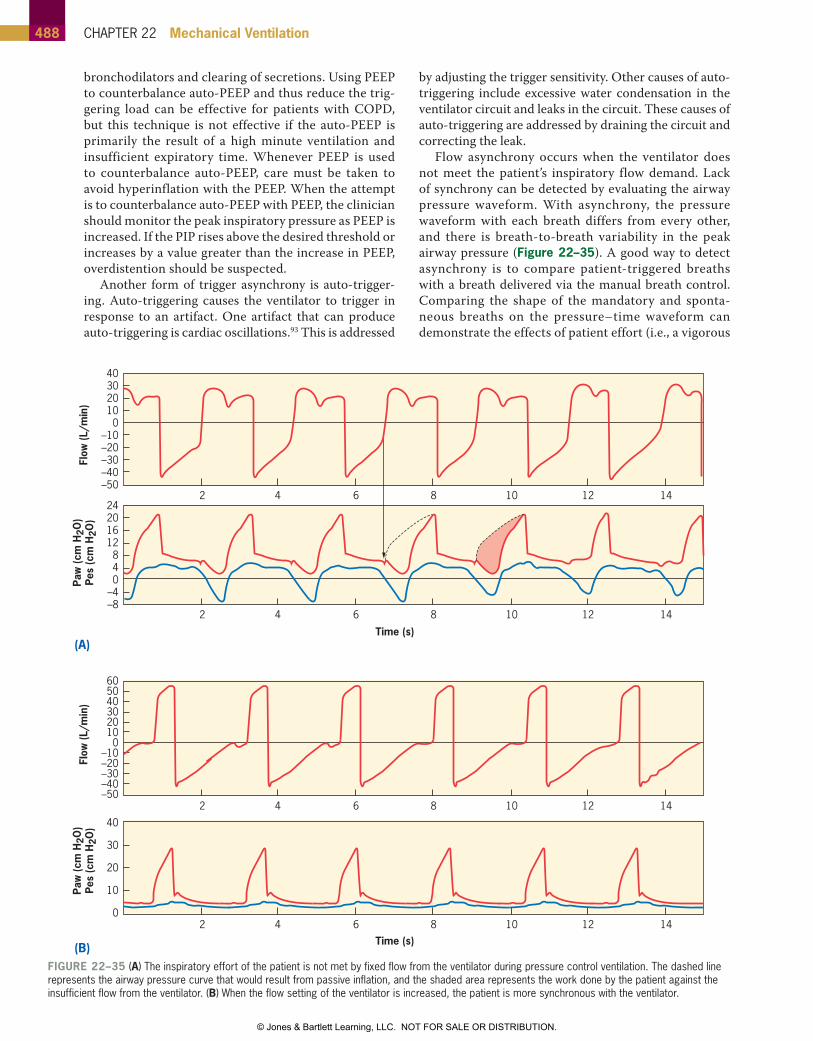


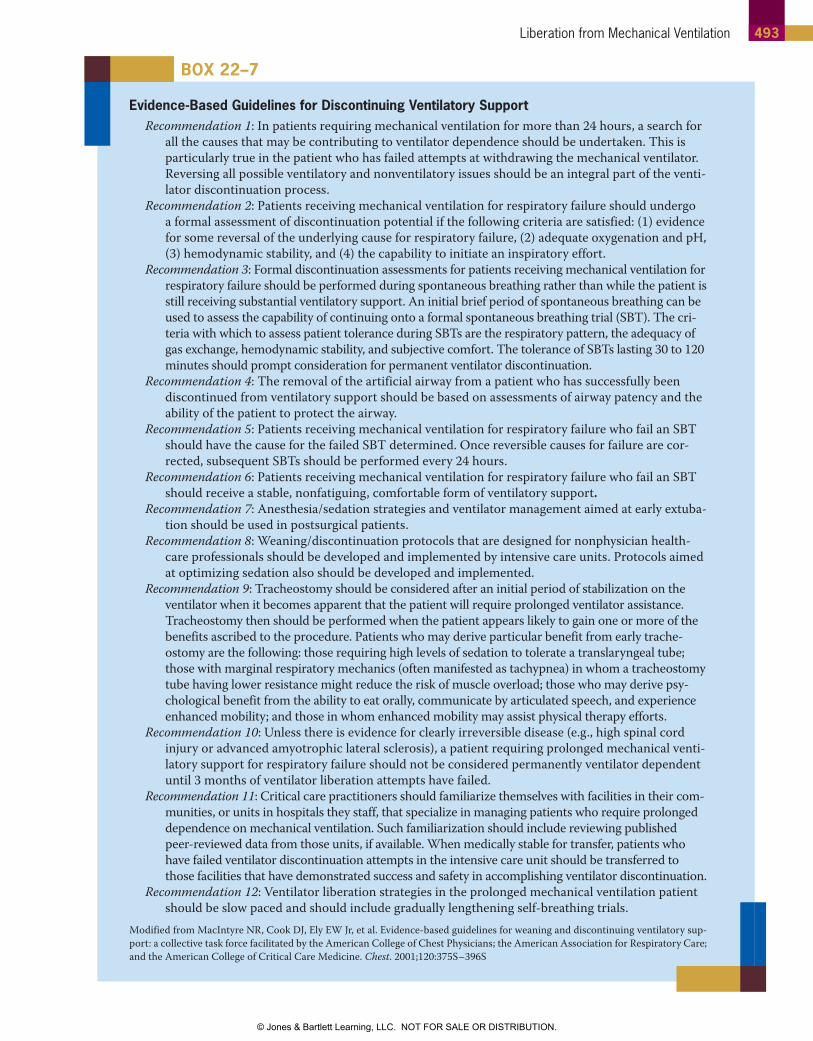


![Ch22[1] Windows](https://static.documents.pub/doc/80x56/55cf8f6a550346703b9c28aa/ch221-windows.jpg)


