58
Dedicated to Hope, Healing and Recovery 2016 Malcolm Baldrige National Quality Award Application 601 West Cameron Avenue Kellogg, Idaho 83837 www.mountainvalleycare.com

Dedicated to Hope, Healing and Recovery
2016 Malcolm Baldrige
National Quality Award Application
601 West Cameron Avenue
Kellogg, Idaho 83837
www.mountainvalleycare.com
Kindred Nursing and Rehabilitation – Mountain Valley 2016 Malcolm Baldrige National Quality Award
Table of Contents
TABLE OF CONTENTS Eligibility Certification Forms:
Organization Chart............................................................................................................................................. O-1 Page A-1 ............................................................................................................................................................ A-1 Glossary of Terms and Abbreviations ............................................................................................................... G-1 Responses to All Criteria Items:
Organizational Profile............................................................................................................................ i P.1 Organizational Description ......................................................................................................... i P.2 Organizational Situation............................................................................................................ iii
Category 1: Leadership..........................................................................................................................1 1.1 Senior Leadership........................................................................................................................1 1.2 Governance and Societal Responsibilities...................................................................................5
Category 2: Strategic Planning .............................................................................................................9 2.1 Strategy Development .................................................................................................................9 2.2 Strategy Implementation ...........................................................................................................11
Category 3: Customer Focus ...............................................................................................................13 3.1 Voice of the Customer...............................................................................................................13 3.2 Customer Engagement ..............................................................................................................15
Category 4: Measurement, Analysis, and Knowledge Management................................................18 4.1 Measurement, Analysis, and Improvement of Organizational Performance .............................18 4.2 Knowledge Management, Information, and Information Technology ......................................20
Category 5: Workforce Focus .............................................................................................................22 5.1 Workforce Environment............................................................................................................22 5.2 Workforce Engagement.............................................................................................................25
Category 6: Operations Focus .............................................................................................................29 6.1 Work Processes .........................................................................................................................29 6.2 Operational Effectiveness..........................................................................................................31
Category 7: Results...............................................................................................................................33 7.1 Health Care and Process Results ...............................................................................................33 7.2 Customer-Focused Results ........................................................................................................39 7.3 Workforce-Focused Results ......................................................................................................41 7.4 Leadership and Governance Results..........................................................................................47 7.5 Financial and Market Results ....................................................................................................49

Kindred Nursing and Rehabilitation – Mountain Valley 2016 Malcolm Baldrige National Quality Award
Glossary of Terms and Abbreviations Page G-1
GLOSSARY OF TERMS AND ABBREVIATIONS
AD Activity Director
AHCA American Health Care Association
AOS Available On Site
BCC Best in Class Comparison
BOD Board of Directors
BOM Business Office Manager
CC Core Competencies
CCM Clinical Case Manager
CMS Centers for Medicare and Medicaid Services
CNA Certified Nursing Assistant
DNS Director of Nursing Services
DVP Divisional Vice President
ED Executive Director
EMR Electronic Medical Record
FAST Find, Analyze, Stabilize, Track
HSG Health Services Group
IDT Interdisciplinary Team
Kindred Kindred Healthcare, Inc.
or KND
KNECT Kindred’s Intranet
KNRMV Kindred Nursing and Rehabilitation – Mountain Valley
KPDOT Key Process for Determining Objectives and Timeline
LMS Learning Management System
LPN Licensed Practical Nurse
LTC Long Term Care
MAR Medication Administration Record
NCD Nursing Center Division
NWD Nursing Center Division Northwest District
PDSA Plan, Do, Study, Act Cycle for Improvement
PIP Performance Improvement Process
RN Registered Nurse
RSM Rehab Service Manager
SA Strategic Advantages
SC Strategic Challenges
SDC Staff Development Coordinator
SEP Service Excellence Program
SNF Skilled Nursing Facility
SO Strategic Objectives
SPP Strategic Planning Process
SS Social Services
TAR Treatment Administration Record
TSI the name of the company providing software solutions for long-term care facilities
QAPI Quality Assurance / Performance Improvement
QI/QM Quality Indicator / Quality Measure

Kindred Nursing and Rehabilitation – Mountain Valley 2016 Malcolm Baldrige National Quality Award
Organizational Profile Page i
ORGANIZATIONAL PROFILE
P.1 Organizational Description
P.1.a. Organizational Environment: Kindred Nursing and Rehabilitation – Mountain Valley (KNRMV or Mountain Valley) is owned by Kindred Healthcare, Inc. (KND or Kindred, a for-profit corporation) and is located in Kellogg. Kellogg is a town of about 2,000 residents in the picturesque “Silver Valley” of Shoshone County in Northern Idaho and is named after Noah Kellogg, a mining prospector. Legend has it that his donkey wandered off to a large outcropping of galena, which led to the discovery of several mines. Those mines led to the founding of our city, where the welcome sign reads “this is the town founded by a jackass and inhabited by his descendants.” While some may not be fond of being referred to as his descendant, all would agree the sign represents the pride our community has of our long mining heritage. Starting in 1981, mines in the area closed or greatly reduced operations, leaving thousands out of work. As a result this economic decline, the total population of Shoshone County has dropped 36% in census from 1970 to 2010. The resilience of the remaining residents, pulling together to take care of their neighbor and their community, was demonstrated through the transitioning of Kellogg to a resort town. New condominiums, hotels, restaurants, and shops were developed along with an indoor water park and 9-hole golf course located at the base of the Silver Mountain Gondola. This is the world’s longest single-cable gondola spanning 3.1 miles from the base to the ski lodge at the top of Kellogg Mountain. Although the setting is beautiful, it masks some of the very real challenges that make long-term care among the most difficult on the spectrum of healthcare service. One is the shortage of qualified workers who can deliver the level of health care services required in a long-term care setting, in particular, licensed nurses. Another challenge for long-term care facilities in rural settings is finding and retaining physicians who are not only willing to practice medicine in a rural area but in a long-term care environment. Current research shows that only about 10 percent of physicians practice in rural America despite the fact that nearly one-fourth of the population lives in these areas. Of those, most prefer private practice or work in the rural critical care access hospitals. Surrounding communities and even the closest rural critical access hospital lack the specialty providers to offer psychiatric services, chemotherapy, or surgical care. A lack of local after-hour urgent care necessitates trips to the emergency room with long waiting times and significantly increased costs. These challenges and others make us even more proud of our outstanding health care and customer satisfaction results and the recognition we have received over the years, shown in Figure P.1-1.
FIGURE P.1-1 Facility Selected Awards and Honors
Recognition Years
Received
US News & World Report, “America’s Best Nursing Homes” – The ranking is based on health inspection
results, adequacy of nursing staffing, and quality of
medical care.
2010, 2011, 2012, 2013, 2014, 2015, 2016
CMS 5-Star Quality Rating System “Overall Quality” – There is one Overall 5-Star rating for each nursing
home with only the top 10% of nursing homes receiving
5 stars.
2009, 2010, 2011, 2012, 2013, 2014, 2015, 2016
Qualis Health Award of Excellence in Health Care – Qualis Health is the Idaho and Washington CMS Quality
Innovation Network
2012, 2014, 2015
State of Idaho L. Jean Schoonover Quality Award – Gold Level – The award is based on three annual
federal/state surveys that measure quality of care and
compliance with regulatory guidelines.
2006, 2007, 2008, 2009, 2010, 2011, 2012, 2013, 2014, 2015, 2016
Providigm (Abaqis Quality Management System) Embracing Quality Award for exceptional achievement in Customer Satisfaction – This award began in 2012
and honored only 258 facilities in the U.S. and Canada.
2012, 2013, 2014, 2015
MyInnerView Excellence in Customer Service – Awarded to facilities in the top 10% of MyInnerView’s
more than 5000 facilities participating. (Kindred
discontinued MyInnerView in 2013)
2007, 2008, 2009, 2010, 2011, 2013
P.1.a(1) Health Care Service Offerings: Our key health care offerings are short-term skilled nursing and rehabilitation (less than 6 months length of stay; 32% of our average daily census) and long-term nursing and rehabilitation (greater than 6 months length of stay; 68% of our average daily census), as shown in Figure P.1-2. All services are delivered directly through our facility workforce. Delivery of our therapy services are through a contract with RehabCare Rehabilitation, an operating segment of Kindred, and delivery of our laundry and housekeeping services are through a contract with Health Services Group (HSG). Both subgroups of employees are integrated at the same level as all the employees of KNRMV and are included in this application under our workforce, meeting all the same requirements and expectations.
FIGURE P.1-2 Key Health Care and Service Offerings
and Delivery Methods
SERVICE OFFERING Relative Importance
to Success
Mechanism used to
Deliver Service
Short-term Care
(Rehab) 22% of Total Revenue
Direct Nursing / Contracted Rehab
Long-term Care 78% of Total Revenue Direct Nursing /
Contracted Rehab
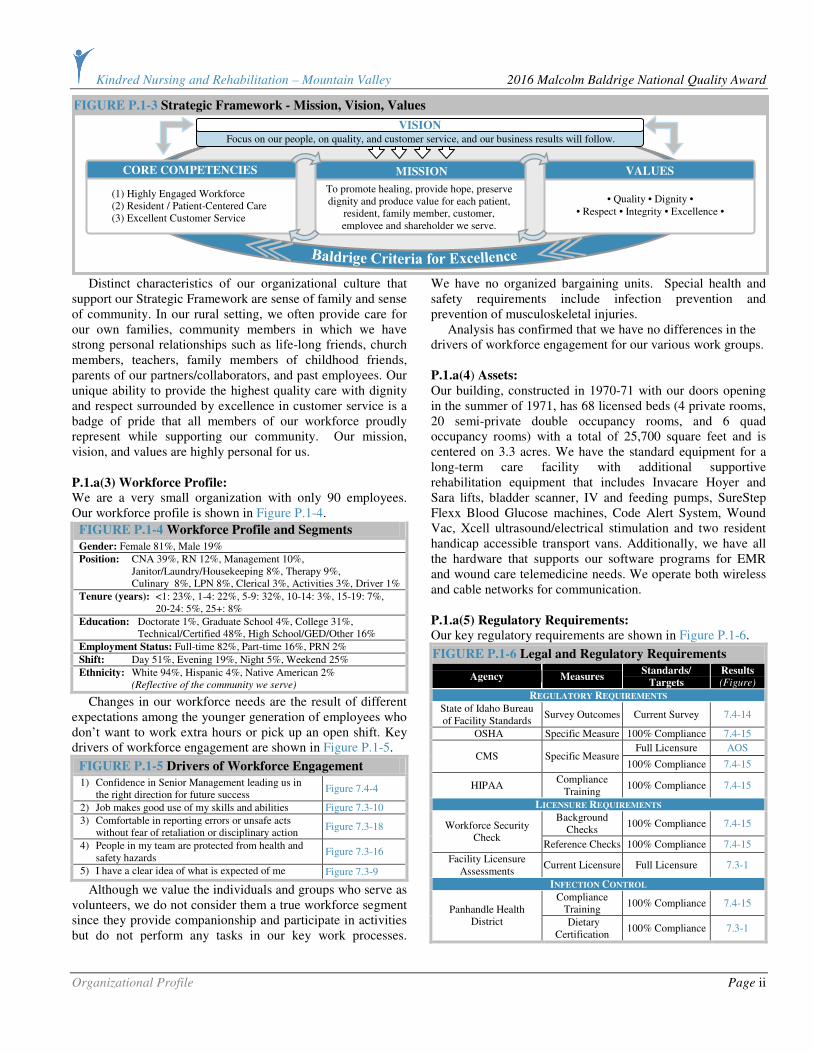
P.1.a(2) Mission, Vision, Values: Our mission, vision, and values are shown in Figure P.1-3 along with our core competencies. Our core competencies are directly related to our ability to execute our mission and achieve our vision.
Kindred Nursing and Rehabilitation – Mountain Valley 2016 Malcolm Baldrige National Quality Award
Organizational Profile Page ii
Distinct characteristics of our organizational culture that support our Strategic Framework are sense of family and sense of community. In our rural setting, we often provide care for our own families, community members in which we have strong personal relationships such as life-long friends, church members, teachers, family members of childhood friends, parents of our partners/collaborators, and past employees. Our unique ability to provide the highest quality care with dignity and respect surrounded by excellence in customer service is a badge of pride that all members of our workforce proudly represent while supporting our community. Our mission, vision, and values are highly personal for us.
P.1.a(3) Workforce Profile: We are a very small organization with only 90 employees. Our workforce profile is shown in Figure P.1-4.
FIGURE P.1-4 Workforce Profile and Segments
Gender: Female 81%, Male 19%
Position: CNA 39%, RN 12%, Management 10%, Janitor/Laundry/Housekeeping 8%, Therapy 9%, Culinary 8%, LPN 8%, Clerical 3%, Activities 3%, Driver 1%
Tenure (years): <1: 23%, 1-4: 22%, 5-9: 32%, 10-14: 3%, 15-19: 7%, 20-24: 5%, 25+: 8%
Education: Doctorate 1%, Graduate School 4%, College 31%, Technical/Certified 48%, High School/GED/Other 16%
Employment Status: Full-time 82%, Part-time 16%, PRN 2%
Shift: Day 51%, Evening 19%, Night 5%, Weekend 25%
Ethnicity: White 94%, Hispanic 4%, Native American 2% (Reflective of the community we serve)
Changes in our workforce needs are the result of different expectations among the younger generation of employees who don’t want to work extra hours or pick up an open shift. Key drivers of workforce engagement are shown in Figure P.1-5.
FIGURE P.1-5 Drivers of Workforce Engagement
1) Confidence in Senior Management leading us in the right direction for future success
Figure 7.4-4
2) Job makes good use of my skills and abilities Figure 7.3-10
3) Comfortable in reporting errors or unsafe acts without fear of retaliation or disciplinary action
Figure 7.3-18
4) People in my team are protected from health and safety hazards
Figure 7.3-16
5) I have a clear idea of what is expected of me Figure 7.3-9
Although we value the individuals and groups who serve as volunteers, we do not consider them a true workforce segment since they provide companionship and participate in activities but do not perform any tasks in our key work processes.
We have no organized bargaining units. Special health and safety requirements include infection prevention and prevention of musculoskeletal injuries. Analysis has confirmed that we have no differences in the drivers of workforce engagement for our various work groups. P.1.a(4) Assets: Our building, constructed in 1970-71 with our doors opening in the summer of 1971, has 68 licensed beds (4 private rooms, 20 semi-private double occupancy rooms, and 6 quad occupancy rooms) with a total of 25,700 square feet and is centered on 3.3 acres. We have the standard equipment for a long-term care facility with additional supportive rehabilitation equipment that includes Invacare Hoyer and Sara lifts, bladder scanner, IV and feeding pumps, SureStep Flexx Blood Glucose machines, Code Alert System, Wound Vac, Xcell ultrasound/electrical stimulation and two resident handicap accessible transport vans. Additionally, we have all the hardware that supports our software programs for EMR and wound care telemedicine needs. We operate both wireless and cable networks for communication.
P.1.a(5) Regulatory Requirements: Our key regulatory requirements are shown in Figure P.1-6.
FIGURE P.1-6 Legal and Regulatory Requirements
Agency Measures Standards/
Targets
Results (Figure)
REGULATORY REQUIREMENTS
State of Idaho Bureau of Facility Standards
Survey Outcomes Current Survey 7.4-14
OSHA Specific Measure 100% Compliance 7.4-15
Full Licensure AOS CMS Specific Measure
100% Compliance 7.4-15
HIPAA Compliance
Training 100% Compliance 7.4-15
LICENSURE REQUIREMENTS
Background Checks
100% Compliance 7.4-15 Workforce Security Check
Reference Checks 100% Compliance 7.4-15
Facility Licensure Assessments
Current Licensure Full Licensure 7.3-1
INFECTION CONTROL
Compliance Training
100% Compliance 7.4-15 Panhandle Health
District Dietary Certification
100% Compliance 7.3-1
FIGURE P.1-3 Strategic Framework - Mission, Vision, Values
Focus on our people, on quality, and customer service, and our business results will follow. VISION
To promote healing, provide hope, preserve dignity and produce value for each patient,
resident, family member, customer, employee and shareholder we serve.
MISSION
CORE COMPETENCIES
(1) Highly Engaged Workforce (2) Resident / Patient-Centered Care (3) Excellent Customer Service
• Quality • Dignity • • Respect • Integrity • Excellence •
VALUES
Kindred Nursing and Rehabilitation – Mountain Valley 2016 Malcolm Baldrige National Quality Award
Organizational Profile Page iii
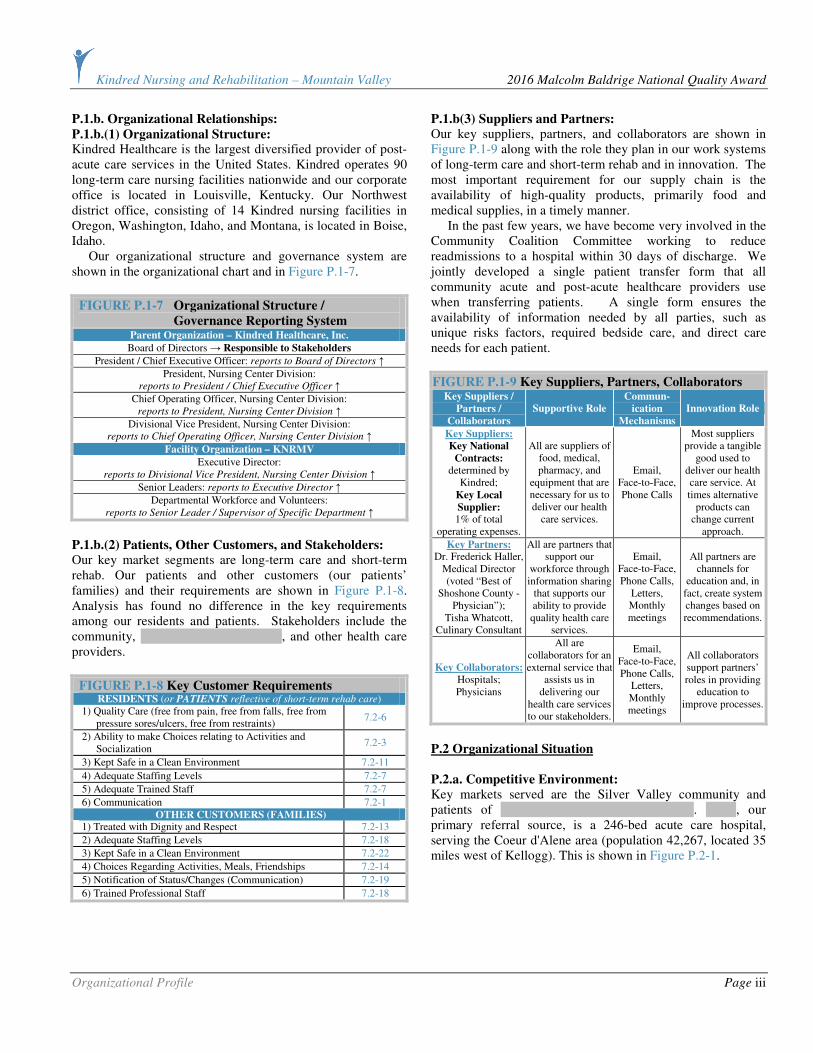
P.1.b. Organizational Relationships:
P.1.b.(1) Organizational Structure: Kindred Healthcare is the largest diversified provider of post-acute care services in the United States. Kindred operates 90 long-term care nursing facilities nationwide and our corporate office is located in Louisville, Kentucky. Our Northwest district office, consisting of 14 Kindred nursing facilities in Oregon, Washington, Idaho, and Montana, is located in Boise, Idaho. Our organizational structure and governance system are shown in the organizational chart and in Figure P.1-7.
FIGURE P.1-7 Organizational Structure /
Governance Reporting System Parent Organization – Kindred Healthcare, Inc.
Board of Directors → Responsible to Stakeholders
President / Chief Executive Officer: reports to Board of Directors ↑
President, Nursing Center Division: reports to President / Chief Executive Officer ↑
Chief Operating Officer, Nursing Center Division: reports to President, Nursing Center Division ↑
Divisional Vice President, Nursing Center Division: reports to Chief Operating Officer, Nursing Center Division ↑
Facility Organization – KNRMV
Executive Director: reports to Divisional Vice President, Nursing Center Division ↑
Senior Leaders: reports to Executive Director ↑
Departmental Workforce and Volunteers: reports to Senior Leader / Supervisor of Specific Department ↑
P.1.b.(2) Patients, Other Customers, and Stakeholders: Our key market segments are long-term care and short-term rehab. Our patients and other customers (our patients’ families) and their requirements are shown in Figure P.1-8. Analysis has found no difference in the key requirements among our residents and patients. Stakeholders include the community, Shoshone Medical Center, and other health care providers.
FIGURE P.1-8 Key Customer Requirements
RESIDENTS (or PATIENTS reflective of short-term rehab care) 1) Quality Care (free from pain, free from falls, free from
pressure sores/ulcers, free from restraints) 7.2-6
2) Ability to make Choices relating to Activities and Socialization
7.2-3
3) Kept Safe in a Clean Environment 7.2-11
4) Adequate Staffing Levels 7.2-7
5) Adequate Trained Staff 7.2-7
6) Communication 7.2-1 OTHER CUSTOMERS (FAMILIES)
1) Treated with Dignity and Respect 7.2-13
2) Adequate Staffing Levels 7.2-18
3) Kept Safe in a Clean Environment 7.2-22
4) Choices Regarding Activities, Meals, Friendships 7.2-14
5) Notification of Status/Changes (Communication) 7.2-19
6) Trained Professional Staff 7.2-18
P.1.b(3) Suppliers and Partners: Our key suppliers, partners, and collaborators are shown in Figure P.1-9 along with the role they plan in our work systems of long-term care and short-term rehab and in innovation. The most important requirement for our supply chain is the availability of high-quality products, primarily food and medical supplies, in a timely manner. In the past few years, we have become very involved in the Community Coalition Committee working to reduce readmissions to a hospital within 30 days of discharge. We jointly developed a single patient transfer form that all community acute and post-acute healthcare providers use when transferring patients. A single form ensures the availability of information needed by all parties, such as unique risks factors, required bedside care, and direct care needs for each patient.
FIGURE P.1-9 Key Suppliers, Partners, Collaborators Key Suppliers /
Partners /
Collaborators
Supportive Role
Commun-
ication
Mechanisms
Innovation Role
Key Suppliers:
Key National
Contracts: determined by
Kindred; Key Local
Supplier: 1% of total
operating expenses.
All are suppliers of food, medical, pharmacy, and
equipment that are necessary for us to deliver our health
care services.
Email, Face-to-Face, Phone Calls
Most suppliers provide a tangible
good used to deliver our health care service. At times alternative
products can change current
approach.
Key Partners: Dr. Frederick Haller,
Medical Director (voted “Best of
Shoshone County - Physician”);
Tisha Whatcott, Culinary Consultant
All are partners that support our
workforce through information sharing
that supports our ability to provide quality health care
services.
Email, Face-to-Face, Phone Calls,
Letters, Monthly meetings
All partners are channels for
education and, in fact, create system changes based on recommendations.
Key Collaborators: Hospitals; Physicians
All are collaborators for an external service that
assists us in delivering our
health care services to our stakeholders.
Email, Face-to-Face, Phone Calls,
Letters, Monthly meetings
All collaborators support partners’ roles in providing
education to improve processes.
P.2 Organizational Situation
P.2.a. Competitive Environment:
Key markets served are the Silver Valley community and patients of Kootenai Medical Center (KMC). KMC, our primary referral source, is a 246-bed acute care hospital, serving the Coeur d'Alene area (population 42,267, located 35 miles west of Kellogg). This is shown in Figure P.2-1.

Kindred Nursing and Rehabilitation – Mountain Valley 2016 Malcolm Baldrige National Quality Award
Organizational Profile Page iv
P.2.a(1) Competitive Position: Our best competitor is …………..……….…………………… located 12 miles east of our facility and is a licensed 50-bed skilled nursing center, with an adjacent 14-bed assisted living and 6 private apartments. Other competitors are 5 skilled nursing facilities located in the Coeur d’Alene area that work directly with KMC. We compete with them to ensure Silver Valley residents return to their community for continued care after an acute medical stay. Our primary opportunity is to continue to be innovative in our approach to provide transportation for follow-up medical care while expanding our collaborative efforts with KMC and additional medical specialists. We have two vans and a back-up van driver, which facilitates the return of our community members to their community which could ultimately correlate to medical costs savings.
P.2.a(2) Competitiveness Changes: The primary change that has a direct impact on our competitive situation is the transfer of our community members to the Coeur d’Alene area for medical care. Our primary opportunity for innovation is to provide transportation for follow-up medical care while expanding our collaborative efforts with KMC and additional medical specialists.
P.2.a(3) Comparative Data: Figure P.2-2 shows our sources of comparative data along with limitations. P.2.b. Strategic Context:
Our key strategic challenges and advantages are shown in Figure P.2-3, along with how they are aligned with our Strategic Objectives (SOs) shown in Figure 2.1-4.
FIGURE P.2-2 Key Comparative Data Sources
Source Data Applicable
Area
Co
mp
ara
tiv
e
Co
mp
etit
ive
Limitations
AHCA LTC Trend Tracker
Quality, Staffing, Regulations, Excellence
● ●
Data Not Always Segmented for Health
Service Type or Workforce
Abaqis Customer
Satisfaction ●
Data Not Segmented by Long-Term Care
and Short-Term Rehab
CMS QI/QM, Quality,
Survey, Excellence, 5-Star
● ●
Data Not Always Segmented by Long-Term Care and Short-
Term Rehab
State of Idaho Bureau of Facility
Standards
Staffing, QI/QM, Survey, Excellence
● ● Only State Data
Kindred’s Business Warehouse
All areas of operations
● Only Kindred Data
Best in Class Comparison
(BCC)
Workforce Satisfaction and
Engagement ●
Data Not Segmented for Workforce; Percentiles Not
Provided
TSI QI/QM, 5-Star,
MDS ●
ONLY KNRMV Information
FIGURE P.2-3 Strategic Context
Area Key Strategic Challenges
(SCs)
Key Strategic Advantages
(SAs)
Health Care
Services
1) Sustaining State and National Clinical Outcomes in the Top 10% (SO1, SO2, SO7)
1) High Customer Satisfaction Outcomes (SO1, SO6, SO7)
2) 7-day a Week Rehabilitation (SO2)
Operations
2) Maintaining Census (SO6, SO7)
3) Managing Resources in Response to Government Reimbursement (SO8)
3) 5-Star Rating for the Past 7 Years (SO3, SO7)
Societal
Responsibilities None
4) A Culture of Performance Excellence (SO3)
5) Strong Commitment to Community
Workforce
4) Retirement Age of the Nursing Staff (SO4. SO5)
6) Highly Engaged Staff (SO4, SO5)
7) Focus on Workforce Education
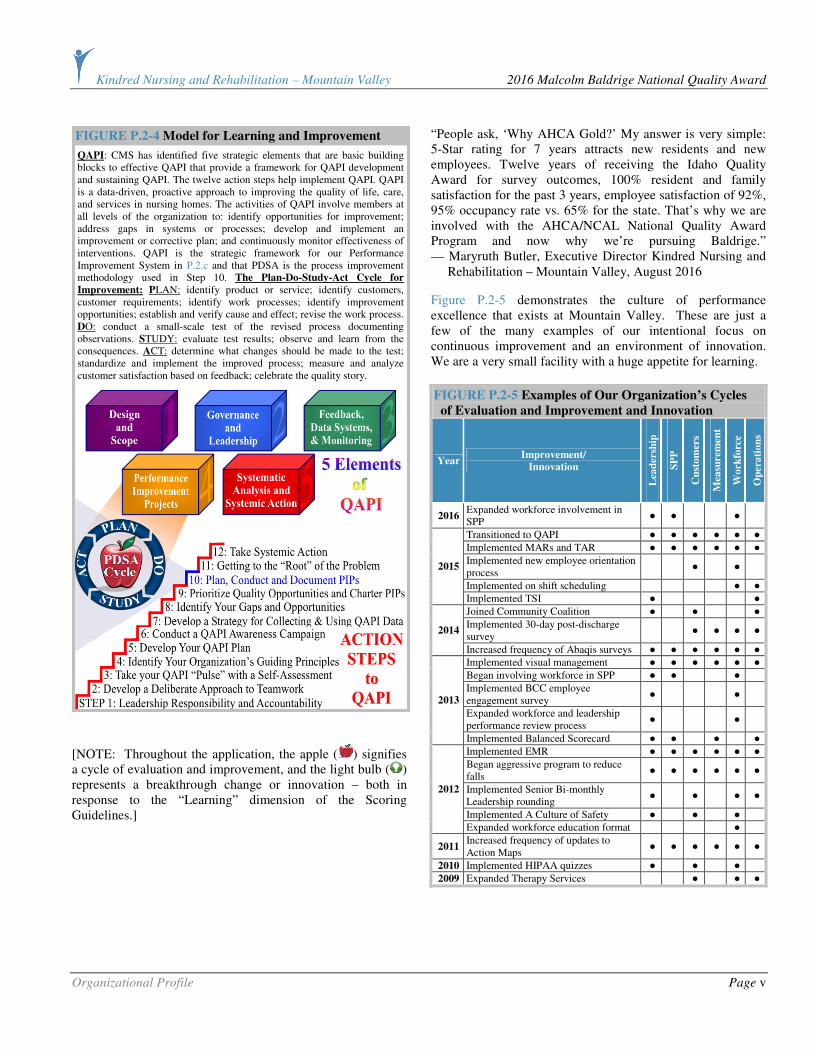
P.2.c. Performance Improvement System: The key elements of our Performance Improvement System are the Quality Assurance/Performance Improvement (QAPI) approach that has become the best practice model in our industry supplemented by the pervasive use of PDSA throughout our facility as shown in Figure P.2-4. In addition, our use of the Baldrige Criteria as part of our multi-year journey progressing through the three tiers of the AHCA/NCAL Quality Award program has provided a strategic umbrella over our Performance Improvement System.
IDA
HO
MO
NT
AN
A
IDA
HO
WA
SH
ING
TO
N
Kootenai
Shoshone
Spokane
Benewah
Latah Clearwater
Mineral
Lincoln
Sanders
FIGURE P.2-1 Service Area
Whitman
Misso
ula.
Flath
ead
Lak
e
Ste
ven
s
Pend Oreille
Primary Service Area
Secondary Service Area
State Border
County (white text) Interstate/Highway
Competitor SNF
Bonner
Hospital
KNRMV (in Kellogg)
SSaannddppooiinntt
SSaaiinntt MMaarriieess
SSuuppeerriioorr
CCooeeuurr dd’’AAlleennee SSppookkaannee
KKeelllloogggg
City
0 25 50 miles
Kindred Nursing and Rehabilitation – Mountain Valley 2016 Malcolm Baldrige National Quality Award
Organizational Profile Page v
[NOTE: Throughout the application, the apple ( ) signifies a cycle of evaluation and improvement, and the light bulb ( ) represents a breakthrough change or innovation – both in response to the “Learning” dimension of the Scoring Guidelines.]
“People ask, ‘Why AHCA Gold?’ My answer is very simple: 5-Star rating for 7 years attracts new residents and new employees. Twelve years of receiving the Idaho Quality Award for survey outcomes, 100% resident and family satisfaction for the past 3 years, employee satisfaction of 92%, 95% occupancy rate vs. 65% for the state. That’s why we are involved with the AHCA/NCAL National Quality Award Program and now why we’re pursuing Baldrige.” — Maryruth Butler, Executive Director Kindred Nursing and Rehabilitation – Mountain Valley, August 2016
Figure P.2-5 demonstrates the culture of performance excellence that exists at Mountain Valley. These are just a few of the many examples of our intentional focus on continuous improvement and an environment of innovation. We are a very small facility with a huge appetite for learning.
FIGURE P.2-5 Examples of Our Organization’s Cycles
of Evaluation and Improvement and Innovation
Year Improvement/
Innovation
Lea
der
ship
SP
P
Cu
sto
mer
s
Mea
sure
men
t
Wo
rkfo
rce
Op
era
tio
ns
2016 Expanded workforce involvement in SPP
● ● ●
Transitioned to QAPI ● ● ● ● ● ●
Implemented MARs and TAR ● ● ● ● ● ●
Implemented new employee orientation process
● ●
Implemented on shift scheduling ● ●
2015
Implemented TSI ● ●
Joined Community Coalition ● ● ●
Implemented 30-day post-discharge survey
● ● ● ● 2014
Increased frequency of Abaqis surveys ● ● ● ● ● ●
Implemented visual management ● ● ● ● ● ●
Began involving workforce in SPP ● ● ●
Implemented BCC employee engagement survey
● ●
Expanded workforce and leadership performance review process
● ●
2013
Implemented Balanced Scorecard ● ● ● ●
Implemented EMR ● ● ● ● ● ●
Began aggressive program to reduce falls
● ● ● ● ● ●
Implemented Senior Bi-monthly Leadership rounding
● ● ● ●
Implemented A Culture of Safety ● ● ●
2012
Expanded workforce education format ●
2011 Increased frequency of updates to Action Maps
● ● ● ● ● ●
2010 Implemented HIPAA quizzes ● ● ●
2009 Expanded Therapy Services ● ● ●
QAPI: CMS has identified five strategic elements that are basic building blocks to effective QAPI that provide a framework for QAPI development and sustaining QAPI. The twelve action steps help implement QAPI. QAPI is a data-driven, proactive approach to improving the quality of life, care, and services in nursing homes. The activities of QAPI involve members at all levels of the organization to: identify opportunities for improvement; address gaps in systems or processes; develop and implement an improvement or corrective plan; and continuously monitor effectiveness of interventions. QAPI is the strategic framework for our Performance Improvement System in P.2.c and that PDSA is the process improvement methodology used in Step 10. The Plan-Do-Study-Act Cycle for
Improvement: PLAN: identify product or service; identify customers, customer requirements; identify work processes; identify improvement opportunities; establish and verify cause and effect; revise the work process. DO: conduct a small-scale test of the revised process documenting observations. STUDY: evaluate test results; observe and learn from the consequences. ACT: determine what changes should be made to the test; standardize and implement the improved process; measure and analyze customer satisfaction based on feedback; celebrate the quality story.
FIGURE P.2-4 Model for Learning and Improvement

Kindred Nursing and Rehabilitation – Mountain Valley 2016 Malcolm Baldrige National Quality Award
Leadership Page 1
CATEGORY 1: LEADERSHIP
1.1 Senior Leadership
1.1a Vision, Values, and Mission: 1.1a.(1) Vision and Values: We set our Vision and Values in collaboration with Kindred, our residents/patients, customers, stakeholders (defined in the Organizational Profile), and key communities. This occurs during our Strategic Planning Process (SPP-Figure 2.1-1), when a complete review of all areas of our Strategic Framework and Action Map (Figure 2.1-4) is performed by our senior leaders. We have a well-defined Leadership System (Figure 1.1-1), which ensures the accomplishment of our organizational objectives through
integration of our Service Excellence Program (SEP-Figures 3.1-2, 5.1-1), Performance Improvement Process (PIP-Figure 6.1-3), Key Stakeholder Requirements, and Action Map. We have multiple tools and approaches in which to deploy our Vision and Values to all levels of our organization, stakeholders, suppliers, partners and collaborators. The methods in which we communicate (Figure 1.1-3) integrates with our culture of “frank two-way” communication at all levels of operations, thereby, fostering an environment of learning, supporting our culture of performance excellence through our QAPI program using our PDSA model.
Our senior leaders’ personal actions reflect a commitment to our values as shown in Figure 1.1-2.
FIGURE 1.1-2 Senior Leaders Demonstrate Commitment to Our Values
Value Personal Actions of Senior Leaders A Senior Leader Story
Qu
ali
ty • Create performance expectations and embracing a
philosophy that promotes continual improvement of our services by leadership rounds.
• Lead and/or participate in performance improvement.
• Provide on-going training.
Jodi, SDC, is very involved in working with the workforce on designing an inservice structure that supports a flexible schedule. Through this process, our inservice education hours continue to increase year after year in addition to employee satisfaction outcomes demonstrating positive trends for areas associated with leadership in particular dedication to patient care and the well-being of our workforce.
Dig
nit
y • Demonstrate commitment to interpersonal excellence
through professional greetings, proper telephone etiquette, common courtesy, a professional attitude, and appearance.
Maryruth, ED, works with leaders to ensure that all staff presents themselves in a professional manner each day of the week. Through the philosophy of “there is only one chance to make a first impression,” casual Fridays were eliminated with the workforce’s support.
Res
pec
t • Create an environment supportive of frank, two-way communication and recognizing a job well done.
• Are trained in the 8 elements of SEP and responsible for its deployment to staff.
Janet, DNS, is the primary leader who has worked with all staff on respectful communication. She has worked directly with all nursing staff ensuring that high professional standards are met when communicating with physicians, families, and residents; supporting positive outcomes in customer satisfaction.
Inte
gri
ty • Are trained in the delivery of fair performance
evaluations.
• Maintain Kindred’s Code of Conduct.
• Train the workforce on end of life decisions.
• Resolve conflict in a fair manner.
Jennifer, SS, works closely with Hospice for workforce education relating to end of life decisions and the impact they have on families and residents. In addition, she has provided education supporting the Code of Conduct in terms of reporting concerns, issues, and/or errors that may have occurred in our center. As a result of these interactions, we have experienced increased employee engagement levels in our work environment areas.
Exce
llen
ce
• Address customer concerns.
• Participate in strategic planning and goal setting.
• Support engagement of all stakeholders for the purpose of achieving excellence in all areas of operation.
Emilee, AD, is very involved in “thinking outside the box” to achieve positive outcomes. Emilee has introduced aroma therapy to our center for the purpose of improving quality of care, behavior interventions, and improved work environment. In addition, Emilee is the senior leader organizer for the annual offsite strategic planning meeting, which supports an environment with less distraction for all senior leaders during the planning process.
1.1a.(2) Promoting Legal and Ethical Behavior:
Senior leaders promote an environment that results in legal
and ethical behavior by (1) Code of Conduct, (2) SEP,
(3) leadership competencies, and (4) internal audits. Senior
leaders are responsible for signing, supporting, and ensuring
staff adhere to the Code of Conduct that addresses quality,
financial practices, business practices, conflict of interest,
safeguarding resources, and compliance with laws (Figure
7.4-15). They are also responsible for embracing SEP and
educating their staff in the 4 key areas and 8 success elements
of the program. Each senior leader is required to maintain all
levels of leadership competencies and grow them through
annual personal and professional goal setting. Senior leaders
perform quarterly audits that address specific compliance
FIGURE 1.1-1 Leadership System
Provide Exceptional, Quality Care
Value our People Achieve Operational Excellence
Focus on our Customers
VISION: FOCUS ON OUR PEOPLE, ON QUALITY, AND CUSTOMER SERVICE
COMMUNITY RESIDENTS • FAMILIES
WORKFORCE PARTNERS • COLLABORATORS
Kindred Nursing and Rehabilitation – Mountain Valley 2016 Malcolm Baldrige National Quality Award
Leadership Page 2
areas such as MDS coding and billing verification (Figure
7.1-38). All senior leaders participate in the Quality First
Pledge that supports commitment to quality and commitment
to making information about our quality outcomes available to
the public. Our compliance hotline number is posted and
employees are educated on it and encouraged to participate if
they feel that, through other channels, senior leaders have not
been responsive to their legal and ethical concerns (Figure
7.4-15). Also, Maryruth, ED, and Janet, DNS, have a signed
contract to be “gatekeepers” for ethical and legal behavior
practices in all levels of operations. Deployment to our
workforce occurs through formal channels but primarily
through Leadership Daily Rounds. In an effort to ensure
that we continue to communicate the requirement of ethical
behavior by our workforce, we developed a “survey ready”
quiz in 2008 for all employees. The quiz comprised different
ethical and care scenarios, “how would you handle this,” and
“where would you find this information.” The quiz was
reviewed at an inservice, with reward and recognition given to
employees who completed it correctly. As the result of this
open discussion, we learned that some of our newer
employees did not know where to find recent survey results.
We added this to our new employee orientation, and we
continued to do this annual quiz, changing questions to allow
for additional learning opportunities. In ongoing cycles of
evaluation and improvement in 2013 and 2015, we developed
four pre-survey quizzes that continue to be comprised of
questions from policies and procedures, areas identified during
pre-surveys by Kindred consultants, areas that have been cited
as deficiencies in sister facilities, external industry issues, and
continuing education associated with current QAPI projects.
In the first quarter of 2016, all four quizzes were reviewed and
updated by the QAPI Committee to ensure that all required
information is still pertinent to annual survey training. Jodi has also placed a board in the employee breakroom area with the name of each employee and the quiz number. A new quiz is distributed every two weeks during our survey
window (the not less than 9 months and not more than 15 month period between annual health surveys). Once the employee has completed the quiz, a star goes beside their name, and Jodi provides them with a small “thank you” gift. Once all four quizzes have been completed, we draw a name from all of the employees who have completed all four of the quizzes for a grand prize. In 2015, all employees completed all four quizzes, including our contract employees from HSG and RehabCare. Deployment of center-specific education to all employees supports employee engagement, demonstrated by the increase from 69% in 2013 to 90% in 2015 for agreement to the question, “I have received the training I need to do a quality job” (Figure 7.3-47). In August of 2015, during our QAPI meeting, we identified that a key workforce group did not have employee engagement outcomes – in particular RehabCare employees. RehabCare participates in their own annual employee engagement survey; however, the small centers are aggregated and no specific center information is available. The QAPI Committee decided to capture data from both contract services – RehabCare and HSG – to assess their engagement along with Kindred staff. Our center has developed a simple survey that the QAPI Committee will administer. Tara and Toni from RehabCare and HSG will coordinate with Maryruth for completion of this survey and compiling the data.
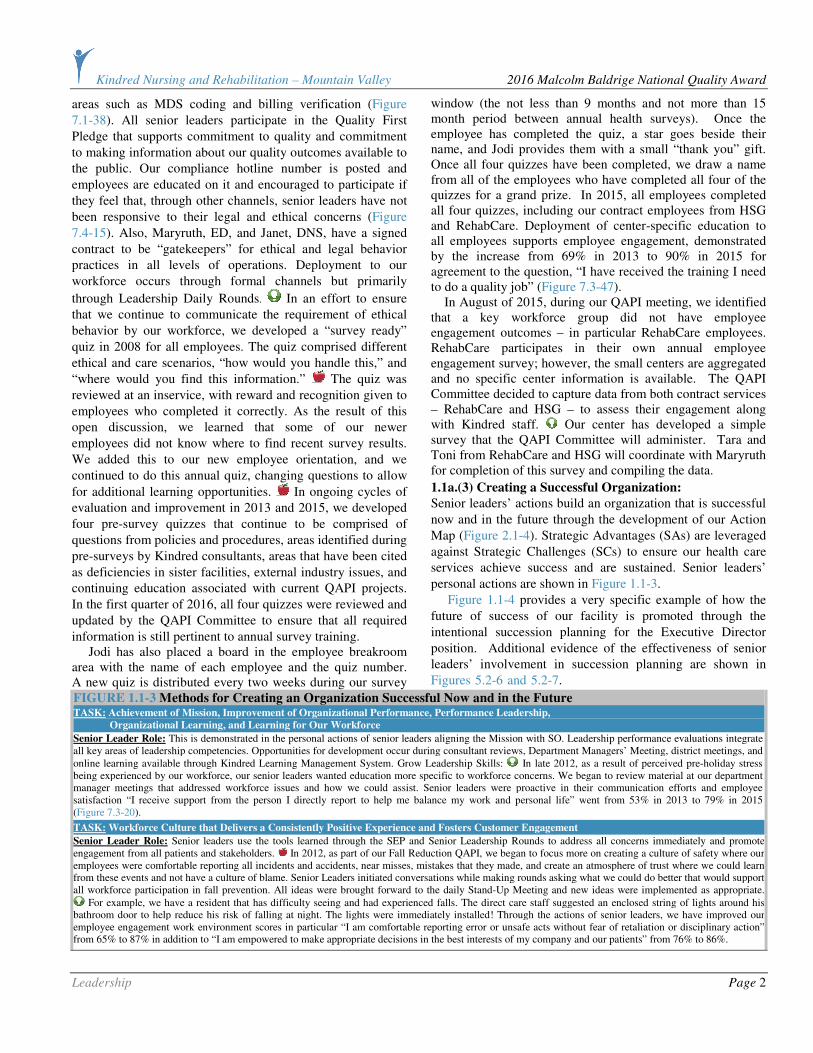
1.1a.(3) Creating a Successful Organization:
Senior leaders’ actions build an organization that is successful
now and in the future through the development of our Action
Map (Figure 2.1-4). Strategic Advantages (SAs) are leveraged
against Strategic Challenges (SCs) to ensure our health care
services achieve success and are sustained. Senior leaders’
personal actions are shown in Figure 1.1-3.
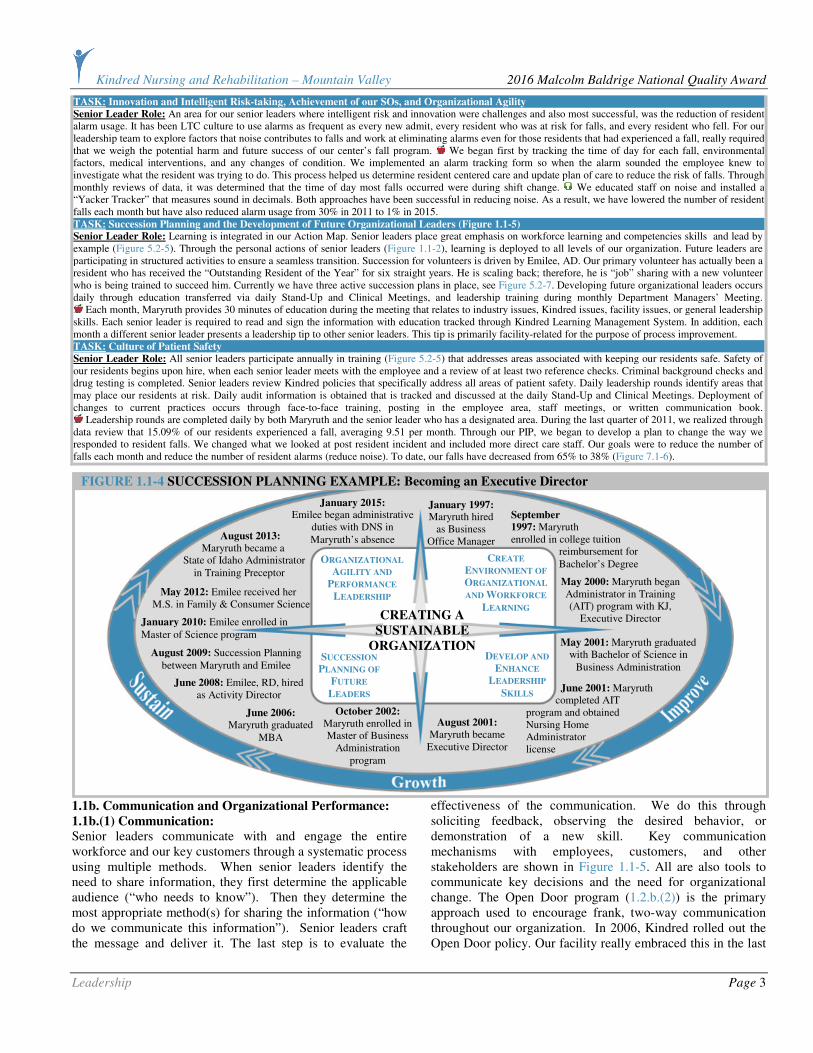
Figure 1.1-4 provides a very specific example of how the
future of success of our facility is promoted through the
intentional succession planning for the Executive Director
position. Additional evidence of the effectiveness of senior
leaders’ involvement in succession planning are shown in
Figures 5.2-6 and 5.2-7. .
FIGURE 1.1-3 Methods for Creating an Organization Successful Now and in the Future TASK: Achievement of Mission, Improvement of Organizational Performance, Performance Leadership,
Organizational Learning, and Learning for Our Workforce
Senior Leader Role: This is demonstrated in the personal actions of senior leaders aligning the Mission with SO. Leadership performance evaluations integrate all key areas of leadership competencies. Opportunities for development occur during consultant reviews, Department Managers’ Meeting, district meetings, and online learning available through Kindred Learning Management System. Grow Leadership Skills: In late 2012, as a result of perceived pre-holiday stress being experienced by our workforce, our senior leaders wanted education more specific to workforce concerns. We began to review material at our department manager meetings that addressed workforce issues and how we could assist. Senior leaders were proactive in their communication efforts and employee satisfaction “I receive support from the person I directly report to help me balance my work and personal life” went from 53% in 2013 to 79% in 2015 (Figure 7.3-20).
TASK: Workforce Culture that Delivers a Consistently Positive Experience and Fosters Customer Engagement
Senior Leader Role: Senior leaders use the tools learned through the SEP and Senior Leadership Rounds to address all concerns immediately and promote engagement from all patients and stakeholders. In 2012, as part of our Fall Reduction QAPI, we began to focus more on creating a culture of safety where our employees were comfortable reporting all incidents and accidents, near misses, mistakes that they made, and create an atmosphere of trust where we could learn from these events and not have a culture of blame. Senior Leaders initiated conversations while making rounds asking what we could do better that would support all workforce participation in fall prevention. All ideas were brought forward to the daily Stand-Up Meeting and new ideas were implemented as appropriate.
For example, we have a resident that has difficulty seeing and had experienced falls. The direct care staff suggested an enclosed string of lights around his bathroom door to help reduce his risk of falling at night. The lights were immediately installed! Through the actions of senior leaders, we have improved our employee engagement work environment scores in particular “I am comfortable reporting error or unsafe acts without fear of retaliation or disciplinary action” from 65% to 87% in addition to “I am empowered to make appropriate decisions in the best interests of my company and our patients” from 76% to 86%.
Kindred Nursing and Rehabilitation – Mountain Valley 2016 Malcolm Baldrige National Quality Award
Leadership Page 3
TASK: Innovation and Intelligent Risk-taking, Achievement of our SOs, and Organizational Agility
Senior Leader Role: An area for our senior leaders where intelligent risk and innovation were challenges and also most successful, was the reduction of resident alarm usage. It has been LTC culture to use alarms as frequent as every new admit, every resident who was at risk for falls, and every resident who fell. For our leadership team to explore factors that noise contributes to falls and work at eliminating alarms even for those residents that had experienced a fall, really required that we weigh the potential harm and future success of our center’s fall program. We began first by tracking the time of day for each fall, environmental factors, medical interventions, and any changes of condition. We implemented an alarm tracking form so when the alarm sounded the employee knew to investigate what the resident was trying to do. This process helped us determine resident centered care and update plan of care to reduce the risk of falls. Through monthly reviews of data, it was determined that the time of day most falls occurred were during shift change. We educated staff on noise and installed a “Yacker Tracker” that measures sound in decimals. Both approaches have been successful in reducing noise. As a result, we have lowered the number of resident falls each month but have also reduced alarm usage from 30% in 2011 to 1% in 2015. TASK: Succession Planning and the Development of Future Organizational Leaders (Figure 1.1-5) Senior Leader Role: Learning is integrated in our Action Map. Senior leaders place great emphasis on workforce learning and competencies skills and lead by example (Figure 5.2-5). Through the personal actions of senior leaders (Figure 1.1-2), learning is deployed to all levels of our organization. Future leaders are participating in structured activities to ensure a seamless transition. Succession for volunteers is driven by Emilee, AD. Our primary volunteer has actually been a resident who has received the “Outstanding Resident of the Year” for six straight years. He is scaling back; therefore, he is “job” sharing with a new volunteer who is being trained to succeed him. Currently we have three active succession plans in place, see Figure 5.2-7. Developing future organizational leaders occurs daily through education transferred via daily Stand-Up and Clinical Meetings, and leadership training during monthly Department Managers’ Meeting.
Each month, Maryruth provides 30 minutes of education during the meeting that relates to industry issues, Kindred issues, facility issues, or general leadership skills. Each senior leader is required to read and sign the information with education tracked through Kindred Learning Management System. In addition, each month a different senior leader presents a leadership tip to other senior leaders. This tip is primarily facility-related for the purpose of process improvement. TASK: Culture of Patient Safety
Senior Leader Role: All senior leaders participate annually in training (Figure 5.2-5) that addresses areas associated with keeping our residents safe. Safety of our residents begins upon hire, when each senior leader meets with the employee and a review of at least two reference checks. Criminal background checks and drug testing is completed. Senior leaders review Kindred policies that specifically address all areas of patient safety. Daily leadership rounds identify areas that may place our residents at risk. Daily audit information is obtained that is tracked and discussed at the daily Stand-Up and Clinical Meetings. Deployment of changes to current practices occurs through face-to-face training, posting in the employee area, staff meetings, or written communication book.
Leadership rounds are completed daily by both Maryruth and the senior leader who has a designated area. During the last quarter of 2011, we realized through data review that 15.09% of our residents experienced a fall, averaging 9.51 per month. Through our PIP, we began to develop a plan to change the way we responded to resident falls. We changed what we looked at post resident incident and included more direct care staff. Our goals were to reduce the number of falls each month and reduce the number of resident alarms (reduce noise). To date, our falls have decreased from 65% to 38% (Figure 7.1-6).
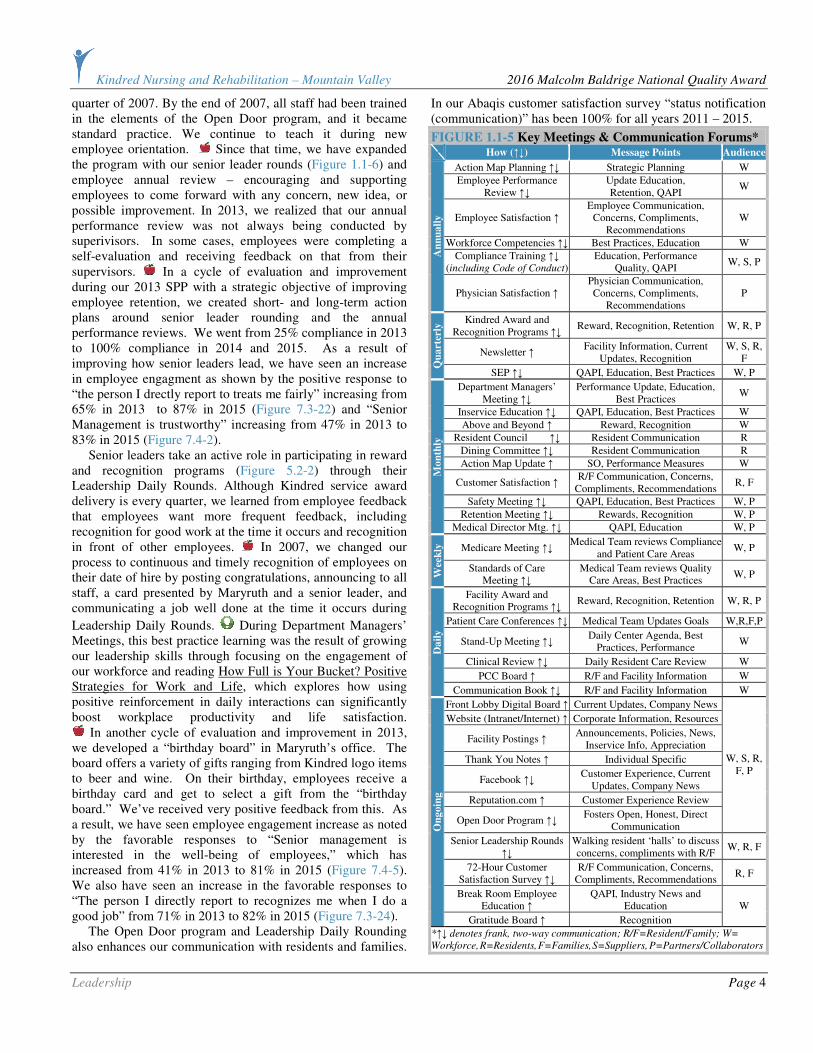
1.1b. Communication and Organizational Performance:
1.1b.(1) Communication: Senior leaders communicate with and engage the entire workforce and our key customers through a systematic process using multiple methods. When senior leaders identify the need to share information, they first determine the applicable audience (“who needs to know”). Then they determine the most appropriate method(s) for sharing the information (“how do we communicate this information”). Senior leaders craft the message and deliver it. The last step is to evaluate the
effectiveness of the communication. We do this through soliciting feedback, observing the desired behavior, or demonstration of a new skill. Key communication mechanisms with employees, customers, and other stakeholders are shown in Figure 1.1-5. All are also tools to communicate key decisions and the need for organizational change. The Open Door program (1.2.b.(2)) is the primary approach used to encourage frank, two-way communication throughout our organization. In 2006, Kindred rolled out the Open Door policy. Our facility really embraced this in the last
ORGANIZATIONAL
AGILITY AND
PERFORMANCE
LEADERSHIP
SUCCESSION
PLANNING OF
FUTURE
LEADERS
DEVELOP AND
ENHANCE
LEADERSHIP
SKILLS
CREATING A
SUSTAINABLE
ORGANIZATION
CREATE
ENVIRONMENT OF
ORGANIZATIONAL
AND WORKFORCE
LEARNING
January 1997: Maryruth hired
as Business Office Manager
September
1997: Maryruth enrolled in college tuition reimbursement for Bachelor’s Degree
May 2000: Maryruth began Administrator in Training (AIT) program with KJ,
Executive Director May 2001: Maryruth graduated
with Bachelor of Science in Business Administration
June 2001: Maryruth completed AIT program and obtained Nursing Home Administrator license
August 2001: Maryruth became
Executive Director
October 2002: Maryruth enrolled in Master of Business
Administration program
June 2006: Maryruth graduated
MBA
June 2008: Emilee, RD, hired as Activity Director
August 2009: Succession Planning between Maryruth and Emilee
January 2010: Emilee enrolled in Master of Science program
January 2015: Emilee began administrative
duties with DNS in Maryruth’s absence
May 2012: Emilee received her M.S. in Family & Consumer Science
August 2013: Maryruth became a State of Idaho Administrator in Training Preceptor
FIGURE 1.1-4 SUCCESSION PLANNING EXAMPLE: Becoming an Executive Director
Kindred Nursing and Rehabilitation – Mountain Valley 2016 Malcolm Baldrige National Quality Award
Leadership Page 4
quarter of 2007. By the end of 2007, all staff had been trained in the elements of the Open Door program, and it became standard practice. We continue to teach it during new employee orientation. Since that time, we have expanded the program with our senior leader rounds (Figure 1.1-6) and employee annual review – encouraging and supporting employees to come forward with any concern, new idea, or possible improvement. In 2013, we realized that our annual performance review was not always being conducted by superivisors. In some cases, employees were completing a self-evaluation and receiving feedback on that from their supervisors. In a cycle of evaluation and improvement during our 2013 SPP with a strategic objective of improving employee retention, we created short- and long-term action plans around senior leader rounding and the annual performance reviews. We went from 25% compliance in 2013 to 100% compliance in 2014 and 2015. As a result of improving how senior leaders lead, we have seen an increase in employee engagment as shown by the positive response to “the person I drectly report to treats me fairly” increasing from 65% in 2013 to 87% in 2015 (Figure 7.3-22) and “Senior Management is trustworthy” increasing from 47% in 2013 to 83% in 2015 (Figure 7.4-2). Senior leaders take an active role in participating in reward and recognition programs (Figure 5.2-2) through their Leadership Daily Rounds. Although Kindred service award delivery is every quarter, we learned from employee feedback that employees want more frequent feedback, including recognition for good work at the time it occurs and recognition in front of other employees. In 2007, we changed our process to continuous and timely recognition of employees on their date of hire by posting congratulations, announcing to all staff, a card presented by Maryruth and a senior leader, and communicating a job well done at the time it occurs during
Leadership Daily Rounds. During Department Managers’ Meetings, this best practice learning was the result of growing our leadership skills through focusing on the engagement of our workforce and reading How Full is Your Bucket? Positive Strategies for Work and Life, which explores how using positive reinforcement in daily interactions can significantly boost workplace productivity and life satisfaction.
In another cycle of evaluation and improvement in 2013, we developed a “birthday board” in Maryruth’s office. The board offers a variety of gifts ranging from Kindred logo items to beer and wine. On their birthday, employees receive a birthday card and get to select a gift from the “birthday board.” We’ve received very positive feedback from this. As a result, we have seen employee engagement increase as noted by the favorable responses to “Senior management is interested in the well-being of employees,” which has increased from 41% in 2013 to 81% in 2015 (Figure 7.4-5). We also have seen an increase in the favorable responses to “The person I directly report to recognizes me when I do a good job” from 71% in 2013 to 82% in 2015 (Figure 7.3-24). The Open Door program and Leadership Daily Rounding also enhances our communication with residents and families.
In our Abaqis customer satisfaction survey “status notification (communication)” has been 100% for all years 2011 – 2015.
FIGURE 1.1-5 Key Meetings & Communication Forums*
How (↑↓) Message Points Audience
Action Map Planning ↑↓ Strategic Planning W
Employee Performance Review ↑↓
Update Education, Retention, QAPI
W
Employee Satisfaction ↑ Employee Communication,
Concerns, Compliments, Recommendations
W
Workforce Competencies ↑↓ Best Practices, Education W
Compliance Training ↑↓ (including Code of Conduct)
Education, Performance Quality, QAPI
W, S, P
An
nu
all
y
Physician Satisfaction ↑ Physician Communication, Concerns, Compliments,
Recommendations P
Kindred Award and Recognition Programs ↑↓
Reward, Recognition, Retention W, R, P
Newsletter ↑ Facility Information, Current
Updates, Recognition W, S, R,
F
Qu
art
erly
SEP ↑↓ QAPI, Education, Best Practices W, P
Department Managers’ Meeting ↑↓
Performance Update, Education, Best Practices
W
Inservice Education ↑↓ QAPI, Education, Best Practices W
Above and Beyond ↑ Reward, Recognition W
Resident Council ↑↓ Resident Communication R
Dining Committee ↑↓ Resident Communication R
Action Map Update ↑ SO, Performance Measures W
Customer Satisfaction ↑ R/F Communication, Concerns,
Compliments, Recommendations R, F
Safety Meeting ↑↓ QAPI, Education, Best Practices W, P
Retention Meeting ↑↓ Rewards, Recognition W, P
Mo
nth
ly
Medical Director Mtg. ↑↓ QAPI, Education W, P
Medicare Meeting ↑↓ Medical Team reviews Compliance
and Patient Care Areas W, P
Wee
kly
Standards of Care Meeting ↑↓
Medical Team reviews Quality Care Areas, Best Practices
W, P
Facility Award and Recognition Programs ↑↓
Reward, Recognition, Retention W, R, P
Patient Care Conferences ↑↓ Medical Team Updates Goals W,R,F,P
Stand-Up Meeting ↑↓ Daily Center Agenda, Best
Practices, Performance W
Clinical Review ↑↓ Daily Resident Care Review W
PCC Board ↑ R/F and Facility Information W
Da
ily
Communication Book ↑↓ R/F and Facility Information W
Front Lobby Digital Board ↑ Current Updates, Company News
Website (Intranet/Internet) ↑ Corporate Information, Resources
Facility Postings ↑ Announcements, Policies, News,
Inservice Info, Appreciation
Thank You Notes ↑ Individual Specific
Facebook ↑↓ Customer Experience, Current
Updates, Company News
Reputation.com ↑ Customer Experience Review
Open Door Program ↑↓ Fosters Open, Honest, Direct
Communication
W, S, R, F, P
Senior Leadership Rounds ↑↓
Walking resident ‘halls’ to discuss concerns, compliments with R/F
W, R, F
72-Hour Customer Satisfaction Survey ↑↓
R/F Communication, Concerns, Compliments, Recommendations
R, F
Break Room Employee Education ↑
QAPI, Industry News and Education
On
goin
g
Gratitude Board ↑ Recognition
W
*↑↓ denotes frank, two-way communication; R/F=Resident/Family; W=
Workforce, R=Residents, F=Families, S=Suppliers, P=Partners/Collaborators

Kindred Nursing and Rehabilitation – Mountain Valley 2016 Malcolm Baldrige National Quality Award
Leadership Page 5
1.1b.(2) Focus on Action: Senior leaders use (1) QAPI, (2) Action Map / Strategic Plan, and (3) SEP to create a focus on action that will enable us to achieve our organization’s mission. Through these processes, we have learned the Action Map aligns and supports the beginning of the integration for the Mission, Vision, Values, CC, SA, and SC, and rewards and recognition (Figure 5.2-2) support a focus for high performance. Review of performance measures identifies if senior leaders must take any action for change. Creating balance for all stakeholders requires senior leaders use Key Customer Requirements (Figure P.1-8), and Key Suppliers, Partners, and Collaborators (Figure P.1-9). Through these processes, we align stakeholder requirements with performance expectations as shown in Figure 2.1-4. We achieve innovation and intelligent risk taking through our innovation management process (6.1.c) and through the ways that we empower our workforce (5.2a.(1)). We remind our staff that actions they take that align with our values and are fact-based will not result in criticism even if the outcome is not as expected. For example, a resident was scheduled to discharge home, but the equipment didn’t arrive in time. The weekend charge nurse had the family pick up a wheelchair, walker, and bedside commode for the resident’s use while they waited for their own equipment to be delivered. Although other options might have been possible, we understood that the charge nurse was taking an intelligent risk to keep the resident safe at home, aligning with our value of focus on customers. In another example, a resident was in the active stages of passing away. His family wanted to bring in his dog to be with him. Another weekend charge nurse gave them permission to bring in the dog who stayed with the resident, providing him comfort until the very end.
A systematic approach that we use to create focus on actions that support our vision, QAPI, and create value for our customers and stakeholders has been our journey to performance excellence beginning with the AHCA/NCAL Quality Award program.
In 2007, our facility received the Silver Award with examiner feedback identifying opportunities for improvement in “focus on the future.” While we have a strong commitment to community, we identified that we were not doing enough to get community members back to their community after acute care stays in KMC. Kindred created financial incentives for facilities that achieved the different levels of recognition from
the Quality Award program. Our senior leaders agreed the incentive funds should be invested in a second van to ensure that our center was meeting the needs of all resident/patient with follow-up medical care and new patient referrals. 1.2 Governance and Societal Responsibilities
1.2a. Organizational Governance:
1.2a.(1) Governance System: We ensure responsible governance through the systematic processes described in Figure 1.2-1.
FIGURE 1.2-1 Governance System
TASK: Accountability for the Senior Leaders’ Actions: Senior Leader Role: The Executive Director holds senior leader accounttable through daily review of clinical outcomes, labor, budget management, and professional interactions. In review of senior leader rounds for 2012, we identified that we did not have a systematic process to track bi-monthly completion of senior leader rounds. Although senior leaders confirmed they were making rounds at least weekly, they were not consistent about completing the form. Maryruth developed a tracking form that senior leaders complete bi-monthly. Senior leaders during strategic planning for 2013 identified this tracking form as one of the performance measures for SO 6 resident/family satisfaction. This performance item is reviewed by Maryruth and senior leader quarterly and during annual performance evaluation of each senior leader. Senior leader bi-monthly completion of form increased from 50% in 2013 to 100% in 2015 but more importantly through this process improvement employee engagement “Senior Management shows by its actions that patient care is a top priority at my organization” improved from 59% in 2013 to 84% in 2015. TASK: Accountability for Strategic Plan: Senior Leader Role: The DVP, ED, and DNS conduct a monthly operational review of the Balanced Scorecard with all areas of quality of care QI/QM, SOC, Abaqis, nursing labor hours, and all financial areas are reviewed for accuracy and any YTD variances. If any area is determined to be out of compliance, an action plan is required. Through our Action Map (Figure 2.1-4), we review all clinical and staffing areas daily Stand-Up Meeting.
Maryruth assigns sections to Senior Leaders (these don’t change)
FIGURE 1.1-6 Senior Leader Daily Rounds
Maryruth created sheet with “Key Areas of Focus” consisting of interventions from Resident’s plan of care that should be implemented at bedside and anything individually.
ROUNDS WORKSHEET UPDATED
Maryruth creates
Performance Expectations
Senior Leaders: Kathy, Nora, Jodi, Tami, Rachel, Janet, Jenni, Emilee Maryruth creates room assignment sections (these don’t change)
1 2
Senior Leaders are required to round: - ONCE PER WEEK (routine), AND
- DAILY if new section CNA/front-line staff, AND
- EVERY 2 HOURS if surveyors in center, prior to a resident room change, or new admission AND - Complete 72-hour Post-admission Survey.
Senior Leaders make
complete rounds, note any changes onto form, sign, date, and return
to Maryruth.
Maryruth reviews forms and any notations. Nora maintains form when Maryruth is absent.
Follow-up with IDT if
needed.
3
4
5
6
Maryruth adds any changes as they
occur in the daily Stand-Up meeting.
IDT reviews all residents plan of care quarterly.
IDT reviews resident’s change of
condition plan of care as needed.
Nora reviews the form monthly against CNA
Kardex to ensure accurate information.
Senior Leadership ‘Rounds’ Example
Room # 202A
Resident Name Jane Doe *FALLING*
Fall Intervention Low bed, perimeter, MAT,
nonskid footwear
Skin Intervention Air Mattress Setting
Oxygen CPAP at night, oxygen setting
Restraints, Belts, Bedrails Self release belt with alarm
Alarms Belt – Bed
Wanderguard Placement
Splint R ankle brace 8-12 hours/day
Weight Interventions Tube Feeding
OTHER transfer type, cath bag, code status
Triple Check: lifts clean, hallway clutter, staff knocking, water bedside, resident refrigerator, names on door, bedheads, eyeglasses, wash hands, room clutter, turn every 2 hr, no meds
in room, med equip, plugged in strips, fan, neb in bag.
Kindred Nursing and Rehabilitation – Mountain Valley 2016 Malcolm Baldrige National Quality Award
Leadership Page 6
All other areas are reviewed monthly at our QAPI Meeting to determine if any adjustments must be made to current actions plans to ensure goals are met or bettered. TASK: Fiscal Accountability:
Senior Leader Role: Annual onsite internal audits are performed by …………..………………… with reports provided directly to Kindred’s BOD. Integration of these audits at the facility level occurs during Kindred’s consultant quarterly visit incorporating any identified issues with facility education. Monthly operational reviews are completed with DVP, ED, and DNS to identify any financial or quality concerns. Kindred updates the facility Balanced Scorecard monthly to further identify any areas that are not meeting financial expectations. TASK: Transparency in Operations:
Senior Leader Role: At the facility level, our stakeholders assess our transparency by our actions of posting current survey results for public review, posting CMS website information for “nursing home compare,” and posting our current staffing levels. Systems are evaluated annually during the Bureau of Facility Standards onsite survey. TASK: Selection of Governance Board Members and Disclosure Policies
Our facility has no Governance Board, so this is not applicable. TASK: Independence and Effectiveness of Internal and External Audits:
Senior Leader Role: Internal audits by …………..………………… include reporting directly to the Audit Committee on the BOD. Additionally, individual department audits are performed ensuring compliance with all ethical practices (Figure 7.4-15), district audits performed by district staff (Figure 7.4-15), and through the annual regulatory unannounced reviews. TASK: Protection of Stakeholder and Stockholder Interests:
Senior Leader Role: We protect stakeholder and stockholder interests through effective management practices that ensure high-quality results and strong financial stewardship. TASK: Succession Planning for Senior Leaders: Senior Leader Role: Senior leaders review at least on an annual basis during SPP their plans for preparing an identified candidate for each senior leader position. This very transparent process engages all of the senior leaders in discussion. If circumstances have changed and a previously identified candidate is no longer interested, available, or suitable, the senior leaders identify other possible candidates and begin to create developmental action plans for them. These may include additional education and cross-training.
1.2a.(2) Performance Evaluation: Evaluating the performance of senior leaders occurs through several different approaches to ensure all operational success factors are addressed for improvement, if necessary. We use cross-functional objectives from several tools working systematically quarterly to annually. (1) Each senior leader is evaluated monthly through internal audits consisting of sanitation, safety, labor control, budgetary compliance, required workforce training, and quality outcomes. Any area not meeting expected high performance is identified, and the senior leader is required to submit a plan of correction to Maryruth that addresses process improvement and steps to ensure zero recurrence. (2) Mid-year, each senior leader meets with Maryruth to review goals and determine status (achieved or not) and a plan of action for achievement of the goals. (3) Annually, each senior leader receives a performance evaluation, often times with consultant input. (Our district provides consultants with expertise in nursing, finance, and Medicare.) (4) Annual review of customer satisfaction survey reports (Figures 7.2-1 through -22) to determine if through senior leaders’ approaches our CC, Values, and Vision are sustained. (5) Annual review of employee satisfaction, balanced scorecard (Figure 4.1-2) results, and retention (Figure 7.3-40) to determine if a senior leader is effective at leading our workforce. Positive outcomes in these key
performance areas, in addition to a leader’s level of education, drive executive compensation including bonus programs. Senior leaders use their performance evaluations to improve
themselves as well as the leadership system. For example, in 2013 the senior leaders identified that each of them received feedback on the need to improve their communication to ensure consistency of messaging. They began to develop a short list of bullet points to take away from the daily Stand-Up Meeting, so that each senior leader would share the same information. As a result of this improvement to our leadership system, all areas pertaining to “Leadership” in our employee engagement surveys have improved year over year. 1.2b. Legal and Ethical Behavior:
1.2b(1) Legal, Regulatory, and Accreditation Compliance:
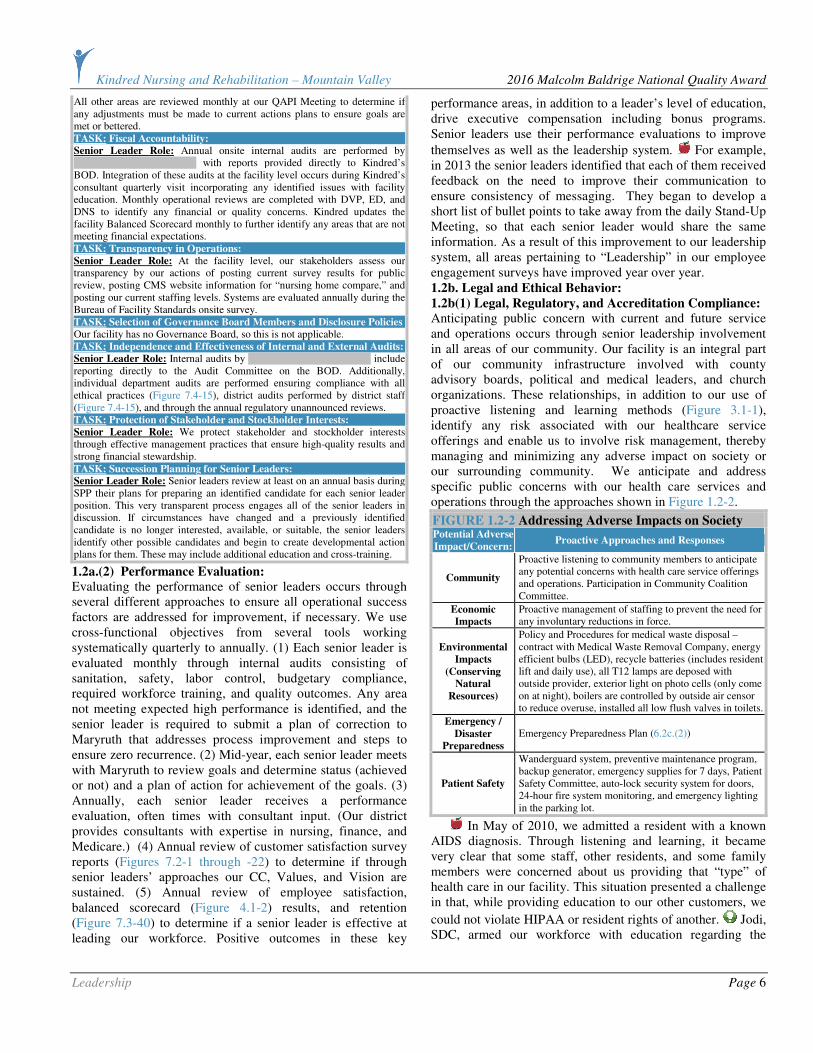
Anticipating public concern with current and future service and operations occurs through senior leadership involvement in all areas of our community. Our facility is an integral part of our community infrastructure involved with county advisory boards, political and medical leaders, and church organizations. These relationships, in addition to our use of proactive listening and learning methods (Figure 3.1-1), identify any risk associated with our healthcare service offerings and enable us to involve risk management, thereby managing and minimizing any adverse impact on society or our surrounding community. We anticipate and address specific public concerns with our health care services and operations through the approaches shown in Figure 1.2-2.
FIGURE 1.2-2 Addressing Adverse Impacts on Society
Potential Adverse
Impact/Concern: Proactive Approaches and Responses
Community
Proactive listening to community members to anticipate any potential concerns with health care service offerings and operations. Participation in Community Coalition Committee.
Economic
Impacts
Proactive management of staffing to prevent the need for any involuntary reductions in force.
Environmental
Impacts
(Conserving
Natural
Resources)
Policy and Procedures for medical waste disposal – contract with Medical Waste Removal Company, energy efficient bulbs (LED), recycle batteries (includes resident lift and daily use), all T12 lamps are deposed with outside provider, exterior light on photo cells (only come on at night), boilers are controlled by outside air censor to reduce overuse, installed all low flush valves in toilets.
Emergency /
Disaster
Preparedness
Emergency Preparedness Plan (6.2c.(2))
Patient Safety
Wanderguard system, preventive maintenance program, backup generator, emergency supplies for 7 days, Patient Safety Committee, auto-lock security system for doors, 24-hour fire system monitoring, and emergency lighting in the parking lot.
In May of 2010, we admitted a resident with a known AIDS diagnosis. Through listening and learning, it became very clear that some staff, other residents, and some family members were concerned about us providing that “type” of health care in our facility. This situation presented a challenge in that, while providing education to our other customers, we
could not violate HIPAA or resident rights of another. Jodi, SDC, armed our workforce with education regarding the

Kindred Nursing and Rehabilitation – Mountain Valley 2016 Malcolm Baldrige National Quality Award
Leadership Page 7
methods in which you can contract this disease, reinforced our infection control policies, and re-educated on standard precautions. This approach supported workforce engagement and empowerment to address any concerns related to this situation. Other customers had their questions answered, were given printed material, or were referred to Jodi with concerns. Six months later, this resident had become a primary volunteer, a staff favorite, and an advocate for other residents. Minimizing the “perceived” threat with education began to break down the perception of an AIDS individual, and this resident became integrated within our center, supporting resident-centered care. This same approach is what is currently used for any new admission who requires contact isolation. Our key compliance processes, measures, and goals for meeting and surpassing regulatory, legal, and accreditation requirements are shown in Figure 1.2-3.
FIGURE 1.2-3 Key Compliance Processes Key Process Measure Goal Result
Resident Privacy HIPAA Training 100% 7.4-15
Essential Work
Requirements General Compliance Training 100% 7.4-15
Evacuation Drills 6 Minutes 7.1-43
Quarterly Fire Drills 100% 7.4-15 Resident and
Workforce Safety Employee Background Checks 100% 7.4-15
Staff Credentialing Current License 100% 7.3-1
Balanced Scorecard Abaqis Utilization Process 100% AOS
1.2b.(2) Ethical Behavior: Promoting and ensuring ethical behavior in all interactions occurs through multiple systematic approaches. (1) Our Open Door program is the foundation of supporting frank, two-way communication that promotes and assures ethical behavior concerns are addressed. All employees, customers, and other stakeholders are educated regarding the Open Door program and their expected use of it. Steps in following the Open Door program include: (a) employees’ commitment to open, honest, and direct communication; (b) education in resolving issues through the chain of command (2) Our Corporate Compliance Program that includes the Code of Conduct, SEP, and Performance Improvement. All employees sign the Code of Conduct, all local suppliers receive a copy and, through contracts, agree to adhere to the high ethical practices of KNRMV. All employees are trained in the 4 areas including the 8 elements of SEP (Figures 3.1-2 and 5.1-1) (3) A Compliance Hotline for use by anyone – employee, customer, or other stakeholder – to ask questions and report possible concerns related to ethical practices to an outside source. The deployment mechanism for all policies and procedures related to ethical practices is the Employee Handbook (Figure 7.4-15), and through internal audits, we confirm that our deployment has been effective. Monitoring and responding to breaches of ethical behavior occurs through: (1) Compliance Hotline and Complaint Survey Calls (Figure 7.2-23a), (2) Open Door program tracking and trending reports, and (3) Employee Exit Interviews.
In January of 2010, we identified the potential for a HIPAA issue when an employee was observed using a cell-phone while on shift. This employee was immediately
educated by the supervisor, and no violation had occurred. This experience made us realize that an issue existed. Jodi, SDC, posted Kindred policy relating to cell phone use while on shift, Maryruth designed a HIPAA quiz that included possible real life scenarios and the risk associated with “tech” communication, and all senior leaders were educated on the policy in the Employee Handbook. We further developed our own policy stating that cell phones had to remain in a locker, purse, etc., while an employee is on shift. In November 2010, Kindred revised the Employee Handbook including the cell phone policy adopting our same strict guidelines. This is monitored through Leadership Daily Rounds and maintaining 100% in HIPAA education.
We added to our Department Managers’ Meeting agenda, “Employee Handbook education,” and each month an area that we feel has a direct impact on ethical practices and employee satisfaction is reviewed with all senior leaders as part of our integrated system of leadership development and growth. 1.2c. Societal Responsibilities:
1.2c.(1) Societal Well-Being: Supporting societal well-being occurs through ethical practices, as demonstrated in Figure 7.4-15, that are systematic and ensure protection of stakeholders’ and stockholders’ interests. Also, daily operations and Strategic Plan/Action Map address areas that ensure our compliance with all regulatory agencies, which contributes to societal well-being. Considering the well-being of our (1) Environment: maintain safe disposal of any health care service delivery item through our contract with daily biohazardous waste pick-up, ensure twice daily trash pick-up with our janitorial staff ensuring grounds are kept clean with curb appeal always supported through a full-time grounds maintenance contractor, and maintain all equipment per Kindred’s preventive maintenance programs to ensure dryers, washers, lawn equipment, vans, kitchen vents are maintained to optimal levels minimizing use of electricity and unnecessary releases to the atmosphere. These audits are completed monthly by maintenance personnel, quarterly by an onsite district consultant, and annually by a regulatory Fire Life Survey. (2) Social: participation in key communities, creating a sustainable workforce (Figure 7.4-19) that contributes to the community both socially and economically, and by ethical practices that protect all stakeholders. (3) Economic: first, support all local medical providers/vendors if at all possible, and support through participation in key communities has direct impact on
the economic system of our small community. At least annually we evaluate our processes for societal well-being. Two years ago, we evaluated our processes for caring for the environment and determined we should increase the frequency
of having the trash picked up twice a day. Last year, following the suicide of the grandson of one of our residents, we became convinced of our need to be more involved as a community health care leader in suicide prevention. Six employees and a resident participated in the first Suicide Awareness Voices of Education (SAVE) walk in Kellogg in September 2015. We also have created a website for our
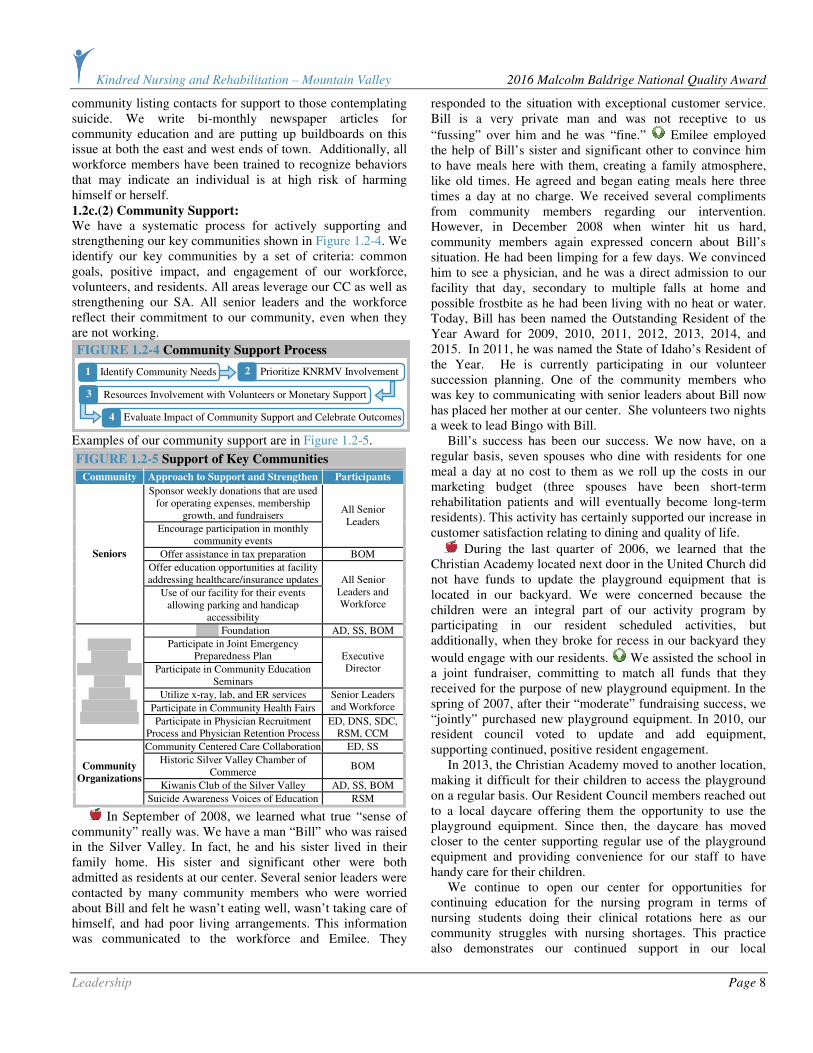
Kindred Nursing and Rehabilitation – Mountain Valley 2016 Malcolm Baldrige National Quality Award
Leadership Page 8
community listing contacts for support to those contemplating suicide. We write bi-monthly newspaper articles for community education and are putting up buildboards on this issue at both the east and west ends of town. Additionally, all workforce members have been trained to recognize behaviors that may indicate an individual is at high risk of harming himself or herself. 1.2c.(2) Community Support: We have a systematic process for actively supporting and strengthening our key communities shown in Figure 1.2-4. We identify our key communities by a set of criteria: common goals, positive impact, and engagement of our workforce, volunteers, and residents. All areas leverage our CC as well as strengthening our SA. All senior leaders and the workforce reflect their commitment to our community, even when they are not working.
Examples of our community support are in Figure 1.2-5.
FIGURE 1.2-5 Support of Key Communities
Community Approach to Support and Strengthen Participants
Sponsor weekly donations that are used for operating expenses, membership
growth, and fundraisers
Encourage participation in monthly community events
All Senior Leaders
Offer assistance in tax preparation BOM
Offer education opportunities at facility addressing healthcare/insurance updates
Seniors
Use of our facility for their events allowing parking and handicap
accessibility
All Senior Leaders and Workforce
SMC Foundation AD, SS, BOM
Participate in Joint Emergency Preparedness Plan
Participate in Community Education Seminars
Executive Director
Utilize x-ray, lab, and ER services
Participate in Community Health Fairs
Senior Leaders and Workforce
Shoshone
Medical
Center (SMC) SMC is
Kellogg’s
25-bed acute
care hospital. Participate in Physician Recruitment Process and Physician Retention Process
ED, DNS, SDC, RSM, CCM
Community Centered Care Collaboration ED, SS
Historic Silver Valley Chamber of Commerce
BOM
Kiwanis Club of the Silver Valley AD, SS, BOM
Community
Organizations
Suicide Awareness Voices of Education RSM
In September of 2008, we learned what true “sense of community” really was. We have a man “Bill” who was raised in the Silver Valley. In fact, he and his sister lived in their family home. His sister and significant other were both admitted as residents at our center. Several senior leaders were contacted by many community members who were worried about Bill and felt he wasn’t eating well, wasn’t taking care of himself, and had poor living arrangements. This information was communicated to the workforce and Emilee. They
responded to the situation with exceptional customer service. Bill is a very private man and was not receptive to us
“fussing” over him and he was “fine.” Emilee employed the help of Bill’s sister and significant other to convince him to have meals here with them, creating a family atmosphere, like old times. He agreed and began eating meals here three times a day at no charge. We received several compliments from community members regarding our intervention. However, in December 2008 when winter hit us hard, community members again expressed concern about Bill’s situation. He had been limping for a few days. We convinced him to see a physician, and he was a direct admission to our facility that day, secondary to multiple falls at home and possible frostbite as he had been living with no heat or water. Today, Bill has been named the Outstanding Resident of the Year Award for 2009, 2010, 2011, 2012, 2013, 2014, and 2015. In 2011, he was named the State of Idaho’s Resident of the Year. He is currently participating in our volunteer succession planning. One of the community members who was key to communicating with senior leaders about Bill now has placed her mother at our center. She volunteers two nights a week to lead Bingo with Bill. Bill’s success has been our success. We now have, on a regular basis, seven spouses who dine with residents for one meal a day at no cost to them as we roll up the costs in our marketing budget (three spouses have been short-term rehabilitation patients and will eventually become long-term residents). This activity has certainly supported our increase in customer satisfaction relating to dining and quality of life.
During the last quarter of 2006, we learned that the Christian Academy located next door in the United Church did not have funds to update the playground equipment that is located in our backyard. We were concerned because the children were an integral part of our activity program by participating in our resident scheduled activities, but additionally, when they broke for recess in our backyard they
would engage with our residents. We assisted the school in a joint fundraiser, committing to match all funds that they received for the purpose of new playground equipment. In the spring of 2007, after their “moderate” fundraising success, we “jointly” purchased new playground equipment. In 2010, our resident council voted to update and add equipment, supporting continued, positive resident engagement. In 2013, the Christian Academy moved to another location, making it difficult for their children to access the playground on a regular basis. Our Resident Council members reached out to a local daycare offering them the opportunity to use the playground equipment. Since then, the daycare has moved closer to the center supporting regular use of the playground equipment and providing convenience for our staff to have handy care for their children. We continue to open our center for opportunities for continuing education for the nursing program in terms of nursing students doing their clinical rotations here as our community struggles with nursing shortages. This practice also demonstrates our continued support in our local
FIGURE 1.2-4 Community Support Process
Identify Community Needs Prioritize KNRMV Involvement
Resources Involvement with Volunteers or Monetary Support
Evaluate Impact of Community Support and Celebrate Outcomes
1 2
3
4

Kindred Nursing and Rehabilitation – Mountain Valley 2016 Malcolm Baldrige National Quality Award
Strategic Planning Page 9
healthcare infrastructure from local community students. Other ways that we build community health are through our support of local healthcare providers. In working with the Chamber of Commerce, we have been successful in expanding our community healthcare services to include a low income
dental clinic, mobile mammograms, podiatry care, and more mental health access. Working in collaboration with other community associations, our senior leaders have played key roles in strengthening community health and eliminating some of the barriers to care by increasing community access.
CATEGORY 2: STRATEGIC PLANNING
2.1 Strategy Development
2.1a. Strategy Development Process:
2.1a.(1) Strategic Planning Process: Our SPP is a 12-step process, with the key steps shown in Figure 2.1-1. Strategic planning for the following year begins in October of the current year during our QAPI Committee meeting. As part of a larger organization, we receive the output of our parent company’s strategic plan. Using that as input to our own process, we hold a series of
meetings. Each senior leader prepares a departmental SWOT analysis, which is reviewed with Maryruth prior to the formal planning meeting. During this review, each senior leader identifies potential department objectives for the coming year. At a meeting with all of the senior leaders, we review and revise, if needed, our CC. We identify blind spots through the use of scenario planning where we test our potential objectives against dramatic changes in our operating environment.
In review of our 2013 final Action Map, we identified that we could be missing actionable data from our workforce based on the (then) low percent of our workforce participating in the employee engagement survey at a response rate of only 26%. Tara, DPT, who began her medical career here as a front line caregiver, felt we should evaluate the processes used for our group strategic planning and involve more input from our workforce, in particular our direct care staff, given they make up the majority of our workforce. Each senior leader continued with the process of a departmental SWOT analysis but requested more input from their employees. Through the identification of other “leaders” in our center, we selected additional staff members to attend our annual strategic
planning meeting. We grew our participation from 11 attendees in 2013 to 16 in 2014 that included three key CNAs, restorative nursing LPN, and two charges nurses. In 2016, our total grew to 18 with addition of one member from culinary and one from housekeeping. As a result of this improvement of our SPP that resulted in effective workforce plans, we increased our employee engagement survey response rate from 26% in 2013 to 94% in 2015. (Figure 7.3-28)
Another cycle of evaluation and improvement for our SPP occurred in 2015. Maryruth learned during the 4th quarter 2014 SWOT analysis with senior leaders that strategic planning could “be more fun” and that, as a leader, she was missing an opportunity for teambuilding. She researched
several different teambuilding websites and developed a “theme” for strategic planning that is carried through the entire year during QAPI. The 2015 theme was Employee Engagement–“Who is sinking your boat?” and 2016 is “What If We…” Each month the theme is carried through with learning during monthly department managers. Post-strategic planning evaluations indicate 100% approval both years and increased satisfaction in areas of senior leadership in the 2015 employee engagement survey. (Figures 7.4-1 through –5) Our SPP addresses the need for transformational change by identifying new issues we and/or the industry are facing, their magnitude, and our ability to respond to them with the available resources. Prioritization occurs during the development of key short- and long-term action plans. The QAPI Committee determines these through the process of categorizing objectives into domains, as shown in Figure 2.1-2. The committee considers how the identified objective relates to the delivery of care and services to our stakeholders, financial impacts, and operational functions. Our SPP addresses the need for organizational agility and operational flexibility by challenging the conventional wisdom when facing a strategic objective that is not being achieved through traditional methods. An example of this is in the first Quarter of 2012 when we identified the need to significantly reduce falls. The customary approach in our industry was to use restraints and alarms. Restraints did not honor the dignity
2ND QUARTER
11) Update QAPI Agenda to Reflect Current Goals, Measures, Timeframes
12) Update current Action Map with YTD Data
13) Review Progress and Adjust Action Plans, as needed
4TH QUARTER At the Senior Leadership
Annual Offsite Meeting: 6) Revise Action Map to
Include Strategic Objectives and Measures
7) Develop Key Short- and Long-Term Plans for Achievement
8) Determine Relevant Benchmarks and Identify Targets/Goals
9) Assign Responsibilities, Assign a Leader and Work Team, Review Expected
Outcomes, Discuss Boundaries, Affirm Empowerment, Identify Reporting 10) Reinforce through Performance Management System
1ST
QUARTER
FIGURE 2.1-1 Strategic Planning Process
1) Review and Revise, if needed, Core Competencies 2) Conduct Department SWOT Analysis 3) Define Strategic Advantages and Strategic Challenges 4) Align Objectives with Kindred’s 5) Select Key Measures
• 3-year Planning Horizon • Environmental Scans • • SWOT Analysis • Deployment to Kindred Entities •
• Validation of Vision, Mission, and Values • • Ensures Horizontal and Vertical Alignment •
KINDRED STRATEGIC PLAN
3rd
QU
AR
TE
R
Review efficiency of the planning process,
identify and implement improvements.

Kindred Nursing and Rehabilitation – Mountain Valley 2016 Malcolm Baldrige National Quality Award
Strategic Planning Page 10
of the residents, and alarms basically tell you that a fall has occurred. We developed short-term action plans and what we measured, including time of day, day of the week, and was the right fall intervention in place. We implemented the 4Ps of fall prevention (position, pain, personal items within reach, and personal care – timely toileting). We completely redid the fall incident report and reduced the use of alarms 30% to 1%.
FIGURE 2.1-2 Key Process for Determining Objectives
and Timeline (KPDOT)
Key Process for Determining
Objectives and Timelines Meet Criteria?
Key
Members
Ste
p 1
CATEGORIZE OBJECTIVE INTO
DOMAINS:
• High Volumes: Does this occur frequently or involve a large number of customers, employees, stakeholders, or systems? • High Risk: Could the negative outcome have serious consequences? • Problem Prone: Does this have a tendency to produce additional problems – “domino effect” – integrated systems • High Cost: Could cost jeopardize customer care or lead to legal/financial ramifications that could affect our customers, stakeholders, employees, and/or community image?
YES
↓ Develop through Action Map
NO
↓ ED works
with Senior Leader through
annual goal setting
ED and Senior
Leaders
Ste
p 2
CATEGORIZE OBJECTIVE: • Critical: (4 domains) Short-term Action Plan • Extremely Important: (3 of 4 domains) Short-term Action Plan • Very Important: (2 of 4 domains) Based on Discussion, Listen and Learn • Important: (1 domain) Long-term Action Plan
Establish time horizon, categorize in short-term plan or long-term plan on Action Map, Integration of
SA/CC
ED and Senior
Leaders
2.1a.(2) Innovation: Our SPP stimulates and incorporates innovation through the scenarios we envision. When we look at a “worst case” scenario, we frequently determine that we cannot be successful with only continuous improvement. In that case, we
focus on innovative solutions that will provide the breakthrough improvement needed. We use the Innovation Management Process described in 6.1c. We identify strategic opportunities as part of that scenario planning. We decide which strategic opportunities are intelligent risks by first evaluating them against our mission and our values. Alignment with those is the first test. Then we evaluate the potential benefit of pursuing the strategic opportunity against the possible costs, including the risk of being unsuccessful. During our most recent SPP, we did not identify any strategic opportunity. In 2015, we were acknowledged by the Idaho Healthcare Association for our center’s ability to develop and achieve our strategic plan. Maryruth was asked to become one of the educational presenters for new assisted living administrators teaching the process of developing a strategic plan, building unstoppable teams, improving communication for the purpose of achieving strategic goals, and creating an effective leadership team. She has participated in this certification training in 2015 and 2016. After review of our center’s strategic planning process that involves all senior leaders, the Northwest DVP asked Maryruth to present to all the Executive Directors in Kindred’s Northwest District on the process used by our center. Our 2016 strategic planning power point presentation was used as the training material with specific slides used as educational handouts to introduce other EDs on how to identify strategic challenges, strategic advantages, and core competencies. The Northwest DVP commented that she’d never experienced such a systematic process to annual strategic planning at any level, let alone at a center level like ours. 2.1a.(3) Strategy Considerations: Each senior leader is trained and completes a SWOT analysis in preparation for the October meeting with Maryruth. The analysis is supported by relevant data reports that the senior leader can access or request other sources (Figure P.2-2). Figure 2.1-3 shows how our SPP gathers relevant data for analysis to address key elements.
FIGURE 2.1-3 Key Processes for Gathering Data for Analysis
Element Data Used How Element’s Addressed
Organization’s Strengths, Weaknesses, Opportunities, and Threats
• Kindred SWOT analysis
• Departmental SWOT analyses
• Environmental scan (ongoing) by senior leaders from community and industry involvement
• Individual and collective review of this info
• Validation with key stakeholders
Early indications of major shifts in technology, markets, health care services, patient and stakeholder preferences, competition, the economy, and the regulatory environment
• Abaqis
• AHCA LTC Trend Tracker
• Idaho Health Care Association
• Resident Advisory Council
• CMS
• Environmental scan (ongoing) by senior leaders from community and industry involvement
• Regular review of key indicators seeking early signs of shifts in our operating environment
Long-term organizational sustainability, including needed CC, and projections of our
performance and those of competitors or comparable organizations’ future performance
• AHCA LTC Trend Tracker
• Idaho Health Care Association
• Environmental scan (ongoing) by senior leaders from community and industry involvement
• Abaqis ● CMS
• Resident Advisory Council
• Information from former residents and employees from competitors and other comparable organizations
• Scenario planning as part of the SPP
Ability to execute the strategic plan • Action Map
• Performance Mgmt. (Figure 5.2-3)
• Capability and capacity plans (2.2.a.(4))
• QAPI Committee
• Reviews shown in Figure 1.1-5
2.1a.(4) Work Systems and Core Competencies: Our key work systems are long-term care and short-term rehab. We make work system decisions that facilitate the accomplishment of our strategic objectives as part of the SPP.
During the development of our Gold applications, we identified a gap. As a result of this evaluation and improvement, we implemented another action during our SPP. We intentionally review our key processes during the SPP
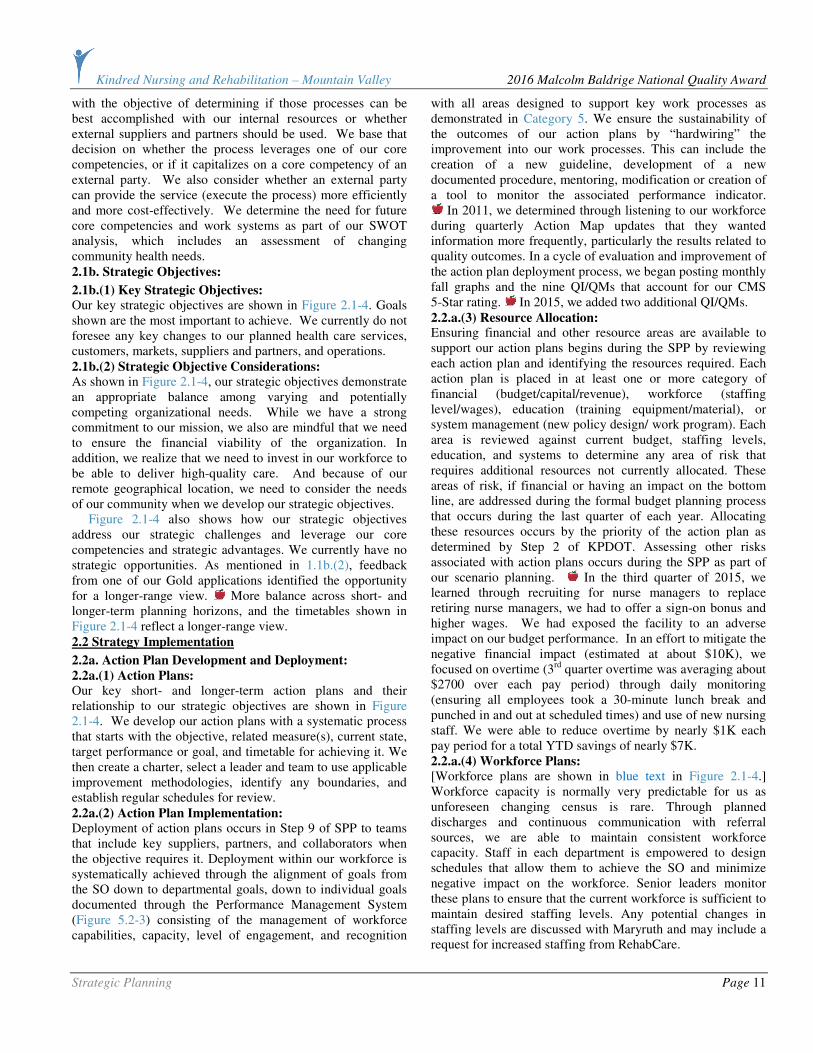
Kindred Nursing and Rehabilitation – Mountain Valley 2016 Malcolm Baldrige National Quality Award
Strategic Planning Page 11
with the objective of determining if those processes can be best accomplished with our internal resources or whether external suppliers and partners should be used. We base that decision on whether the process leverages one of our core competencies, or if it capitalizes on a core competency of an external party. We also consider whether an external party can provide the service (execute the process) more efficiently and more cost-effectively. We determine the need for future core competencies and work systems as part of our SWOT analysis, which includes an assessment of changing community health needs. 2.1b. Strategic Objectives:
2.1b.(1) Key Strategic Objectives: Our key strategic objectives are shown in Figure 2.1-4. Goals shown are the most important to achieve. We currently do not foresee any key changes to our planned health care services, customers, markets, suppliers and partners, and operations. 2.1b.(2) Strategic Objective Considerations: As shown in Figure 2.1-4, our strategic objectives demonstrate an appropriate balance among varying and potentially competing organizational needs. While we have a strong commitment to our mission, we also are mindful that we need to ensure the financial viability of the organization. In addition, we realize that we need to invest in our workforce to be able to deliver high-quality care. And because of our remote geographical location, we need to consider the needs of our community when we develop our strategic objectives. Figure 2.1-4 also shows how our strategic objectives address our strategic challenges and leverage our core competencies and strategic advantages. We currently have no strategic opportunities. As mentioned in 1.1b.(2), feedback from one of our Gold applications identified the opportunity for a longer-range view. More balance across short- and longer-term planning horizons, and the timetables shown in Figure 2.1-4 reflect a longer-range view. 2.2 Strategy Implementation
2.2a. Action Plan Development and Deployment:
2.2a.(1) Action Plans: Our key short- and longer-term action plans and their relationship to our strategic objectives are shown in Figure 2.1-4. We develop our action plans with a systematic process that starts with the objective, related measure(s), current state, target performance or goal, and timetable for achieving it. We then create a charter, select a leader and team to use applicable improvement methodologies, identify any boundaries, and establish regular schedules for review. 2.2a.(2) Action Plan Implementation: Deployment of action plans occurs in Step 9 of SPP to teams that include key suppliers, partners, and collaborators when the objective requires it. Deployment within our workforce is systematically achieved through the alignment of goals from the SO down to departmental goals, down to individual goals documented through the Performance Management System (Figure 5.2-3) consisting of the management of workforce capabilities, capacity, level of engagement, and recognition
with all areas designed to support key work processes as demonstrated in Category 5. We ensure the sustainability of the outcomes of our action plans by “hardwiring” the improvement into our work processes. This can include the creation of a new guideline, development of a new documented procedure, mentoring, modification or creation of a tool to monitor the associated performance indicator.
In 2011, we determined through listening to our workforce during quarterly Action Map updates that they wanted information more frequently, particularly the results related to quality outcomes. In a cycle of evaluation and improvement of the action plan deployment process, we began posting monthly fall graphs and the nine QI/QMs that account for our CMS 5-Star rating. In 2015, we added two additional QI/QMs. 2.2.a.(3) Resource Allocation: Ensuring financial and other resource areas are available to support our action plans begins during the SPP by reviewing each action plan and identifying the resources required. Each action plan is placed in at least one or more category of financial (budget/capital/revenue), workforce (staffing level/wages), education (training equipment/material), or system management (new policy design/ work program). Each area is reviewed against current budget, staffing levels, education, and systems to determine any area of risk that requires additional resources not currently allocated. These areas of risk, if financial or having an impact on the bottom line, are addressed during the formal budget planning process that occurs during the last quarter of each year. Allocating these resources occurs by the priority of the action plan as determined by Step 2 of KPDOT. Assessing other risks associated with action plans occurs during the SPP as part of our scenario planning. In the third quarter of 2015, we learned through recruiting for nurse managers to replace retiring nurse managers, we had to offer a sign-on bonus and higher wages. We had exposed the facility to an adverse impact on our budget performance. In an effort to mitigate the negative financial impact (estimated at about $10K), we focused on overtime (3rd quarter overtime was averaging about $2700 over each pay period) through daily monitoring (ensuring all employees took a 30-minute lunch break and punched in and out at scheduled times) and use of new nursing staff. We were able to reduce overtime by nearly $1K each pay period for a total YTD savings of nearly $7K. 2.2.a.(4) Workforce Plans: [Workforce plans are shown in blue text in Figure 2.1-4.] Workforce capacity is normally very predictable for us as unforeseen changing census is rare. Through planned discharges and continuous communication with referral sources, we are able to maintain consistent workforce capacity. Staff in each department is empowered to design schedules that allow them to achieve the SO and minimize negative impact on the workforce. Senior leaders monitor these plans to ensure that the current workforce is sufficient to maintain desired staffing levels. Any potential changes in staffing levels are discussed with Maryruth and may include a request for increased staffing from RehabCare.

Kindred Nursing and Rehabilitation – Mountain Valley Malcolm Baldrige National Quality Award Application
Strategic Planning Page 12
FIGURE 2.1-4 Action Map
Key Strategic
Objectives* Short-Term Action Plan Long-Term Action Plan Key Performance Measurement/Indicator
2016
Goal
KNRMV
Proj. vs.
Comp. Proj.
Timeline Result
QI/QM UTI ≥4% + 12/31/16 7.1-13
Monthly Infection Control Log (UTIs) ≥4 + 12/31/16 AOS
(1) Reduce Percent of UTIs in (L)
Residents SA1
SC1
CC2
(1) Review all residents that are currently flagging for UTIs on both QI/QM monthly and daily
Infection Control Log to determine trend (2) Senior Leader Daily
Rounds checking resident interventions in place
(1) Direct care staff education on hand washing – hydration – incontinent care
(2) Nursing assessment post UTI to determine appropriate prevention
intervention for resident working with physician and compliance
with industry standards
Abaqis interview relating to “is there enough staff available”
100% + 12/31/16 7.2-18
QI/QM Increase ADL help 20% = 12/31/17 7.1-17
Part B Therapy budget = 12/31/16 7.5-6
Total Therapy Staffing PPD 1.17 + 12/31/16 7.1-36
Provide
Exceptional
Care
“Quality and
Service”
(2) Reduce Percent of Increased ADLs
help SA2
SC1
CC2
(1) Review all residents for possible decline in daily clinical
review (2) Weekly review of all aid flow
sheets to determine if coding correctly
(1) Direct care staff education for ADL coding
(2) FAST system monitored daily for communication on resident changes in
daily clinical meeting (3) Referral to therapy of screening or
treatment of decline in ADLs Weekly Review of ADL flow sheets 100% N/A 12/31/16 7.4-8
“Departments within my organization collaborate effectively with another”
80% + 07/31/16 7.3-14
Employee Education Hours 1600 + 12/31/16 7.3-48
(3) Improve Clinical Communication
SA3, SA4
CC1
(1) Educate all LN on PCC communication board – print
communications for CNA board (2) Post meeting minutes
(1) Change meeting days and contents to accommodate charge nurse
attendance (2) IDT to copy any changes to care
plan and give to medical records Abaqis Family “Status Notification”
Communication 100% + 12/31/16 7.2-19
Annual Reviews 100% N/A 06/30/17 AOS
Monthly ABOVE and BEYOND 100% N/A 12/31/16 AOS
Retention Rate >80% + 12/31/16 7.3-40
Turnover Rate <25% + 12/31/16 7.3-39
5-Star Direct Staffing 5 Stars + 12/31/16 7.4-12
5-Star RN Staffing 5 Stars + 12/31/16 7.4-11
Value
Our
People
“Efficiency”
(4) Improve Employee Retention
Rate SA6
SC4
CC1
(1) Focused senior leader rounds for mentoring, coaching, and
immediate recognition (2) Ensure succession plan in place
for key senior leaders
(1) Involve key senior leaders in orientation process
(2) Ensure annual performance reviews completed for all staff
member with focus on open communication
Workers Compensation Claims 2 = 12/31/16 7.3-27
“There is good teamwork and cooperation between the person I report to and staff”
82% + 07/31/16 7.3-21
“I feel encouraged to come up with new and better ways of doing things”
80% + 07/31/16 7.3-26
(5) Improve Employee “Overall”
Satisfaction SA6
SC4
CC1
(1) Maintain strong Open Door program through daily Stand-Up
Meeting and Senior Leader Rounds
(1) Train leadership team to address and recognize performance issues that
can bring the team down Employee Overall Satisfaction
(“I would recommend company”) 87% + 07/31/16 7.3-33
Abaqis Resident/Family Overall Satisfaction
100% + 12/31/16 7.2-1, 7.2-12
Bi-monthly Senior Leader Rounds 100% N/A 12/31/16 7.2-19
Focus
on our
Customers (6) Maintain Residents/
Families’ “Overall” Satisfaction
SA1, SC2, CC3
(1) Maintain strong Open Door program for all Families and
Residents
(1) Maintain strong involvement with all residents and families through senior leader involvement with
Senior Leader Rounds Complaint Survey 0 = 12/31/16 7.2-23a
Occupancy Rate 90% + 12/31/16 7.5-11
Reputation.com 700 N/A 12/31/16 7.2-23
5-Star 5 Stars + 12/31/16 7.4-9 Quality Rankings
Schoonover YES = 06/01/17 7.4-6
(7) Improve Occupancy Rate
SA1, SA3
SC1, SC2
CC2
(1) Maintain Current Referral Sources
(1) Expand relationships with new Primary Care Physicians at Heritage
Health and consulting specialty physicians
(2) Monitor social media reviews Re-Hospitalization Rate 13% = 12/31/17 7.1-21
“A” ADLs Index 6.5 + 12/31/17 AOS
Medicare 2 Rates budget + 12/31/16 AOS
Achieve
Operational
Excellence
“Growth” (8) Maintain Reimbursement
Rates SC3
(1) Maintain solid Clinical Staffing including 7 day/week therapy
(2) Key senior leader succession planning
(1) Complete review of all residents prior to assessment date to ensure
correct ADL coding Medicaid Rates budget + 12/31/16 AOS
*SA = Strategic Advantages, SC = Strategic Challenges, CC = Core Competencies Actions in blue are Workforce Action Plans.
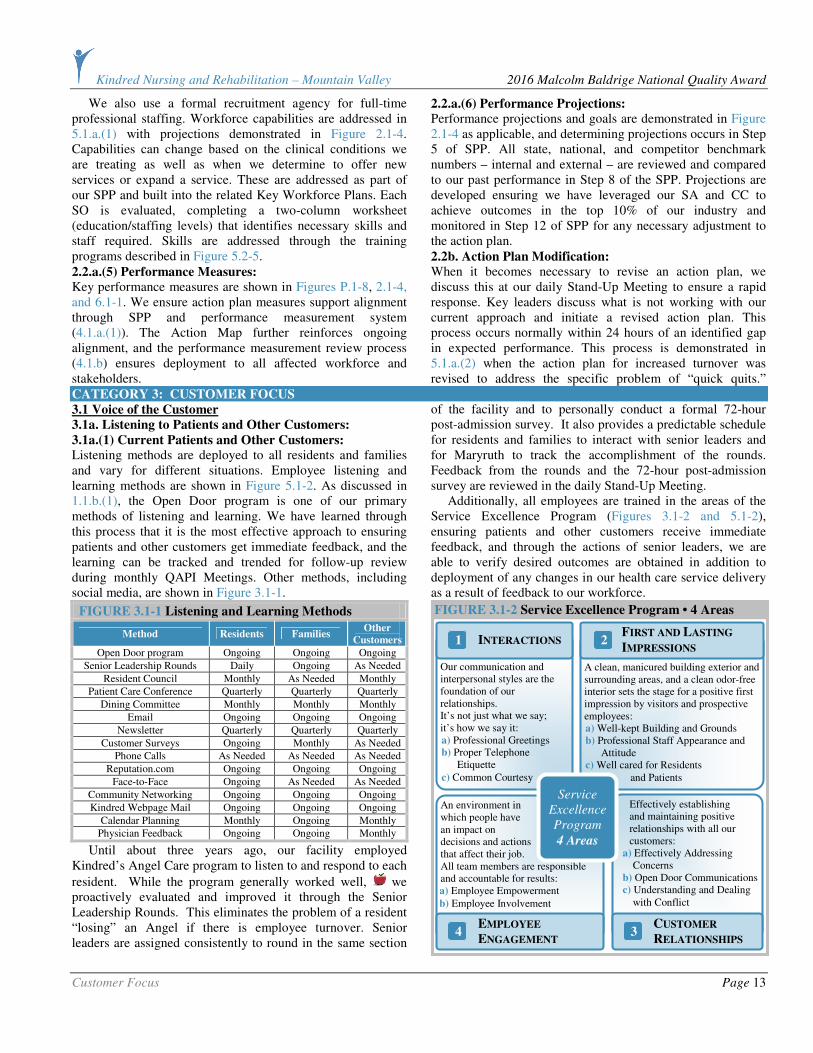
Kindred Nursing and Rehabilitation – Mountain Valley 2016 Malcolm Baldrige National Quality Award
Customer Focus Page 13
We also use a formal recruitment agency for full-time professional staffing. Workforce capabilities are addressed in 5.1.a.(1) with projections demonstrated in Figure 2.1-4. Capabilities can change based on the clinical conditions we are treating as well as when we determine to offer new services or expand a service. These are addressed as part of our SPP and built into the related Key Workforce Plans. Each SO is evaluated, completing a two-column worksheet (education/staffing levels) that identifies necessary skills and staff required. Skills are addressed through the training programs described in Figure 5.2-5. 2.2.a.(5) Performance Measures: Key performance measures are shown in Figures P.1-8, 2.1-4, and 6.1-1. We ensure action plan measures support alignment through SPP and performance measurement system (4.1.a.(1)). The Action Map further reinforces ongoing alignment, and the performance measurement review process (4.1.b) ensures deployment to all affected workforce and stakeholders.
2.2.a.(6) Performance Projections:
Performance projections and goals are demonstrated in Figure 2.1-4 as applicable, and determining projections occurs in Step 5 of SPP. All state, national, and competitor benchmark numbers – internal and external – are reviewed and compared to our past performance in Step 8 of the SPP. Projections are developed ensuring we have leveraged our SA and CC to achieve outcomes in the top 10% of our industry and monitored in Step 12 of SPP for any necessary adjustment to the action plan. 2.2b. Action Plan Modification: When it becomes necessary to revise an action plan, we discuss this at our daily Stand-Up Meeting to ensure a rapid response. Key leaders discuss what is not working with our current approach and initiate a revised action plan. This process occurs normally within 24 hours of an identified gap in expected performance. This process is demonstrated in 5.1.a.(2) when the action plan for increased turnover was revised to address the specific problem of “quick quits.”
CATEGORY 3: CUSTOMER FOCUS
3.1 Voice of the Customer
3.1a. Listening to Patients and Other Customers:
3.1a.(1) Current Patients and Other Customers: Listening methods are deployed to all residents and families and vary for different situations. Employee listening and learning methods are shown in Figure 5.1-2. As discussed in 1.1.b.(1), the Open Door program is one of our primary methods of listening and learning. We have learned through this process that it is the most effective approach to ensuring patients and other customers get immediate feedback, and the learning can be tracked and trended for follow-up review during monthly QAPI Meetings. Other methods, including social media, are shown in Figure 3.1-1.
FIGURE 3.1-1 Listening and Learning Methods
Method Residents Families Other
Customers
Open Door program Ongoing Ongoing Ongoing
Senior Leadership Rounds Daily Ongoing As Needed
Resident Council Monthly As Needed Monthly
Patient Care Conference Quarterly Quarterly Quarterly
Dining Committee Monthly Monthly Monthly
Email Ongoing Ongoing Ongoing
Newsletter Quarterly Quarterly Quarterly
Customer Surveys Ongoing Monthly As Needed
Phone Calls As Needed As Needed As Needed
Reputation.com Ongoing Ongoing Ongoing
Face-to-Face Ongoing As Needed As Needed
Community Networking Ongoing Ongoing Ongoing
Kindred Webpage Mail Ongoing Ongoing Ongoing
Calendar Planning Monthly Ongoing Monthly
Physician Feedback Ongoing Ongoing Monthly
Until about three years ago, our facility employed Kindred’s Angel Care program to listen to and respond to each
resident. While the program generally worked well, we proactively evaluated and improved it through the Senior Leadership Rounds. This eliminates the problem of a resident “losing” an Angel if there is employee turnover. Senior leaders are assigned consistently to round in the same section
of the facility and to personally conduct a formal 72-hour post-admission survey. It also provides a predictable schedule for residents and families to interact with senior leaders and for Maryruth to track the accomplishment of the rounds. Feedback from the rounds and the 72-hour post-admission survey are reviewed in the daily Stand-Up Meeting. Additionally, all employees are trained in the areas of the Service Excellence Program (Figures 3.1-2 and 5.1-2), ensuring patients and other customers receive immediate feedback, and through the actions of senior leaders, we are able to verify desired outcomes are obtained in addition to deployment of any changes in our health care service delivery as a result of feedback to our workforce.
FIGURE 3.1-2 Service Excellence Program • 4 Areas
A clean, manicured building exterior and surrounding areas, and a clean odor-free interior sets the stage for a positive first impression by visitors and prospective employees: a) Well-kept Building and Grounds b) Professional Staff Appearance and
Attitude c) Well cared for Residents
and Patients
FIRST AND LASTING
IMPRESSIONS Our communication and interpersonal styles are the foundation of our relationships. It’s not just what we say; it’s how we say it: a) Professional Greetings b) Proper Telephone
Etiquette
c) Common Courtesy
INTERACTIONS 1
An environment in which people have an impact on decisions and actions that affect their job. All team members are responsible and accountable for results: a) Employee Empowerment
b) Employee Involvement
EMPLOYEE
ENGAGEMENT 4
Effectively establishing and maintaining positive relationships with all our customers: a) Effectively Addressing
Concerns b) Open Door Communications c) Understanding and Dealing
with Conflict
CUSTOMER
RELATIONSHIPS 3
Service
Excellence
Program
4 Areas
2

Kindred Nursing and Rehabilitation – Mountain Valley 2016 Malcolm Baldrige National Quality Award
Customer Focus Page 14
These approaches support a more “informal” yet systematic method of listening and foster a culture that supports open communication and increased stakeholder engagement. As a result of these practices, as we progress through the stages of our relationship, boundaries “fade away.” Our customer satisfaction survey (Abaqis) vendor, Providigm, has awarded our facility with the “Embracing Quality Award in Customer Satisfaction” for 2012, 2013, 2014, and 2015, every year that the award has been given. To put this recognition in perspective, we were one of 212 centers in the US receiving this award out of approximately 15,000 eligible facilities. 3.1a.(2) Potential Patients and Other Customers: We listen to potential patients and other customers to obtain actionable information through involvement in key communities (Figure 1.2-5) and through tours we provide of our facility. We listen to former customers through a discharge survey (Abaqis). In a cycle of evaluation and improvement, we determined to initiate a 30-day post-discharge survey to specifically focus on the discharge planning process, as well as therapy services received while at our center to gain feedback and also to ensure that the discharge back to the community had been successful. Continuous contact with former residents and families occurs through 7-day phone calls, 30-day phone calls, and monthly community events. We document on our daily Stand-Up Log actionable feedback regarding the health care services, patient and other customer support and transactions on our competitors’ patients and other customers at community events, through information offered during tours or admissions when the resident has previously stayed with a competitor, and through staff members and volunteers who have previously worked for a competitor. We also obtain insights from comments made by discharge planners and physicians. 3.1b. Determination of Satisfaction and Engagement:
3.1b.(1) Satisfaction, Dissatisfaction, and Engagement: Determining patient and other customer satisfaction, dissatisfaction, and engagement occurs through review of:
(1) Abaqis Customer Satisfaction Surveys: primarily “overall satisfaction” and “likelihood to recommend us” (Figures 7.2-26, 7.2-27); (2) Regulatory Survey Outcomes: annual and complaint surveys (Figure 7.2-23a); (3) Compliance Hotline Calls (Figure 7.4-15); (4) Total Admissions; and (5) Occupancy Rates: greater than our competitor and higher than state average (Figure 7.5-11). As demonstrated, they differ among patient and other customer groups, and market segments. Current measurements capture actionable information that is integrated into our approaches for market growth (SO 7 and Customer Satisfaction SO 6 (Figure 2.1-4)). All data are used to assist with the setting of goals that fall within the industry’s top 10% in the nation (Figure 2.1-4). We also receive actionable information on residents’ and other customers’ dissatisfaction through our complaint management process, described in detail in 3.2b.(2). The systematic approaches used with the Abaqis surveys (Figure 3.1-3) and Senior Leadership Rounding ensure that we capture actionable information to use in exceeding patients’ and other customers’ expectations and for securing their engagement with us for the long-term. Other approaches for securing their engagement are described in detail in Item 3.2. In 2014, the process for assessing resident and family satisfaction was twice per year with a sample of 40 residents and families interviewed in the first 6 months (during the first 2 weeks in February) and another 40 residents and families interviewed in the second six months (the first two weeks in July). In a cycle of evaluation and improvement, we determined that this process didn’t provide continuous feedback but only captured information for 2 weeks of each of six months. The process did not account for changes in our patient population, staff, our environment, or external factors. We determined that this process placed us at risk for missing key customer requirements and at risk for poor survey outcomes. We changed the process to include 10 resident and family satisfaction interviews each month for a 4-month period twice a year.
FIGURE 3.1-3 Abaqis Surveys
Survey Conducted: Census Sample Run Report and
Review Outcomes: Interviewers Process Change
First 2 weeks of January, February, March, April, July, August September,
October
10 Residents from each area: • Resident Interview • Family Interview • Staff interview • Resident Observation • Census Review
• Daily for first two weeks in Stand-Up Meeting
• Monthly Resident and Family Satisfaction Outcomes during QAPI Meeting
January, February, March, July, August,
September 10 Resident New Admits
• Daily during Stand-Up Meeting
• Monthly during QAPI Meeting
Interviews of residents and families, staff
interviews, resident observations are
conducted by Emilee and John in
Activities, Jenny in SS, Maryruth, and/or
Senior Leaders.
January, February, March, April, July, August, September,
October
Two mandatory tasks are selected each month: • Dining Observation • Infection Control and Immunizations • Kitchen / Food Service Observation • Liability Notice and Beneficiary Appeal Rights • Medication Administration • Medication Storage • Quality Assessment and Assurance Review • Resident Council President / Representative
• Daily during Stand-Up Meeting
• Monthly during QAPI Meeting
Tasks are completed by Maryruth and/or district consultants while in the center
doing audits.
• Man cave changed to recreational room
• More choices for bathing times that include evening
• Snack bar that has fruit, cheese, hard boiled eggs, etc., available all day long in Garden Dining for residents’ convenience
• Changes in activity programs: more evening Bingo, and Yoga class added
• Yakker Tracker placed because of comments about noise at Nurses Station

Kindred Nursing and Rehabilitation – Mountain Valley 2016 Malcolm Baldrige National Quality Award
Customer Focus Page 15
3.1.b.(2) Satisfaction Relative to Competitors:
Formal channels to obtain patients’ and other customers’ satisfaction relative to our competitors are regulatory surveys (annual and complaint surveys (Figures 7.4-6 and 7.4-7), percent of occupancy (Figure 7.5-11), and staffing levels (Figures 7.3-2 through –5), which we have learned can indicate high turnover, low retention, and inability to recruit. In addition to reports used to benchmark us with our competitor, we access information from the external source Abaqis for patient/ resident/family satisfaction outcomes (Figures 7.2-1 through –22). This information allows us to benchmark our center with national outcomes. Information obtained that benchmarks us with competitors as well as similar health care service is used during SPP and integrated throughout our Action Map/ Strategic Plan to support our goal of remaining in the top 10% of excellence and customer service nationwide. This information is also integrated in our education/training programming to ensure that we are sustaining our CC. All information is accessed through data sources shown in Figure P.2-2. 3.2 Customer Engagement
3.2a. Service Offering, Patient, Other Customer Support:
3.2a.(1) Service Offerings: We determine patient, other customer, and market needs and requirements for health care service offerings through our listening and learning processes (3.1a.(1)), our involvement in the community (1.2c(1)), and the SWOT analysis we conduct during the SPP (2.1a.(1)). We identify new or determine that we need to adapt current health care service offerings that meet the requirements and exceed the expectations of residents and other customers during the SPP. This occurs through review of key requirements (Figure P.1-8) and review of key performance indicators (Figure 2.1-4), at which time, we benchmark our past performance data and test our outcomes. Our key market segments are supported through our key communities (Figure 1.2-5). Through listening and learning methods (Figure 3.1-1) and Key Customer Access
Mechanisms, we are able to identify new markets. In May of 2009, we learned through our speech therapist contact that there was an opportunity to expand speech therapy services in St. Maries, a rural logging town located about an hour away.
We contacted the physician office, acute care hospital, and local skilled nursing facility to facilitate joint speech therapy care for their community members requiring short-term rehabilitation. To date, we have had five admissions in which we coordinated care at our facility, follow-up physician visits, and discharge back to their community.
In July of 2014, we worked jointly with RehabCare to hire another full-time speech therapist to ensure the needs of our customers were met and to offer more choice to our community for this health care service. (3.1a.(3)) We also work in conjunction with MHC for an orthopedic specialist to come to our community through an outreach program supported by Kootenai Health. This effort has helped us to create opportunities to expand relationships with current patients and other customers.
3.2a.(2) Patient and Other Customer Support: Figure 3.2-1 lists key access mechanisms that enable all residents and other customers to seek information, obtain services, and offer feedback. All contacts can be made in person, via online channels, phone, and/or written communications. We offer a variety of options that support diversity across all customer groups and market segments. Through SEP training, the workforce is empowered to manage customer needs and expectations at the point of contact. Determining key support requirements occurs on an ongoing basis when we analyze our access mechanisms and customer requirements, making changes as necessary. Customer access mechanisms are deployed to all residents and other customers and reinforced with the deployment of SEP training to the entire workforce.
In 2012, as part of our Falls Reduction Program, we identified the need to improve our SEP by introducing a Culture of Safety, where employees were encouraged to report risk areas without fear of reprisal. Staff were taught that keeping residents and fellow employees safe was an integral part of providing Service Excellence.
In 2014, we worked with our Corporate Marketing Department to design our own Facebook page. This page is kept current by that department based on our feedback to ensure we are meeting the changing needs of our customers’ expectations and in compliance with all HIPAA regulations. Our senior leader, Emilee, is the primary contact for all social media contacts. We also have a very comprehensive web page where customers can email our center directly from the web page. We also developed an innovative process to offer a “webtour” to potential residents and their families. This request can also be made directly from our website, and we have conducted three of these tours to date.
FIGURE 3.2-1 Key Customer Access Mechanisms
Mechanism Seek
Information
Obtain
Services
Feedback/
Complaints
Facility Website ●
Newspaper Articles ●
Brochures ●
Compliance Hotline ● ●
Community Events ● ●
Reputation.com ●
Facebook ● ● ●
State of Idaho ● ●
Bureau of Facility Standards
● ●
Satisfaction Survey ●
CMS Website ● ●
Senior Leaders ● ● ●
Admission Support ● ●
Grievance Procedure ●
3.2a.(3) Patient and Other Customer Segmentation: We determine patient and other customer groups and market segments first by identifying common requirements and expectations obtained through our VOC process, involvement in the community, and – ultimately – during our SPP. These systematic approaches allow us to identify current customer groups and market segments as well as to identify emerging

Kindred Nursing and Rehabilitation – Mountain Valley 2016 Malcolm Baldrige National Quality Award
Customer Focus Page 16
needs that may represent a future customer group and/or market segment. These approaches, as well as those described in 3.1a.(2), allow us to consider the patients and other customers of our competitors. The determination of which patient and other customer groups and market segments to emphasize and pursue for business growth is made with the following criteria in mind: (1) Is this pursuit in keeping with our MVV? (2) Does it leverage our core competencies? (3) Would it provide a strategic advantage? (4) Is there sufficient estimated ROI to offset the costs? (5) Is there sufficient need in the community to justify the investment, or can the need be met elsewhere?
In 2013, as a result of physician feedback, we learned that while our rehabilitation department staffing was adequate to provide quality care, we could increase our acuity level if we created a stronger short-term rehabilitation program. We began growing our therapy staff with a new program director during the second quarter of 2013. She came to us with a Doctorate in Physical Therapy complemented by years of wound care experience. This staffing change allowed us to take patients with more complex wounds who previously could not return to their community as no other medical provider offered this level of care. In July of 2014, we hired a full time Speech Therapist to serve the needs of our patient population. Josh came to us with extensive experience in post
stroke care in a post-acute environment. This gave our center the ability to admit patients who might have otherwise been admitted to the Long-Term Acute Care Hospital out of their community (currently we are the only medical provider with a full-time speech therapist). Through this focus, we have increased our therapy staffing from 0.88 Per Patient per Day (PPD) in August of 2012 to 1.08 PPD in February of 2015 with another increase of 0.09 in July 2015 with a full-time dedicated Occupational Therapist. 3.2b. Patient and Other Customer Relationships:
3.2b.(1) Relationship Management:
Through the SPP, involvement with our key communities, and listening and learning (VOC) methods, we are able market, build, and manage relationships with patients and other customers. Figure 3.2-2 shows how our Customer Relationship Management process integrates our VOC and
SPP. This intentional integration came about in 2014 as a result of evaluating the best practices of several Baldrige Award recipients in health care by reviewing their application summaries available on the Baldrige website. While we had previously used customer feedback as inputs to our SPP to evaluate the need for additional health care service offerings, we had not considered assessing changes to our customer relationship management process and setting related strategic objectives and action plans.
We acquire patients and other customers and build market share through our proactive involvement in the community, collaboration with other health care service providers, building relationships with discharge planners, providing tours of our facility, and through the word-of-mouth positive referrals from loyal patients and their families.
We have adopted innovative approaches to enhance our brand image. For example, we invite former patients and their families to return for special events such as our annual luau. We ask them consider serving as volunteers. We invite them to participate in our local parade wearing Kindred shirts. We include them on our mailing list for our quarterly newsletter. In 2009, our feedback report for our Gold Award application identified that while we were doing a good job in
obtaining and listening to the VOC, we still could be missing some opportunities by not segmenting our data.
The senior leaders reviewed the primary tool used, which were the MyInnerView customer surveys at that time, and determined that at some level there could be segmentation of the responses. We selected the gender response in which to “dig deeper.” Since most responses came from females, we selected our male residents to interview. What we learned was that while they were very satisfied with our care, the décor was too feminine for their tastes. Based on that feedback, we created a “man cave,” which is a room with a regulation size pool table, large TV, outdoor theme, dining room table, and recliner. It has been a wonderful success and drew compliments from visitors.
FIGURE 3.2-2 Customer Relationship Management Integrates with Strategic Planning Process
Residents/Families • Workforce • Community • Partners/Collaborators
CUSTOMER / STAKEHOLDER SEGMENTS
SPP Steps 6, 9, & 11 (Figure 2.1-1)
Deploy process improvements through key meetings and communication forums.
Deploy Strategy & Action Approaches
Review, Evaluate, Act
SPP Steps 1, 5, 7, & 12 (Figure 2.1-1)
Review customer feedback and evaluate processes, refine listening and learning methods if necessary, and act
on Action Plan. (ongoing)
Voice of Customer
Listening and Learning Tools (Figure 3.1-1)
SPP Steps 5 & 8 (Figure 2.1-1)
Analyze key data to determine customer requirements and identify if current services
exceed their expectations.
Identify Process Improvement.
Analyze Data,
Performance Improvement

Kindred Nursing and Rehabilitation – Mountain Valley 2016 Malcolm Baldrige National Quality Award
Customer Focus Page 17
In 2015, in another cycle of evaluation and
improvement in building relationships, we assessed how our
resident population had changed, and we realized that the pool
table allowed only the more independent residents to play
because of limited space in the room and the difficulty
residents had in getting around the table. Then we admitted a
pleasantly confused lady and husband together. However, she
would never go into that room with him or to therapy because
it was the “man cave,” and she thought women were not
allowed. We proactively solicited feedback through interviews
at Resident Council, Abaqis, and during care conferences.
The pool table was removed following a majority vote at
Resident Council. A large flat screen SMART TV was
installed along with a bookcase with large print books added.
We added another table so we still had one empty for residents
to have meals with their families, but now we have one with a
jigsaw puzzle always in progress and still have room for a
board game. We renamed the “man cave” to the TV Room.
In a subsequent cycle of evaluation and improvement,
we learned that our residents wanted some type of hands-on
game back there, so we purchased a small game table that is
foosball on one side and ping pong on the other side. Since
the room was no longer dominated by the TV, it was once
again renamed to become the Rec Room. We ensured that it is
decorated in a very neutral manner with no “girly stuff.” We
just added iPads and a laptop in early March, and the residents
LOVE the room!!! Therapy uses it for games while doing
therapy, which increases the residents’ participation in
therapy.
Our CMS 5-Star rating definitely enhances our brand
image and helps us to attract new patients. We even attract
residents from the Coeur d’Alene area because of our rating.
Our Medical Director transferred his mother from an assisted
living facility in Helena, MT, to our facility after she ended up
in a hospital after a fall. She needed skilled nursing and
rehabilitation, but the Medical Director knew that she would
ultimately transition to long-term care rather than return to
assisted living. We even attracted a new nurse from California
who researched long-term care facilities with two criteria in
mind: CMS 5-Star rating and recipient of the AHCA/NCAL
Quality Award Program’s Gold Award.
We retain patients and other customers, meet their
requirements, and exceed their expectations in each stage of
their relationships with us with more formal approaches to
communication in the first stage as they consider coming to
our facility. Upon admission, we use multiple VOC methods
(3.1a.(1)) to understand the unique needs of each resident and
family to provide our high quality resident-centered care. The
longer a resident stays with us or is engaged to continue in a
volunteer role at our center, the less formal and more
personalized our approaches are to communication, which
builds their engagement with us.
We leverage social media to manage and enhance our
brand and to enhance patient and other customers’
engagement with us through online reviews. We ask our
customers to place an online review if they had a positive
experience with the customer service and/or the care they
received while at our center.
3.2b.(2) Complaint Management:
Complaints are received through listening and learning
methods (Figure 3.1-1). Complaints are managed through the
systematic process shown in Figure 3.2-3. Empowering our
workforce to effectively resolve complaints is integrated
throughout (1) SEP: employees are trained in the customer
relationship area and empowered to address complaints at all
levels including workforce concerns; and, (2) Senior
Leadership Rounding, which helps to identify any current
complaints, in addition to minimizing future complaints. The
immediate actions of the workforce as the result of this
empowerment are that our patients and other customers
remain confident in their ability to resolve issues at all levels,
which fosters overall satisfaction outcomes in the top 10% of
the nation (Figures 7.2-1 and 7.2-12). In an effort to ensure all
complaints are resolved and in a timely manner, our center
began using a daily Stand-Up Log during the second quarter
of 2006. The log includes tracking all Senior Leadership
Rounding concerns/grievances, QAPI issues/trending,
employee communication, as well as, additional key resident
care and operational areas. The log is designed for a week-at-
a-glance, maintained by Maryruth, and reviewed daily.
In a cycle of proactive evaluation and improvement in
the last quarter of 2014, we added a clinical meeting follow-up
log that tracks all physician communication to ensure that we
have received the requested communication from our
physicians related to the clinical status of our patients. This
process eliminates many of the complaints previously received
and supports our quality outcomes evident in QI/QMs and
resident and other customer satisfaction results.
FIGURE 3.2-3 Managing Customer Concerns
Customer complaint
identified by employee.
The employee is empowered to
effectively address the concern.
Employee listens and
seeks to understand the customer.
Staff member works to resolve the concern in a timely
manner.
If not resolved, assign to
individual able to resolve.
If needed, the employee communicates the
concern to Supervisor and/or Maryruth.
Supervisor and/or Maryruth follow-up,
ensuring that the concern is resolved within 24 hours.
Track at daily
Stand-Up Meeting.
Review at QAPI Meeting for needed
follow-up and to track/trend complaints.
1 2 3 4 5
6 7 8 9

Kindred Nursing and Rehabilitation – Mountain Valley 2016 Malcolm Baldrige National Quality Award
Measurement, Analysis, and Knowledge Management Page 18
CATEGORY 4: MEASUREMENT, ANALYSIS, AND KNOWLEDGE MANAGEMENT
4.1 Measurement, Analysis, and Improvement of
Organizational Performance
4.1a. Performance Measurement:
4.1a.(1) Performance Measures: Through the SPP (Figure 2.1-1) and as demonstrated in 4.1a.(2), we have established the process of selecting, collecting, aligning and integrating data for tracking daily operations and overall organizational performance. This system enables us to monitor progress on our action plans to ensure we can achieve our SOs. Our Performance Measurement System is depicted in Figure 4.1-1.
Our key organizational performance measures are shown in the Kindred Balanced Scorecard for our center, Figure 4.1-2. In addition to those mandated by our corporation, we have identified other measures that are important to our success. These are shown in our Action Map, Figure 2.1-4. Each of these measures is tracked at least monthly with some tracked as frequently as daily. We use these data and information to support organizational decision making and innovation through our Performance Improvement System, P.2c, and our Innovation Management process, 6.1c. As described earlier, our culture is characterized by fact-based decision making at all levels of the organization. This culture is supported daily by Senior Leadership Rounds at which time direct care staff are involved in the process to identify solutions. Problem-solving tools are also discussed during all staff meetings and departmental-specific meetings during the Performance Improvement Process. Our workforce has been trained on key performance
measures that are displayed in the employee break area. Through this process, our workforce remains current on the systematic use of data to drive key strategic decisions. This was acknowledged in 2015 when our facility was recognized as one of four Idaho organizations with the Idaho Awards of Excellence in Healthcare Quality by Qualis Health. We were recognized for our successful implementation of our falls prevention program that resulted in positive outcomes.
In fact through review of our selected performance measures, for the fall prevention QAPI, we revised our action plans six times over two years to support continued improved organizational performance. The revision of these action plans included changing the frequency and types of measures gathered. This program was the work of a cross-functional team of employees at all levels using data and analysis to drive improvement in a key clinical area. Although visual management is a technique that is common in other industries, it is very new to long-term care. As part of our ongoing maturity in the use of data and information, we have made important measures more visible, increased segmentation, and show benchmark comparisons where available. The Visual Management Boards have increased employee engagement in working on improving those areas of
greatest importance. These also helped to address feedback we received from one of our Gold Award applications that identified an opportunity to provide more data and information to staff.
4.1a.(2) Comparative Data: Selection of comparative data occurs during SPP Step 5 and is evaluated in Step 8 in terms of the ability to benchmark our measures against other organizations. Key comparative data (Figure P.2-2) must support objective evaluation of our performance against relevant comparisons. To the extent that information is available, we compare ourselves against top decile performance. Unfortunately, that is not possible for
FIGURE 4.1-2 Balanced Scorecard
People
10%
Quality and
Service•20%
Growth
15%
Efficiency
15%
Capital
10%
Nursing Turnover
Employee Engagement
Work Comp Claims Freq
Deficiency Index Avg.
Clearing Tags 1st F/U
Hospital Readmits
CMS 5-Star
– Survey
Abaqis Utilization
Process Reputation.
com
CMS 5-Star – Quality
Total ADC
M2 PPD Revenue
M2 Mix
Medicare
ADC
Operating Exp PPD
Ancillary Expense
Average
Wage Rates
Nursing Hours PPD
Total Labor Hours PPD
Malpractice
Claims Frequency Overtime
Utilization
AR Days
Cash
Collection
Bed Debt - % Revenue
EBITDAM • 30%
Everything
above the
solid black
lines are
included
in the
Short-term
Incentive
Plan
ED & DNS Turnover
Update QAPI Agenda to Reflect Current Data
Report Key Measures to
QAPI Committee
Report in Daily Stand-Up Meeting, IDT Team, Clinical Review, etc
Select Relevant Comparative Data and Set Targets
Develop Key Short- and Long-term Action Plans
Develop Departmental
Plans
Collect and Review Data, Review Action Plans
Strategic Objectives and Action Plan
Department Objectives and Action Plan
FIGURE 4.1-1 Performance Measurement System
Align Objectives and Identify Key
Measures
Align Objectives with Organization and Identify Key
Measures
Strategic Planning
Yes
No
Achieve Target?
Assign Responsibilities, Boundaries, and Reporting

Kindred Nursing and Rehabilitation – Mountain Valley 2016 Malcolm Baldrige National Quality Award
Measurement, Analysis, and Knowledge Management Page 19
some of our measures, and those limitations are also indicated in Figure P.2-2. We deploy our comparative data to our workforce so that they can identify for themselves when there is a gap between our performance and our aspiration to be the benchmark. 4.1a.(3) Patient and Other Customer Data: We use our VOC (3.1a.(1)) and market data and information (3.1a.(3)) to integrate with other systems and processes. For instance, we rely heavily on these data during our SPP (2.1a.(1)) to identify shifts in patient and other customer requirements and expectations, opportunities to expand our health care service offerings (3.2a.(1)), other opportunities for process improvement and innovation (P.2c). These data are also used to support operational decision making through the daily Stand-Up Meeting where we review them to determine what actions must be taken to meet or exceed patient and other customer requirements and expectations. Through these opportunities, we build a more patient-focused culture. We use data and information gathered on social media, such as Medicare.gov to compare ourselves against local competitors. We view competitors’ Facebook pages to gain insights into upcoming events, marketing strategies, etc. And we “Google” our own facility and our competitors’ to see if comments or ratings have been posted. Examples of patient- or other customer-driven innovation are shown in Figure 4.1-3.
FIGURE 4.1-3 Customer Data Drives Innovation
Voice of Customer Innovation Key Driving Data
from VOC
Results
(Figure)
Choices 7.2-3, 7.2-14
Overall Customer Satisfaction
7.2-1
Residents design the monthly activity calendar with increased participation in community activities such as fishing, county fair, Wal-Mart shopping, lake
cruises, and senior dancing. Volunteer Satisfaction 7.3-44, 7.3-45
Food Preparation 7.2-8
Social Harmony 7.2-10
Created a more homelike environment where spouses can dine with residents, soup of the day, weekly dessert cart,
elegant holiday meals, snack bar, linen napkins, expanded alternate meal
menu, and encouraged focus on Dining Committee.
Cleanliness 7.2-11
Activities 7.2-5 Development and transition of the Man Cave to the TV Room to the
Recreation Room. (3.2b.(1)) Social Harmony 7.2-10
Retention / Turnover 7.3-39, 7.3-40
Employee Engagement
7.3-28
Created flexibility in work schedules and educational programming based on
resident/patient feedback, industry focus, and internally identified
concerns; for example, the development of our survey quizzes – we began with one and through this process we now have developed four survey quizzes.
Total Education Hours 7.3-48
RN Staffing 7.4-11
Occupancy Rates 7.5-11
Created rehabilitation and RN staffing in response to community need and
growth strategy. Total Net Revenue 7.5-5
4.1a.(4) Measurement Agility: We ensure that our performance measurement system is able to respond to rapid or unexpected change in three ways. First, at least annually during our SPP, we review our set of measures to evaluate whether they are sufficient to address
changes in our industry. Second, we evaluate our measures during monthly QAPI meetings to determine if additional measures are needed to enable additional analysis and improvement of a situation presenting with an adverse trend. Third, we may identify the need for an additional measure
during daily Stand-Up Meeting. We learned in July of 2015 through contact with KMC discharge planners that Silver Valley residents were required to remain outside of our community as a result of periods of 100% occupancy at our
center. Maryruth and Candace, Admissions, contacted SMC to identify any opportunity for their support and our relationship further expanded. They admit our patient referrals to swing bed status for short-term rehabilitation until we can accommodate them at our facility. 4.1b Performance Analysis and Review: We review our key organizational performance measures at varying frequencies. Some, such as census, are monitored on a daily basis, while others, such as performance to budget, are reviewed on a monthly basis. Some of our clinical measures are reviewed weekly with staff. We use our key performance measures (which include customer-related metrics), as well as comparative data to track our progress against our action plans and SOs, identify emerging adverse trends to quickly implement corrective action, and to proactively identify opportunities for additional improvement in areas where performance is already at or above the goal or benchmark. We conduct various types of analyses depending on the data. We use trend analysis, root cause analysis, and
correlation analysis. In 2013, we added the use of visual mapping techniques (such as identifying the location of falls on a blueprint of our facility). These approaches ensure that our conclusions are valid. We also use these reviews to detect and respond to changing organizational needs and challenges in our environment that might require transformational change in our organizational structure and work systems. Our facility does not have a governance board, but our divisional office reviews our scorecard performance on a quarterly basis. This includes our progress on SOs, goals, and related action plans. 4.1c. Performance Improvement:
4.1c.(1) Best Practices: Sharing of best practices throughout our organization occurs through QAPI, electronic education, or communication from consultants. We identify organizational units that are high performing by comparing their performance against benchmarks. When we see distinctive performance in one area, we analyze what is enabling them to achieve that level of performance. These best practices are then shared across the facility and across our district. Our district in particular is very proactive in sharing best practices that have resulted in positive outcomes. Quarterly Maryruth attends Qualis meetings that support learning and the identification of new tools to use in the QAPI process. Centers from Northern Idaho and Eastern Washington attend and share current and past QAPI projects for the purpose of sharing best practices. Sharing of best practices

Kindred Nursing and Rehabilitation – Mountain Valley 2016 Malcolm Baldrige National Quality Award
Measurement, Analysis, and Knowledge Management Page 20
has occurred around our Falls Reduction Program with multiple centers in North Idaho and in the Northwest District implementing sound monitoring appliances (Yakker Trackers) to reduce falls that may be caused in response to noise. Additionally, based on our success in the reduction of antipsychotics, centers have contacted Jenny and Emilee for information on the systematic changes to our behavior interventions that have reduced the use of antipsychotics. 4.1c.(2) Future Performance: We project our future performance through extrapolating historical data and assuming steady-state from our reviews conducted in 4.1b. If we detect a gap between our projected performance against the projected performance of relevant comparisons, we first need to determine if there are reasons that might be related to differences in our resident populations, such as acuity levels or disease conditions. If we determine those are not the reasons for the gap, we initiate improvement projects, particularly if the comparison is a local competitor. 4.1c.(3) Continuous Improvement and Innovation: We use findings from our performance reviews (4.1b) to identify and prioritize needed improvement when we detect an adverse trend, an emerging gap against our projected performance and the projected performance of a competitor, or
have already met our goal and want to challenge ourselves to higher levels of performance. We identify opportunities for innovation when we determine that continuous improvement will not allow us to achieve our goal in the timeframe desired, and breakthrough improvement is required. We deploy this information to our workforce, suppliers, partners and other collaborators through email, phone, meetings, and contractual
agreements. For example, in our falls reduction program when we must use alarms, in 2015 we worked with our supplier to implement a type of alarm that connects with our call light system to minimize the noise.
4.2 Knowledge Management, Information, & Information
Technology
4.2a. Organizational Knowledge:
4.2a.(1) Knowledge Management:
Our knowledge management system consists of standardized
forms, organizational specific forms, clinical assessments,
organizational audits, 24/7 access to real-time data, computer
use, Learning Management System (LMS) and various web
based tools as outlined in Figure 4.2-1. Cycles of
evaluation and improvement to our Knowledge Management
System are designated with an apple in Figure 4.2-1.
FIGURE 4.2-1 Knowledge Management System
Knowledge
Used By or For
Collection Methods: Communication
Voice of Customer Mechanisms for Deployment
Organizational Learning
and Use of Knowledge Evaluation / Measures
Workforce
1:1 Communication, Senior Leadership Rounds, Employee Engagement Surveys,
Open Door program
Shift to Shift Report, Taped Shift Report, Daily Stand-Up, Daily
Clinical Review, Inservice Education, Posting, Department Meetings
Performance Evaluations, Compliance Standards,
Succession Planning
Competencies, Regulatory Compliance, Employee Engagement, Turnover,
Retention
Patients / Family
Abaqis Family and Resident Satisfaction, Resident Council, Dining Committee, Senior Leadership Rounds,
Open Door program
Resident Care Conference, Senior Leader Interaction, 1:1
Communication, Resident Council, Dining Committee
Improved Resident and Family Satisfaction, Improved Resident
Outcomes
QI/QM, State Survey, Abaqis Outcomes, Grievances
Other Customers,
Suppliers, Partners
Health Fairs, Job Fairs, Social Media, Community Involvement,
Reputation.com, Emails, Meetings
Mailings, 1:1 Communication, Emails, Company Updates, Newspaper,
Facility Newsletters
Identify Customer Needs, Ensure Service Delivery
for all Healthcare Services
Resident/Family Satisfaction Scores, Employee
Engagement Scores
Identifying /
Implementing Best
Practices
District Meetings, Consultant Visits, QAPI Projects, Associations Education
Postings, Inservice Education, Departmental Meetings, Daily
Communications
Continuous Process Improvement, Improved workforce, Resident and
Family Satisfaction
Abaqis Resident and Family Satisfaction, Employee
Satisfaction, QI/QM
Strategic Planning
Departmental SWOT, Off-Site Strategic Planning,
Review of Internal and External Data, Environmental Scan
Outside Meeting, Strategic Planning Process, Email, Action Map Posting
and Monthly Updates
Strategic Planning and Development, Meet and
Exceed Stakeholder Requirements
Achievement of Strategic Objectives, Achievement of
Balance Scorecard Expectations
We collect knowledge relevant to our workforce while correlating data from different sources to build new knowledge, deploying this information to the workforce, patients, and other customers. We use this knowledge to manage innovation and as part of our SPP. Our long-tenured workforce has an additional knowledge base, which is also used within our strategic planning process. Each employee is considered for cross-training to enhance our workforce availability and knowledge base. Inservice training is used to increase knowledge and create opportunities for individual members of the workforce to communicate experiences and knowledge about key processes. We utilize our key patient training and educational web-based resources to disseminate information to our patients and other customers. Integration of
the Lippincott education modules has enhanced our educational offerings to our patients and other customers. This interactive tool has also provided a learning model for our clinical staff. By utilizing ideas and the knowledge base from our workforce, we encourage an atmosphere of ownership in the care of each of our residents and patients. 4.2a.(2) Organizational Learning: The Kindred organization encourages continual education. KNRMV promotes learning by offering tuition reimbursement, online educational opportunities, seminars and organizational training opportunities. By promoting and encouraging increased knowledge, we encourage staff to be actively involved in the care of our patients and residents while sharing ideas and innovations within our organization.

Kindred Nursing and Rehabilitation – Mountain Valley 2016 Malcolm Baldrige National Quality Award
Measurement, Analysis, and Knowledge Management Page 21
4.2b. Data, Information, Information Technology: Most of the Multiple Requirements properties are addressed in Figure 4.2-2.
FIGURE 4.2-2 Data, Information, and Information Technology Properties Data Information Knowledge
Accuracy
• Standardized Industry Forms • Organizational Forms • Computerized Clinical Assessments • Identification Verification • LMS Training Systems
• Organizational Audits • Organizational Forms • Reports • PCC Photo System • Learning Management System
• Internet • Assigned Users • Verification Systems • Web Based Clinical Tools
• Web Based Training System
• Web Based Tools and Resources
Integrity and
Reliability of
Resources
• Uninterruptable Power Supply (UPS) • Anti-Virus Software • Anti Hacking Security Systems
• Generator Back Up Systems • Battery Back Up • Web Based Systems • Network Firewalls
• Web Based System Tools • Battery Back Up Ensures No Interruptions In Service • PCC Software System • Organizational Operating System
Timely
Availability
• Real Time Data Access • 24/7 Access • Real Time “Help Desk” Assistance
• Real Time Data Availability 24/7 • 24/7 Access • Organizational Training • Maintains Continuity of Care
• Personal One to One Education and Assistance
Security
• Organizational Directory • Computer Use Agreement • Individual Security Clearance • HIPAA Compliance • Service Confidentiality Agreement
• Active Organizational Directory • Computer Use Agreement • Restricted Security • HIPAA regulatory Compliance
• Active Directory Access 24/7 • Computer Confidentiality Agreement • Privacy Agreement meets Regulatory Requirement
4.2b.(1) Data and Information Quality: The Kindred IT Department oversees any technology infrastructure and support. The Kindred “Business Warehouse” systems provide financial and service informational data to our organization. The Point Click Care (PCC) “Dashboard” provides real-time clinical information for each patient and resident within our facility. The system eliminates the need for excessive paper charts and financial information. Each authorized employee can access patient information from any computer in our organization. If an employee is in another Kindred facility, he or she can access current information through remote access to give directives or review patient information. All employees are cleared for security access relevant to job duties through the IT Security department upon hire. Point Click Care patient management system was implemented within our organization in 2013. This process included onsite evaluation of computer skills and literacy for all staff utilizing the system, onsite educational training, and implementation of medical records into an electronic data base. Kindred’s IT Department ensures the accuracy and integrity of the system. All employees with access to patient information systems must have personal passwords that are changed every 90 days. All employee files are maintained within the Kindred Organization electronic database. Employee health information file, workers’ compensation files, and employee incident files are kept with on-site access and maintained according to company policy and procedures. All patient business files are maintained electronically through the Kindred IT management system.
Through review of QI/QMs in January of 2016, we identified that our high risk pressure ulcer percent had increased. This information is discussed daily in our Stand-Up Meeting, so the increase was not expected. After review, the root cause was determined to be a coding error on a resident’s
MDS. Kindred currently uses the TSI Healthcare Solutions program primarily to track the CMS 5-Star rating for each center; however, the program has additional functions that are not typically used at the center levels. Through seeking
additional education on the program, Maryruth is now able to track any new MDS information that is coded in our center. For example, if an MDS is completed on Tuesday, Maryruth is able to view all of that information on Wednesday through the TSI program, tracking any changes day to day in our QI/QMs as the result of new MDS information. Each Friday at our Clinical meeting, this information is reviewed to verify accuracy prior to the first of month when QI/QM data is pulled
and reported to CMS for 5-Star rating. This process was demonstrated by Maryruth at the most recent district office meeting to teach other EDs in the district. 4.2b.(2) Data and Information Security: The Kindred IT Department ensures and maintains security of all sensitive and or privileged data and information. All data are password-protected. Staff have security access according to job specifications. Physicians and outside venders are given limited security access depending on licensure qualifications and need-to-know status. IT Security manages all internet systems to ensure all information is protected. Firewalls prevent breaches of protected information. 4.2b.(3) Data and Information Availability: Organizational data and information are available 24/7. The PCC system is very user-friendly. In the event of a system breakdown, staff can access patient information by calling the IT Department manager to have information faxed to the facility for immediate access. 4.2b.(4) Hardware and Software Properties:
Our IT Department ensures that hardware and software are reliable, secure, and user-friendly. All updates to the system are provided through the IT Department with system update information deployed to the workforce through our communication systems. 4.2b.(5) Emergency Availability: Internet and Intranet System Support is contacted for an emergency, and they maintain hardware and software redundancy for all production systems to ensure minimal downtime during component failure, and generator support is located onsite. Backups are utilized and maintained for the

Kindred Nursing and Rehabilitation – Mountain Valley 2016 Malcolm Baldrige National Quality Award
Workforce Focus Page 22
purposes of extended loss recovery. We maintain a hard copy charting system to use in the event of a system failure. All forms utilized in the PCC system can be completed in hard copy 24/7. All patient information is secured in HIPAA-protected format. In the event of a disaster, contingency plans have been developed to ensure the transition of patient data and medication management to follow each patient. SLT members, who have remote security access, can access all patient charts through facility-secured portable computer systems. Our generator system provides uninterrupted service to all main areas of the facility to ensure patient safety and access to patient information. Battery backup systems
maintain medication administration cart computers to ensure uninterrupted medication management (6.2c.(2)). In the event of total system failure, the IT Department will send patient MARs and TARS, and medical orders to the facility by courier or fax. If information would be required during a specific facility emergency, customer support would provide information through fax, email, or verbal delivery to ensure continued operational success. It is also a facility practice that information is reviewed monthly through reporting systems and printed and maintained from one month to the next. This process allows continued availability of data and information in case of system failure or scheduled maintenance down time.
CATEGORY 5: WORKFORCE FOCUS
5.1 Workforce Environment
5.1a. Workforce Capability and Capacity:
5.1a.(1) Capability and Capacity:
Our workforce capability and capacity management system is shown in Figure 5.1-1. Workforce capability and capacity needs, including skills, competencies, and staffing levels are addressed in Steps 2 and 9 of SPP. Assessing the capability of our workforce begins before hire when we determine the skills needed for any open position. Each new hire must demonstrate the skills and competencies in which to perform their job responsibilities. This occurs during the orientation period, which quickly identifies any area of weakness that needs addressing through additional education, mentoring, and coaching. The employee managing the orientation process must sign off on all skill sets verifying that the new employee has the skills that support high performance. Skills assessment post-hire occurs daily during Senior Leadership Rounds, as demonstrated in Figure 1.1-2, can be self-identified by the employee and addressed as demonstrated in 5.2b.(1), and occurs annually during performance evaluation. Competencies of staff are monitored through annual competency testing (Figure 5.2-3). Each year our educational calendar is developed by participation from regional, district, and facility clinicians. This is supplemented by our own required skill set process where we make additions to our educational programs. Emilee assesses the skills of all volunteers to capitalize and leverage their capabilities along with our workforce.
In 2013, as the result of workforce listening methods, we learned that our workforce wanted more education relating
to working with difficult families. The 8 Elements of our SEP (Figure 5.1-2) addressed this at some level, but we expanded the education to include targeted inservice education that is presented annually by Jenny, SS. She was able to change the names to protect the “guilty” and deal with “real work” scenarios. This education, integrated with our SEP, supported the positive trend in workforce satisfaction with “Senior Management is interested in the well-being of employees” training from 41% in 2013 to 81% in 2015 as well and an increase from 69% in 2013 to 90% in 2015 for “I have received the training I need to do a quality job” (Figures 7.4-5 and 7.3-47). All education is monitored through the online Learning Management System and reviewed monthly during the QAPI meeting, which demonstrates positive trends in
addition to customer satisfaction relating to workforce competencies. We assess and manage workforce capacity needs through a systematic approach. Daily staffing levels are reviewed to ensure that our staffing meets with the expectation of high performance. Daily, senior leaders review the labor spreadsheet to ensure adequate staffing is in place and addresses any areas that are not meeting our requirements. Each senior leader develops a monthly schedule for staffing, which quickly identifies the need for additional staffing. In October 2015, we started using an on-shift scheduling program that calculates our daily PPD to ensure we have the correct clinical staffing for our acuity. It also allows employees to access their schedules online and request changes. Maryruth, Janet, and Jodi review it daily. We have learned that cross-training of employees is a proactive approach to areas that may just need temporary staffing. Currently, we have part-time employees trained in skills for at least two departments; such as a culinary aid who has been trained to perform the one-to-one activities with residents with extra needs. This approach has enabled us to quickly react to daily changes without interruption in operations or health care service delivery. In the first quarter of 2014, in another cycle of evaluation and improvement of our processes to manage capability and capacity, we identified that we were sending a CNA on van runs because our van driver was usually not a CNA and could not provide resident care or transfers during physician visits. This created needless labor and staffing issues on the floor. During our QAPI meeting, we determined that all future van drivers needed to be CNAs and that our current van drivers needed to become certified. We determined that two van drivers needed to be certified as CNAs. They were enrolled in class and now are CNAs. In June 2015 during a Community Coalition Committee meeting, we discussed an issue we had with providing the transportation for our residents during off hours. For example, if a resident went to the ER via an ambulance, they were likely to be transported back by ambulance. This created a financial exposure for the center if the resident did not meet the Medicare guidelines for that level of transfer. Senior leaders selected three CNAs who routinely worked afternoon and night shifts to train as van drivers. All drivers
are now CNAs and we have 24/7 transportation coverage.
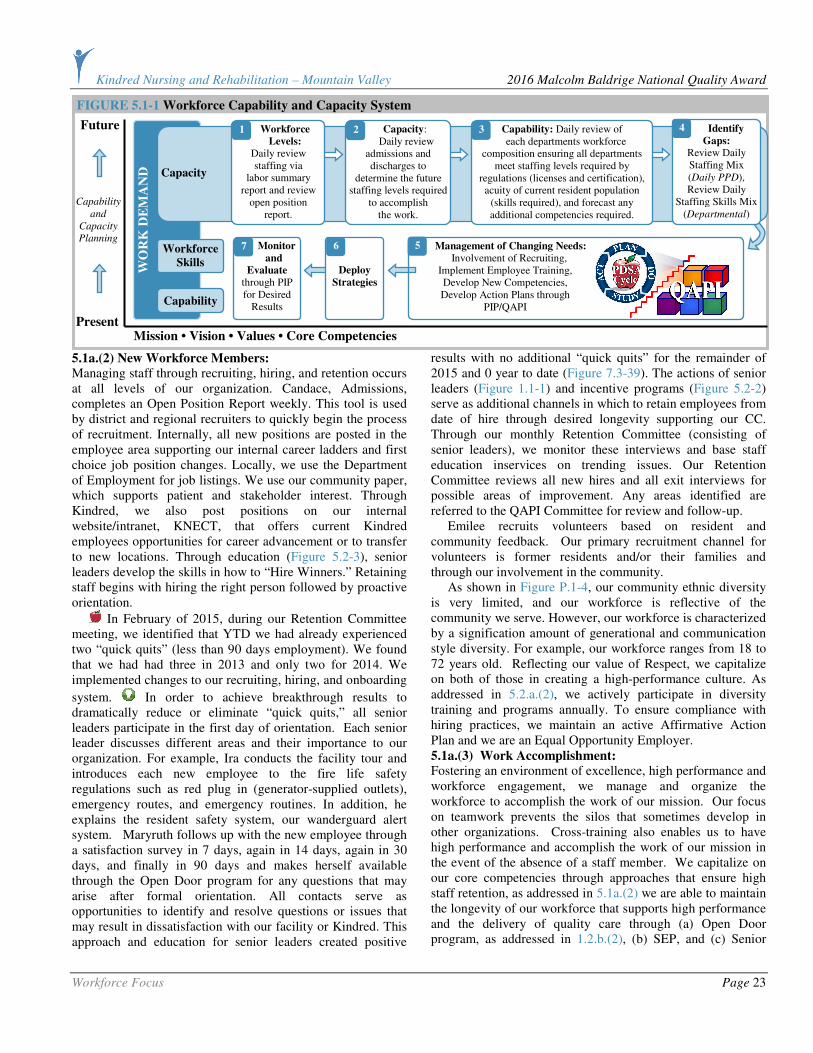
Kindred Nursing and Rehabilitation – Mountain Valley 2016 Malcolm Baldrige National Quality Award
Workforce Focus Page 23
5.1a.(2) New Workforce Members: Managing staff through recruiting, hiring, and retention occurs at all levels of our organization. Candace, Admissions, completes an Open Position Report weekly. This tool is used by district and regional recruiters to quickly begin the process of recruitment. Internally, all new positions are posted in the employee area supporting our internal career ladders and first choice job position changes. Locally, we use the Department of Employment for job listings. We use our community paper, which supports patient and stakeholder interest. Through Kindred, we also post positions on our internal website/intranet, KNECT, that offers current Kindred employees opportunities for career advancement or to transfer to new locations. Through education (Figure 5.2-3), senior leaders develop the skills in how to “Hire Winners.” Retaining staff begins with hiring the right person followed by proactive orientation.
In February of 2015, during our Retention Committee meeting, we identified that YTD we had already experienced two “quick quits” (less than 90 days employment). We found that we had had three in 2013 and only two for 2014. We implemented changes to our recruiting, hiring, and onboarding
system. In order to achieve breakthrough results to dramatically reduce or eliminate “quick quits,” all senior leaders participate in the first day of orientation. Each senior leader discusses different areas and their importance to our organization. For example, Ira conducts the facility tour and introduces each new employee to the fire life safety regulations such as red plug in (generator-supplied outlets), emergency routes, and emergency routines. In addition, he explains the resident safety system, our wanderguard alert system. Maryruth follows up with the new employee through a satisfaction survey in 7 days, again in 14 days, again in 30 days, and finally in 90 days and makes herself available through the Open Door program for any questions that may arise after formal orientation. All contacts serve as opportunities to identify and resolve questions or issues that may result in dissatisfaction with our facility or Kindred. This approach and education for senior leaders created positive
results with no additional “quick quits” for the remainder of 2015 and 0 year to date (Figure 7.3-39). The actions of senior leaders (Figure 1.1-1) and incentive programs (Figure 5.2-2) serve as additional channels in which to retain employees from date of hire through desired longevity supporting our CC. Through our monthly Retention Committee (consisting of senior leaders), we monitor these interviews and base staff education inservices on trending issues. Our Retention Committee reviews all new hires and all exit interviews for possible areas of improvement. Any areas identified are referred to the QAPI Committee for review and follow-up. Emilee recruits volunteers based on resident and community feedback. Our primary recruitment channel for volunteers is former residents and/or their families and through our involvement in the community. As shown in Figure P.1-4, our community ethnic diversity is very limited, and our workforce is reflective of the community we serve. However, our workforce is characterized by a signification amount of generational and communication style diversity. For example, our workforce ranges from 18 to 72 years old. Reflecting our value of Respect, we capitalize on both of those in creating a high-performance culture. As addressed in 5.2.a.(2), we actively participate in diversity training and programs annually. To ensure compliance with hiring practices, we maintain an active Affirmative Action Plan and we are an Equal Opportunity Employer. 5.1a.(3) Work Accomplishment: Fostering an environment of excellence, high performance and workforce engagement, we manage and organize the workforce to accomplish the work of our mission. Our focus on teamwork prevents the silos that sometimes develop in other organizations. Cross-training also enables us to have high performance and accomplish the work of our mission in the event of the absence of a staff member. We capitalize on our core competencies through approaches that ensure high staff retention, as addressed in 5.1a.(2) we are able to maintain the longevity of our workforce that supports high performance and the delivery of quality care through (a) Open Door program, as addressed in 1.2.b.(2), (b) SEP, and (c) Senior
WO
RK
DE
MA
ND
FIGURE 5.1-1 Workforce Capability and Capacity System
Monitor
and
Evaluate through PIP for Desired
Results
7 Workforce
Skills
Capacity
Capability
Future
Present
Mission • Vision • Values • Core Competencies
Workforce
Levels: Daily review staffing via
labor summary report and review
open position report.
Capacity: Daily review admissions and discharges to
determine the future staffing levels required
to accomplish the work.
1 2
Capability
and
Capacity
Planning
Management of Changing Needs:
Involvement of Recruiting, Implement Employee Training, Develop New Competencies, Develop Action Plans through
PIP/QAPI
Deploy
Strategies
5 6
Identify
Gaps: Review Daily Staffing Mix (Daily PPD), Review Daily
Staffing Skills Mix (Departmental)
4 Capability: Daily review of each departments workforce
composition ensuring all departments meet staffing levels required by
regulations (licenses and certification), acuity of current resident population
(skills required), and forecast any additional competencies required.
3
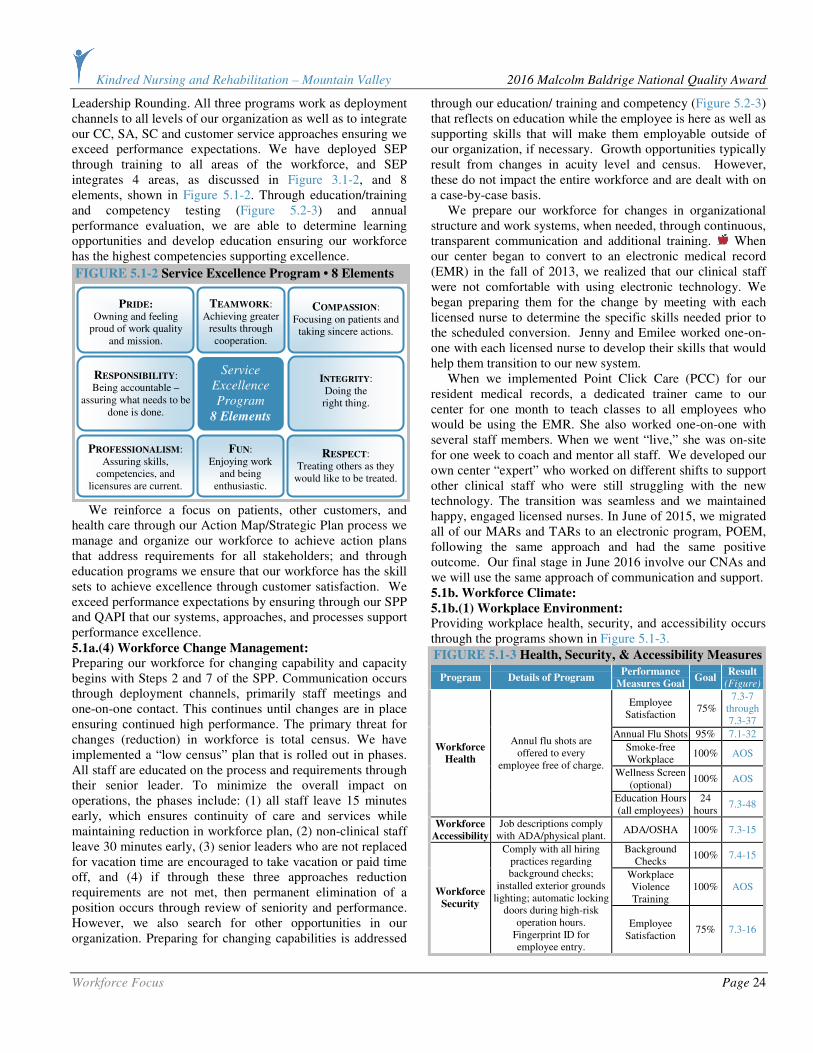
Kindred Nursing and Rehabilitation – Mountain Valley 2016 Malcolm Baldrige National Quality Award
Workforce Focus Page 24
Leadership Rounding. All three programs work as deployment channels to all levels of our organization as well as to integrate our CC, SA, SC and customer service approaches ensuring we exceed performance expectations. We have deployed SEP through training to all areas of the workforce, and SEP integrates 4 areas, as discussed in Figure 3.1-2, and 8 elements, shown in Figure 5.1-2. Through education/training and competency testing (Figure 5.2-3) and annual performance evaluation, we are able to determine learning opportunities and develop education ensuring our workforce has the highest competencies supporting excellence.
We reinforce a focus on patients, other customers, and health care through our Action Map/Strategic Plan process we manage and organize our workforce to achieve action plans that address requirements for all stakeholders; and through education programs we ensure that our workforce has the skill sets to achieve excellence through customer satisfaction. We exceed performance expectations by ensuring through our SPP and QAPI that our systems, approaches, and processes support performance excellence. 5.1a.(4) Workforce Change Management: Preparing our workforce for changing capability and capacity begins with Steps 2 and 7 of the SPP. Communication occurs through deployment channels, primarily staff meetings and one-on-one contact. This continues until changes are in place ensuring continued high performance. The primary threat for changes (reduction) in workforce is total census. We have implemented a “low census” plan that is rolled out in phases. All staff are educated on the process and requirements through their senior leader. To minimize the overall impact on operations, the phases include: (1) all staff leave 15 minutes early, which ensures continuity of care and services while maintaining reduction in workforce plan, (2) non-clinical staff leave 30 minutes early, (3) senior leaders who are not replaced for vacation time are encouraged to take vacation or paid time off, and (4) if through these three approaches reduction requirements are not met, then permanent elimination of a position occurs through review of seniority and performance. However, we also search for other opportunities in our organization. Preparing for changing capabilities is addressed
through our education/ training and competency (Figure 5.2-3) that reflects on education while the employee is here as well as supporting skills that will make them employable outside of our organization, if necessary. Growth opportunities typically result from changes in acuity level and census. However, these do not impact the entire workforce and are dealt with on a case-by-case basis. We prepare our workforce for changes in organizational structure and work systems, when needed, through continuous, transparent communication and additional training. When our center began to convert to an electronic medical record (EMR) in the fall of 2013, we realized that our clinical staff were not comfortable with using electronic technology. We began preparing them for the change by meeting with each licensed nurse to determine the specific skills needed prior to the scheduled conversion. Jenny and Emilee worked one-on-one with each licensed nurse to develop their skills that would help them transition to our new system. When we implemented Point Click Care (PCC) for our resident medical records, a dedicated trainer came to our center for one month to teach classes to all employees who would be using the EMR. She also worked one-on-one with several staff members. When we went “live,” she was on-site for one week to coach and mentor all staff. We developed our own center “expert” who worked on different shifts to support other clinical staff who were still struggling with the new technology. The transition was seamless and we maintained happy, engaged licensed nurses. In June of 2015, we migrated all of our MARs and TARs to an electronic program, POEM, following the same approach and had the same positive outcome. Our final stage in June 2016 involve our CNAs and we will use the same approach of communication and support. 5.1b. Workforce Climate:
5.1b.(1) Workplace Environment: Providing workplace health, security, and accessibility occurs through the programs shown in Figure 5.1-3.
FIGURE 5.1-3 Health, Security, & Accessibility Measures
Program Details of Program Performance
Measures Goal Goal
Result (Figure)
Employee Satisfaction
75% 7.3-7
through 7.3-37
Annual Flu Shots 95% 7.1-32
Smoke-free Workplace
100% AOS
Wellness Screen (optional)
100% AOS
Workforce
Health
Annul flu shots are offered to every
employee free of charge.
Education Hours (all employees)
24 hours
7.3-48
Workforce
Accessibility
Job descriptions comply with ADA/physical plant.
ADA/OSHA 100% 7.3-15
Background Checks
100% 7.4-15
Workplace Violence Training
100% AOS Workforce
Security
Comply with all hiring practices regarding background checks;
installed exterior grounds lighting; automatic locking
doors during high-risk operation hours.
Fingerprint ID for employee entry.
Employee Satisfaction
75% 7.3-16
PROFESSIONALISM: Assuring skills,
competencies, and licensures are current.
PRIDE:
Owning and feeling proud of work quality
and mission.
RESPECT: Treating others as they
would like to be treated.
TEAMWORK: Achieving greater
results through cooperation.
COMPASSION: Focusing on patients and
taking sincere actions.
RESPONSIBILITY: Being accountable –
assuring what needs to be done is done.
INTEGRITY: Doing the right thing.
FUN: Enjoying work
and being enthusiastic.
Service
Excellence
Program
8 Elements
FIGURE 5.1-2 Service Excellence Program • 8 Elements
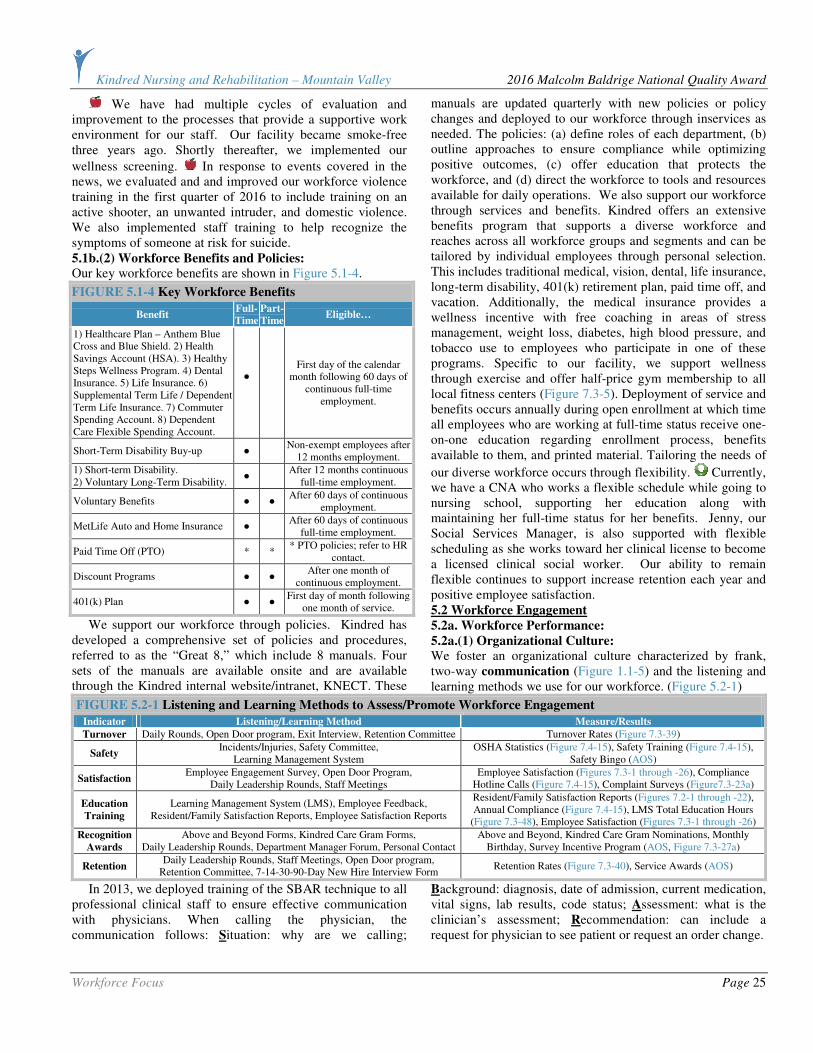
Kindred Nursing and Rehabilitation – Mountain Valley 2016 Malcolm Baldrige National Quality Award
Workforce Focus Page 25
We have had multiple cycles of evaluation and improvement to the processes that provide a supportive work environment for our staff. Our facility became smoke-free three years ago. Shortly thereafter, we implemented our
wellness screening. In response to events covered in the news, we evaluated and and improved our workforce violence training in the first quarter of 2016 to include training on an active shooter, an unwanted intruder, and domestic violence. We also implemented staff training to help recognize the symptoms of someone at risk for suicide. 5.1b.(2) Workforce Benefits and Policies: Our key workforce benefits are shown in Figure 5.1-4.
FIGURE 5.1-4 Key Workforce Benefits
Benefit Full-
Time
Part-
Time Eligible…
1) Healthcare Plan – Anthem Blue Cross and Blue Shield. 2) Health Savings Account (HSA). 3) Healthy Steps Wellness Program. 4) Dental Insurance. 5) Life Insurance. 6) Supplemental Term Life / Dependent Term Life Insurance. 7) Commuter Spending Account. 8) Dependent Care Flexible Spending Account.
●
First day of the calendar month following 60 days of
continuous full-time employment.
Short-Term Disability Buy-up ● Non-exempt employees after
12 months employment.
1) Short-term Disability. 2) Voluntary Long-Term Disability.
● After 12 months continuous
full-time employment.
Voluntary Benefits ● ● After 60 days of continuous
employment.
MetLife Auto and Home Insurance ● After 60 days of continuous
full-time employment.
Paid Time Off (PTO) * * * PTO policies; refer to HR
contact.
Discount Programs ● ● After one month of
continuous employment.
401(k) Plan ● ● First day of month following
one month of service.
We support our workforce through policies. Kindred has developed a comprehensive set of policies and procedures, referred to as the “Great 8,” which include 8 manuals. Four sets of the manuals are available onsite and are available through the Kindred internal website/intranet, KNECT. These
manuals are updated quarterly with new policies or policy changes and deployed to our workforce through inservices as needed. The policies: (a) define roles of each department, (b) outline approaches to ensure compliance while optimizing positive outcomes, (c) offer education that protects the workforce, and (d) direct the workforce to tools and resources available for daily operations. We also support our workforce through services and benefits. Kindred offers an extensive benefits program that supports a diverse workforce and reaches across all workforce groups and segments and can be tailored by individual employees through personal selection. This includes traditional medical, vision, dental, life insurance, long-term disability, 401(k) retirement plan, paid time off, and vacation. Additionally, the medical insurance provides a wellness incentive with free coaching in areas of stress management, weight loss, diabetes, high blood pressure, and tobacco use to employees who participate in one of these programs. Specific to our facility, we support wellness through exercise and offer half-price gym membership to all local fitness centers (Figure 7.3-5). Deployment of service and benefits occurs annually during open enrollment at which time all employees who are working at full-time status receive one-on-one education regarding enrollment process, benefits available to them, and printed material. Tailoring the needs of
our diverse workforce occurs through flexibility. Currently, we have a CNA who works a flexible schedule while going to nursing school, supporting her education along with maintaining her full-time status for her benefits. Jenny, our Social Services Manager, is also supported with flexible scheduling as she works toward her clinical license to become a licensed clinical social worker. Our ability to remain flexible continues to support increase retention each year and positive employee satisfaction. 5.2 Workforce Engagement
5.2a. Workforce Performance:
5.2a.(1) Organizational Culture: We foster an organizational culture characterized by frank, two-way communication (Figure 1.1-5) and the listening and learning methods we use for our workforce. (Figure 5.2-1)
FIGURE 5.2-1 Listening and Learning Methods to Assess/Promote Workforce Engagement
Indicator Listening/Learning Method Measure/Results
Turnover Daily Rounds, Open Door program, Exit Interview, Retention Committee Turnover Rates (Figure 7.3-39)
Safety Incidents/Injuries, Safety Committee,
Learning Management System OSHA Statistics (Figure 7.4-15), Safety Training (Figure 7.4-15),
Safety Bingo (AOS)
Satisfaction Employee Engagement Survey, Open Door Program,
Daily Leadership Rounds, Staff Meetings Employee Satisfaction (Figures 7.3-1 through -26), Compliance
Hotline Calls (Figure 7.4-15), Complaint Surveys (Figure7.3-23a)
Education
Training
Learning Management System (LMS), Employee Feedback, Resident/Family Satisfaction Reports, Employee Satisfaction Reports
Resident/Family Satisfaction Reports (Figures 7.2-1 through -22), Annual Compliance (Figure 7.4-15), LMS Total Education Hours
(Figure 7.3-48), Employee Satisfaction (Figures 7.3-1 through -26)
Recognition
Awards
Above and Beyond Forms, Kindred Care Gram Forms, Daily Leadership Rounds, Department Manager Forum, Personal Contact
Above and Beyond, Kindred Care Gram Nominations, Monthly Birthday, Survey Incentive Program (AOS, Figure 7.3-27a)
Retention Daily Leadership Rounds, Staff Meetings, Open Door program,
Retention Committee, 7-14-30-90-Day New Hire Interview Form Retention Rates (Figure 7.3-40), Service Awards (AOS)
In 2013, we deployed training of the SBAR technique to all professional clinical staff to ensure effective communication with physicians. When calling the physician, the communication follows: Situation: why are we calling;
Background: diagnosis, date of admission, current medication, vital signs, lab results, code status; Assessment: what is the clinician’s assessment; Recommendation: can include a request for physician to see patient or request an order change.
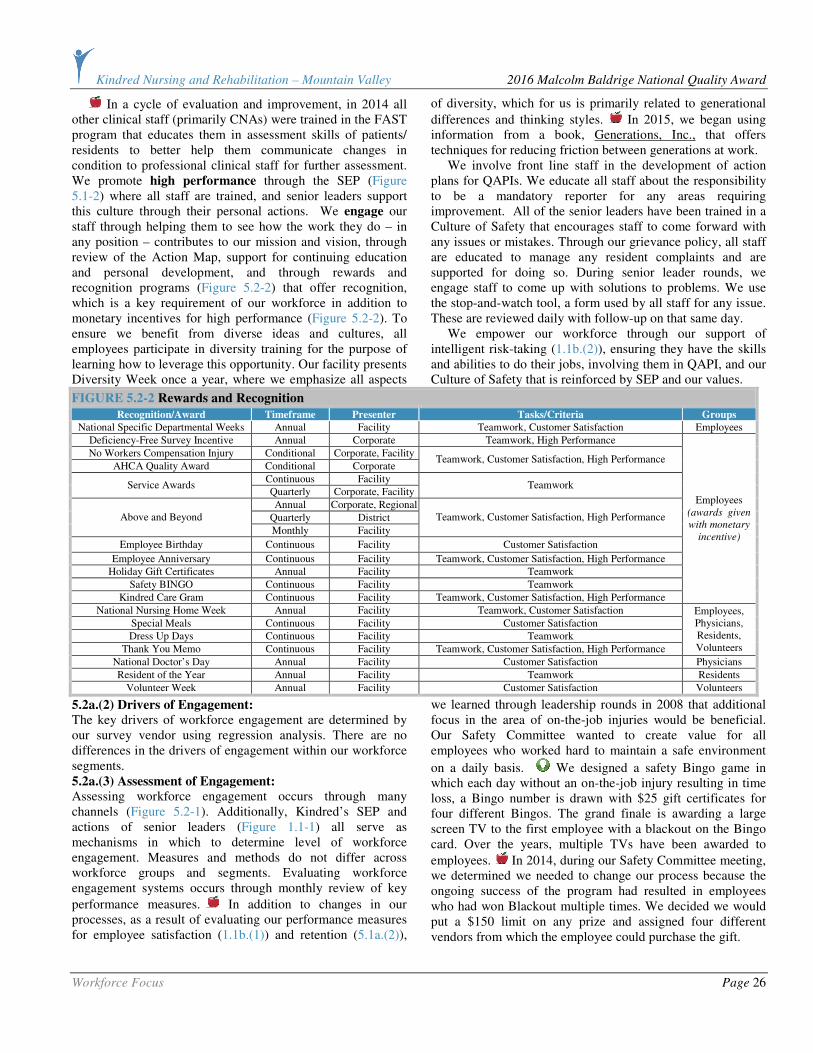
Kindred Nursing and Rehabilitation – Mountain Valley 2016 Malcolm Baldrige National Quality Award
Workforce Focus Page 26
In a cycle of evaluation and improvement, in 2014 all other clinical staff (primarily CNAs) were trained in the FAST program that educates them in assessment skills of patients/ residents to better help them communicate changes in condition to professional clinical staff for further assessment. We promote high performance through the SEP (Figure 5.1-2) where all staff are trained, and senior leaders support this culture through their personal actions. We engage our staff through helping them to see how the work they do – in any position – contributes to our mission and vision, through review of the Action Map, support for continuing education and personal development, and through rewards and recognition programs (Figure 5.2-2) that offer recognition, which is a key requirement of our workforce in addition to monetary incentives for high performance (Figure 5.2-2). To ensure we benefit from diverse ideas and cultures, all employees participate in diversity training for the purpose of learning how to leverage this opportunity. Our facility presents Diversity Week once a year, where we emphasize all aspects
of diversity, which for us is primarily related to generational
differences and thinking styles. In 2015, we began using information from a book, Generations, Inc., that offers techniques for reducing friction between generations at work. We involve front line staff in the development of action plans for QAPIs. We educate all staff about the responsibility to be a mandatory reporter for any areas requiring improvement. All of the senior leaders have been trained in a Culture of Safety that encourages staff to come forward with any issues or mistakes. Through our grievance policy, all staff are educated to manage any resident complaints and are supported for doing so. During senior leader rounds, we engage staff to come up with solutions to problems. We use the stop-and-watch tool, a form used by all staff for any issue. These are reviewed daily with follow-up on that same day. We empower our workforce through our support of intelligent risk-taking (1.1b.(2)), ensuring they have the skills and abilities to do their jobs, involving them in QAPI, and our Culture of Safety that is reinforced by SEP and our values.
FIGURE 5.2-2 Rewards and Recognition
Recognition/Award Timeframe Presenter Tasks/Criteria Groups
National Specific Departmental Weeks Annual Facility Teamwork, Customer Satisfaction Employees
Deficiency-Free Survey Incentive Annual Corporate Teamwork, High Performance
No Workers Compensation Injury Conditional Corporate, Facility
AHCA Quality Award Conditional Corporate Teamwork, Customer Satisfaction, High Performance
Continuous Facility Service Awards
Quarterly Corporate, Facility Teamwork
Annual Corporate, Regional
Quarterly District Above and Beyond
Monthly Facility
Teamwork, Customer Satisfaction, High Performance
Employee Birthday Continuous Facility Customer Satisfaction
Employee Anniversary Continuous Facility Teamwork, Customer Satisfaction, High Performance
Holiday Gift Certificates Annual Facility Teamwork
Safety BINGO Continuous Facility Teamwork
Kindred Care Gram Continuous Facility Teamwork, Customer Satisfaction, High Performance
Employees (awards given
with monetary
incentive)
National Nursing Home Week Annual Facility Teamwork, Customer Satisfaction
Special Meals Continuous Facility Customer Satisfaction
Dress Up Days Continuous Facility Teamwork
Thank You Memo Continuous Facility Teamwork, Customer Satisfaction, High Performance
Employees, Physicians, Residents, Volunteers
National Doctor’s Day Annual Facility Customer Satisfaction Physicians
Resident of the Year Annual Facility Teamwork Residents
Volunteer Week Annual Facility Customer Satisfaction Volunteers
5.2a.(2) Drivers of Engagement: The key drivers of workforce engagement are determined by our survey vendor using regression analysis. There are no differences in the drivers of engagement within our workforce segments. 5.2a.(3) Assessment of Engagement: Assessing workforce engagement occurs through many channels (Figure 5.2-1). Additionally, Kindred’s SEP and actions of senior leaders (Figure 1.1-1) all serve as mechanisms in which to determine level of workforce engagement. Measures and methods do not differ across workforce groups and segments. Evaluating workforce engagement systems occurs through monthly review of key
performance measures. In addition to changes in our processes, as a result of evaluating our performance measures for employee satisfaction (1.1b.(1)) and retention (5.1a.(2)),
we learned through leadership rounds in 2008 that additional focus in the area of on-the-job injuries would be beneficial. Our Safety Committee wanted to create value for all employees who worked hard to maintain a safe environment
on a daily basis. We designed a safety Bingo game in which each day without an on-the-job injury resulting in time loss, a Bingo number is drawn with $25 gift certificates for four different Bingos. The grand finale is awarding a large screen TV to the first employee with a blackout on the Bingo card. Over the years, multiple TVs have been awarded to
employees. In 2014, during our Safety Committee meeting, we determined we needed to change our process because the ongoing success of the program had resulted in employees who had won Blackout multiple times. We decided we would put a $150 limit on any prize and assigned four different vendors from which the employee could purchase the gift.
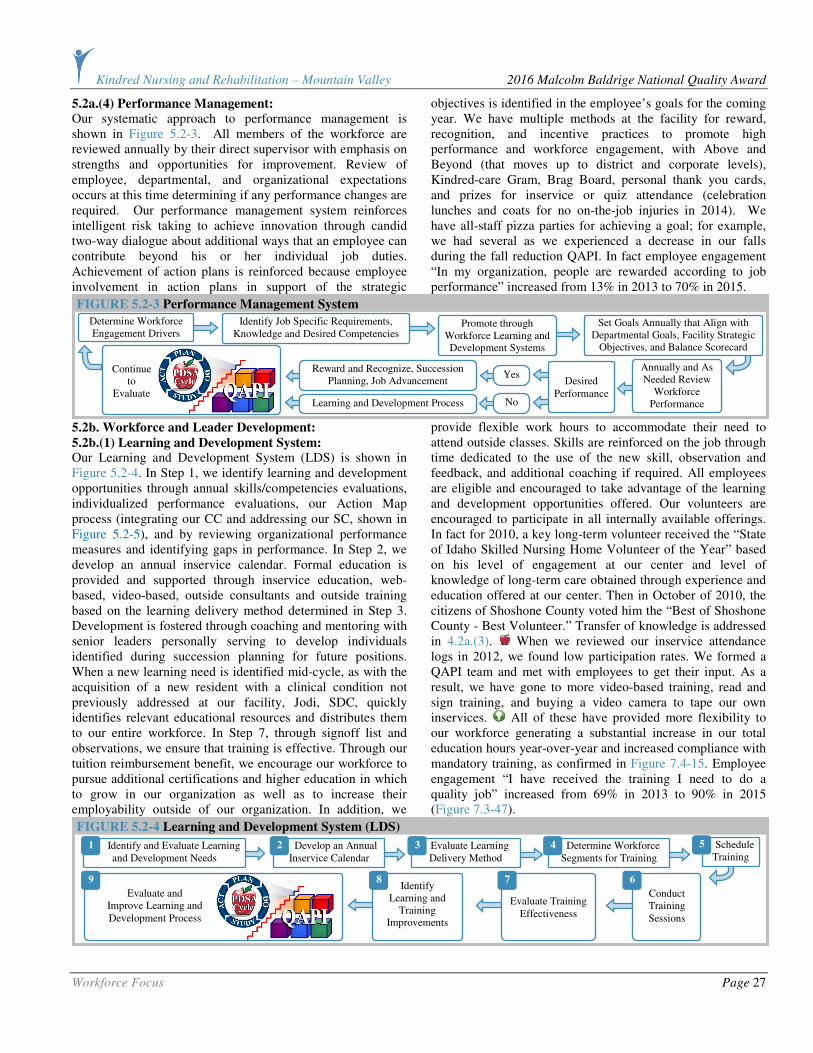
Kindred Nursing and Rehabilitation – Mountain Valley 2016 Malcolm Baldrige National Quality Award
Workforce Focus Page 27
5.2a.(4) Performance Management: Our systematic approach to performance management is shown in Figure 5.2-3. All members of the workforce are reviewed annually by their direct supervisor with emphasis on strengths and opportunities for improvement. Review of employee, departmental, and organizational expectations occurs at this time determining if any performance changes are required. Our performance management system reinforces intelligent risk taking to achieve innovation through candid two-way dialogue about additional ways that an employee can contribute beyond his or her individual job duties. Achievement of action plans is reinforced because employee involvement in action plans in support of the strategic
objectives is identified in the employee’s goals for the coming year. We have multiple methods at the facility for reward, recognition, and incentive practices to promote high performance and workforce engagement, with Above and Beyond (that moves up to district and corporate levels), Kindred-care Gram, Brag Board, personal thank you cards, and prizes for inservice or quiz attendance (celebration lunches and coats for no on-the-job injuries in 2014). We have all-staff pizza parties for achieving a goal; for example, we had several as we experienced a decrease in our falls during the fall reduction QAPI. In fact employee engagement “In my organization, people are rewarded according to job performance” increased from 13% in 2013 to 70% in 2015.
5.2b. Workforce and Leader Development:
5.2b.(1) Learning and Development System: Our Learning and Development System (LDS) is shown in Figure 5.2-4. In Step 1, we identify learning and development opportunities through annual skills/competencies evaluations, individualized performance evaluations, our Action Map process (integrating our CC and addressing our SC, shown in Figure 5.2-5), and by reviewing organizational performance measures and identifying gaps in performance. In Step 2, we develop an annual inservice calendar. Formal education is provided and supported through inservice education, web-based, video-based, outside consultants and outside training based on the learning delivery method determined in Step 3. Development is fostered through coaching and mentoring with senior leaders personally serving to develop individuals identified during succession planning for future positions. When a new learning need is identified mid-cycle, as with the acquisition of a new resident with a clinical condition not previously addressed at our facility, Jodi, SDC, quickly identifies relevant educational resources and distributes them to our entire workforce. In Step 7, through signoff list and observations, we ensure that training is effective. Through our tuition reimbursement benefit, we encourage our workforce to pursue additional certifications and higher education in which to grow in our organization as well as to increase their employability outside of our organization. In addition, we
provide flexible work hours to accommodate their need to attend outside classes. Skills are reinforced on the job through time dedicated to the use of the new skill, observation and feedback, and additional coaching if required. All employees are eligible and encouraged to take advantage of the learning and development opportunities offered. Our volunteers are encouraged to participate in all internally available offerings. In fact for 2010, a key long-term volunteer received the “State of Idaho Skilled Nursing Home Volunteer of the Year” based on his level of engagement at our center and level of knowledge of long-term care obtained through experience and education offered at our center. Then in October of 2010, the citizens of Shoshone County voted him the “Best of Shoshone County - Best Volunteer.” Transfer of knowledge is addressed in 4.2a.(3). When we reviewed our inservice attendance logs in 2012, we found low participation rates. We formed a QAPI team and met with employees to get their input. As a result, we have gone to more video-based training, read and sign training, and buying a video camera to tape our own inservices. All of these have provided more flexibility to our workforce generating a substantial increase in our total education hours year-over-year and increased compliance with mandatory training, as confirmed in Figure 7.4-15. Employee engagement “I have received the training I need to do a quality job” increased from 69% in 2013 to 90% in 2015 (Figure 7.3-47).
Evaluate and
Improve Learning and Development Process
FIGURE 5.2-4 Learning and Development System (LDS)
Identify and Evaluate Learning and Development Needs
Develop an Annual Inservice Calendar
Evaluate Learning Delivery Method
Determine Workforce Segments for Training
Schedule Training
Conduct Training Sessions
Evaluate Training Effectiveness
Identify Learning and
Training Improvements
1 2 3 4 5
6 7 8 9
FIGURE 5.2-3 Performance Management System
Determine Workforce Engagement Drivers
Identify Job Specific Requirements, Knowledge and Desired Competencies
Promote through Workforce Learning and Development Systems
Set Goals Annually that Align with Departmental Goals, Facility Strategic
Objectives, and Balance Scorecard
Annually and As Needed Review
Workforce Performance
Desired
Performance
Yes
No
Reward and Recognize, Succession Planning, Job Advancement
Learning and Development Process
Continue
to Evaluate
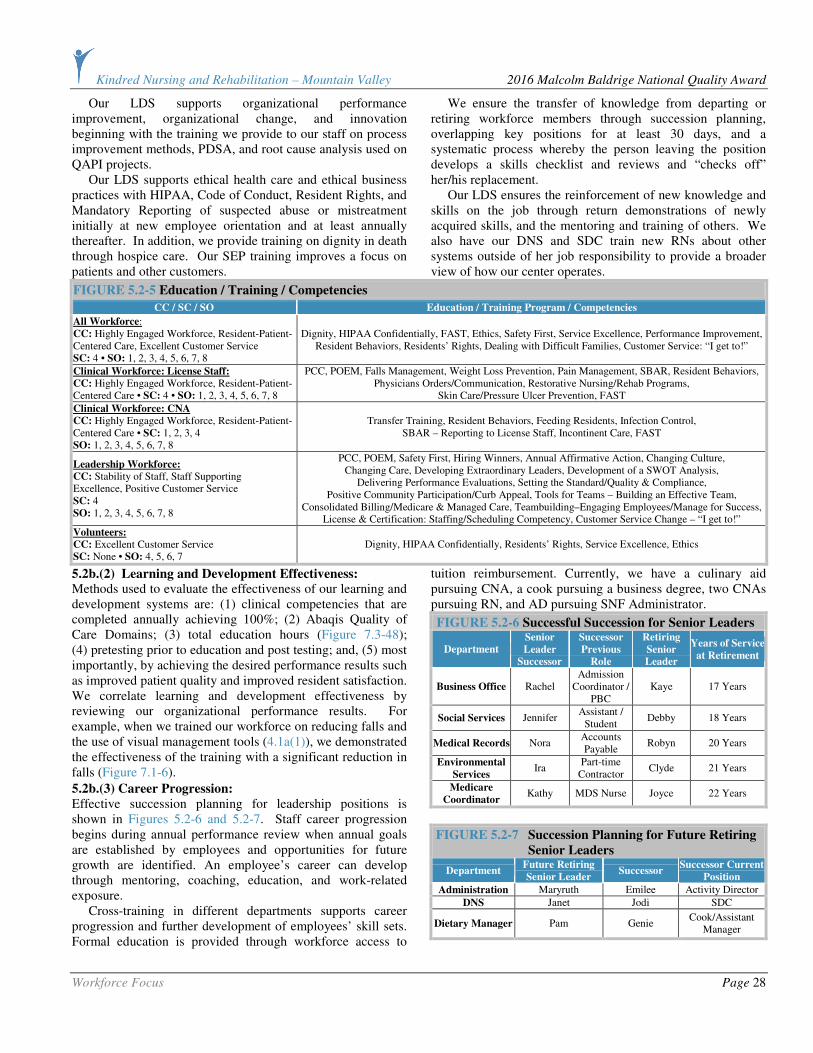
Kindred Nursing and Rehabilitation – Mountain Valley 2016 Malcolm Baldrige National Quality Award
Workforce Focus Page 28
Our LDS supports organizational performance improvement, organizational change, and innovation beginning with the training we provide to our staff on process improvement methods, PDSA, and root cause analysis used on QAPI projects. Our LDS supports ethical health care and ethical business practices with HIPAA, Code of Conduct, Resident Rights, and Mandatory Reporting of suspected abuse or mistreatment initially at new employee orientation and at least annually thereafter. In addition, we provide training on dignity in death through hospice care. Our SEP training improves a focus on patients and other customers.
We ensure the transfer of knowledge from departing or retiring workforce members through succession planning, overlapping key positions for at least 30 days, and a systematic process whereby the person leaving the position develops a skills checklist and reviews and “checks off” her/his replacement. Our LDS ensures the reinforcement of new knowledge and skills on the job through return demonstrations of newly acquired skills, and the mentoring and training of others. We also have our DNS and SDC train new RNs about other systems outside of her job responsibility to provide a broader view of how our center operates.
FIGURE 5.2-5 Education / Training / Competencies
CC / SC / SO Education / Training Program / Competencies
All Workforce: CC: Highly Engaged Workforce, Resident-Patient-Centered Care, Excellent Customer Service SC: 4 • SO: 1, 2, 3, 4, 5, 6, 7, 8
Dignity, HIPAA Confidentially, FAST, Ethics, Safety First, Service Excellence, Performance Improvement, Resident Behaviors, Residents’ Rights, Dealing with Difficult Families, Customer Service: “I get to!”
Clinical Workforce: License Staff:
CC: Highly Engaged Workforce, Resident-Patient-Centered Care • SC: 4 • SO: 1, 2, 3, 4, 5, 6, 7, 8
PCC, POEM, Falls Management, Weight Loss Prevention, Pain Management, SBAR, Resident Behaviors, Physicians Orders/Communication, Restorative Nursing/Rehab Programs,
Skin Care/Pressure Ulcer Prevention, FAST
Clinical Workforce: CNA
CC: Highly Engaged Workforce, Resident-Patient-Centered Care • SC: 1, 2, 3, 4 SO: 1, 2, 3, 4, 5, 6, 7, 8
Transfer Training, Resident Behaviors, Feeding Residents, Infection Control, SBAR – Reporting to License Staff, Incontinent Care, FAST
Leadership Workforce:
CC: Stability of Staff, Staff Supporting Excellence, Positive Customer Service SC: 4 SO: 1, 2, 3, 4, 5, 6, 7, 8
PCC, POEM, Safety First, Hiring Winners, Annual Affirmative Action, Changing Culture, Changing Care, Developing Extraordinary Leaders, Development of a SWOT Analysis,
Delivering Performance Evaluations, Setting the Standard/Quality & Compliance, Positive Community Participation/Curb Appeal, Tools for Teams – Building an Effective Team,
Consolidated Billing/Medicare & Managed Care, Teambuilding–Engaging Employees/Manage for Success, License & Certification: Staffing/Scheduling Competency, Customer Service Change – “I get to!”
Volunteers:
CC: Excellent Customer Service SC: None • SO: 4, 5, 6, 7
Dignity, HIPAA Confidentially, Residents’ Rights, Service Excellence, Ethics
5.2b.(2) Learning and Development Effectiveness: Methods used to evaluate the effectiveness of our learning and development systems are: (1) clinical competencies that are completed annually achieving 100%; (2) Abaqis Quality of Care Domains; (3) total education hours (Figure 7.3-48); (4) pretesting prior to education and post testing; and, (5) most importantly, by achieving the desired performance results such as improved patient quality and improved resident satisfaction. We correlate learning and development effectiveness by reviewing our organizational performance results. For example, when we trained our workforce on reducing falls and the use of visual management tools (4.1a(1)), we demonstrated the effectiveness of the training with a significant reduction in falls (Figure 7.1-6).
5.2b.(3) Career Progression: Effective succession planning for leadership positions is shown in Figures 5.2-6 and 5.2-7. Staff career progression begins during annual performance review when annual goals are established by employees and opportunities for future growth are identified. An employee’s career can develop through mentoring, coaching, education, and work-related exposure. Cross-training in different departments supports career progression and further development of employees’ skill sets. Formal education is provided through workforce access to
tuition reimbursement. Currently, we have a culinary aid pursuing CNA, a cook pursuing a business degree, two CNAs pursuing RN, and AD pursuing SNF Administrator.
FIGURE 5.2-6 Successful Succession for Senior Leaders
Department
Senior
Leader
Successor
Successor
Previous
Role
Retiring
Senior
Leader
Years of Service
at Retirement
Business Office Rachel Admission
Coordinator / PBC
Kaye 17 Years
Social Services Jennifer Assistant /
Student Debby 18 Years
Medical Records Nora Accounts Payable
Robyn 20 Years
Environmental
Services Ira
Part-time Contractor
Clyde 21 Years
Medicare
Coordinator Kathy MDS Nurse Joyce 22 Years
FIGURE 5.2-7 Succession Planning for Future Retiring
Senior Leaders
Department Future Retiring
Senior Leader Successor
Successor Current
Position
Administration Maryruth Emilee Activity Director
DNS Janet Jodi SDC
Dietary Manager Pam Genie Cook/Assistant
Manager

Kindred Nursing and Rehabilitation – Mountain Valley 2016 Malcolm Baldrige National Quality Award
Operations Focus Page 29
CATEGORY 6: OPERATIONS FOCUS
6.1 Work Processes
6.1a. Service and Process Design:
6.1a.(1) Service and Process Requirements:
Determining key work process requirements occurs during SPP. We review (1) patient and other customer requirements (Figure P.1-8); (2) all information received through
VOC (3.1a.(1)); and, (3) Action Map / Strategic Plan. Our key work processes and their requirements are shown in Figure 6.1-1. Our key work processes support our ability to achieve excellence in both quality care and customer service, and support achievement of our strategic objectives.
FIGURE 6.1-1 Key Work Processes and Key Support Processes
Work Process Requirements Performance Measures (SO) Results (Figure)
Occupancy Rates 7.5-11
5-Star Rating 7.4-9 through -13 Market Health Care Services
Provide education to referral sources regarding skills competency of staff and
rehabilitation programming. Jean Schoonover Quality Award 7.4-6
M2 Mix Growth 7.5-4
Private Pay Census 7.5-10 Manage Patient
Referral
Ensure promptness to referral source to ensure that most referrals convert to
admissions. Occupancy Rates (Improve Occupancy Rates) 7.5-11
*Staffing Levels (Maintain Strong Clinical Staffing) 7.4-11
5-Star Rating Staffing 7.4-12
*Total Education Hours 7.3-48
QI/QM UTIs (Reduce the percentage of UTIs in (L) residents) 7.1-13
Deliver Quality Care
Provide quality care that ranks in the top 10% of the industry.
Standard of Care Fall Percent 7.1-31
Deliver Customer Service
Provide customer service that ranks in the top 10% of the nation.
Resident/Family Satisfaction, Overall Satisfaction (Maintain Residents/ Families’ “Overall” Satisfaction)
7.2-1, 7.2-12
Family Satisfaction AOS Discharge Patient
Provide safe discharge planning considering continued patient
engagement. Patient Satisfaction 7.2-25
QI/QM Long-Term Care Residents 7.1-1 through -17
Resident Satisfaction 7.2-1 through -11 Convert Long-Term Resident
Provide seamless transition to long-term care addressing all requirements of
resident and family. Family Satisfaction 7.2-12 through -22
Recommend us to Others 7.2-26, 7.2-27
*Involvement in Community Events 7.4-17, 7.4-19
Continued Customer
Engagement
Continue participation with discharged patient to ensure positive experience
and engagement with our Center. Volunteer Satisfaction 7.1-44, 7.1-45
Support Process Requirements (Relate to CC) Performance Measures (SO) Results (Figure)
*Evacuation Drills 7.1-43
Workplace Health 7.3-16 Environmental Management
Ensure our environment is maintained to the highest standard ensuring safety for all stakeholders while providing education to all levels of operations addressing safety. Workplace Safety (OSHA Statistics) 7.4-15
Medicare Part A Revenue 7.5-6
AR Days 7.1-39
EBITDARM Margin 7.5-9
Medicaid Revenue 7.5-8
Financial Management
Provide accurate billing in a timely manner.
Month-end Triple for coding review 7.1-38
*Staffing Levels 7.3-2 through -6
Retention (Improve Employee Retention Rate) 7.3-40
Turnover (Maintain Strong Clinical Staffing), Key Nursing Turnover 7.3-38
*Awards and Honors P.2-5
Workforce Management
Ensure that we retain current quality staffing while addressing the
requirements of our workforce.
Employee Satisfaction (Improve Employee “Engagement Index) 7.3-29
QI/QM 7.1-1 through -29
CMS 5-Star Rating 7.4-9 through -13
Competencies 7.3-1
Competency Management
Ensure that all staff demonstrates skills that maintain quality outcomes in the
top 10% of the nation. Total Education Hours 7.3-48
* Leading Indicator/In-Process Measure
6.1a.(2) Design Concepts: Work processes are designed to meet their key requirements and validated by the related performance measures as shown in Figure 6.1-1. Our systematic approach to designing our health care services and work processes are shown in Figure 6.1-2. We incorporate new technology, organizational knowledge, evidence-based medicine, health care service
excellence, patient and other customer value in Step 3 of the work process design. We evaluate the potential need for agility in these processes and health care services by assessing the variation in our patient population, the rapidity of changes in our industry, and the need to provide variety (not variation) in choices for patients and other customers.

Kindred Nursing and Rehabilitation – Mountain Valley 2016 Malcolm Baldrige National Quality Award
Operations Focus Page 30
6.1b. Process Management:
6.1b.(1) Process Implementation: Implementing and managing our work processes to ensure that they meet design requirements occurs through QAPI and through the SPP at which time barriers that would prevent implementtation are identified, assigning steps to the process of managing our work processes are developed, and monitoring tools defined. The steps demonstrated in 4.1b ensure that, through the conduct of small-scale tests, design requirements are met and tested to ensure desired outcomes can be achieved. We communicate to our workforce, partners, and suppliers any changes to our processes (Figure 1.1-5). Key suppliers contribute to implementation and managing of key work processes through areas addressed in Figure P.1-9 in terms of innovation. Through Key Customer Access Mechanisms, we monitor and manage implementation of work processes to determine if design requirements are met. This information is reviewed at the daily Stand-Up Meeting to ensure input from our customers is addressed with all requirements being met, as identified in Figure P.1-8. Through daily, weekly, monthly review of our Action Map performance projections, we ensure that our action plans are effective in the implementation of our work processes. Key performance measures (both in-process and outcome measures) are identified in Figure 6.1-1 and clearly relate to the quality of outcomes and the performance of our health care services. If new processes are needed in the interim between the annual SPP, we would identify them during daily Stand-Up Meetings or monthly QAPI meetings. 6.1b.(2) Patient Expectations and Preferences: We address and consider each patient’s expectations beginning with their first phone call or visit and then upon admission. Residents/patients are involved in every aspect of their care while receiving our health care services: (1) admission process through family education; (2) interview within 24 hours by all disciplines and Senior Leadership Rounding to determine their level of desired participation in decisions and preferences; and, (3) initial and quarterly Patient Care Conferences. This information is reviewed, in addition to resident/family satisfaction surveys, to develop a resident-centered plan of care as well as integrated in our PIP to ensure we are meeting all the requirements of our patients and other customers. We continue to understand their expectations and preferences through the Senior Leadership Rounding and staff demonstrating SEP. The primary communication tools used to
set realistic patient expectations are our initial and quarterly Patient Care Conferences. During this process, a member of each discipline meets with the family and resident to design a resident-centered care program with approaches and desired outcomes. Before a treatment is administered or new medications are given, the patient is informed of the treatment plan and expected outcomes. Each patient is encouraged to be involved in the daily decision of their care. The staff promotes autonomy within each patient and
encourages realistic goal setting. 6.1b.(3) Support Processes: We determine key support processes by identifying the most important processes needed by those who perform in the key work processes to do their jobs. Our key support processes and their requirements are shown in Figure 6.1-1. Similar to the approach we take in our day-to-day operations to ensure that our key work processes meet requirements, we assess the effectiveness of our key support processes in discussions at daily Stand-Up Meeting, by observation, and by soliciting feedback from staff, residents, and other key customers. 6.1b.(4) Service and Process Improvement: Through our culture of performance excellence and the implementation of SEP and QAPI, we have continual process improvement. QAPI is the responsibility of every employee in terms of problem solving and reporting issues to their supervisor that may have a negative impact on work processes. Our Performance Improvement Process (PIP) is shown in Figure 6.1-3. Through our PIP, we are able to develop a systematic approach to all processes reviewed during the SPP and developed through our Action Map, incorporating results in our Action Map/Strategic Plan as well as in our key work
processes. In December of 2013, a facility audit identified that the percent of our “A” ADLs (Activities for Daily Living) for year end was much higher than desired. This could indicate that our CNAs required additional training on accurate coding of the activities of daily living to ensure that they are capturing the burden of patient care delivered to our patients each day. Kathy, CCM, and Jodi, SDC, copied specific examples to use as education during an inservice at which time we used members of the workforce to act as patients with our CNAs providing assistance, then coding for the level of care they provided for ADLs. Each CNA received the “Coding Betty” handbook, which gives specific examples of coding for several different levels of care provided at bedside. Kathy continues to audit, with this information
FIGURE 6.1-2 Work Process Design
Identify Key Stakeholder Requirements, Strategic
Challenges, Strategic Opportunities
Identify Kindred Policies and Procedures, Regulatory
Requirements, Budgetary Challenges
Research Industry Best
Practices
Identify Resources Required, Internal or External
Determine Equipment and Supply
Requirements
Update and/or Create Policies and Procedures
Educate and
Train Workforce
Deploy New
Process to Workforce
1 2 3 4
5 6 7 8 9

Kindred Nursing and Rehabilitation – Mountain Valley 2016 Malcolm Baldrige National Quality Award
Operations Focus Page 31
reviewed weekly at our Medicare meeting. We have decreased our percent of “A” ADL from 60% year end 2013 to 37.2% year end 2015, which represents a significant improvement. Additionally, review of inaccurate coding information during our PIP identified the possible negative impact on our QI/QM “increase ADL’s help,” which the PI Committee identified as SO 2 during strategic planning.
When we detect an adverse trend or receive negative feedback, we may address it with the PDSA cycle or form a PIP, Figure 6.1-3, if a cross-functional team effort is required. The learnings from these efforts enhance our core competencies, and reinforcing the consistent execution of processes through standard work reduces
variability.
6.1c. Innovation Management: We manage for innovation using the Innovation Management System shown in Figure 6.1-4. We determine what intelligent risks are worth pursuing as part of our SPP (2.1a(2)) when we evaluate the potential benefits against the costs of implementation. We also assess what are the potential “costs” for not pursuing the strategic opportunity. Some innovative ideas obviously occur outside of the SPP cycle, and we ask staff through various communication methods (Figure 1.1-5) for their ideas, stressing that all ideas will be considered.
In Step 2, when a proposed innovation is determined to be worth pursuing, we make the necessary financial and other resources available. At times, this might require a request for additional budget or equipment. If other opportunities present themselves, we ask whether we have the resources (financial and other) to pursue those. If not, we conduct an analysis of the opportunities and may reprioritize them, including suspending some that may be in progress. The reprioritization starts with identifying those opportunities with the greatest alignment with our Mission, Vision, and Core Values. .
6.2 Operational Effectiveness
6.2a. Process Efficiency and Effectiveness: KNRMV controls the overall costs of our operations beginning with the budget process but continue this focus
throughout the year as we look for opportunities for cost savings or cost avoidance. We incorporate cycle time, productivity, and other efficiency and effectiveness measures
in the design and improvement of our work processes by challenging ourselves to identify ways that a process might be done faster, with fewer people, and with less supplies. These
are also questions we ask PIPs to consider.
By maintaining staffing at optimal levels, we reduce
re-work by providing quality of care first. We prevent rework and errors, including medical errors, through our adherence to standardized work. We also conduct monthly medication
reviews. In addition, this minimizes the costs of inspections and tests. Performance audits enhance capability and capacity of staff performance. We minimize the costs of inspections,
tests, and process or performance audits by maintaining a state of readiness. If we are always operating in a manner that meets or exceeds regulatory requirements, we prevent
incurring the costs of correcting a deficiency. By managing
QAPI Committee assigns QAPI Workgroup
to follow-up on the opportunity and who meets as frequently as
needed between monthly QAPI Committee meetings.
QAPI Committee collects and evaluates data from a variety of sources; e.g.,
QI/QMs, Customer Satisfaction, QAPI Tools, etc.
QAPI Committee meets monthly
to identify opportunities for improvement based
on evaluation of the data.
FIGURE 6.1-3 Performance Improvement Process (PIP)
1) QAPI Committee evaluates ongoing effectiveness of QAPI Plan. 2) QAPI Committee sets timetable for QAPI Plan follow-up, if necessary. 3) QAPI Committee submits QAPI Plan to District Director of Operations (DO). 4) DO monitors ongoing effectiveness of QAPI Process during site visits.
1 2
6
3 QAPI Workgroup
evaluates the process using the PDSA
cycle for improvement. (Figure P.2-3)
4
QAPI Workgroup reports findings to QAPI Committee.
5
QAPI Step 9:
Prioritize Quality Opportunities
and Charter QAPI Projects
QAPI Step 8:
Identify Your Gaps and
Opportunities
QAPI Step 7:
Develop a Strategy for
Collecting and Using
QAPI Data
QAPI Step 11:
Getting to the “Root” of the Problem QAPI Step 12: Take Systemic Action
QAPI Step 10:
Plan,
Conduct and
Document PIPs
PDSA Cycle PDSA Cycle
FIGURE 6.1-4 Innovation Management System
Create a Culture of Safety that Supports Workforce Focus on
Innovation and Intelligent Risk Taking
Evaluate Stakeholder
Requirements and
Expectations
Identify our Strategic
Opportunities through our Strategic
Planning Process
QAPI Team Develops Short- and Long-term
Action Plans
Align Innovation with Work Processes
and Identify Performance Measure
Implement Performance Improvement Process/QAPI
Design and Deploy
Organizational Learning
Incorporate Innovation into Services and
Process, Implementing Policy and Procedures as needed
1 2 3 4 Assess Risk Associated with Plan
to Determine Resources Needed and
Expected Benefit
5
6 7 8 9 Identify Future
Strategic Objectives and Opportunities
10

Kindred Nursing and Rehabilitation – Mountain Valley 2016 Malcolm Baldrige National Quality Award
Operations Focus Page 32
the costs, maintaining qualified staff and utilizing the clinical evaluation tools, we are able to balance the need for cost
control with the needs of our patients and other customers. We also balance the need for cost control with the needs of our residents and other customers when they differ by always
focusing on our Mission, Vision, and Core Values. If a resident has a need that is not covered by insurance or Medicare and he/she cannot afford it, KNRMV
(with the support of our corporation) will find a way to provide for that resident.
6.2b. Supply-Chain Management: Less than 5 percent of our suppliers are managed locally. The majority of our suppliers are national contracts, which means they are managed by our corporate offices. We work directly
with our facility service representatives, and all feedback is
delivered directly through them. In December of 2014, we had an occurrence of what we felt was inferior quality of meat
from a national vendor. Our CDM contacted our local service representative voicing her concern with emphasis on our resident dissatisfaction of this product, and the representative
took our concern to the next level. Maryruth was contacted by vendor management and explained further the concern of poor quality. Our facility account was credited for the cost of the
meat, and the vendor assured us that they would discontinue use of this product until the quality could be restored. In January of 2015, the vendor contacted Maryruth and verified
the product quality had been restored and offered the facility a free sample to restore our resident confidence. Residents participated in our “taste test,” confirmed the quality was up to
their standard, and we again added it to our menu. Managing our suppliers occurs primarily through two-way communication ensuring the highest quality of product is used
for our health care service delivery and that all supplies are timely.
6.2c. Safety and Emergency Preparedness:
6.2c.(1) Safety:
Mandatory safety education is required for all staff (Figure 7.4-15) and tested through internal audits and mock drills
(Figure 7.1-43). Each employee is required to demonstrate the physical skill sets to perform their job responsibilities as determined by Kindred annually during their performance
evaluation. Through the Safety Committee (consisting of senior leaders), monthly workforce audits are performed to ensure compliance with Fire/Life Safety, Occupational Safety
and Health Administration, Bureau of Facility Standards, and Kindred Safety Program. The Safety Committee monitors key areas of health, safety, and security, and develops an action
plan for improvement if necessary. The deployment of a new action plan follows the same systematic approach described in 2.2b. Significant differences in these performance measures
related to workplace environment and workgroup may occur. This is identified and addressed annually through the development of Safety Committee goals after review of audit
findings, employee education outcomes, regulatory changes, employee engagement surveys, and OSHA statistics.
In August of 2015, our community experienced several wildfires that placed the entire county on fire evacuation alert. We held a meeting with key leaders in our community to
discuss changes to our evacuation plan. Our current plan had us evacuating our residents/patients to the hospital and church but with fire danger, that plan was no longer realistic.
Through input from key leaders – in particular CEO of SMC, Fire Chief, State of Idaho Fire Life Safety Supervisor and Central Shoshone County Water District Manager – we
developed a plan to “shelter in place.” The Fire Chief determined that we had great defensible space with fire hydrant pull stations at each corner of our property and
covered parking lots also surrounding our property. Through coordination with church leaders, it was determined that the church next door and our center would be the key areas that
community members would evacuate to, and community resources focused on this plan through securing water and food delivery. We did not have to initiate this “shelter in
place” plan, but it is the current fire evacuation plan for the community in the event of similar events.
6.2c.(2) Emergency Preparedness: Kindred has a comprehensive Emergency Response Plan, as well as technology emergency plans (addressed in 4.2b.(5)). Prevention occurs through the development of our own
facility/community emergency plan. As demonstrated through education and training (Figure 5.2-3), all staff are trained in emergency readiness with monthly and annual drills ensuring
adequate response times (Figure 7.1-19). Management, continuity of operations for patients, the community, and evacuations occur through our partnership with SMC and the
United Church; both are across the street from our facility. SMC evacuates sub-acute or medically fragile residents, and the United Church evacuates mobile residents. Both facilities
provide availability of meal preparation, space for residents, and workforce to continue to deliver care. We participate in our community disaster plan, which
allows us priority access to all medical supplies and equipment maintained at SMC for the purpose of effective/efficient response to a community disaster. We have a reciprocal
agreement with SMC. This agreement addresses transportation, use of staff, food, and supplies to meet the needs of our residents until our staff can secure facility and
residents. Our plan includes monthly audits of the emergency generator, food supplies for 7 days, filtered water, medical supplies for 14 days, staff education, and community contacts
to assist if staff is unable to remain onsite.
In November of 2015, as the result of a record-breaking wind storm to hit the Inland Northwest, our center was without
power for 18 hours – not only our center but our entire county was without power, with some employees out of power for as long as one week. We were able to manage our center staffing

Kindred Nursing and Rehabilitation – Mountain Valley 2016 Malcolm Baldrige National Quality Award
Results Page 33
by allowing our workforce to bring their children to work with them where it was warm. Most employees were able to bring their household food to ensure the sustainability of the center’s resources if power outage lasted longer than expected. Senior leaders managed their sections with direct care staff, and the community disaster plan was initiated but not formally used. Our computers on wheels (COWs), laptops, and iPads were used to ensure that all patient care continued without interruption (4.2b.(5)). The Bureau of Facility Standards contacted our facility to ensure all areas of operations impacting patient care and safety had been met and asked if we were able to care for residents of other centers that had not “faired so well.” Our facility reported actions and received verification that our disaster plan had exceeded the expectations of state and federal regulatory agencies.
Although we were successful in all areas of our Emergency Response Plan (ERP), we did identify areas that needed improvement. One was a system to easily manage our residents’ electric beds. Our lifts are battery-operated, but each bed must be in the highest position for safe transfer. This required that we add additional extension cords that could reach from resident bed to the nearest emergency power
socket. The second was the battery-powered lights in our Rose Room dining room. The batteries did not last the entire time the power was off. We are working on new longer-lasting lights, but until that time we have educated staff that all residents should be taken to the larger Garden Dining Room for all meals. This room has emergency lighting but, in addition, this helps us keep the majority of staff and residents in one common area, which is important during an emergency. Third, we identified that our freezer and walk-in coolers were not on the emergency power system. Fortuitously, this was not a problem since the temperature outside was very cold, but had the same event happened in the summer, we would not have been able to manage our refrigeration.
We were able to place most items in the reach-in cooler and plug it into emergency power and filled the walk-in cooler with blocks of ice. We have since signed a contract with Sysco for the delivery of a refrigerated trailer within 8 hours of power outage. All staff were educated on changes to the ERP through an all-staff meeting and will continue this through annual workforce training. .
CATEGORY 7: RESULTS
7.1 Health Care and Process Results
Because of our very small size, only 68 beds, our customer results tend to show more variation than would be seen with a hospital or large health care system. Data related to a single resident or patient will exaggerate the response in our results. However, through our QAPI Committee, we drill down to identify true trends of statistical significance.
7.1a. Health Care and Customer-Focused Service Results: Figures 7.1-1 through 7.1-17 are the AHCA analysis of CMS Nursing Home Compare QI/QM data used to generate the star ratings. Quarter 2 of 2016 state and national data are not available at this time. Top quartile and top decile performance benchmarks are not available, so the state and national comparisons are averages. Whenever possible, we present results segmented by short-term patients and long-term residents.
When a resident is admitted with an “unstageable” (4) pressure ulcer is treated and the pressure ulcer becomes stageable (3), it hits the QI/QMs. The result shown below is one resident whose pressure ulcer actually improved.
FIGURE 7.1-3 High-Risk Pressure Ulcer Long-term Residents
State National KNRMV
10%
7.5%
5.0%
2.5%
0%
Better
Q1 June Dec June Dec June Dec June Dec 2016 2012 2012 2013 2013 2014 2014 2015 2015 2016
Q2
FIGURE 7.1-2 Self-Reported Moderate to Severe Pain
State National KNRMV
Long-term Residents
32%
24%
16%
8%
0% Q1 June Dec June Dec June Dec June Dec
2016 2012 2012 2013 2013 2014 2014 2015 2015
Better
2016 Q2
Best Possible Performance Q1 and Q2 2016
FIGURE 7.1-1 Self-Reported Moderate to Severe Pain
State National KNRMV
24%
16%
8%
0% Q1 June Dec June Dec June Dec June Dec
2016 2012 2012 2013 2013 2014 2014 2015 2015
32%
Better
2016 Q2
Short-term Patients
Best Possible Performance Q2 2016
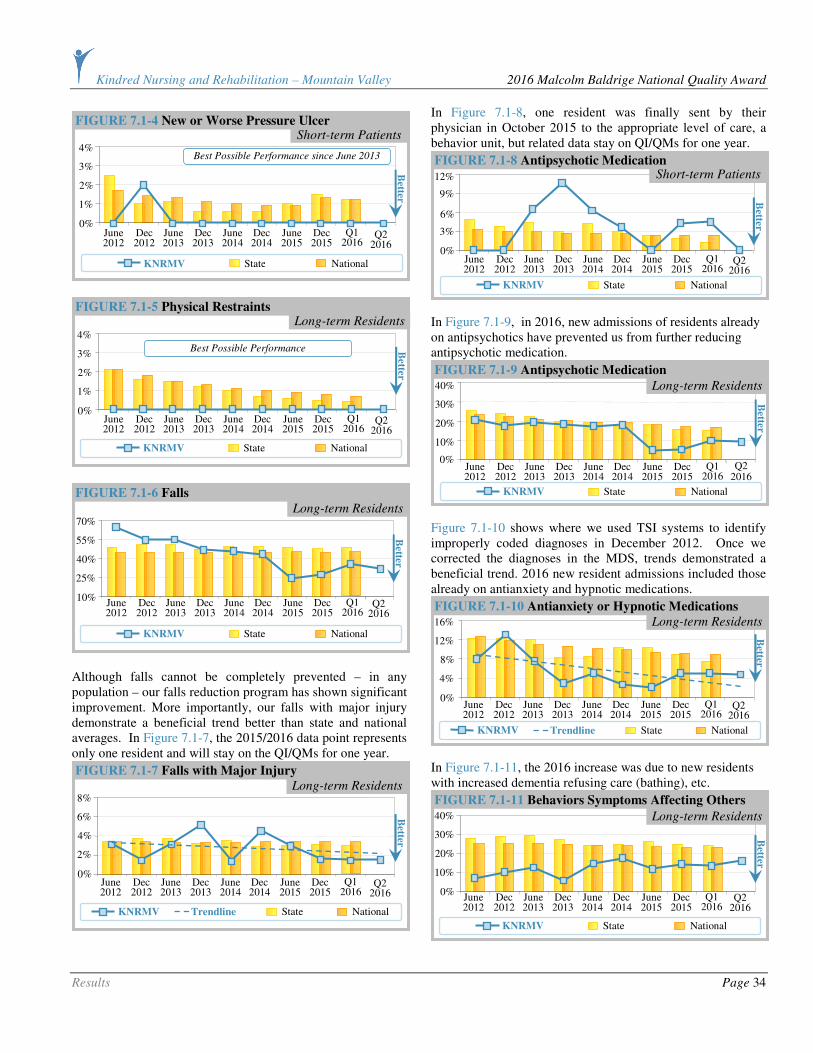
Kindred Nursing and Rehabilitation – Mountain Valley 2016 Malcolm Baldrige National Quality Award
Results Page 34
Although falls cannot be completely prevented – in any population – our falls reduction program has shown significant improvement. More importantly, our falls with major injury demonstrate a beneficial trend better than state and national averages. In Figure 7.1-7, the 2015/2016 data point represents only one resident and will stay on the QI/QMs for one year.
In Figure 7.1-8, one resident was finally sent by their physician in October 2015 to the appropriate level of care, a behavior unit, but related data stay on QI/QMs for one year.
In Figure 7.1-9, in 2016, new admissions of residents already on antipsychotics have prevented us from further reducing antipsychotic medication.
Figure 7.1-10 shows where we used TSI systems to identify improperly coded diagnoses in December 2012. Once we corrected the diagnoses in the MDS, trends demonstrated a beneficial trend. 2016 new resident admissions included those already on antianxiety and hypnotic medications.
In Figure 7.1-11, the 2016 increase was due to new residents with increased dementia refusing care (bathing), etc.
FIGURE 7.1-11 Behaviors Symptoms Affecting Others
State National KNRMV
40%
30%
20%
10%
0%
Better
Q1 June Dec June Dec June Dec June Dec 2016 2012 2012 2013 2013 2014 2014 2015 2015 2016
Q2
Long-term Residents
FIGURE 7.1-10 Antianxiety or Hypnotic Medications
State National KNRMV Trendline
16%
12%
8%
4%
0%
Better
Q1 June Dec June Dec June Dec June Dec 2016 2012 2012 2013 2013 2014 2014 2015 2015 2016
Q2
Long-term Residents
40%
30%
20%
10%
Better
Q1 June Dec June Dec June Dec June Dec 2016 2012 2012 2013 2013 2014 2014 2015 2015
0%
2016 Q2
FIGURE 7.1-9 Antipsychotic Medication
State National KNRMV
Long-term Residents
FIGURE 7.1-8 Antipsychotic Medication
State National KNRMV
12%
9%
6%
3%
0%
Better
Q1 June Dec June Dec June Dec June Dec 2016 2012 2012 2013 2013 2014 2014 2015 2015 2016
Q2
Short-term Patients
FIGURE 7.1-7 Falls with Major Injury
Long-term Residents
State National KNRMV Trendline
8%
6%
4%
2%
0%
Better
Q1 June Dec June Dec June Dec June Dec 2016 2012 2012 2013 2013 2014 2014 2015 2015 2016
Q2
FIGURE 7.1-6 Falls
State National KNRMV
Long-term Residents 70%
55%
40%
25%
10%
Better
Q1 June Dec June Dec June Dec June Dec 2016 2012 2012 2013 2013 2014 2014 2015 2015 2016
Q2
4%
3%
2%
1%
0% B
etter Q1 June Dec June Dec June Dec June Dec
2016 2012 2012 2013 2013 2014 2014 2015 2015 2016 Q2
FIGURE 7.1-5 Physical Restraints
State National KNRMV
Long-term Residents
Best Possible Performance
FIGURE 7.1-4 New or Worse Pressure Ulcer Short-term Patients
State National KNRMV
4%
3%
2%
1%
0%
Better
Q1 June Dec June Dec June Dec June Dec 2016 2012 2012 2013 2013 2014 2014 2015 2015 2016
Q2
Best Possible Performance since June 2013
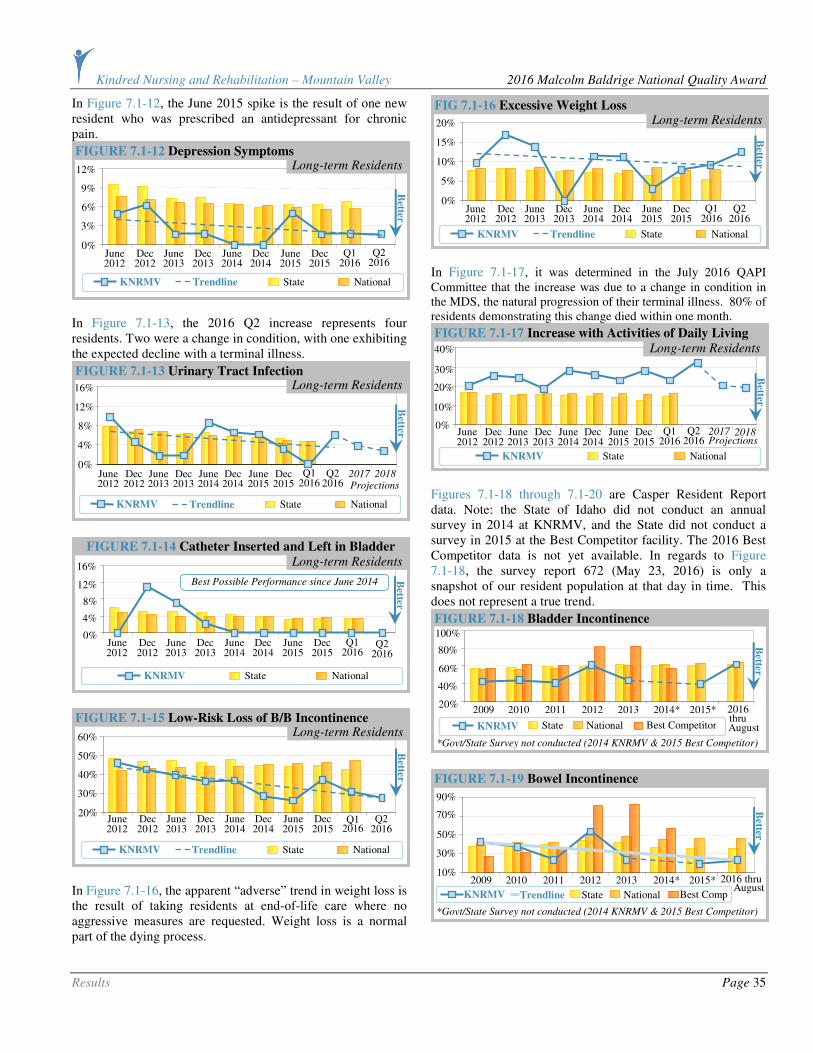
Kindred Nursing and Rehabilitation – Mountain Valley 2016 Malcolm Baldrige National Quality Award
Results Page 35
In Figure 7.1-12, the June 2015 spike is the result of one new resident who was prescribed an antidepressant for chronic pain.
In Figure 7.1-13, the 2016 Q2 increase represents four residents. Two were a change in condition, with one exhibiting the expected decline with a terminal illness.
In Figure 7.1-16, the apparent “adverse” trend in weight loss is the result of taking residents at end-of-life care where no aggressive measures are requested. Weight loss is a normal part of the dying process.
In Figure 7.1-17, it was determined in the July 2016 QAPI Committee that the increase was due to a change in condition in the MDS, the natural progression of their terminal illness. 80% of residents demonstrating this change died within one month.
Figures 7.1-18 through 7.1-20 are Casper Resident Report data. Note: the State of Idaho did not conduct an annual survey in 2014 at KNRMV, and the State did not conduct a survey in 2015 at the Best Competitor facility. The 2016 Best Competitor data is not yet available. In regards to Figure 7.1-18, the survey report 672 (May 23, 2016) is only a snapshot of our resident population at that day in time. This does not represent a true trend.
FIGURE 7.1-19 Bowel Incontinence
*Govt/State Survey not conducted (2014 KNRMV & 2015 Best Competitor)
Best Comp State National KNRMV Trendline
2009 2011 2012 2013 2014* 2015* 2010
90%
70%
50%
30%
10%
Better
2016 thru August
FIGURE 7.1-18 Bladder Incontinence
*Govt/State Survey not conducted (2014 KNRMV & 2015 Best Competitor)
Best Competitor
2009
100%
2011 2012 2013 2014* 2015* 2010
80%
60%
40%
20%
State National KNRMV
Better
2016 thru August
FIGURE 7.1-17 Increase with Activities of Daily Living
State National KNRMV
40%
30%
20%
10%
0%
Better
Long-term Residents
Q1
June Dec June Dec June Dec June Dec 2016
2012 2012 2013 2013 2014 2014 2015 2015 2016
Q2 Projections
2017
2018
FIG 7.1-16 Excessive Weight Loss
State National KNRMV Trendline
20%
15%
10%
5%
0%
Better
Q1 June Dec June Dec June Dec June Dec 2016 2012 2012 2013 2013 2014 2014 2015 2015 2016
Q2
Long-term Residents
FIGURE 7.1-15 Low-Risk Loss of B/B Incontinence
State National KNRMV Trendline
60%
50%
40%
30%
20%
Better
Q1 June Dec June Dec June Dec June Dec 2016 2012 2012 2013 2013 2014 2014 2015 2015 2016
Q2
Long-term Residents
FIGURE 7.1-14 Catheter Inserted and Left in Bladder
State National KNRMV
12%
8%
4%
0%
Better
Q1 June Dec June Dec June Dec June Dec 2016 2012 2012 2013 2013 2014 2014 2015 2015
16%
2016 Q2
Long-term Residents
Best Possible Performance since June 2014
FIGURE 7.1-13 Urinary Tract Infection
16%
12%
8%
4%
0%
Better
Q1
June Dec June Dec June Dec June Dec 2016
2012 2012 2013 2013 2014 2014 2015 2015 2016
Q2 Projections
2017
2018
State National KNRMV Trendline
Long-term Residents
FIGURE 7.1-12 Depression Symptoms
State National KNRMV Trendline
12%
9%
6%
3%
0% Q1 June Dec June Dec June Dec June Dec
2016 2012 2012 2013 2013 2014 2014 2015 2015
Better
2016 Q2
Long-term Residents
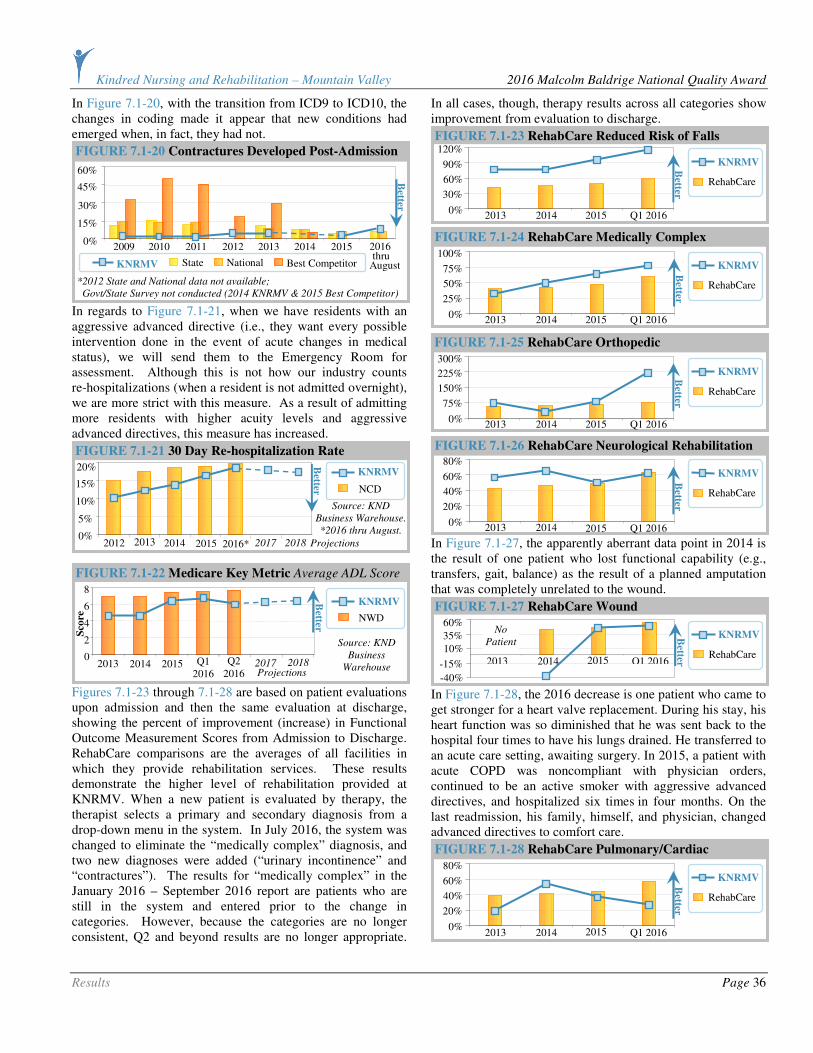
Kindred Nursing and Rehabilitation – Mountain Valley 2016 Malcolm Baldrige National Quality Award
Results Page 36
In Figure 7.1-20, with the transition from ICD9 to ICD10, the changes in coding made it appear that new conditions had emerged when, in fact, they had not.
In regards to Figure 7.1-21, when we have residents with an aggressive advanced directive (i.e., they want every possible intervention done in the event of acute changes in medical status), we will send them to the Emergency Room for assessment. Although this is not how our industry counts re-hospitalizations (when a resident is not admitted overnight), we are more strict with this measure. As a result of admitting more residents with higher acuity levels and aggressive advanced directives, this measure has increased.
Figures 7.1-23 through 7.1-28 are based on patient evaluations upon admission and then the same evaluation at discharge, showing the percent of improvement (increase) in Functional Outcome Measurement Scores from Admission to Discharge. RehabCare comparisons are the averages of all facilities in which they provide rehabilitation services. These results demonstrate the higher level of rehabilitation provided at KNRMV. When a new patient is evaluated by therapy, the therapist selects a primary and secondary diagnosis from a drop-down menu in the system. In July 2016, the system was changed to eliminate the “medically complex” diagnosis, and two new diagnoses were added (“urinary incontinence” and “contractures”). The results for “medically complex” in the January 2016 – September 2016 report are patients who are still in the system and entered prior to the change in categories. However, because the categories are no longer consistent, Q2 and beyond results are no longer appropriate.
In all cases, though, therapy results across all categories show improvement from evaluation to discharge.
In Figure 7.1-27, the apparently aberrant data point in 2014 is the result of one patient who lost functional capability (e.g., transfers, gait, balance) as the result of a planned amputation that was completely unrelated to the wound.
In Figure 7.1-28, the 2016 decrease is one patient who came to get stronger for a heart valve replacement. During his stay, his heart function was so diminished that he was sent back to the hospital four times to have his lungs drained. He transferred to an acute care setting, awaiting surgery. In 2015, a patient with acute COPD was noncompliant with physician orders, continued to be an active smoker with aggressive advanced directives, and hospitalized six times in four months. On the last readmission, his family, himself, and physician, changed advanced directives to comfort care.
FIGURE 7.1-28 RehabCare Pulmonary/Cardiac
80%
Q1 2016 2013 2014
60%
40%
20%
0%
RehabCare
2015
KNRMV
Better
FIGURE 7.1-27 RehabCare Wound
RehabCare
KNRMV 60%
Q1 2016 2013 2014
35%
10%
-15%
-40%
2015
Better
No
Patient
FIGURE 7.1-26 RehabCare Neurological Rehabilitation
80%
Q1 2016 2013 2014
60%
40%
20%
0%
RehabCare
2015
KNRMV
Better
FIGURE 7.1-25 RehabCare Orthopedic
300%
Q1 2016 2013 2014
225%
150%
75%
0%
RehabCare
2015
KNRMV Better
FIGURE 7.1-24 RehabCare Medically Complex
100%
Q1 2016 2013 2014
75%
50%
25%
0%
RehabCare
2015
KNRMV
Better
FIGURE 7.1-23 RehabCare Reduced Risk of Falls 120%
Q1 2016 2013 2014
90%
60%
30%
0%
RehabCare
2015
KNRMV
Better
FIGURE 7.1-22 Medicare Key Metric Average ADL Score
NWD
KNRMV
Source: KND
Business
Warehouse
8
2014 2015 Q1 2016
6
4
2
0 2013
Better
2017 2018
Projections Q2
2016
Sco
re
FIGURE 7.1-21 30 Day Re-hospitalization Rate
Source: KND
Business Warehouse.
*2016 thru August.
NCD
KNRMV 20%
2012 2013
15%
10%
5%
0%
Better
2014 2015 2016* 2017 Projections 2018
FIGURE 7.1-20 Contractures Developed Post-Admission
*2012 State and National data not available;
Govt/State Survey not conducted (2014 KNRMV & 2015 Best Competitor)
2009
60%
2011 2012*
2013 2014*
2015*
2010
45%
30%
15%
0%
Best Competitor State National KNRMV
Better
2016
August thru

Kindred Nursing and Rehabilitation – Mountain Valley 2016 Malcolm Baldrige National Quality Award
Results Page 37
7.1.b. Work Process Effectiveness Results:
7.1.b(1) Process Effectiveness and Efficiency: Figure 7.1-30 shows the power of the innovative visual management techniques in analyzing falls data.
Figures 7.1-33 through 7.1-35 present Casper Resident Report data. 2016 Best Competitor data is not available.
All residents were offered the influenza and pneumococcal vaccines. Those not vaccinated either declined, or the vaccine was contraindicated (Figures 7.1-34 and 7.1-35).
FIGURE 7.1-30 Resident Falls Total Falls at Time of Day
12 AM
1 AM
2 AM
3 AM
4 AM
11 AM
10 AM
9 AM
8 AM
7 AM
6 AM
5 AM
Shift
Change
Breakfast
12 PM
2015
2013
2014
12 PM
1 PM
2 PM
3 PM
4 PM
11 PM
10 PM
9 PM
8 PM
7 PM
6 PM
5 PM
Shift
Change
Dinner
12 AM
Shift
Change
Lunch
Better
1
2
3
4
5
6
7
8
To
tal
# o
f F
all
s
These clocks
show the number of falls
during each hour of the
day to assist in analyzing
the root cause
of falls.
*2016 thru
August data
is shown on
the graph as a blue line
going across the hour.
2016*
FIGURE 7.1-35 Resident Pneumococcal Vaccination Rate
*Govt/State Survey not conducted (2014 KNRMV & 2015 Best Competitor)
2009 2011 2012 2013 2014* 2015* 2010
100%
80%
60%
40%
20%
Better
Best Competitor State National KNRMV August thru
2016
FIGURE 7.1-34 Resident Influenza Immunization Rate
*Govt/State Survey not conducted (2014 KNRMV & 2015 Best Competitor)
2009 2011 2012 2013 2014* 2015* 2010
100%
80%
60%
40%
20%
Better
Best Competitor State National KNRMV August
2016 thru
FIGURE 7.1-33 Resident Advance Directives
2009 2011 2012*
2013*
2014* 2015* 2010
*Govt/State Survey not conducted (2014 KNRMV & 2015 Best Competitor),
2012, 2013, 2016 Best Competitor data not available.
100%
75%
50%
25%
0%
Best Competitor State National KNRMV
Better
2016 thru August
Best Possible Performance in 2016
FIGURE 7.1-32 Employees Receiving Flu Vaccine 100%
2013 2014 2015
90%
80%
70%
60%
Source:
Kindred.
No
benchmark
available.
Better
Goal
KNRMV
FIGURE 7.1-31 Resident Falls
Number of Total Falls
Percent of Residents that Fell
120
2013 2014 2015
90
60
30
0
Better
To
tal
# o
f F
all
s
2011 2012 2016 thru August
FIGURE 7.1-29 RehabCare Functional Outcome
Measurement Score Gains All Medicare Patients 2.00
2014
1.75
1.50
1.25
1.00
Sco
re
2013 Q1 2016 2015
KNRMV
Better No
benchmark
available.
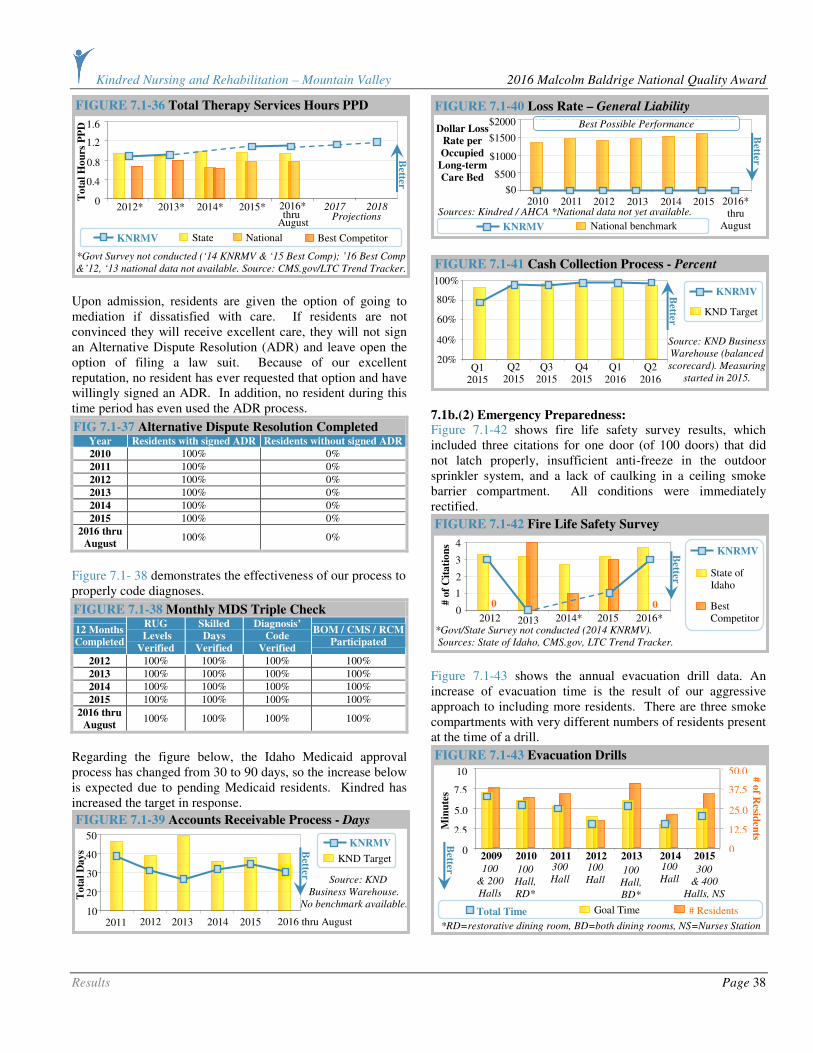
Kindred Nursing and Rehabilitation – Mountain Valley 2016 Malcolm Baldrige National Quality Award
Results Page 38
Upon admission, residents are given the option of going to mediation if dissatisfied with care. If residents are not convinced they will receive excellent care, they will not sign an Alternative Dispute Resolution (ADR) and leave open the option of filing a law suit. Because of our excellent reputation, no resident has ever requested that option and have willingly signed an ADR. In addition, no resident during this time period has even used the ADR process.
FIG 7.1-37 Alternative Dispute Resolution Completed Year Residents with signed ADR Residents without signed ADR
2010 100% 0%
2011 100% 0%
2012 100% 0%
2013 100% 0%
2014 100% 0%
2015 100% 0%
2016 thru
August 100% 0%
Figure 7.1- 38 demonstrates the effectiveness of our process to properly code diagnoses.
FIGURE 7.1-38 Monthly MDS Triple Check
12 Months
Completed
RUG
Levels
Verified
Skilled
Days
Verified
Diagnosis’
Code
Verified
BOM / CMS / RCM
Participated
2012 100% 100% 100% 100%
2013 100% 100% 100% 100%
2014 100% 100% 100% 100%
2015 100% 100% 100% 100%
2016 thru
August 100% 100% 100% 100%
Regarding the figure below, the Idaho Medicaid approval process has changed from 30 to 90 days, so the increase below is expected due to pending Medicaid residents. Kindred has increased the target in response.
7.1b.(2) Emergency Preparedness: Figure 7.1-42 shows fire life safety survey results, which included three citations for one door (of 100 doors) that did not latch properly, insufficient anti-freeze in the outdoor sprinkler system, and a lack of caulking in a ceiling smoke barrier compartment. All conditions were immediately rectified.
Figure 7.1-43 shows the annual evacuation drill data. An increase of evacuation time is the result of our aggressive approach to including more residents. There are three smoke compartments with very different numbers of residents present at the time of a drill.
FIGURE 7.1-43 Evacuation Drills
2009
Total Time Goal Time # Residents
2011 2012 2013 2014 2015 2010
100
& 200
Halls
100
Hall,
RD*
300
Hall 100
Hall 100
Hall,
BD*
100
Hall 300
& 400
Halls, NS
*RD=restorative dining room, BD=both dining rooms, NS=Nurses Station
10
7.5
5.0
2.5
0
50.0
37.5
25.0
12.5
0
# o
f Resid
ents
Min
ute
s
Better
FIGURE 7.1-42 Fire Life Safety Survey
4
State of Idaho
2012 2013 2014* 2015
3
2
1
0
*Govt/State Survey not conducted (2014 KNRMV).
Sources: State of Idaho, CMS.gov, LTC Trend Tracker.
Best Competitor
# o
f C
ita
tio
ns
0 0
2016*
Better
KNRMV
FIGURE 7.1-41 Cash Collection Process - Percent
Source: KND Business
Warehouse (balanced
scorecard). Measuring
started in 2015.
KND Target
KNRMV 100%
80%
60%
40%
20% Q3
2015 Q4
2015 Q2
2015 Q1
2015
Better
Q1 2016
Q2 2016
FIGURE 7.1-40 Loss Rate – General Liability
2013 2014 2015
$2000
$1500
$1000
$500
$0
Sources: Kindred / AHCA *National data not yet available. 2012 2011
National benchmark
2016* thru
August
2010
Dollar Loss
Rate per
Occupied
Long-term
Care Bed
Better
KNRMV
Best Possible Performance
FIGURE 7.1-39 Accounts Receivable Process - Days
Source: KND
Business Warehouse.
No benchmark available.
KND Target
KNRMV 50
2013 2014 2015
40
30
20
10 2012
To
tal
Day
s
2011
Better
2016 thru August
FIGURE 7.1-36 Total Therapy Services Hours PPD
2012* 2013* 2014* 2015*
*Govt Survey not conducted (‘14 KNRMV & ‘15 Best Comp); ’16 Best Comp
& ’12, ‘13 national data not available. Source: CMS.gov/LTC Trend Tracker.
1.6
1.2
0.8
0.4
0 2016* 2017 2018 Projections
Better
To
tal
Ho
urs
PP
D
Best Competitor State National KNRMV
August thru
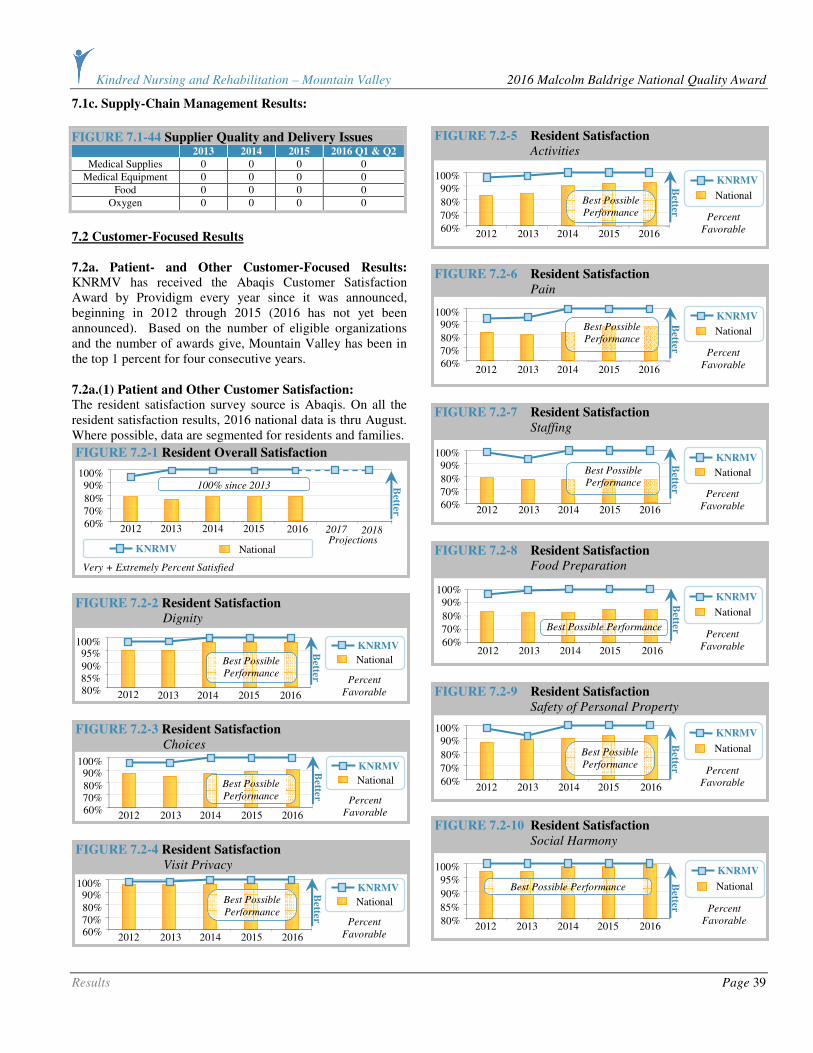
Kindred Nursing and Rehabilitation – Mountain Valley 2016 Malcolm Baldrige National Quality Award
Results Page 39
7.1c. Supply-Chain Management Results:
FIGURE 7.1-44 Supplier Quality and Delivery Issues 2013 2014 2015 2016 Q1 & Q2
Medical Supplies 0 0 0 0
Medical Equipment 0 0 0 0
Food 0 0 0 0
Oxygen 0 0 0 0
7.2 Customer-Focused Results
7.2a. Patient- and Other Customer-Focused Results:
KNRMV has received the Abaqis Customer Satisfaction Award by Providigm every year since it was announced, beginning in 2012 through 2015 (2016 has not yet been announced). Based on the number of eligible organizations and the number of awards give, Mountain Valley has been in the top 1 percent for four consecutive years.
7.2a.(1) Patient and Other Customer Satisfaction: The resident satisfaction survey source is Abaqis. On all the resident satisfaction results, 2016 national data is thru August. Where possible, data are segmented for residents and families.
FIGURE 7.2-10 Resident Satisfaction
Social Harmony
100%
95%
90%
85%
80% 2012 2013 2014 2015 2016
KNRMV
National
Percent
Favorable
Better
Best Possible Performance
FIGURE 7.2-9 Resident Satisfaction
Safety of Personal Property
100%
90%
80%
70%
60% 2012 2013 2014 2015 2016
KNRMV
National
Percent
Favorable
Better
Best Possible
Performance
FIGURE 7.2-8 Resident Satisfaction
Food Preparation
100% 90%
80%
70%
60% 2012 2013 2014 2015 2016
KNRMV
National
Percent
Favorable
Better Best Possible Performance
FIGURE 7.2-7 Resident Satisfaction
Staffing
100% 90%
80%
70%
60% 2012 2013 2014 2015 2016
KNRMV
National
Percent
Favorable
Better
Best Possible
Performance
FIGURE 7.2-6 Resident Satisfaction
Pain
100% 90%
80%
70%
60% 2012 2013 2014 2015 2016
KNRMV
National
Percent
Favorable
Better
Best Possible
Performance
FIGURE 7.2-5 Resident Satisfaction
Activities
100%
90%
80%
70%
60% 2012 2013 2014 2015 2016
KNRMV
National
Percent
Favorable
Better
Best Possible
Performance
FIGURE 7.2-4 Resident Satisfaction
Visit Privacy
100% 90% 80% 70% 60%
2012 2013 2014 2015 2016
KNRMV
National
Percent
Favorable
Better
Best Possible
Performance
FIGURE 7.2-3 Resident Satisfaction
Choices
100% 90% 80% 70% 60%
2012 2013 2014 2015 2016
KNRMV
National
Percent
Favorable
Better
Best Possible
Performance
FIGURE 7.2-2 Resident Satisfaction
Dignity
100%
2013 2014 2015 2016
95%
90% 85% 80%
KNRMV
National
Percent
Favorable
Better
2012
Best Possible
Performance
FIGURE 7.2-1 Resident Overall Satisfaction
KNRMV National
Very + Extremely Percent Satisfied
100% 90%
80% 70% 60% 2012 2013 2014 2015
Better
2016 2017 Projections
2018
100% since 2013
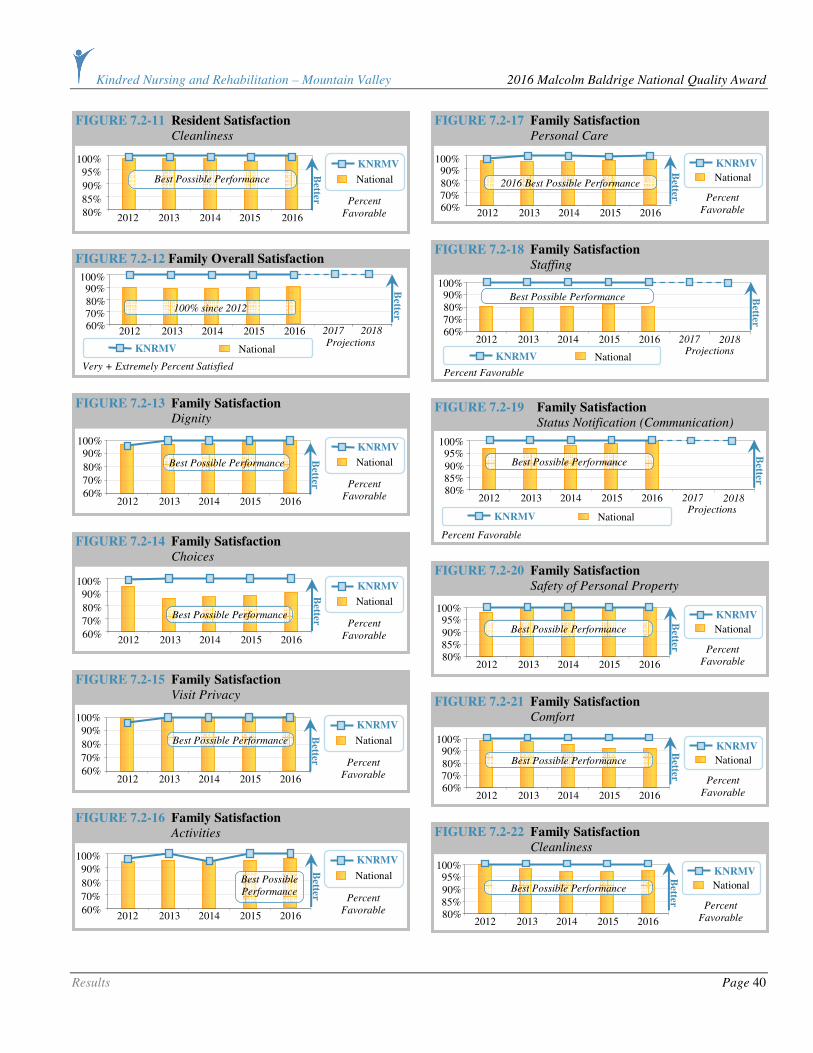
Kindred Nursing and Rehabilitation – Mountain Valley 2016 Malcolm Baldrige National Quality Award
Results Page 40
FIGURE 7.2-22 Family Satisfaction
Cleanliness
100% 95% 90% 85% 80%
2012 2013 2014 2015 2016
KNRMV
National
Percent
Favorable
Better
Best Possible Performance
FIGURE 7.2-21 Family Satisfaction
Comfort
100% 90% 80% 70% 60%
2012 2013 2014 2015 2016
KNRMV
National
Percent
Favorable
Better
Best Possible Performance
FIGURE 7.2-20 Family Satisfaction
Safety of Personal Property
100% 95% 90% 85% 80%
2012 2013 2014 2015 2016
KNRMV
National
Percent
Favorable
Better
Best Possible Performance
FIGURE 7.2-19 Family Satisfaction
Status Notification (Communication)
KNRMV National
Percent Favorable
100% 95% 90% 85% 80%
2012 2013 2014 2015 2016
Better
2017 2018 Projections
Best Possible Performance
FIGURE 7.2-18 Family Satisfaction
Staffing
KNRMV National
Percent Favorable
100% 90% 80% 70% 60%
2012 2013 2014 2015 2016
Best Possible Performance Better
2017 2018 Projections
FIGURE 7.2-17 Family Satisfaction
Personal Care
100% 90% 80% 70% 60%
2012 2013 2014 2015 2016
KNRMV
National
Percent
Favorable
Better
2016 Best Possible Performance
FIGURE 7.2-16 Family Satisfaction
Activities
100%
90%
80%
70%
60% 2012 2013 2014 2015 2016
KNRMV
National
Percent
Favorable
Better
Best Possible
Performance
FIGURE 7.2-15 Family Satisfaction
Visit Privacy
100%
90%
80%
70%
60% 2012 2013 2014 2015 2016
KNRMV
National
Percent
Favorable
Better
Best Possible Performance
FIGURE 7.2-14 Family Satisfaction
Choices
100%
90%
80%
70%
60% 2012 2013 2014 2015 2016
KNRMV
National
Percent
Favorable
Better
Best Possible Performance
FIGURE 7.2-13 Family Satisfaction Dignity
100% 90%
80%
70%
60% 2012 2013 2014 2015 2016
KNRMV
National
Percent
Favorable B
etter
Best Possible Performance
100% 90%
80% 70% 60%
2012 2013 2014 2015 2016 2017 Projections
2018
Better
FIGURE 7.2-12 Family Overall Satisfaction
KNRMV National
Very + Extremely Percent Satisfied
100% since 2012
FIGURE 7.2-11 Resident Satisfaction Cleanliness
100%
95%
90%
85%
80% 2012 2013 2014 2015 2016
KNRMV
National
Percent
Favorable
Better
Best Possible Performance

Kindred Nursing and Rehabilitation – Mountain Valley 2016 Malcolm Baldrige National Quality Award
Results Page 41
Figure 7.2-23 shows the absence of dissatisfaction for KNRMV based on scores developed by Reputation.com, which tracks comments and ratings on social media. Mountain Valley greatly exceeds the target set by its parent corporation.
Figure 7.2-23a shows KNRMV’s significantly favorable performance on complaint surveys.
KNRMV demonstrates sustained best possible performance in Figures 7.2-24 and-25, reflective of our personalized care.
FIGURE 7.2-24 72-hour Post-Admission Survey
Date �
3rd
Quarter
2015
4th
Quarter
2015
1st
Quarter
2016
2nd
Quarter
2016 What was your first impression of our center?
100% Excellent
100% Excellent
100% Excellent
100% Excellent
Were you warmly greeted when you arrived?
100% Yes 100% Yes 100% Yes 100% Yes
Were you offered a drink and a snack or meal?
100% Yes 100% Yes 100% Yes 100% Yes
Did someone offer to show you around the center?
100% Yes 100% Yes 100% Yes 100% Yes
Was your room clean, neat and smelling fresh?
100% Yes 100% Yes 100% Yes 100% Yes
Did someone offer to take you to our dining room for your first meal?
100% Yes 100% Yes 100% Yes 100% Yes
How has the food been? Excellent Excellent Excellent Excellent
Have you received the medication as prescribed by your Dr on time?
100% Yes 100% Yes 100% Yes 100% Yes
Has your call light been answered promptly?
100% Yes 100% Yes 100% Yes 100% Yes
How would you rate our staff courtesy and friendliness?
100% Excellent
100% Excellent
100% Excellent
100% Excellent
FIGURE 7.2-25 Discharge Satisfaction Survey
Date �3rd Q
2015
4th Q
2015
1st Q
2016
2nd Q
2016
Were you included in decisions about the care you received?
100% Yes
100% Yes
100% Yes
100% Yes
Did our staff always treat you with dignity and respect?
100% Yes
100% Yes
100% Yes
100% Yes
Did our activity program meet your expectations and needs?
100% Yes
100% Yes
100% Yes
100% Yes
Was our building clean and comfortable?
100% Yes
100% Yes
100% Yes
100% Yes
Did our culinary department meet your needs and expectations?
100% Yes
100% Yes
100% Yes
100% Yes
Did we have appropriate staff to meet your needs?
100% Yes
100% Yes
100% Yes
100% Yes
Were all your therapy needs met? 100% Yes
100% Yes
100% Yes
100% Yes
Were all your discharge concerns addressed appropriately?
100% Yes
100% Yes
100% Yes
100% Yes
Overall were you satisfied with your stay and the care you received?
100% Yes
100% Yes
100% Yes
100% Yes
Would you recommend our center to others?
100% Yes
100% Yes
100% Yes
100% Yes
7.2a.(2) Patient and Other Customer Engagement: In a challenging industry, long-term care, KNRMV demonstrates sustained best possible performance for resident and family engagement since 2013 in Figures 7.2-26 and -27.
7.3 Workforce-Focused Results
7.3a.Workforce-Focused Results:
7.3a.(1) Workforce Capability and Capacity:
KNRMV demonstrates sustained best possible performance in Figure 7.3-1 for licensure and certification, reflecting our outstanding workforce capability even in a rural environment.
FIGURE 7.3-1 Licensure and Certification *2016 thru August Licensure/Certifications for Fiscal Year 2013 2014 2015 2016*
Dietary Safe Food Handling 100% 100% 100% 100%
Staff Licensure – RN, LPN, CNA 100% 100% 100% 100%
Facility Licensure 100% 100% 100% 100%
FIGURE 7.2-27 Family Likelihood of Recommendation
KNRMV National
Very + Extremely Percent Satisfied
100% 90% 80% 70% 60%
2012 2013 2014 2015 2016
Better
2017 Projections
2018
100% since 2012
FIGURE 7.2-26 Resident Likelihood of Recommendation
KNRMV National
Very + Extremely Percent Satisfied
100% 90% 80% 70% 60%
2012 2013 2014 2015 2016
Better
2017 Projections
2018
100% since 2013
FIGURE 7.2-23a (Dissatisfaction) Complaint Survey
Citations
State of Idaho KNRMV
2016 Best
Possible
Performance
10
2014 2015
7.5
5.0
2.5
0
Av
erag
e #
Cit
ati
on
s
Better
2016 2017 2018
Projection
Projection
thru August
FIGURE 7.2-23 Reputation.com
Source: KND Business Warehouse (balanced scorecard).
KND Target KNRMV
800
600
400
200
0
To
tal
Sco
re
Q3 2015
Q4 2015
Q2 2015
Q1 2015
Better
Q1 2016
Q2 2016
2017
2018
Projections
Measuring started in 2015.

Kindred Nursing and Rehabilitation – Mountain Valley 2016 Malcolm Baldrige National Quality Award
Results Page 42
Figures 7.3-2 through 7.3-6 and Figure 7.1-36 demonstrates our commitment to staffing levels that provide excellent care. In regards to Figures 7.3-2 and 7.3-5, when state surveyors arrive, we must provide the staffing levels for the previous two weeks. During the 2016 survey, we had two CNAs off for one week each, which lowered our staffing hours by 0.10.
In Figure 7.3-6, in the first Quarter of 2016, hours were affected by DNS transition, one full-time employee extra, and a private pay resident with one-to-one 16 hours per day.
7.3a.(2) Workforce Climate: KNRMV seeks to create a workforce climate where employees are appreciated, supported and further engaged in high performance. Figures 7.3-7 through 7.3-27a show their feedback on this environment. Kindred changed the format in 2016; therefore, most results do not have Best in Class Comparison (BCC) benchmark available.
FIGURE 7.3-8 Employee Survey Pay and Benefits
NWD KND BCC KNRMV
80%
2013 2014 2015
60%
40%
20%
0%
Better
2016
FIGURE 7.3-7 Employee Survey Pay and Benefits
NWD KND BCC KNRMV
"People are rewarded according to their job performance"
80%
2013 2014 2015
60%
40%
20%
0%
Better
2016
FIGURE 7.3-6 Total Labor Hours PPD
Source: KND
Business Warehouse
(balanced scorecard)
Measuring
started in 2015.
KND Target
KNRMV 5.5
4.5
3.5
2.5
1.5
Ho
urs
PP
D
Q3 2015
Q4 2015
Q2 2015
Q1 2015
Better
Q1 2016
Q2 2016
FIGURE 7.3-5 CNA Staff Hours PPD
Best Competitor State National KNRMV
*Govt/State Survey not conducted (2014 KNRMV & 2015 Best Competitor),
2016 data is thru August (Best Competitor not yet available).
Source: AHCA/CMS.gov.
2009
3.5
2011 2012 2013 2014* 2015* 2010
3.0
2.5
2.0
1.5
Av
erag
e H
ou
rs P
PD
Better
2016*
FIGURE 7.3-4 RN Staff Hours PPD
State National KNRMV Best Competitor
*Govt/State Survey not conducted (2014 KNRMV & 2015 Best Competitor),
2016 data is thru August (Best Competitor not yet available).
Source: AHCA/CMS.gov.
2009
1.00
2011 2012 2013 2014* 2015* 2010
0.75
0.50
0.25
0
Av
erag
e H
ou
rs P
PD
Better
2016*
FIGURE 7.3-3 LPN Staff Hours PPD
Best Competitor State National KNRMV
*Govt/State Survey not conducted (2014 KNRMV & 2015 Best Competitor),
2016 data is thru August (Best Competitor not yet available).
Source: AHCA/CMS.gov.
2016* 2009
1.00
2011 2012 2013 2014* 2015* 2010
0.75
0.50
0.25
0
Av
erag
e H
ou
rs P
PD
Better
FIGURE 7.3-2 Direct Care Staff Hours PPD
*Govt/State Survey not conducted (2014 KNRMV & 2015 Best Competitor),
2016 data is thru August (Best Competitor not yet available).
Source: AHCA/CMS.gov.
2016* 2009
5.00
2011 2012 2013 2014* 2015* 2010
4.25
3.50
2.75
2.00
Av
erag
e H
ou
rs P
PD
Better
State National KNRMV Best Competitor
"I feel the benefits program compares favorably
with programs in similar companies"
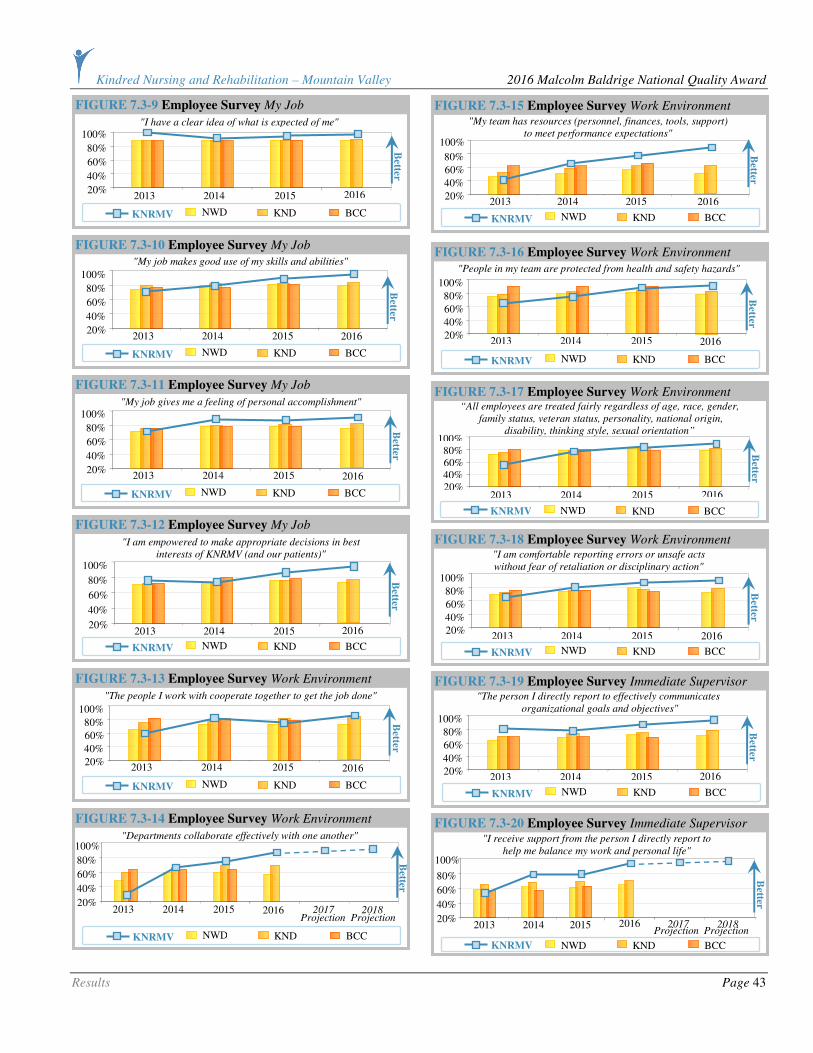
Kindred Nursing and Rehabilitation – Mountain Valley 2016 Malcolm Baldrige National Quality Award
Results Page 43
FIGURE 7.3-20 Employee Survey Immediate Supervisor "I receive support from the person I directly report to
help me balance my work and personal life"
NWD KND BCC KNRMV
100%
2013 2014 2015
80%
60%
40%
20%
Better
2016 2017 2018 Projection
Projection
FIGURE 7.3-19 Employee Survey Immediate Supervisor "The person I directly report to effectively communicates
organizational goals and objectives"
NWD KND BCC KNRMV
100%
2013 2014 2015
80%
60%
40%
20%
Better
2016
FIGURE 7.3-18 Employee Survey Work Environment "I am comfortable reporting errors or unsafe acts
without fear of retaliation or disciplinary action"
NWD KND BCC KNRMV
100%
2013 2014 2015
80%
60%
40%
20%
Better
2016
FIGURE 7.3-17 Employee Survey Work Environment “All employees are treated fairly regardless of age, race, gender,
family status, veteran status, personality, national origin,
disability, thinking style, sexual orientation”
NWD KND BCC KNRMV
100%
2013 2014 2015
80% 60% 40% 20%
Better
2016
FIGURE 7.3-16 Employee Survey Work Environment
"People in my team are protected from health and safety hazards"
NWD KND BCC KNRMV
100%
2013 2014 2015
80%
60%
40%
20%
Better
2016
FIGURE 7.3-15 Employee Survey Work Environment "My team has resources (personnel, finances, tools, support)
to meet performance expectations"
NWD KND BCC KNRMV
100%
2013 2014 2015
80%
60%
40%
20%
Better
2016
FIGURE 7.3-14 Employee Survey Work Environment
"Departments collaborate effectively with one another"
NWD KND BCC KNRMV
100%
2013 2014 2015
80%
60%
40%
20%
Better
2016 2017 2018 Projection
Projection
FIGURE 7.3-13 Employee Survey Work Environment
"The people I work with cooperate together to get the job done"
NWD KND BCC KNRMV
100%
2013 2014 2015
80%
60%
40%
20%
Better
2016
FIGURE 7.3-12 Employee Survey My Job
"I am empowered to make appropriate decisions in best
interests of KNRMV (and our patients)"
NWD KND BCC KNRMV
100%
2013 2014 2015
80%
60%
40%
20%
Better
2016
FIGURE 7.3-11 Employee Survey My Job
"My job gives me a feeling of personal accomplishment"
NWD KND BCC KNRMV
100%
2013 2014 2015
80%
60%
40%
20%
Better
2016
FIGURE 7.3-10 Employee Survey My Job "My job makes good use of my skills and abilities"
NWD KND BCC KNRMV
100%
2013 2014 2015
80%
60%
40%
20%
Better
2016
FIGURE 7.3-9 Employee Survey My Job
"I have a clear idea of what is expected of me"
NWD KND BCC KNRMV
100%
2013 2014 2015
80%
60%
40%
20%
Better
2016
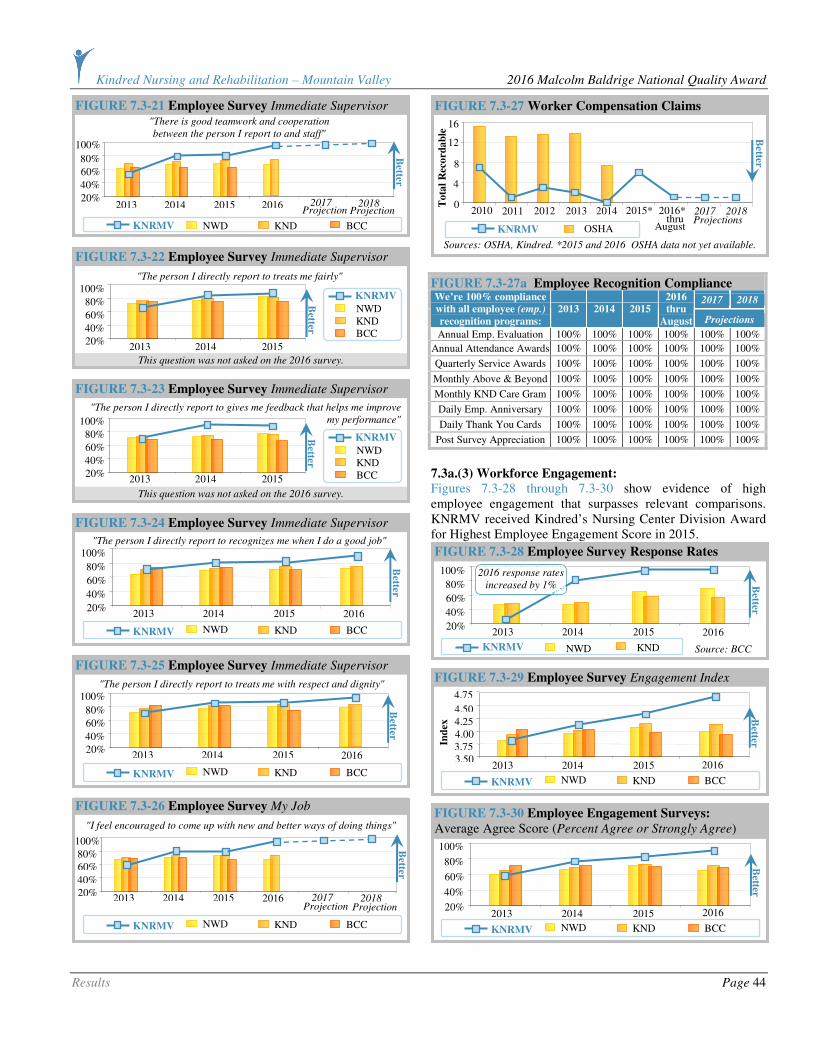
Kindred Nursing and Rehabilitation – Mountain Valley 2016 Malcolm Baldrige National Quality Award
Results Page 44
FIGURE 7.3-27a Employee Recognition Compliance
2017 2018 We’re 100% compliance
with all employee (emp.)
recognition programs:
2013 2014 2015
2016
thru
August Projections
Annual Emp. Evaluation 100% 100% 100% 100% 100% 100%
Annual Attendance Awards 100% 100% 100% 100% 100% 100%
Quarterly Service Awards 100% 100% 100% 100% 100% 100%
Monthly Above & Beyond 100% 100% 100% 100% 100% 100%
Monthly KND Care Gram 100% 100% 100% 100% 100% 100%
Daily Emp. Anniversary 100% 100% 100% 100% 100% 100%
Daily Thank You Cards 100% 100% 100% 100% 100% 100%
Post Survey Appreciation 100% 100% 100% 100% 100% 100%
7.3a.(3) Workforce Engagement: Figures 7.3-28 through 7.3-30 show evidence of high employee engagement that surpasses relevant comparisons. KNRMV received Kindred’s Nursing Center Division Award for Highest Employee Engagement Score in 2015.
FIGURE 7.3-30 Employee Engagement Surveys:
Average Agree Score (Percent Agree or Strongly Agree)
100%
2013 2014 2015
80%
60%
40%
20%
Better
2016
NWD KND BCC KNRMV
FIGURE 7.3-29 Employee Survey Engagement Index
4.50
2013 2014 2015
4.25 4.00 3.75 3.50
Ind
ex B
etter
2016
4.75
NWD KND BCC KNRMV
FIGURE 7.3-28 Employee Survey Response Rates
NWD KND Source: BCC KNRMV
100%
2013 2014 2015
80%
60%
40%
20%
Better
2016
2016 response rates
increased by 1%
FIGURE 7.3-27 Worker Compensation Claims
Sources: OSHA, Kindred. *2015 and 2016 OSHA data not yet available.
OSHA KNRMV
16
2012 2013 2014
12
8
4
0 2011
To
tal
Rec
ord
ab
le
2010 2015*
Better
2016* 2017 2018 Projections thru
August
FIGURE 7.3-26 Employee Survey My Job
"I feel encouraged to come up with new and better ways of doing things"
NWD KND BCC KNRMV
100%
2013 2014 2015
80%
60%
40%
20% 2016
Better
2017 2018 Projection
Projection
FIGURE 7.3-25 Employee Survey Immediate Supervisor
"The person I directly report to treats me with respect and dignity"
NWD KND BCC KNRMV
100%
2013 2014 2015
80%
60%
40%
20%
Better
2016
FIGURE 7.3-24 Employee Survey Immediate Supervisor
"The person I directly report to recognizes me when I do a good job"
NWD KND BCC KNRMV
100%
2013 2014 2015
80%
60%
40%
20%
Better
2016
This question was not asked on the 2016 survey.
FIGURE 7.3-23 Employee Survey Immediate Supervisor
100%
2013 2014 2015
80%
60%
40%
20%
NWD KND BCC
KNRMV Better
"The person I directly report to gives me feedback that helps me improve
my performance"
This question was not asked on the 2016 survey.
FIGURE 7.3-22 Employee Survey Immediate Supervisor
100%
2013 2014 2015
80%
60%
40%
20%
NWD KND BCC
KNRMV
Better
"The person I directly report to treats me fairly"
FIGURE 7.3-21 Employee Survey Immediate Supervisor "There is good teamwork and cooperation
between the person I report to and staff"
100%
2013 2014 2015
80%
60%
40%
20% 2016
Better
2017 2018 Projection Projection
NWD KND BCC KNRMV
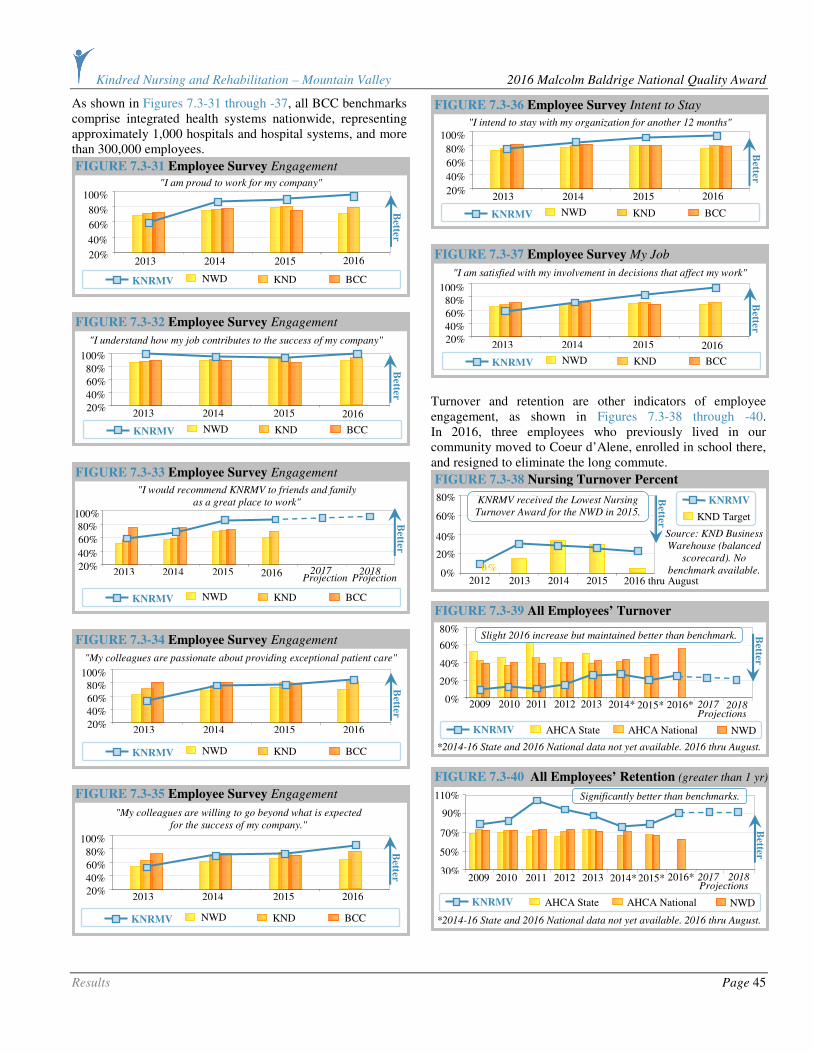
Kindred Nursing and Rehabilitation – Mountain Valley 2016 Malcolm Baldrige National Quality Award
Results Page 45
As shown in Figures 7.3-31 through -37, all BCC benchmarks comprise integrated health systems nationwide, representing approximately 1,000 hospitals and hospital systems, and more than 300,000 employees.
Turnover and retention are other indicators of employee engagement, as shown in Figures 7.3-38 through -40. In 2016, three employees who previously lived in our community moved to Coeur d’Alene, enrolled in school there, and resigned to eliminate the long commute.
110%
90%
70%
50%
30%
Better
2009 2011 2012 2013 2014* 2015* 2010 2016* 2017 2018 Projections
FIGURE 7.3-40 All Employees’ Retention (greater than 1 yr)
NWD AHCA State AHCA National KNRMV
*2014-16 State and 2016 National data not yet available. 2016 thru August.
Significantly better than benchmarks.
FIGURE 7.3-39 All Employees’ Turnover
*2014-16 State and 2016 National data not yet available. 2016 thru August. NWD AHCA State AHCA National KNRMV
2009
80%
2011 2012 2013 2014* 2015* 2010
60%
40%
20%
0%
Better
2016* 2017 2018 Projections
Slight 2016 increase but maintained better than benchmark.
FIGURE 7.3-38 Nursing Turnover Percent
Source: KND Business
Warehouse (balanced
scorecard). No
benchmark available.
KND Target
KNRMV 80%
2013 2014 2015
60%
20%
0% 2012
Better
40%
0%
2016 thru August
KNRMV received the Lowest Nursing
Turnover Award for the NWD in 2015.
FIGURE 7.3-37 Employee Survey My Job
"I am satisfied with my involvement in decisions that affect my work"
100%
2013 2014 2015
80%
60%
40%
20%
Better
2016
NWD KND BCC KNRMV
FIGURE 7.3-36 Employee Survey Intent to Stay
"I intend to stay with my organization for another 12 months" 100%
2013 2014 2015
80%
60%
40%
20%
Better
2016
NWD KND BCC KNRMV
FIGURE 7.3-35 Employee Survey Engagement
"My colleagues are willing to go beyond what is expected
for the success of my company."
NWD KND BCC KNRMV
100%
2013 2014 2015
80%
60%
40%
20%
Better
2016
FIGURE 7.3-34 Employee Survey Engagement
"My colleagues are passionate about providing exceptional patient care"
NWD KND BCC KNRMV
100%
2013 2014 2015
80%
60%
40%
20%
Better
2016
FIGURE 7.3-33 Employee Survey Engagement
"I would recommend KNRMV to friends and family
as a great place to work"
NWD KND BCC KNRMV
100%
2013 2014 2015
80%
60%
40%
20%
Better
2016 2017 2018 Projection
Projection
FIGURE 7.3-32 Employee Survey Engagement
"I understand how my job contributes to the success of my company"
NWD KND BCC KNRMV
100%
2013 2014 2015
80%
60%
40%
20% B
etter 2016
FIGURE 7.3-31 Employee Survey Engagement
"I am proud to work for my company"
NWD KND BCC KNRMV
100%
2013 2014 2015
80%
60%
40%
20%
Better
2016

Kindred Nursing and Rehabilitation – Mountain Valley 2016 Malcolm Baldrige National Quality Award
Results Page 46
Other factors that influence employee engagement are their perception regarding the fairness of pay and benefits and their ability to influence and improve their own jobs.
Although we do not consider our volunteers a workforce segment, we value their contributions. As such, we track related results as shown in Figures 7.3-43 through -45.
7.3a.(4) Workforce Development:
KNRMV is committed to the personal and professional development of our staff. Evidence of this is provided in Figures 7.3-46 through -50.
FIGURE 7.3-50 Employee Survey Immediate Supervisor
"The person I directly report to takes an active interest
in my skills and career development"
NWD KND BCC KNRMV
100%
2013 2014 2015
80%
60%
40%
20%
Better
2016
FIGURE 7.3-49 Employee Survey
Career Development and Training
"I believe I have the opportunity for professional
development and growth in my organization"
NWD KND BCC KNRMV
100%
2013 2014 2015
80%
60%
40%
20%
Better
2016
FIGURE 7.3-48 LMS Employee Education
No benchmark data available. *2016 total hours thru August.
Goal KNRMV
To
tal
Ho
urs
2000
2013 2014 2015
1500
1000
500
0 2012 2011 2016*
Better
2017 2018 Projections
FIGURE 7.3-47 Employee Survey
Career Development and Training
"I have received the training I need to do a quality job"
NWD KND BCC KNRMV
100%
2013 2014 2015
80%
60%
40%
20%
Better
2016
FIGURE 7.3-46 Employee Survey
Career Development and Training
100%
2013 2014
80%
60%
40%
20%
Question
not asked
in 2015
or 2016
NWD KND BCC
KNRMV Better
"I have opportunities for promotion within KNRMV”
FIGURE 7.3-45 Volunteer Engagement Survey
100%
2012 2013 2014 2015
90%
80%
70%
60%
Better
Baldrige Recipient
Percent Agree
KNRMV
Do you feel like you make an important contribution to our center?
FIGURE 7.3-44 Volunteer Engagement Survey
100%
2012 2013 2014 2015
90%
80%
70%
60%
Better
Baldrige Recipient
Percent Agree
KNRMV
Are Senior Leaders Available and Approachable?
In 2011, there was no base camp due to a large group and some active resident volunteers passed.
FIGURE 7.3-43 Volunteers
2009
210
# Volunteers Total Hours
2011 2012 2013 2014 2015 2010
180
150
120
90
Source:
Kindred
16
14
12
10
8
Ho
urs in
Th
ou
san
ds
Nu
mb
er o
f V
olu
nte
ers
Better
FIGURE 7.3-42 Employee Survey My Job
"I feel encouraged to come up with new and better ways of doing things"
NWD KND BCC KNRMV
100%
2013 2014 2015
80%
60%
40%
20% 2016
Better
2017 2018 Projection
Projection
FIGURE 7.3-41 Employee Survey Pay and Benefits
NWD KND BCC KNRMV
"People are rewarded according to their job performance"
80%
2013 2014 2015
60%
40%
20%
0%
Better
2016

Kindred Nursing and Rehabilitation – Mountain Valley 2016 Malcolm Baldrige National Quality Award
Results Page 47
7.4 Leadership and Governance Results
7.4a. Leadership, Governance, and Societal Responsibility
Results:
7.4a.(1) Leadership: As we hope that we have demonstrated in the rest of our application, the senior leaders at Mountain Valley are “all in.” While the results shown in Figures 7.4-1 through -6 demonstrate beneficial trends favorable to comparisons, we demand higher performance from ourselves.
Figure 7.4-6 shows us as the Jean Schoonover award recipient, named in honor of L. Jean Schoonover, who was the Chief of the Bureau of Facility Standards until her death in 1994. She is most remembered for her dedication and commitment to the assurance that the citizens of the state of Idaho residing in health care facilities received the highest quality of care possible. Mountain Valley is one of only seven centers to receive this level of recognition for our delivery of excellent quality of care each year. Less than 7% of the Idaho Skilled Nursing Centers receive this level of recognition.
7.4a.(2) Governance:
FIGURE 7.4-7 Governance
Internal Measure 2013 2014 2015
2016
thru
August
Bench-
mark
Financial Statement Issues
# of Issues
0 0 0 0 0
Sanctions and Adverse Actions
# of Incidents
0 0 0 0 0
FIGURE 7.4-8 RehabCare Audit Completion
Source: Kindred
Internal Data,
FOMS. No
benchmark available.
*2016 thru August
KNRMV 100%
2016*
2013
75%
50%
25%
0% 2014 2015
Better
2017 2018
Projections
Best Possible Performance
FIGURE 7.4-6 Jean Schoonover Quality Award
Best Competitor
Source: State of Idaho Bureau of Facility Standards
KNRMV
Won
Award
YES
NO
2013 2014 2015 2012 2011 2010 2009
Didn’t
Win
Better
2016 2017 2018 Projections
Best Possible Performance
FIGURE 7.4-5 Employee Survey Leadership
"Senior Management is interested in the well-being of employees"
100%
2013 2014 2015
80%
60%
40%
20%
Better
2016
NWD KND BCC KNRMV
FIGURE 7.4-4 Employee Survey Leadership
"I am confident Senior Management is leading us
in the right direction for future success"
100%
2013 2014 2015
80%
60%
40%
20%
Better
2016
NWD KND BCC KNRMV
"Senior Management shows by it actions that patient care
is a top priority at my organization"
FIGURE 7.4-3 Employee Survey Leadership
100%
2013 2014 2015
80%
60%
40%
20%
Better
2016
NWD KND BCC KNRMV
FIGURE 7.4-2 Employee Survey Leadership
"Senior Management is trustworthy"
100%
2013 2014 2015
80%
60%
40%
20%
Better
2016
NWD KND BCC KNRMV
"Senior Management has communicated a clear vision
for KNRMV’s future success"
FIGURE 7.4-1 Employee Survey Leadership
100%
2013 2014 2015
80%
60%
40%
20%
Better
2016
NWD KND BCC KNRMV
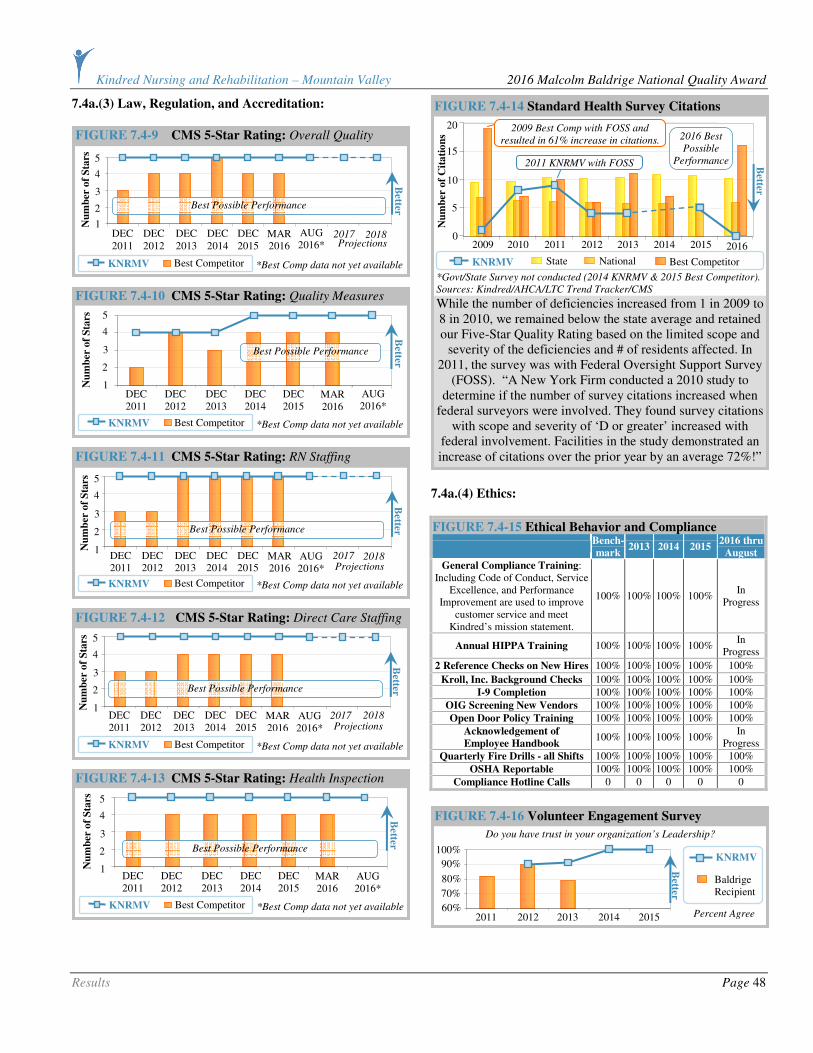
Kindred Nursing and Rehabilitation – Mountain Valley 2016 Malcolm Baldrige National Quality Award
Results Page 48
7.4a.(3) Law, Regulation, and Accreditation:
7.4a.(4) Ethics:
FIGURE 7.4-15 Ethical Behavior and Compliance
Bench-
mark 2013 2014 2015
2016 thru
August
General Compliance Training: Including Code of Conduct, Service
Excellence, and Performance Improvement are used to improve
customer service and meet Kindred’s mission statement.
100% 100% 100% 100% In
Progress
Annual HIPPA Training 100% 100% 100% 100% In
Progress
2 Reference Checks on New Hires 100% 100% 100% 100% 100%
Kroll, Inc. Background Checks 100% 100% 100% 100% 100%
I-9 Completion 100% 100% 100% 100% 100%
OIG Screening New Vendors 100% 100% 100% 100% 100%
Open Door Policy Training 100% 100% 100% 100% 100%
Acknowledgement of
Employee Handbook 100% 100% 100% 100%
In Progress
Quarterly Fire Drills - all Shifts 100% 100% 100% 100% 100%
OSHA Reportable 100% 100% 100% 100% 100%
Compliance Hotline Calls 0 0 0 0 0
FIGURE 7.4-16 Volunteer Engagement Survey
100%
2011 2012 2013 2014 2015
90%
80%
70%
60%
Baldrige Recipient
Percent Agree
Better
KNRMV
Do you have trust in your organization’s Leadership?
While the number of deficiencies increased from 1 in 2009 to 8 in 2010, we remained below the state average and retained our Five-Star Quality Rating based on the limited scope and
severity of the deficiencies and # of residents affected. In 2011, the survey was with Federal Oversight Support Survey
(FOSS). “A New York Firm conducted a 2010 study to determine if the number of survey citations increased when
federal surveyors were involved. They found survey citations with scope and severity of ‘D or greater’ increased with
federal involvement. Facilities in the study demonstrated an increase of citations over the prior year by an average 72%!”
FIGURE 7.4-14 Standard Health Survey Citations
KNRMV State National
*Govt/State Survey not conducted (2014 KNRMV & 2015 Best Competitor).
Sources: Kindred/AHCA/LTC Trend Tracker/CMS
Best Competitor
2009
20
2011 2012 2013 2014*
2015*
2010
15
10
5
0
Nu
mb
er o
f C
ita
tio
ns
2011 KNRMV with FOSS
2009 Best Comp with FOSS and
resulted in 61% increase in citations.
Better
2016
2016 Best
Possible
Performance
FIGURE 7.4-13 CMS 5-Star Rating: Health Inspection
Best Competitor KNRMV *Best Comp data not yet available
5
4
3
2
1 Nu
mb
er o
f S
tars
DEC 2011
DEC 2012
DEC 2013
DEC 2014
DEC 2015
MAR 2016
Better
AUG 2016*
Best Possible Performance
FIGURE 7.4-12 CMS 5-Star Rating: Direct Care Staffing
Best Competitor KNRMV *Best Comp data not yet available
5
4
3
2
1 Nu
mb
er o
f S
tars
DEC 2011
DEC 2012
DEC 2013
DEC 2014
DEC 2015
MAR 2016
Better
AUG 2016*
2017
2018
Projections
Best Possible Performance
FIGURE 7.4-11 CMS 5-Star Rating: RN Staffing
Best Competitor KNRMV *Best Comp data not yet available
5
4
3
2
1 Nu
mb
er o
f S
tars
DEC 2011
DEC 2012
DEC 2013
DEC 2014
DEC 2015
MAR 2016
Better
AUG 2016*
2017
2018
Projections
Best Possible Performance
FIGURE 7.4-10 CMS 5-Star Rating: Quality Measures
Best Competitor KNRMV *Best Comp data not yet available
DEC 2011
DEC 2012
DEC 2013
DEC 2014
DEC 2015
5
4
3
2
1 Nu
mb
er o
f S
tars
MAR 2016
Better
AUG 2016*
Best Possible Performance
FIGURE 7.4-9 CMS 5-Star Rating: Overall Quality
Best Competitor KNRMV
5
4
3
2
1 Nu
mb
er o
f S
tars
DEC 2011
DEC 2012
DEC 2013
DEC 2014
DEC 2015
MAR 2016
AUG 2016*
Better
2017
2018
Projections
*Best Comp data not yet available
Best Possible Performance

Kindred Nursing and Rehabilitation – Mountain Valley 2016 Malcolm Baldrige National Quality Award
Results Page 49
7.4a.(5) Society: As demonstrated in Figure 7.4-17, the SMC Foundation Summer Wine even is a fundraiser for the community to improve the health and wellbeing of the community. For example, in 2014 the money raised was used to create a wellness/fitness park for the community. In 2015, the money was used to promote the SAVE program (see Figure 7.4-18). We became involved with SAVE in 2015 when one of our resident’s grandson committed suicide. He was also a classmate to several of our senior leaders and staff members. We then began to pay more attention to this scenario and realized, as a community, we have an issue. We felt we needed to be more involved as a community healthcare leader and member. We created a website for our community listing contacts, bi-monthly newspaper articles for community education, a Facebook page, and now working on billboards that will be on the east end and west end of Kellogg.
FIGURE 7.4-19 Support of Community Event Dates
Job Fair 2013 – 2016
4th of July Celebration 2009 – 2016
Christmas Lighting Ceremony *In progress 2009 – 2015*
Farmers Market 2015 – 2016
Community
Events
Silver Hoops Basketball 2009 – 2016
Website (VisitNorthIdaho.org) 2013 – 2016
Weekly Calendar Preparation 2013 – 2016
Relocation Packages 2014 – 2016 Tourism
Image Study 2015 – 2016
Welcome Wagon 2015 – 2016
Heritage Health (Medical and Dental Outreach Clinics)
2014 – 2016
DSI (Dialysis Center) 2013 – 2016
Dental Providers (two new dentists) 2015 – 2016
Business
Promotion
Mobile Mammogram Unit 2014 – 2016
7.4b. Strategy Implementation Results:
The discipline of the senior leaders and cycles of evaluation and improvement of strategy implementation processes at KNRMV is reflected in our increasing ability to successfully complete action plans associated with our strategic objectives.
7.5 Financial and Market Results
7.5a. Financial and Market Results:
7.5a.(1) Financial Performance: Despite a challenging economic environment in general and exacerbated in the health care sector, KNRMV demonstrates strong financial and market place performance.
Figure 7.5-3, in 2008, we wrote off $21,000 that was a secured lien. However, when the spouse of the resident went on Medicaid, their claim took precedence over ours, so the bad debt returned to our balance sheet. Even with this unexpected “hit,” we still were able to perform better than Kindred’s target.
FIGURE 7.5-3 Bad Debt (% Revenue)
KND Target
KNRMV
Source: KND
Business Warehouse
(balanced scorecard)
4%
2013 2014 2015
3%
2%
1%
0% 2012 2011
Better
2016 thru August
FIGURE 7.5-2 Average Wage Rate
Source: KND
Business
Warehouse
Across the board raises for CNAs 02/2015 and RNs 08/2015.
KND Target
KNRMV $19
2013 2014 2015
$17
$15
$13
$11 2012
Do
llar
Am
ou
nt
2011
Better
2016 thru August
FIG 7.5-1 Medicare Key Metric % of A: Total RUG Mix
Source:
Kindred Business
Warehouse
NWD
KNRMV 80%
2013 2014 2015
60%
40%
20%
0% 2012
Better
2016 thru August
FIGURE 7.4-20 Successful Completion of Action Plans
Source: Kindred
Internal Data. No
benchmark data
available.
KNRMV 100%
2015 2012
75%
50%
25%
0 2013 2014
Better
2016 thru August
2016 Best Possible
Performance
FIGURE 7.4-18 Suicide Awareness Voices of Education
2002-04 2005-07 2008-10
Shoshone
County
State of Idaho
United States
Source: Span Idaho and Idaho Department of Health and Welfare Bureau
of Vital Records and Health Statistics.
Suicide Rates per 100,000 People 40
30
20
10
0 2011-14
(SAVE)
Better
FIGURE 7.4-17 SMC Foundation Summer Wine
No benchmark
available.
Net Profit
after Expense
$25,000
2013 2014 2015
$20,000
$15,000
$10,000
$5,000 2012 2011
Better
2016

Kindred Nursing and Rehabilitation – Mountain Valley 2016 Malcolm Baldrige National Quality Award
Results Page 50
As shown in Figure 7.5-6, our 2016 Medicare census was impacted by the change in the population; they were more independent (ambulatory) with dementia and required less rehabilitation therapy, resulting in lower reimbursement.
As shown in Figure 7.5-10, the 2016 private pay census declined because they completed their Medicaid spend down; as a result, we exceeded three average daily census (ADC) in Medicaid.
7.5a.(2) Marketplace Performance: Market share is a difficult measure for the long-term care industry because the geographic market may not represent the true market. For example, residents may be placed in a facility based on where their family members live rather than where the resident’s home was. As a result, most long-term care facilities use occupancy rate as a surrogate measure of market share. As the result below shows, we significantly outperform the state and national benchmarks. Our CMS 5-Star rating, excellent customer satisfaction, and low staff turnover all contribute to our high occupancy rate. For example, we are admitting a resident from California whose daughter conducted an internet search and toured our facility. The daughter, who lives in Coeur d’Alene, chose our facility as the next home for her mother.
FIGURE 7.5-11 Occupancy Rate
Sources: Kindred /AHCA. *National data not yet available.
National State KNRMV
100%
2013 2014 2015
90%
80%
70%
60%
2012 2011 2016 2010
Better
2016 2017 2018 Projections thru
March August* thru
FIGURE 7.5-10 Private Pay Census
No benchmark
data available.
Budget
KNRMV
16
2013 2014 2015
12
8
4
0 2012 2011 2016 thru August 2010
Better
Av
erag
e D
ail
y C
ensu
s
FIGURE 7.5-9 EBIDTARM Margin
No benchmark
data available.
Budget
KNRMV 40%
‘12 ‘13 ‘14
30%
20%
10%
0% ‘11 ‘10 ‘15 2009
Better
2016 thru August
Exceeded Budget when August
2016 numbers were finalized.
FIGURE 7.5-8 Medicaid Revenue
Sources:
Kindred, AHCA.
*National data
not available.
National
Budget
KNRMV $300
$250
$200
$150
$100
‘13 ‘14 ‘15* ‘12 ‘11 2010
Better
‘16* ‘17
‘18
Projections
FIGURE 7.5-7 Medicare Part B Revenue
Source:
Kindred Business
Warehouse
Budget
KNRMV $24
2013 2014 2015
$18
$12
$6
$0 2012
Better
2016 thru August
August 2016
exceeded Budget
FIGURE 7.5-6 Medicare Revenue
No benchmark
data available.
*2016 thru August
Budget
KNRMV $45
0
‘13 ‘14 ‘15
$410
$370
$330
$290 ‘12 ‘11 2010
Better
‘16* ‘17
‘18
Projections
FIGURE 7.5-5 Total Net Revenue
No benchmark
data available.
Budget
KNRMV
$310
2013 2014 2015
$270
$230
$190
$150 2012 2011 2010
Better
2016 thru August
FIGURE 7.5-4 M2 Mix Percent
Source: KND Business
Warehouse (balanced
scorecard). Measuring
started in 2015.
KND Target
KNRMV 20%
Q3 2015
Q4 2015
15%
10%
5%
0% Q2
2015 Q1
2015
Better
Q1 2016
Q2 2016


