28
17 th November 2020 Vantage Towers Understanding our financials and growth drivers | Medium-term guidance Thomas Reisten, Chief Financial Officer

17th November 2020
Vantage Towers Understanding our financials and growth drivers | Medium-term guidance Thomas Reisten, Chief Financial Officer

Understanding our financials and growth drivers

Agenda
3
Portfolio overview 2
Introduction and key investment highlights 1
ESG 4
Market backdrop and commercial focus 5
Understanding our financials and growth drivers 6
Contracts, organisation and operations 3
Conclusion and Q&A

Medium-term guidance

5
Key financial highlights | Highly visible growth and cash flows
Highly secure cash flows underpinned by long-term, inflation-linked Vodafone MSAs 1
Investment grade balance sheet, providing capacity for strategic growth investments and attractive shareholder returns
4
Margin upside from operating leverage and cost base optimisation, including a ground lease optimisation programme
3
Strong topline growth from committed new site programme, long-term preferred supplier status and clear strategy to drive tenancy growth
2
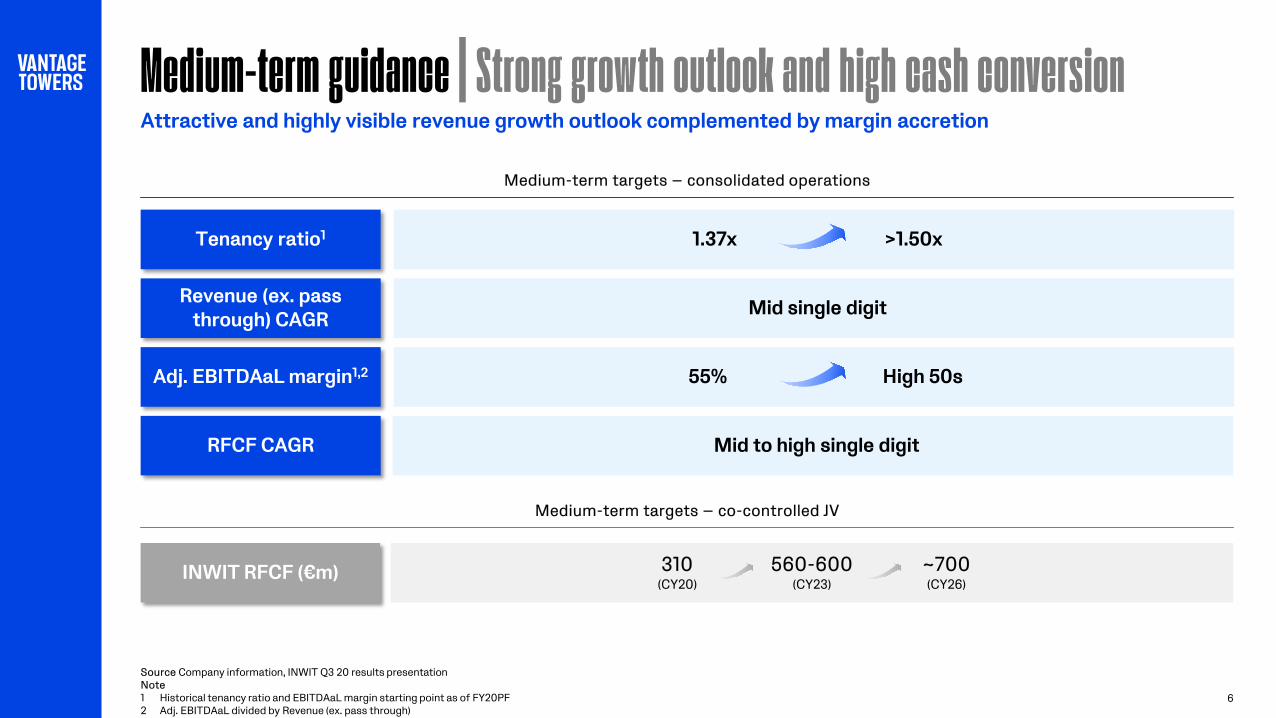
Medium-term guidance | Strong growth outlook and high cash conversion
6
Attractive and highly visible revenue growth outlook complemented by margin accretion
Medium-term targets — consolidated operations
Medium-term targets — co-controlled JV
Revenue (ex. pass through) CAGR Mid single digit
RFCF CAGR Mid to high single digit
Adj. EBITDAaL margin1,2 55% High 50s
Tenancy ratio1 1.37x >1.50x
INWIT RFCF (€m) 310 (CY20)
~700 (CY26)
560-600 (CY23)
Source Company information, INWIT Q3 20 results presentation Note 1 Historical tenancy ratio and EBITDAaL margin starting point as of FY20PF 2 Adj. EBITDAaL divided by Revenue (ex. pass through)
Margin improvement
New tenancies
Ground lease optimisation
Cost efficiency programmes
7
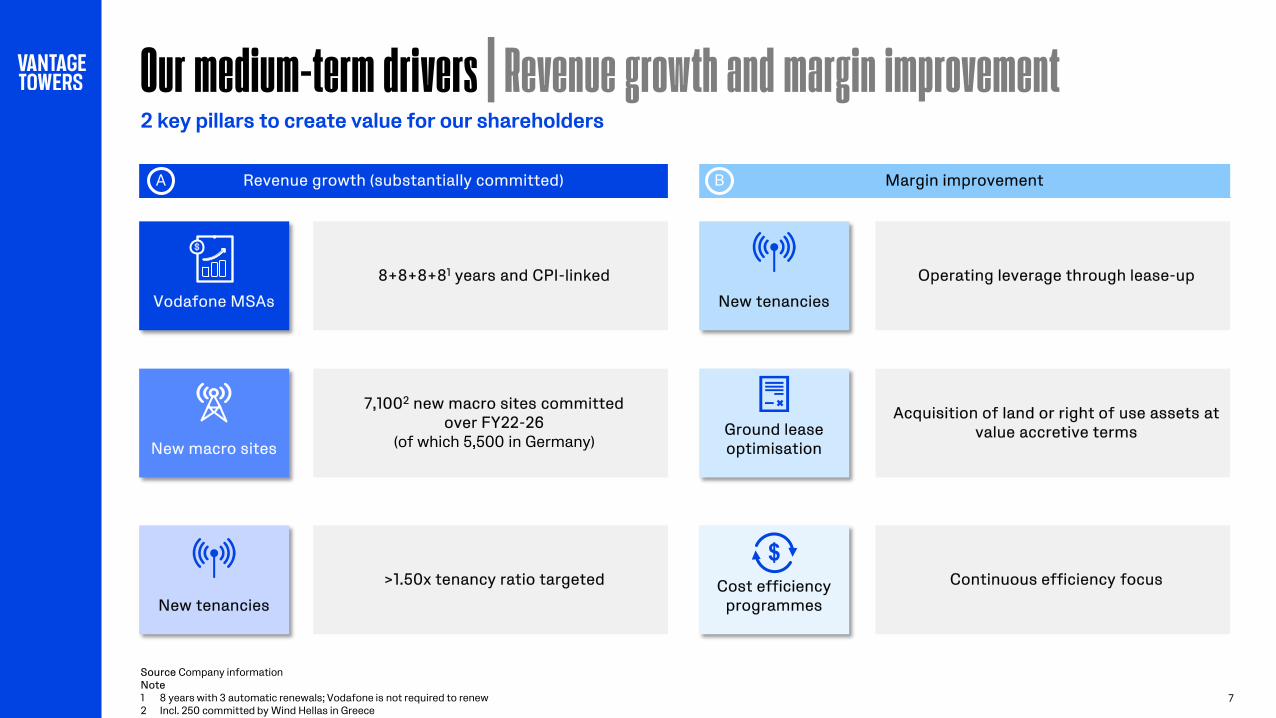
Revenue growth (substantially committed)
2 key pillars to create value for our shareholders
A B
Vodafone MSAs
New macro sites
New tenancies
8+8+8+81 years and CPI-linked
7,1002 new macro sites committed over FY22-26
(of which 5,500 in Germany)
>1.50x tenancy ratio targeted
Operating leverage through lease-up
Acquisition of land or right of use assets at value accretive terms
Continuous efficiency focus
Our medium-term drivers | Revenue growth and margin improvement
$
Source Company information Note 1 8 years with 3 automatic renewals; Vodafone is not required to renew 2 Incl. 250 committed by Wind Hellas in Greece
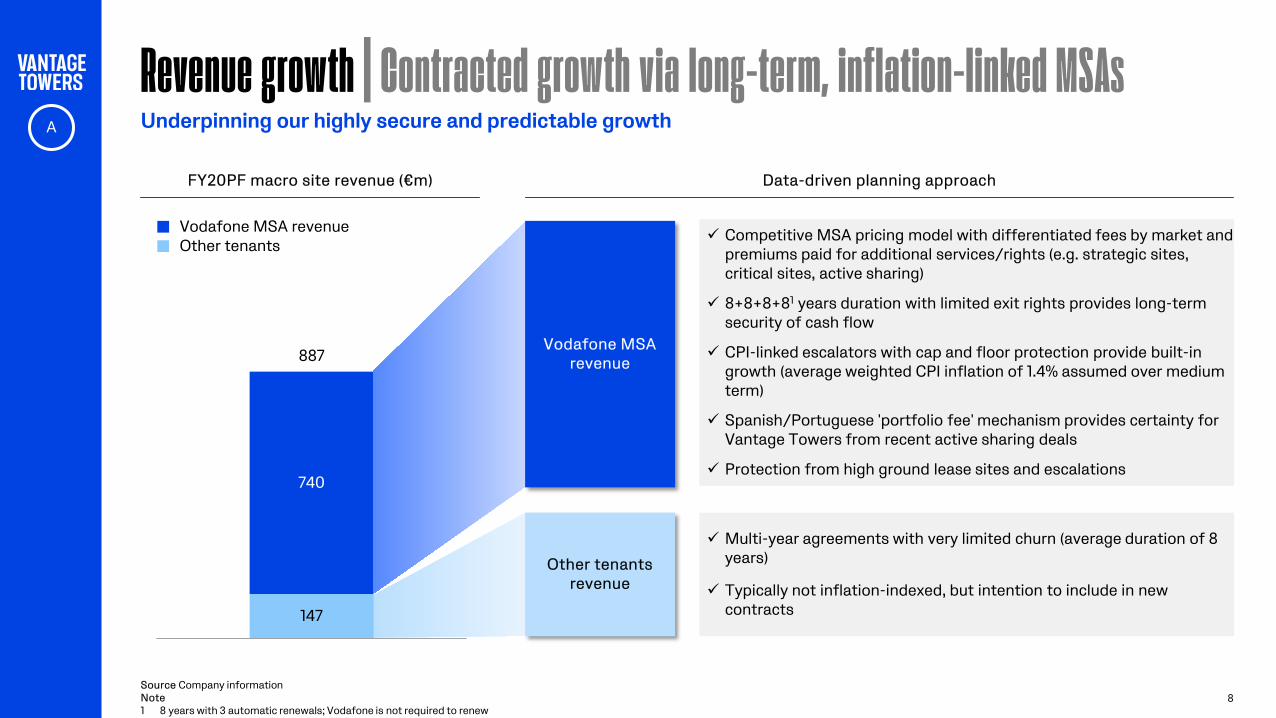
Revenue growth | Contracted growth via long-term, inflation-linked MSAs
8
Underpinning our highly secure and predictable growth A
147
740
887
Category 1
FY20PF macro site revenue (€m) Data-driven planning approach
Vodafone MSA revenue Other tenants
Other tenants revenue
Multi-year agreements with very limited churn (average duration of 8 years)
Typically not inflation-indexed, but intention to include in new contracts
Vodafone MSA revenue
Competitive MSA pricing model with differentiated fees by market and premiums paid for additional services/rights (e.g. strategic sites, critical sites, active sharing)
8+8+8+81 years duration with limited exit rights provides long-term security of cash flow
CPI-linked escalators with cap and floor protection provide built-in growth (average weighted CPI inflation of 1.4% assumed over medium term)
Spanish/Portuguese 'portfolio fee' mechanism provides certainty for Vantage Towers from recent active sharing deals
Protection from high ground lease sites and escalations
Source Company information Note 1 8 years with 3 automatic renewals; Vodafone is not required to renew
9
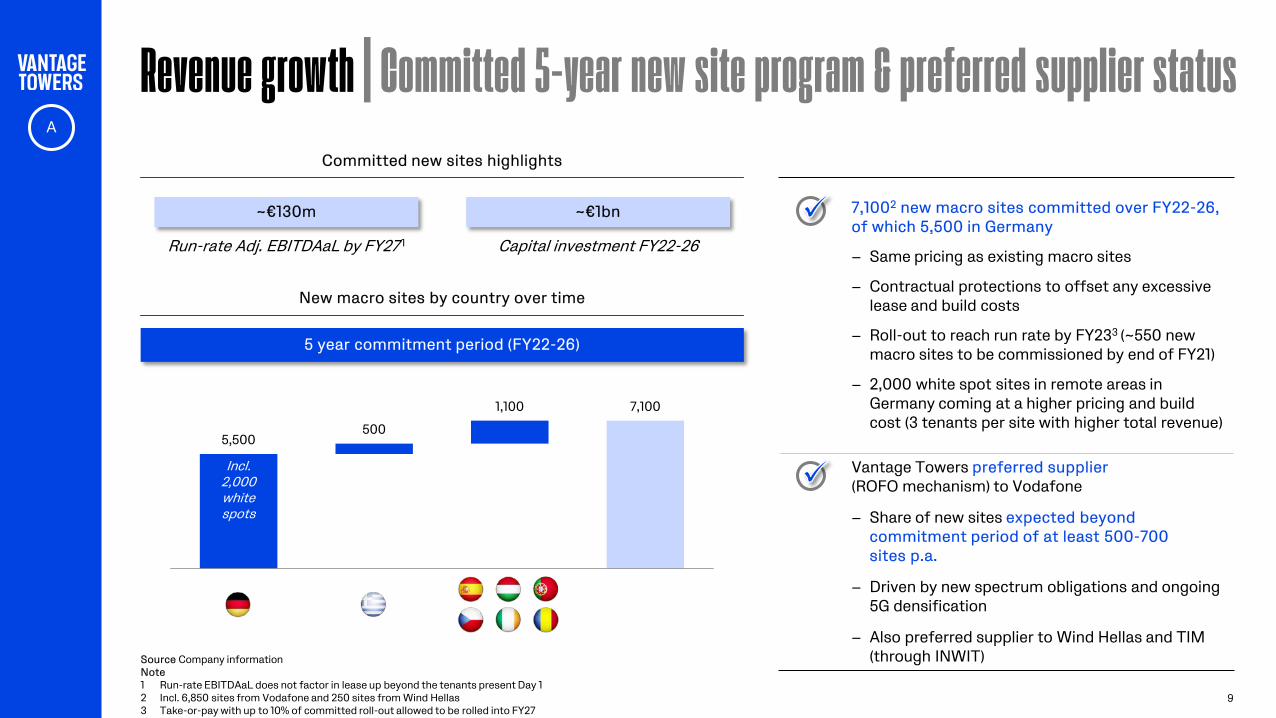
Committed new sites highlights
Revenue growth | Committed 5-year new site program & preferred supplier status
A
7,1002 new macro sites committed over FY22-26, of which 5,500 in Germany
− Same pricing as existing macro sites
− Contractual protections to offset any excessive lease and build costs
− Roll-out to reach run rate by FY233 (~550 new macro sites to be commissioned by end of FY21)
− 2,000 white spot sites in remote areas in Germany coming at a higher pricing and build cost (3 tenants per site with higher total revenue)
Vantage Towers preferred supplier (ROFO mechanism) to Vodafone
− Share of new sites expected beyond commitment period of at least 500-700 sites p.a.
− Driven by new spectrum obligations and ongoing 5G densification
− Also preferred supplier to Wind Hellas and TIM (through INWIT)
Run-rate Adj. EBITDAaL by FY27 1
~€130m
Capital investment FY22-26
~€1bn
New macro sites by country over time
5,500 500
1,100 7,100
Germany Greece Other Total
5 year commitment period (FY22-26)
Incl. 2,000 white spots
Source Company information Note 1 Run-rate EBITDAaL does not factor in lease up beyond the tenants present Day 1 2 Incl. 6,850 sites from Vodafone and 250 sites from Wind Hellas 3 Take-or-pay with up to 10% of committed roll-out allowed to be rolled into FY27

221
311 57 12 22
Revenue growth | Clear focus on driving uncommitted new tenancy growth
10
Structural tailwinds expected to add ~90k new market tenancies in our footprint1
A
Data-driven planning approach
Key opportunities Assessing demand for uncommitted tenancies
Other2 FY20 FY30
CAGR: 3.5%
Coverage obligations Active sharing Supporting challengers
6k white spot tenancies 1.2k net tenancies3 secured
Preferred supplier for new Vodafone sites
Tenancy potential on our towers
Geo-location analysis
Coverage Densification Other
Non-Vodafone tenancy revenue is a key management incentive KPI €
1&1 Iliad MasMovil
Commercial focus and geolocation analysis to target new tenancy opportunities
Source Company information, Analysys Mason Note 1 Based on Analysys Mason PoPs forecast for all markets where Vantage Towers is present (excluding Italy) 2 Includes Greece and Other European Markets 3 Including ~0.7k sites decommissioned as part of the active sharing agreement. Does not include additional ~0.2k sites to be decommissioned in Spain
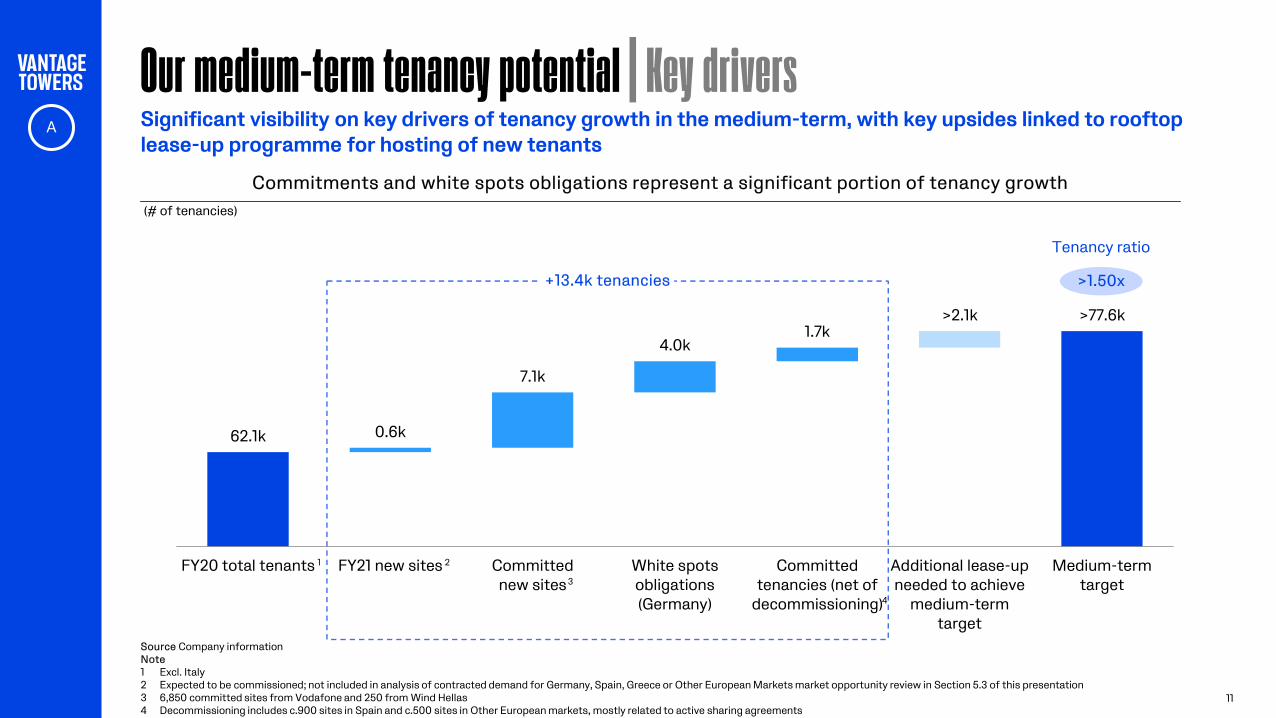
62.1k 0.6k
7.1k
4.0k 1.7k
>2.1k >77.6k
FY20 total tenants FY21 new sites Committednew sites
White spotsobligations(Germany)
Committedtenancies (net of
decommissioning)
Additional lease-upneeded to achieve
medium-termtarget
Medium-termtarget
Our medium-term tenancy potential | Key drivers
11
Significant visibility on key drivers of tenancy growth in the medium-term, with key upsides linked to rooftop lease-up programme for hosting of new tenants
>1.50x
Tenancy ratio
(# of tenancies)
Commitments and white spots obligations represent a significant portion of tenancy growth
1
Source Company information Note 1 Excl. Italy 2 Expected to be commissioned; not included in analysis of contracted demand for Germany, Spain, Greece or Other European Markets market opportunity review in Section 5.3 of this presentation 3 6,850 committed sites from Vodafone and 250 from Wind Hellas 4 Decommissioning includes c.900 sites in Spain and c.500 sites in Other European markets, mostly related to active sharing agreements
+13.4k tenancies
3
4
2
A
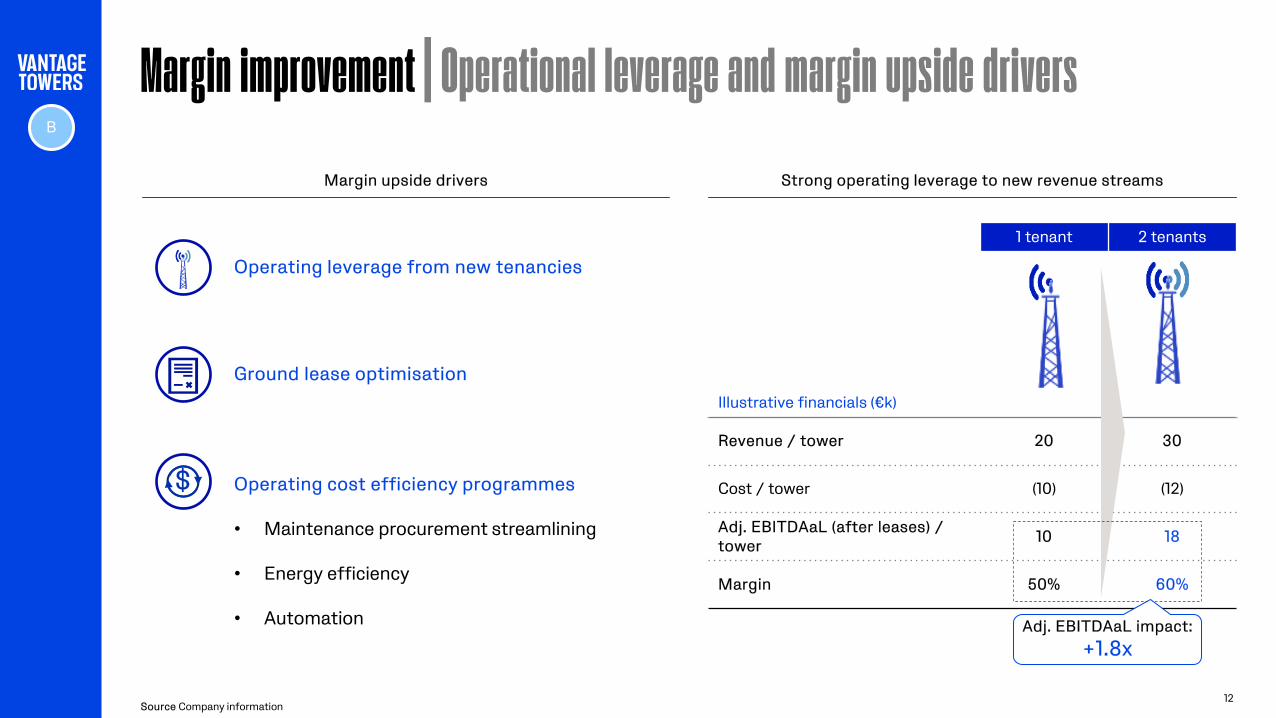
Margin improvement | Operational leverage and margin upside drivers
12
1 tenant 2 tenants
Illustrative financials (€k)
Revenue / tower 20 30
Cost / tower (10) (12)
Adj. EBITDAaL (after leases) / tower 10 18
Margin 50% 60%
Strong operating leverage to new revenue streams Margin upside drivers
Ground lease optimisation
Operating cost efficiency programmes
• Maintenance procurement streamlining
• Energy efficiency
• Automation
Operating leverage from new tenancies
$
B
Source Company information
Adj. EBITDAaL impact: +1.8x
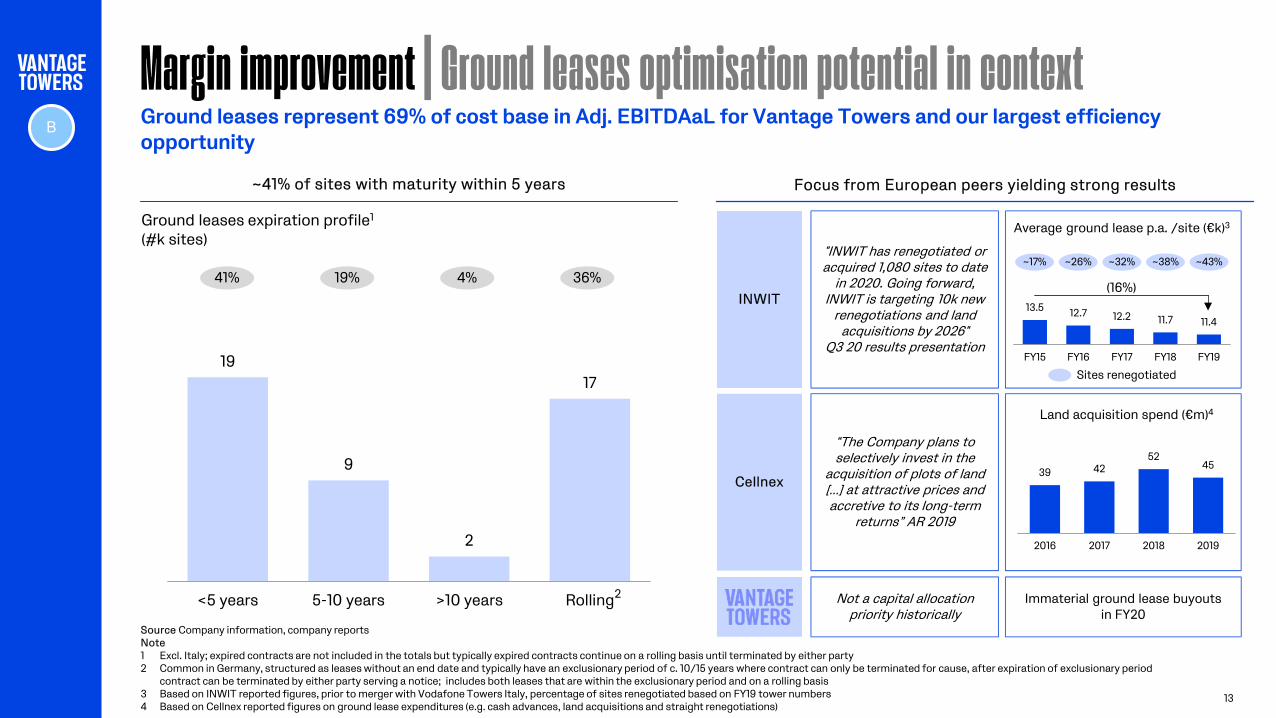
Margin improvement | Ground leases optimisation potential in context
13
INWIT
Cellnex 39 42
52 45
2016 2017 2018 2019
Land acquisition spend (€m)4
13.5 12.7 12.2 11.7 11.4
FY15 FY16 FY17 FY18 FY19
Average ground lease p.a. /site (€k)3
~17%
Sites renegotiated
“The Company plans to selectively invest in the
acquisition of plots of land […] at attractive prices and accretive to its long-term
returns” AR 2019
"INWIT has renegotiated or acquired 1,080 sites to date
in 2020. Going forward, INWIT is targeting 10k new
renegotiations and land acquisitions by 2026"
Q3 20 results presentation
Focus from European peers yielding strong results
(16%)
~26% ~32% ~38% ~43%
Ground leases represent 69% of cost base in Adj. EBITDAaL for Vantage Towers and our largest efficiency opportunity
19
9
2
17
<5 years 5-10 years >10 years Rolling
19% 4% 41%
~41% of sites with maturity within 5 years
Ground leases expiration profile1
(#k sites)
B
Not a capital allocation priority historically
Immaterial ground lease buyouts in FY20
Source Company information, company reports Note 1 Excl. Italy; expired contracts are not included in the totals but typically expired contracts continue on a rolling basis until terminated by either party 2 Common in Germany, structured as leases without an end date and typically have an exclusionary period of c. 10/15 years where contract can only be terminated for cause, after expiration of exclusionary period
contract can be terminated by either party serving a notice; includes both leases that are within the exclusionary period and on a rolling basis 3 Based on INWIT reported figures, prior to merger with Vodafone Towers Italy, percentage of sites renegotiated based on FY19 tower numbers 4 Based on Cellnex reported figures on ground lease expenditures (e.g. cash advances, land acquisitions and straight renegotiations)
36%
2
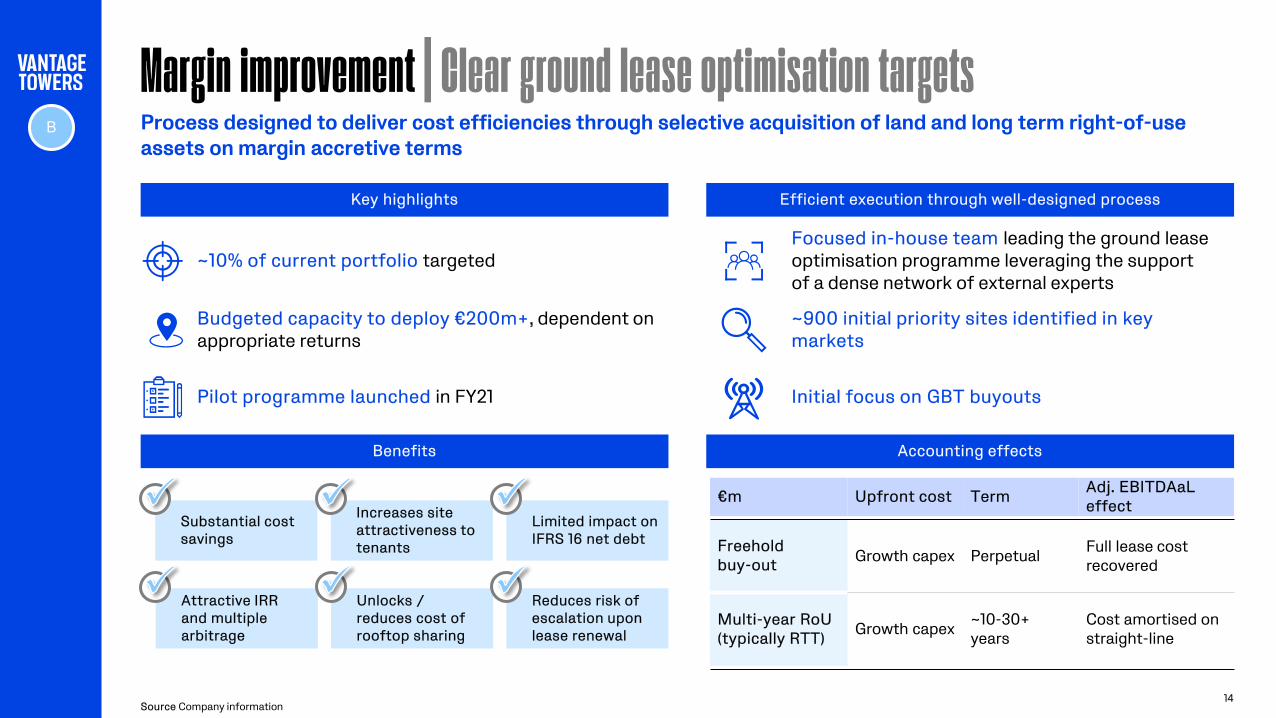
Margin improvement | Clear ground lease optimisation targets Process designed to deliver cost efficiencies through selective acquisition of land and long term right-of-use assets on margin accretive terms
Source Company information
Key highlights
Accounting effects
14
Attractive IRR and multiple arbitrage
Substantial cost savings
Benefits
Unlocks / reduces cost of rooftop sharing
Increases site attractiveness to tenants
Reduces risk of escalation upon lease renewal
Limited impact on IFRS 16 net debt
B
Efficient execution through well-designed process
~10% of current portfolio targeted Focused in-house team leading the ground lease optimisation programme leveraging the support of a dense network of external experts
Budgeted capacity to deploy €200m+, dependent on appropriate returns
~900 initial priority sites identified in key markets
€m Upfront cost Term Adj. EBITDAaL effect
Freehold buy-out Growth capex Perpetual Full lease cost
recovered
Multi-year RoU (typically RTT) Growth capex ~10-30+
years Cost amortised on straight-line
Pilot programme launched in FY21 Initial focus on GBT buyouts
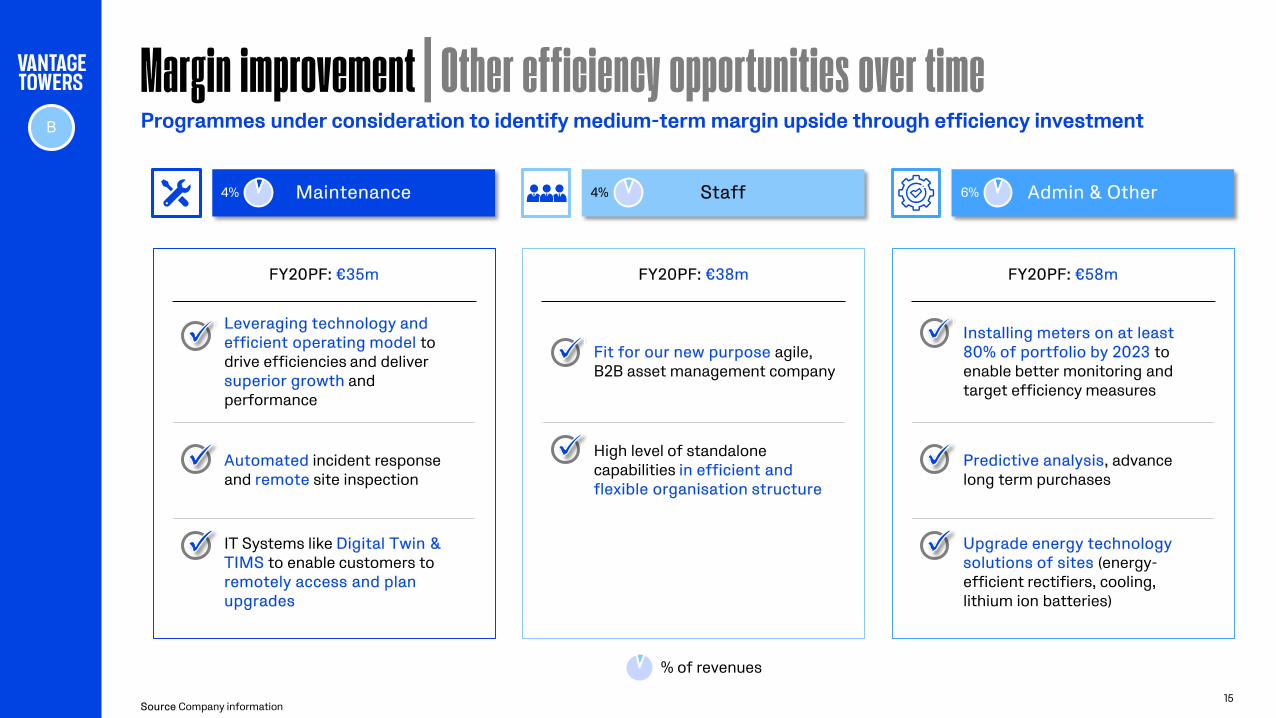
Margin improvement | Other efficiency opportunities over time
15
Source Company information
Programmes under consideration to identify medium-term margin upside through efficiency investment
Maintenance Staff Admin & Other
FY20PF: €35m FY20PF: €38m FY20PF: €58m
Leveraging technology and efficient operating model to drive efficiencies and deliver superior growth and performance
Automated incident response and remote site inspection
IT Systems like Digital Twin & TIMS to enable customers to remotely access and plan upgrades
Installing meters on at least 80% of portfolio by 2023 to enable better monitoring and target efficiency measures
Predictive analysis, advance long term purchases
Upgrade energy technology solutions of sites (energy-efficient rectifiers, cooling, lithium ion batteries)
B
4% 4% 6%
% of revenues
Fit for our new purpose agile, B2B asset management company
High level of standalone capabilities in efficient and flexible organisation structure
16
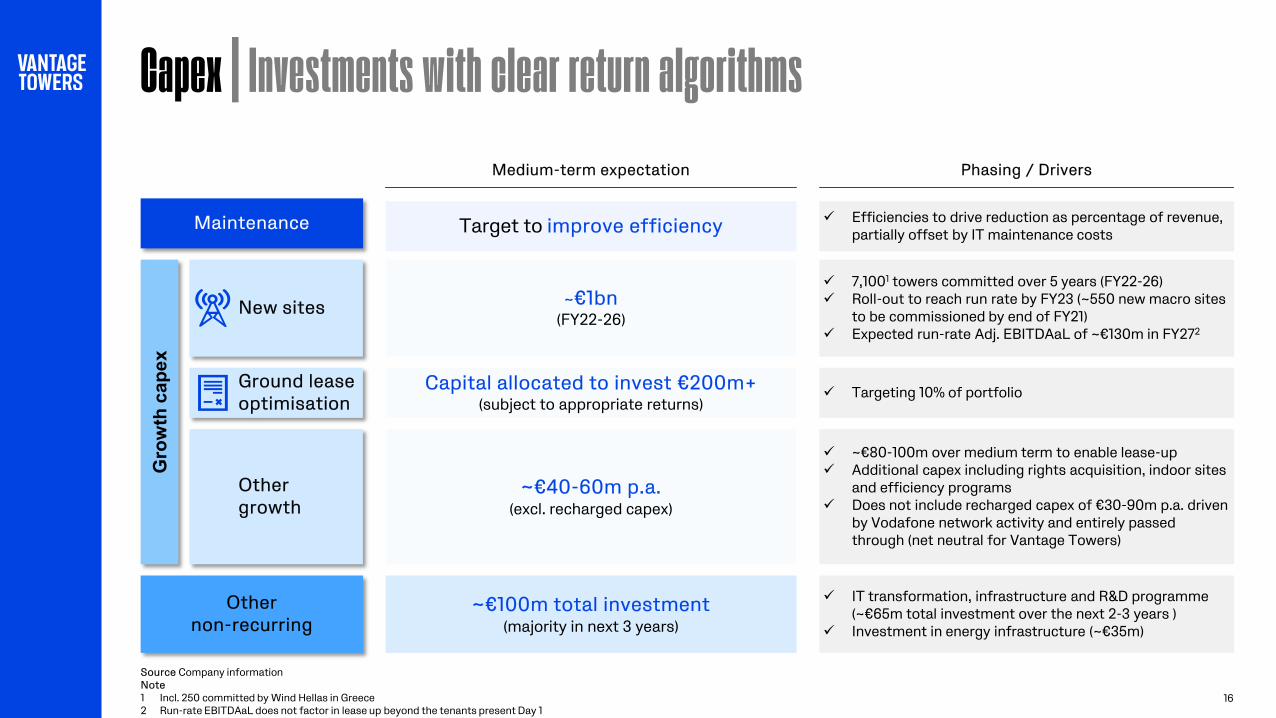
Medium-term expectation Phasing / Drivers
Other non-recurring
~€100m total investment (majority in next 3 years)
IT transformation, infrastructure and R&D programme (~€65m total investment over the next 2-3 years )
Investment in energy infrastructure (~€35m)
Capex | Investments with clear return algorithms
New sites ~€1bn (FY22-26)
7,1001 towers committed over 5 years (FY22-26) Roll-out to reach run rate by FY23 (~550 new macro sites
to be commissioned by end of FY21) Expected run-rate Adj. EBITDAaL of ~€130m in FY272
Ground lease optimisation
Capital allocated to invest €200m+ (subject to appropriate returns)
Targeting 10% of portfolio
Gro
wth
cap
ex
Other growth
~€80-100m over medium term to enable lease-up Additional capex including rights acquisition, indoor sites
and efficiency programs Does not include recharged capex of €30-90m p.a. driven
by Vodafone network activity and entirely passed through (net neutral for Vantage Towers)
~€40-60m p.a. (excl. recharged capex)
Maintenance Target to improve efficiency Efficiencies to drive reduction as percentage of revenue, partially offset by IT maintenance costs
Source Company information Note 1 Incl. 250 committed by Wind Hellas in Greece 2 Run-rate EBITDAaL does not factor in lease up beyond the tenants present Day 1
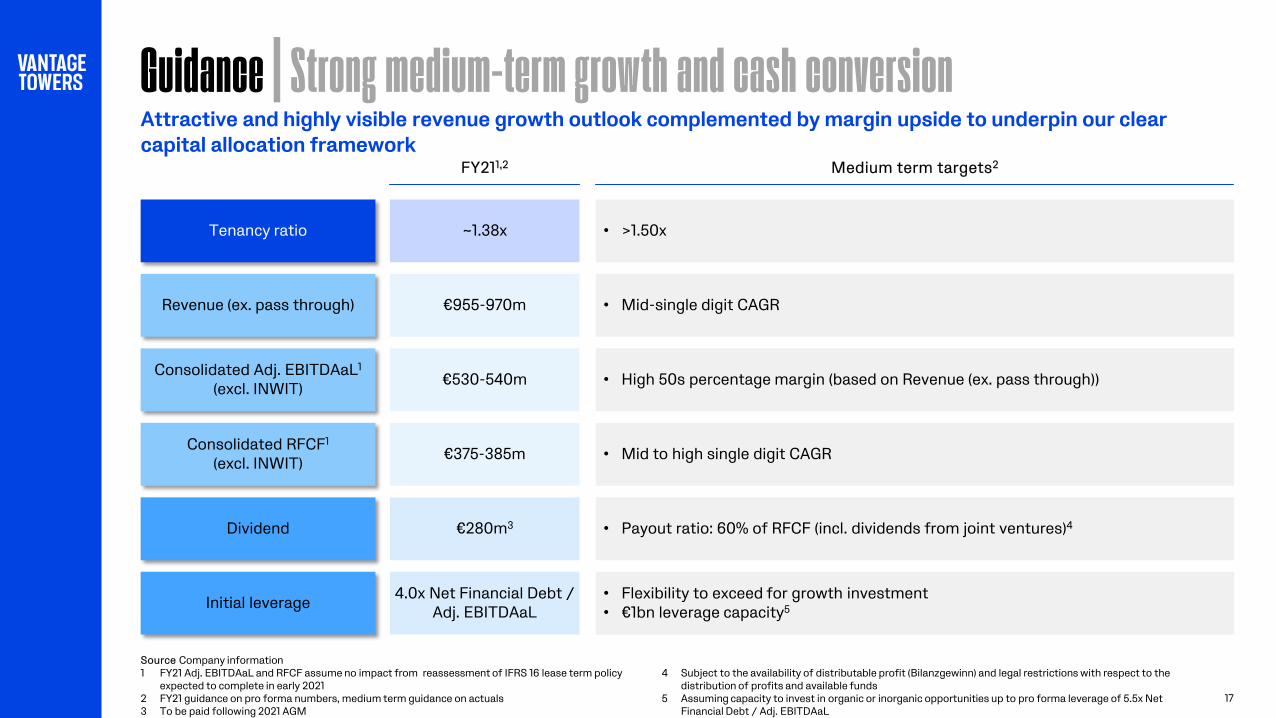
Guidance | Strong medium-term growth and cash conversion
17
FY211,2 Medium term targets2
Dividend €280m3 • Payout ratio: 60% of RFCF (incl. dividends from joint ventures)4
~1.38x Tenancy ratio • >1.50x
€955-970m Revenue (ex. pass through) • Mid-single digit CAGR
Consolidated Adj. EBITDAaL1 (excl. INWIT) €530-540m • High 50s percentage margin (based on Revenue (ex. pass through))
Consolidated RFCF1
(excl. INWIT) €375-385m • Mid to high single digit CAGR
Initial leverage 4.0x Net Financial Debt / Adj. EBITDAaL
• Flexibility to exceed for growth investment • €1bn leverage capacity5
Source Company information 1 FY21 Adj. EBITDAaL and RFCF assume no impact from reassessment of IFRS 16 lease term policy
expected to complete in early 2021 2 FY21 guidance on pro forma numbers, medium term guidance on actuals 3 To be paid following 2021 AGM
4 Subject to the availability of distributable profit (Bilanzgewinn) and legal restrictions with respect to the
distribution of profits and available funds 5 Assuming capacity to invest in organic or inorganic opportunities up to pro forma leverage of 5.5x Net
Financial Debt / Adj. EBITDAaL
Attractive and highly visible revenue growth outlook complemented by margin upside to underpin our clear capital allocation framework
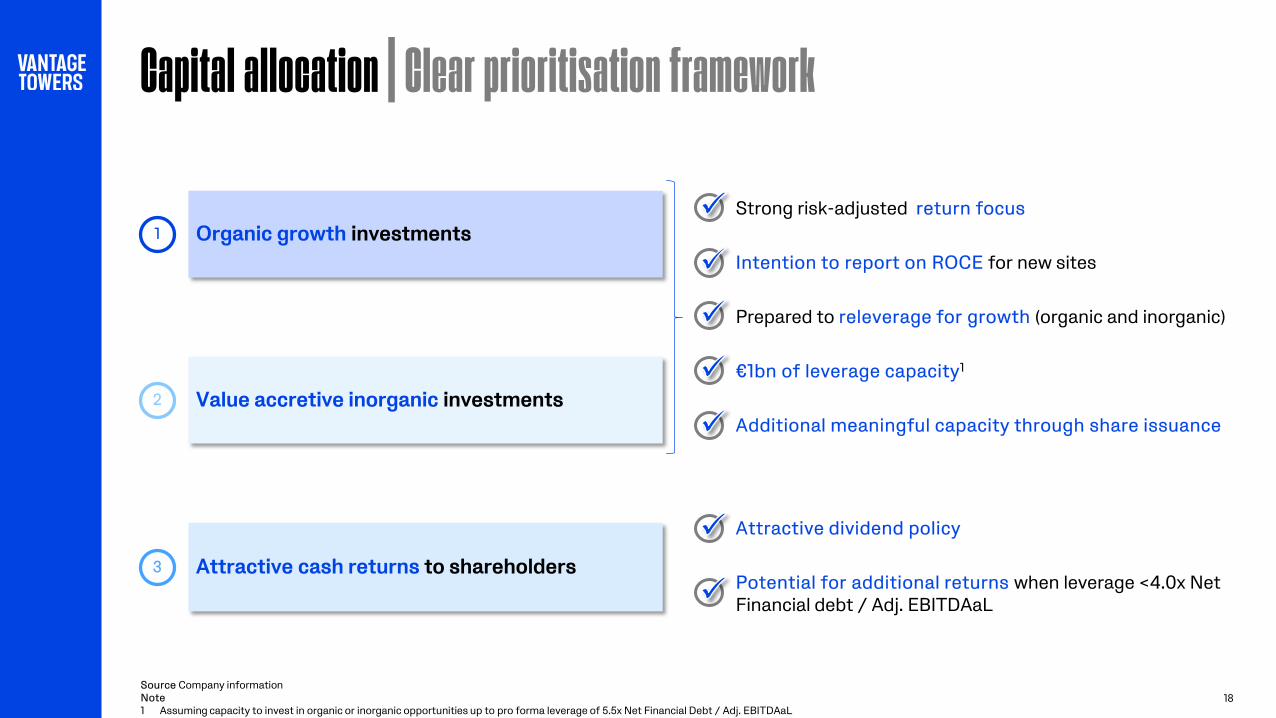
Capital allocation | Clear prioritisation framework
18
Organic growth investments
Value accretive inorganic investments
Attractive cash returns to shareholders
• Strong risk-adjusted return focus
• Intention to report on ROCE for new sites
• Prepared to releverage for growth (organic and inorganic)
• €1bn of leverage capacity1
• Additional meaningful capacity through share issuance
1
3
2
• Attractive dividend policy
• Potential for additional returns when leverage <4.0x Net Financial debt / Adj. EBITDAaL
Source Company information Note 1 Assuming capacity to invest in organic or inorganic opportunities up to pro forma leverage of 5.5x Net Financial Debt / Adj. EBITDAaL
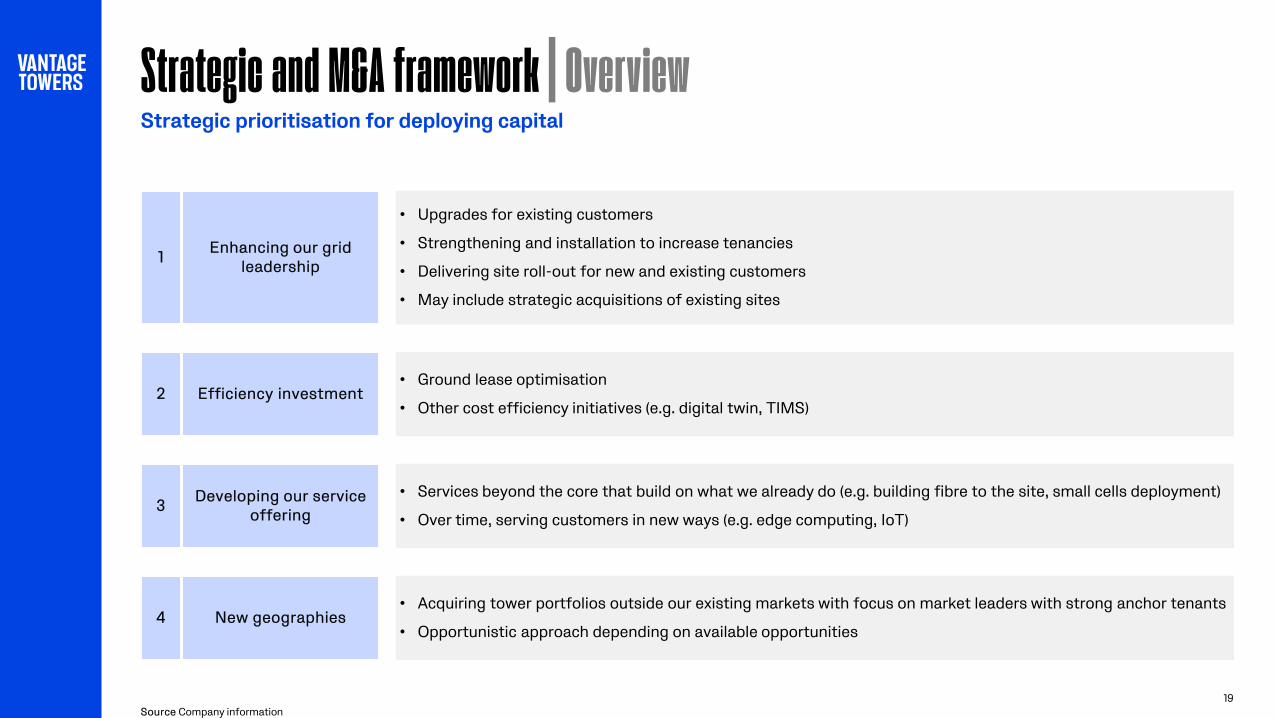
Strategic and M&A framework | Overview
19
Source Company information
Strategic prioritisation for deploying capital
Enhancing our grid leadership
• Upgrades for existing customers
• Strengthening and installation to increase tenancies
• Delivering site roll-out for new and existing customers
• May include strategic acquisitions of existing sites
1
Developing our service offering
• Services beyond the core that build on what we already do (e.g. building fibre to the site, small cells deployment)
• Over time, serving customers in new ways (e.g. edge computing, IoT) 3
New geographies • Acquiring tower portfolios outside our existing markets with focus on market leaders with strong anchor tenants
• Opportunistic approach depending on available opportunities 4
Efficiency investment • Ground lease optimisation
• Other cost efficiency initiatives (e.g. digital twin, TIMS) 2
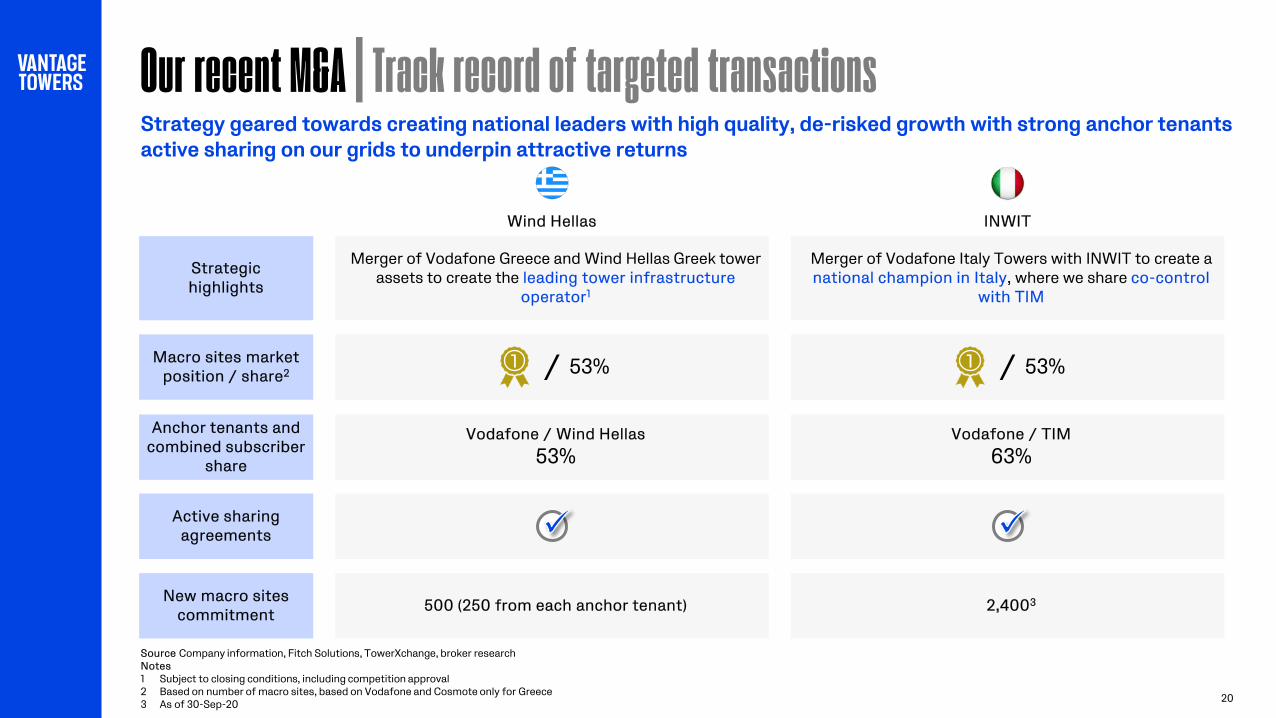
Merger of Vodafone Greece and Wind Hellas Greek tower assets to create the leading tower infrastructure
operator1
Merger of Vodafone Italy Towers with INWIT to create a national champion in Italy, where we share co-control
with TIM
Vodafone / Wind Hellas 53%
Vodafone / TIM 63%
2,4003 500 (250 from each anchor tenant)
Our recent M&A | Track record of targeted transactions
20
Strategy geared towards creating national leaders with high quality, de-risked growth with strong anchor tenants active sharing on our grids to underpin attractive returns
Strategic highlights
Anchor tenants and combined subscriber
share
New macro sites commitment
INWIT
Macro sites market position / share2
Active sharing agreements
Wind Hellas
1 53% / 1 53% /
Source Company information, Fitch Solutions, TowerXchange, broker research Notes 1 Subject to closing conditions, including competition approval 2 Based on number of macro sites, based on Vodafone and Cosmote only for Greece 3 As of 30-Sep-20
21
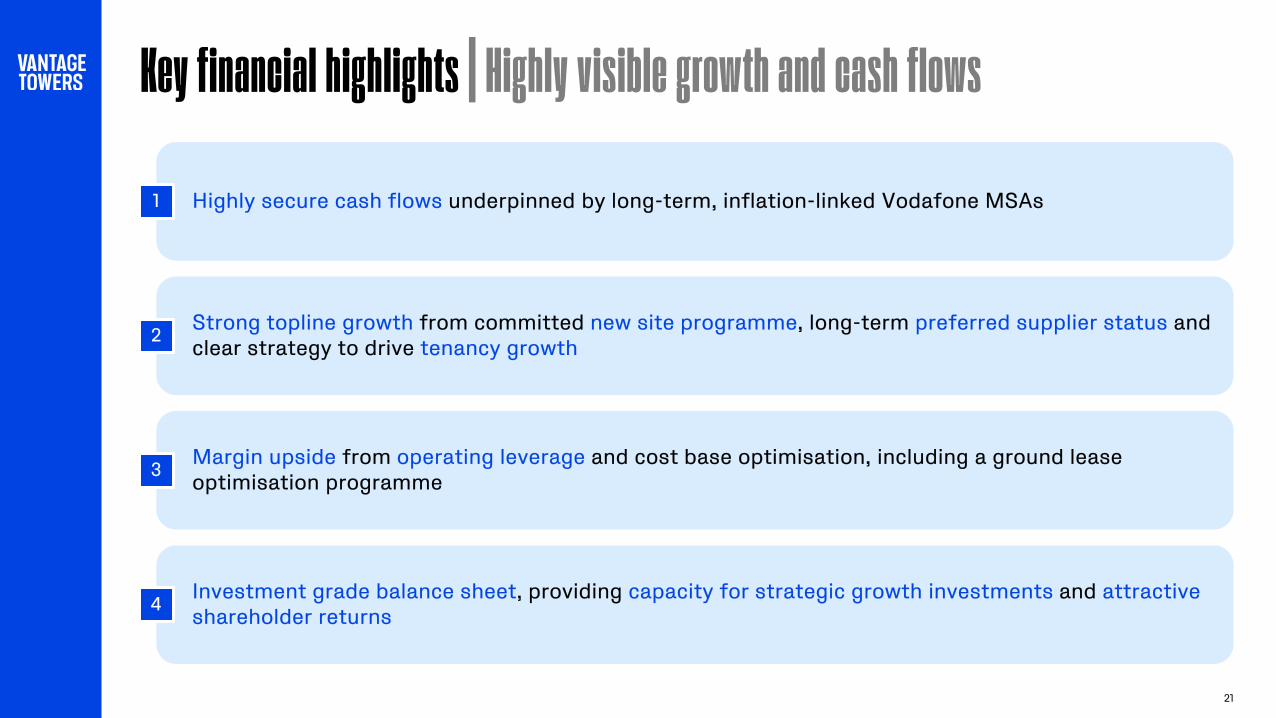
Key financial highlights | Highly visible growth and cash flows
Highly secure cash flows underpinned by long-term, inflation-linked Vodafone MSAs 1
Investment grade balance sheet, providing capacity for strategic growth investments and attractive shareholder returns
4
Margin upside from operating leverage and cost base optimisation, including a ground lease optimisation programme
3
Strong topline growth from committed new site programme, long-term preferred supplier status and clear strategy to drive tenancy growth
2
Basis of preparation (1/3)
22
Introduction The financial information presented above sets out certain summary pro forma consolidated financial results for Vantage Towers for the twelve months ended 31 March 2020 and the six months ended 30 September 2020. The basis of the pro forma information for the consolidated group reflects the historical results of Vantage Towers (including its operations in Germany, Spain, Greece, Ireland, Portugal, Romania, Hungary and Czech Republic). The pro forma results of operations are adjusted for the expected financial impact of the separation of the business from Vodafone Group Plc (“Vodafone”). The impact of commercial agreements, including the Master Services Agreements (“MSAs”) and Long Term Agreements (“LTAs”) which have been or are expected to be entered into with Vodafone, together with expected incremental running costs of Vantage Towers, are included as if they had been in place throughout the twelve month period and six month periods respectively. The pro forma results relating to Vantage Towers Greece are based on the historical results of the tower assets contributed by Vodafone-Panafon Hellenic Telecommunications Company S.A (“Vodafone Greece”) and Wind Hellas Telecommunications SA (“Wind Hellas”) and reflect the commercial arrangements (including the Master Services Agreement) between Vantage Towers Greece, Vodafone Greece and Wind Hellas, and certain expected incremental costs of Vantage Towers Greece on a standalone basis, as if they had been in place for 100% of both businesses throughout the twelve month period and six month period respectively. In addition, Vantage Towers is expected to hold Vodafone’s equity stake in Infrastrutture Wireless Italiane S.p.A (“INWIT”). Selected financial information in relation to INWIT is set out separately. This investment is classified as an equity accounted joint venture and will therefore not be included in consolidated EBITDA measures for financial reporting purposes. The financial information presented herein has been neither audited nor reviewed by Vodafone or Vantage Towers’ independent auditors and may be subject to changes. Pro forma financial information for Consolidated Vantage Towers Historical financial information for the twelve months ended 31 March 2020 The summary historical financial information used as the basis for the pro forma financial information for the twelve months ended 31 March 2020 contained herein has been prepared by extracting the directly attributable revenues and costs of the infrastructure assets to be included in Vantage Towers from the accounting records of Vodafone. The financial statement line items that can be directly identified are: • Revenues from tenants other than Vodafone; • Costs which are directly attributable to the tower infrastructure assets, such as energy, maintenance, depreciation of property, plant and equipment (“PPE”) and lease costs recognised under IFRS 16;
and • The non-current PPE assets and related asset retirement obligations. The same accounting policies and measurement principles as were applied by Vodafone in preparing its consolidated financial information for inclusion in its Annual Report for the year ended 31 March 2020 have been used for the preparation of the historical financial information, which forms the basis of the pro forma financial information. This includes IFRS 16 “Leases” which was adopted by Vodafone on 1 April 2019. Historical financial information for the six months ended 30 September 2020 The summary historical financial information used as the basis for the pro forma financial information for the six months ended 30 September 2020 contained herein is derived from the accounting records of the five markets that demerged before or during the period from the following dates: • Vantage Towers S.L.U (“Vantage Towers Spain”) – 1 April 2020; • Vantage Towers GmbH (“Vantage Towers Germany”) – 25 May 2020; • Vantage Towers Limited (“Vantage Towers Ireland”) – 1 June 2020; • Vodafone Towers Portugal S.A. (“Vantage Towers Portugal”) – 16 July 2020; and • Vantage Towers s.r.o. (“Vantage Towers Czech Republic”) – 1 September 2020. The post-demerger financial information has been combined with historical results for the pre-demerger periods in the above markets, and historical results for the full period for Vantage Towers Hungary, Vantage Towers Romania and Vantage Towers Greece. This historical financial information has been prepared by extracting the directly attributable revenues and costs of the passive infrastructure to be included in Vantage Towers from the accounting records of Vodafone (and Wind Hellas in the case of Greece).
Basis of preparation (2/3)
23
Pro forma adjustments Pro forma financial adjustments have then been made to present what the material effects of the separation of Vantage Towers from Vodafone would have had on the historical financial information if Vantage Towers had existed in the structure set out in the introduction above, for the twelve months ended 31 March 2020 and for the six months ended 30 September 2020. The main adjustments that have been made in preparing the pro forma financial information arise from: • Revenue from Vodafone based on the terms of the relevant MSA that are/will be in place for each market. This adjustment includes the anchor tenant rental income from Vodafone. • Costs required to run Vantage Towers on a standalone basis. This adjustment includes charges for local Vodafone markets, such as maintenance and other support services, and group services and
other contractual arrangements covering, inter alia, maintenance and insurance costs. • Employment and other general and administrative costs. The adjustments set out above are based on the commercial arrangements that have been or are expected to be entered into between Vantage Towers and other members of the Vodafone group, and with Wind Hellas in Greece, and the expected future costs of Vantage Towers, and are subject to potential change. These changes might result from amendments to the proposed portfolio of assets and equity investments to be held by Vantage Towers, the scope and pricing of services supplied by Vantage Towers, the actual incremental costs of Vantage Towers, changes to accounting policies and related estimates and other potential business developments. The pro forma results exclude any one-off costs in relation to the separation of Vantage Towers from Vodafone. Along with Vodafone Group, it is expected that Vantage Towers will reassess the IFRS 16 lease term for its head leases once all Vantage Towers assets have been separated. This may result in minor historical restatement of the pro forma depreciation of lease-related right of use assets and interest on leases. Summary historical financial information for INWIT Vodafone owns a 33.2% stake in INWIT, which it intends to transfer into Vantage Towers. This stake will be equity accounted by Vantage Towers. The merger of Vodafone Towers Srl (“Vodafone Towers Italy”) and INWIT was effective from 31 March 2020 (the “INWIT Transaction”) and as such INWIT did not contribute to Vodafone’s results for the year ended 31 March 2020. The financial information presented in respect of INWIT for the 12 months ended 31 March 2020 is directly extracted from the INWIT prospectus dated 10 June 2020, is based on INWIT’s accounting policies and is prepared in accordance with EU-IFRS and with the legal and regulatory provisions in force in Italy (in particular, the measures adopted in implementation of Section 9 of Italian Legislative Decree no. 38 of 28 February 2005). Lease costs have been derived from the INWIT prospectus and INWIT’s CY19 Annual Report and is therefore based on INWIT’s accounting policies. The pro forma income statement in the INWIT prospectus represents INWIT's financial performance for the 12 months ended 31 December 2019 combined with the Vodafone Towers Italy carve out financial information and adjusted to reflect the performance of the combined group as though the INWIT Transaction had taken place as at 1 January 2019. The pro forma adjustments include adjustments to reflect the MSA between Telecom Italia S.p.A. (“TIM”), Vodafone Italia S.p.A. (“Vodafone Italy”) and INWIT, as if it had been in place for the full year presented, and adjustments to align the Vodafone Towers Italy carve out financial information to INWIT’s accounting policies and adjustments for one-off and standalone costs. As a joint venture the results of INWIT will be equity accounted for by Vantage Towers. The financial information presented in respect of INWIT for the six months ended 30 September 2020 is directly extracted from the INWIT Q3 2020 results announcement as the sum of INWIT’s Q2 and Q3 results, based on INWIT’s accounting policies.
Basis of preparation (3/3)
24
KPIs and financial terms A number of Alternative Performance Measures (“APMs”) are presented in this announcement, which are used in addition to IFRS statutory performance measures. These APMs, which are not considered to be a substitute for or superior to IFRS measures, provide stakeholders with additional helpful information on the performance of the business. Adjusted EBITDA is defined as operating profit before depreciation on lease-related right of use assets and interest on leases, depreciation, amortisation and gains/losses on disposal for owned fixed assets, and excluding share of results in associates and joint ventures, impairment losses, restructuring costs arising from discrete restructuring plans, other operating income and expense and significant items that are not considered by management to be reflective of the underlying performance of the Group. Adjusted EBITDAaL is defined as operating profit, less capital expenditure recharge revenue and after depreciation on lease-related right of use assets and interest on leases, but excluding depreciation, amortisation and gains/losses on disposal for owned fixed assets, and excluding share of results in associates and joint ventures, impairment losses, restructuring costs arising from discrete restructuring plans, other operating income and expense and significant items that are not considered by management to be reflective of the underlying performance of the Group. Capital expenditure recharge revenue represents direct recharges to tenants of capital expenditure in connection with upgrades to existing sites. Aggregated adjusted EBITDAaL represents adjusted EBITDAaL for the Consolidated Vantage Towers operations, plus Vodafone’s ownership share of the adjusted EBITDAaL of INWIT. The results of INWIT will be equity accounted by Vantage Towers. Recurring operating free cash flow (“OpFCF”) is adjusted EBITDAaL less maintenance capital expenditure. Maintenance capital expenditure represents capital expenditure required to maintain and continue the operation of the existing tower network and other passive infrastructure. For the avoidance of doubt, maintenance capital expenditure excludes capital investment in new sites or other growth initiatives and should not be taken to be indicative of the total future investment requirement of Vantage Towers. Recurring free cash flow (“RFCF”) is recurring OpFCF less taxation, interest and changes in operating working capital. For the pro forma results, pro forma income statement taxation and interest have been used as a proxy for cash paid as no pro forma cash flow has been prepared. Tenancy ratio represents the total number of tenancies (including both Vodafone and another MNO where there is existing active sharing on a site) of Vantage Towers divided by the total number of towers.

Disclaimer (1/3)
25
IMPORTANT: The following applies to this document, which consists of the sections “Introduction and key investment highlights”, “Portfolio overview”, “Contracts, organisation and operations”, “ESG”, “Market drivers and commercial strategy” and “Understanding our financials and growth drivers”, and which has been prepared by Vantage Towers GmbH (the “Company” and together with its subsidiaries and those entities to become its subsidiaries, the "Group") solely for use at this meeting, to the oral and video presentation of the information in this document by members of the Company’s management, to any question-and-answer session that follows the oral and video presentation and any material distributed in connection with this presentation (collectively, the “Information”), each of which should be considered together and not taken out of context. By attending the oral and video presentation and/or accessing or reading a copy of the Information you agree to be bound by the following limitations and conditions. The Information has been prepared for information and background purposes only and may not be reproduced, published or transmitted, in whole or in part, directly or indirectly, to any person (whether within or outside such person’s organization or firm) other than its intended recipients. This document is not, and should not be construed as, a prospectus or offering document, and has not been reviewed or approved by any regulatory or supervisory authority. The Information does not constitute or form part of, and should not be construed as an offer for sale or subscription of or a solicitation or invitation of any offer to subscribe for or purchase any loans or securities of or make an investment in the Company or any other member of the Group or Vodafone Group Plc or any of its subsidiaries (together, “Vodafone”) or any other entity in any jurisdiction, and nothing contained therein shall form the basis of or be relied on in connection with any contract or commitment whatsoever, in particular, it must not be used in making any investment decision. Any decision to invest in securities should be made solely on the basis of the information to be contained in a prospectus and on an independent analysis of the information contained therein. The Information does not purport to contain all information required to evaluate the Company or the Group and/or its financial position. Financial information in this document is preliminary and unaudited and certain financial information (including percentages) has been rounded according to established commercial standards. In addition, the Company is currently still in the process of establishing capital markets readiness by expanding the scope of management reporting, financial accounting as well as forecasting and budgeting processes through the hiring and training of additional resources and rolling out market standard policies and procedures. As a result, some of the financial and/or operational information set forth in this document remains subject to change and/or completion. This document contains pro forma financial information of the Group for the financial year ended March 31, 2020 and for the six-months ended September 30, 2020 (together, the “PF Financial Information”) as well as financial information from Infrastrutture Wireless Italiane SpA (“INWIT”). For a description of the basis of preparation of the pro forma financial information of the Group for the financial year ended March 31, 2020, please refer to the slide entitled “Understanding our FY20 PF financials | Basis of preparation” included in the section “Understanding our financials and growth drivers”. The PF Financial Information has been prepared for illustrative purposes only and, by its nature, addresses a hypothetical situation and does not, therefore, represent the Group’s actual results of operations. Such information may not, therefore, give a true picture of the Group’s results of operations nor is it indicative of its results. The PF Financial Information is subject to change. This presentation also includes summary historical financial information from Vantage Towers Greece and INWIT. For a description of this information, please refer to the appendix section of this presentation. In this document, the Company utilises certain alternative performance measures, including but not limited to adjusted EBITDA, adjusted EBITDAaL, recurring operating free cash flow, recurring free cash flow, aggregated recurring free cash flow, return on capital employed, that in each case are not recognized under International Financial Reporting Standards (“IFRS”). These non-IFRS measures are presented as the Company believes that they and similar measures are widely used in the markets in which it operates as a means of evaluating a company’s operating performance and financing structure. They may not be comparable to other similarly titled measures of other companies and are not measurements under IFRS or other generally accepted accounting principles, nor should they be considered as substitutes for the information contained in the financial statements included in this document. No representation, warranty or undertaking, express or implied, is made by the Company, Vodafone or any their respective affiliates or any of its or their respective directors, officers, employees, agents or advisers (“Representatives”) or any other person as to, and no reliance should be placed on, the fairness, accuracy, completeness or correctness of the Information or the opinions contained therein or any other statement made or purported to be made in connection with the Company, the Group or Vodafone, for any purpose whatsoever, including but not limited to any investment considerations. No responsibility, obligation or liability whatsoever, whether arising in tort, contract or otherwise, is or will be accepted by the Company, Vodafone or any of their respective Representatives or any other person for any loss, cost or damage howsoever arising from any use of the Information, or for information or opinions or for any errors, omissions or misstatements contained therein or otherwise arising in connection therewith.
Disclaimer (2/3)
26
The Information is provided at the date of this document and is subject to change without notice. In providing access to the Information, none of the Company, Vodafone or any of their respective Representatives or any other person undertakes any obligation to provide the attendee or recipient with access to any additional information or to update the Information or to correct any inaccuracies in any such Information, including any financial data or forward-looking statements. The Information should be considered in the context of the circumstances prevailing at the time and has not been, and will not be, updated to reflect material developments which may occur after the date thereof. The information contained in this document has not been independently verified. The Information may constitute or include forward-looking statements. Forward-looking statements are statements that are not historical facts and may be identified by words such as “plans”, “targets”, “aims”, “believes”, “expects”, “anticipates”, “intends”, “estimates”, “will”, “may”, “continues”, “should” and similar expressions. These forward-looking statements reflect, at the time made, the Company’s beliefs, intentions and current targets/aims concerning, among other things, the Company’s or the Group’s results of operations, financial condition, liquidity, prospects, growth and strategies. Forward-looking statements include statements regarding: objectives, goals, strategies, outlook and growth prospects; future plans, events or performance and potential for future growth concerning, among other things, growth trends in the market for macro sites (which can be affected by a number of factors, including operator consolidation, network sharing (including roaming and slicing) and spectrum trading), and growth trends in the DAS and small cell market (some industry analysts believe the small cell market still in the nascent stage of its development and could be affected by factors including changes in the behaviour of MNOs); lease-up potentials; economic outlook and industry trends; developments of the Company’s or the Group’s markets; the impact of regulatory initiatives; and the strength of the Company’s or any other member of the Group’s competitors. Forward-looking statements involve risks and uncertainties because they relate to events and depend on circumstances that may or may not occur in the future. The forward-looking statements in the Information are based upon various assumptions, many of which are based, in turn, upon further assumptions, including without limitation, management’s examination of historical operating trends, data contained in the Company’s records (and those of other members of the Group) and other data available from third parties. Although the Company believes that these assumptions were reasonable when made, these assumptions are inherently subject to significant known and unknown risks, uncertainties, contingencies and other important factors which are difficult or impossible to predict and are beyond its control. Forward-looking statements are not guarantees of future performance and such risks, uncertainties, contingencies and other important factors could cause the actual outcomes and the results of operations, financial condition and liquidity of the Company and other members of the Group or the industry to differ materially from those results expressed or implied in the Information by such forward-looking statements. No assurances can be given that the forward-looking statements will be realised. The forward-looking statements speak only as of the date of this document. The Company expressly disclaims any obligation or undertaking to release any updates or revisions to any forward-looking statements to reflect any change in the Company’s expectations with regard thereto or any changes in events, conditions or circumstances on which any forward-looking statements are based. No representation or warranty is made that any of these forward-looking statements or forecasts will come to pass or that any forecast result will be achieved. Undue influence should not be given to, and no reliance should be placed on, any forward-looking statement. To the extent available, the industry, market and competitive position data contained in the Information come from official or third party sources. Third party industry publications, studies and surveys generally state that the data contained therein have been obtained from sources believed to be reliable, but that there is no guarantee of the accuracy or completeness of such data. While the Company believes that each of these publications, studies and surveys has been prepared by a reputable source, neither the Company nor any of its respective Representatives has independently verified the data contained therein. In addition, certain of the industry, market and competitive position data contained in the Information come from the Company’s own internal research and estimates based on the knowledge and experience of the Company’s management in the markets in which the Company and the other members of the Group operate. While the Company believes that such research and estimates are reasonable, they, and their underlying methodology and assumptions, have not been verified by any independent source for accuracy or completeness and are subject to change and correction without notice. Accordingly, reliance should not be placed on any of the industry, market or competitive position data contained in the Information.

Disclaimer (3/3)
27
In addition, certain industry and market data in this document is based on third-party data provided by Analysys Mason Limited (“Analysys Mason”). Analysys Mason’s data is derived from publicly available information released by independent industry analysts and other third-party sources, as well as data from Analysys Mason’s internal research, and is based on assumptions made upon reviewing such data, and experience in, and knowledge of, such industry and markets, which the Company believes to be reasonable. Although Analysys Mason has obtained such information from sources it believes to be reliable, Analysys Mason has not verified such information. You are cautioned not to give undue weight to these estimates and assumptions. Analysys Mason’s estimates are subject to the same qualifications and uncertainties as the other forward-looking statements in this document. The Information is not directed to, or intended for distribution to or use by, any person or entity that is a citizen or resident or located in any locality, state, country or other jurisdiction where such distribution, publication, availability or use would be contrary to law or regulation of such jurisdiction or which would require any registration or licensing within such jurisdiction. Any failure to comply with these restrictions may constitute a violation of the laws of any such jurisdiction. The Information is not an offer of securities for sale in the United States. Any securities described herein have not been and will not be registered under the under the U.S. Securities Act of 1933, as amended (the “U.S. Securities Act”), or any state securities laws, and may not be offered or sold in the United States absent registration under the U.S. Securities Act or an available exemption from it. There will be no public offer of securities in the United States. Neither this document nor any copy of it may be taken or transmitted into the United States, Australia, Canada or Japan or to any securities analyst or other person in any of those jurisdictions. Any failure to comply with these restrictions may constitute a violation of the securities laws of the United States, Canada, Australia or Japan. This document is also not for publication, release or distribution in any other jurisdiction where to do so would constitute a violation of the relevant laws of such jurisdiction nor should it be taken or transmitted into such jurisdiction and persons into whose possession this document comes should inform themselves about and observe any such restrictions. The Information is only addressed to and directed at persons in member states of the European Economic Area and the United Kingdom (each a “Relevant State”) who are “qualified investors” within the meaning of Article 2(e) of Regulation (EU) 2017/1129 (“Qualified Investors”). In addition, in the United Kingdom, the Information is being distributed only to, and is directed only at, Qualified Investors who are (i) ”investment professionals” within the meaning of Article 19(5) of the Financial Services and Markets Act 2000 (Financial Promotion) Order 2005 (the “Order”); (ii) high net worth companies, and other persons to whom it may otherwise lawfully be communicated falling within Article 49(2)(a) to (d) of the Order, or (iii) persons to whom it may otherwise lawfully be communicated (all such persons together being referred to as “Relevant Persons”). The Information must not be acted on or relied on (i) in the United Kingdom, by persons who are not Relevant Persons, and (ii) in any Relevant State, by persons who are not Qualified Investors.

Key contacts https://www.vantagetowers.com/investors www.vodafone.com/investors [email protected] 1 Kingdom Street, London, W2 6BY
Matthew Johnson
• Director • Group IR • [email protected]
Daniel Morris
• Deputy Director • Group IR • [email protected]


