f à c n s m l l l n à t k P à i d k à 0 à u l l k l k w X u à y j m j A à b k m j q à W n 6 à h 6 à a Y B i à B r r 6 à w g 8 n V m k o 8 e v à j à à @ r r à h q à D r t h r q à S v x à H h h t r r 6 à a 8 à r 8 à a e j l k 6 à t k à r m d l k 6 à W m m k l à B @ @ @ 8 26 April 2000 Extreme value theory - an empirical analysis of equity risk Abstract This paper is a case study in the use of extreme value theory (EVT) to estimate tail risks in financial markets. Its main argument is that EVT is a practical tool that allows riskmanagers to estimate tail risk. To illustrate this point, an EVT model is applied to a large sample of equity indices. Throughout, the emphasis is on the application of an EVT model, rather than its theoretical properties, and graphical tools are used to visualise results. Introduction Investment banks are exposed to risk from movements in prices of many instruments and across many markets. In this multivariate world, risk managers often focus attention on portfolio tail risk. Different measures of tail risk are essential to ‘slice and dice’ exposures from different viewpoints. Current best practice for assessing tail risk includes techniques such as value-at-riskand scenario analysis. This case study offers one example highlighting why extreme value theory (EVT) might become part of the risk manager’s toolkit in the future. The application of EVT discussed in this paper concerns equity risk, but it could apply equally to other markets. Equity risk is often partitioned into market and stock specific risk, where market risk is measured using an appropriate index. Large movements in indices may expose a portfolio to risk so our objective is to estimate the magnitude of such moves in a robust but consistent manner. The layout of the rest of this paper is as follows: first we investigate and comment on the data, next the data is summarised non-parametrically before fitting a EVT model, the results are then summarised in various ways, before finishing with some final comments. Exploratory data analysis The first task in any empirical analysis is to explore the data. EVT is very data hungry because the most informative events are historic crises and these are rare events by their very nature. It is critically important that the data used to estimate extreme events contain some information about extreme events. EVT will do no more than extract such information in an efficient and consistent manner. For example, Figure 1 shows a history of 10-day returns for four equity indices. Five years ofrecent history would highlight one big move in the Hang-Seng (IXH). Going back a further ten years highlights two other moves that exceeded 30% over 10-days. Does the switch from ‘one big move in five years’ to ‘three big moves in fifteen years’ give us extra information about the likelihood and magnitude of future big moves on the Hang-Seng? The situation is more extreme for the S&P500 (SPX) and the FTSE100 (FTSE), where the Oct 87 crash is out of all proportion to the big moves seen since then. The decision on how much historic data to use is likely to depend on how the results are to be used and there may be variation between different markets, levels in the organisation and motivation e.g. foreign exchange verses equity, chief risk officer verses trading desk, internal verses external. In practice, sensitivity to the length of the time period should be considered by
s m � l � l � l � n � à t � k � P à i � � d k à 0 à u l � l � k l � � k
w X u à y � j � m j �
A à b � k � m j q à W n � 6 à h � 6 à a Y B i à B r r 6 à w g
� � 8 � � n � V m � k o 8 � e
v à � � � j à � à @ � � � r � r � à h � q à D � � r t � h � r q à S v � x à H h � h t r � r � � 6 à a � 8 à r 8 à a e � j � � � l k 6 à t � k � à r m � d � � � l � k 6 à W m � m k l à B @ @ @ 8
26 April 2000
Extreme value theory - an empirical analysis of equity risk
Abstract
This paper is a case study in the use of extreme value theory (EVT) to estimate tail risks
in financial markets. Its main argument is that EVT is a practical tool that allows risk
managers to estimate tail risk. To illustrate this point, an EVT model is applied to a
large sample of equity indices. Throughout, the emphasis is on the application of an
EVT model, rather than its theoretical properties, and graphical tools are used to
visualise results.
Introduction
Investment banks are exposed to risk from movements in prices of many instruments and across
many markets. In this multivariate world, risk managers often focus attention on portfolio tail
risk. Different measures of tail risk are essential to ‘slice and dice’ exposures from different
viewpoints. Current best practice for assessing tail risk includes techniques such as value-at-risk
and scenario analysis. This case study offers one example highlighting why extreme value theory
(EVT) might become part of the risk manager’s toolkit in the future.
The application of EVT discussed in this paper concerns equity risk, but it could apply equally to
other markets. Equity risk is often partitioned into market and stock specific risk, where market
risk is measured using an appropriate index. Large movements in indices may expose a portfolio
to risk so our objective is to estimate the magnitude of such moves in a robust but consistent
manner.
The layout of the rest of this paper is as follows: first we investigate and comment on the data,
next the data is summarised non-parametrically before fitting a EVT model, the results are then
summarised in various ways, before finishing with some final comments.
Exploratory data analysis
The first task in any empirical analysis is to explore the data. EVT is very data hungry because
the most informative events are historic crises and these are rare events by their very nature. It is
critically important that the data used to estimate extreme events contain some information about
extreme events. EVT will do no more than extract such information in an efficient and consistent
manner.For example, Figure 1 shows a history of 10-day returns for four equity indices. Five years of
recent history would highlight one big move in the Hang-Seng (IXH). Going back a further ten
years highlights two other moves that exceeded 30% over 10-days. Does the switch from ‘one
big move in five years’ to ‘three big moves in fifteen years’ give us extra information about the
likelihood and magnitude of future big moves on the Hang-Seng? The situation is more extreme
for the S&P500 (SPX) and the FTSE100 (FTSE), where the Oct 87 crash is out of all proportion
to the big moves seen since then.
The decision on how much historic data to use is likely to depend on how the results are to be
used and there may be variation between different markets, levels in the organisation and
v à � � � j à � à @ � � � r � r � à h � q à D � � r t � h � r q à S v � x à H h � h t r � r � � 6 à a � 8 à r 8 à a e � j � � � l k 6 à t � k � à r m � d � � � l � k 6 à W m � m k l à B @ @ @ 8
a p l j � e � à n � d m � à l � � j q à 7 à � à � e � j � � � d à � � d q k � k à � à � m � l q à j � k � 6 à f � à c � n �
r � � � Ã B Ã � Ã I
comparing the analysis for different time windows, such as 5 years verses 10 years of data, and
by comparing results with and without a period when a crash occurred such as October 1987 for
equities.
Common arguments for using as much historic data as possible include: ‘rare events require a
long history in order to see several such events’, ‘the longer the historical period the more
extreme the worst observed movements’ and ‘we don’t want to throw away information’.
Counter arguments to going far back in history include: ‘markets are different now compared to
the distant past’, ‘we should use the same historic period as used within the VaR model for
consistency’ and ‘we should use the same historic period for all the time series in our analysis(the range of the shortest time series)’. A more detailed discussion of this point is beyond the
scope of this paper. As our objective is to illustrate EVT, we use up to fifteen years of data
where available (November 1984 to August 1999).
To decide if a data source is reliable, it is worthwhile spot checking the biggest moves with
alternative sources. Discrepancies often occur and should be resolved. Sometimes it is due to
unavoidable anomalies, such as the data being recorded in different time zones but such
differences are magnified when markets crash. For example, if a market closed early because of
the crash then its closing price may not match the closing price in other markets, which remained
open, or perhaps which closed earlier in the day before the crash occurred. Results may be
sensitive to these issues so care is required.
-40
-20
0
20SGD.IXP
1985 1990 1995 2000
HKD.IXH
GBP.FTSE
-40
-20
0
20USD.SPX
1985 1990 1995 2000
Time (years)
R e t u r n o v e r t h e h o l d i n g p e r i o d ( % )
28 Oct 97 -42%27 Oct 87 -47%
6 Jun 89 -36%
27 Oct 87 -30%27 Oct 87 -31%
27 Oct 87 -52%
Figure 1 Time series plots of non-overlapping 10-day equity index returns. Two industrialised indices,FTSE100 (FTSE) and S&P500 (SPX), and two emerging market indices, Singapore (IXP) and Hang Seng
IXH) are shown. The worst observed moves were in October 1987.
v à � � � j à � à @ � � � r � r � à h � q à D � � r t � h � r q à S v � x à H h � h t r � r � � 6 à a � 8 à r 8 à a e � j � � � l k 6 à t � k � à r m � d � � � l � k 6 à W m � m k l à B @ @ @ 8
a p l j � e � à n � d m � à l � � j q à 7 à � à � e � j � � � d à � � d q k � k à � à � m � l q à j � k � 6 à f � à c � n �
r � � � Ã C Ã � Ã I
This analysis uses a holding period of 10-days to reflect regulator’s requirements, but the
methodology is independent of the holding period. The chosen time-horizon should capture the
full magnitude of movements that occur during volatile periods and reflect the investor’s time
horizon. For investment banks trading in major markets this might be from one to ten days,
perhaps a little more for very illiquid markets. Variation in results by holding period is anotherimportant point that should be considered in practice. In particular, EVT results for different
holding periods can illustrate that the square-root-of-time rule is not always conservative when
scaling from one holding period to another. This last point is beyond the scope of this paper so
it is not discussed further.
We use non-overlapping returns to avoid introducing serial correlation, which might affect the
assumption that returns are independently distributed. Non-overlapping 10-day returns imply that
the data contain about 25 observations per business year per index.
In practice, it is important to compare results across a broad spectrum of markets, so we will use
a sample of 44 equity indices. Each index is identified only by a three-letter currency code
followed by its identifier because the emphasis in this paper is on the properties of this sample of
indices, rather than on any particular index.
USD.SPX
GBP.FTSE
HKD.IXH
SGD.IXP
-40 -20 0 20 40
Return over the holding period (%)
E q
u i t y
i n d e x
4) Lowest 5% of returns
1) Lowest 1% of returns
3) Middle 98% of returns
2) Highest 1% of returns
5) Highest 5% of returns
6) Middle 90% of returns
7) Median
Figure 2 Box-whisker plots of the returns shown in Figure 1. The standard box-whisker definition has
been altered to emphasise differences in the tails (see text). The four plots are ranked from top to bottom
v à � � � j à � à @ � � � r � r � à h � q à D � � r t � h � r q à S v � x à H h � h t r � r � � 6 à a � 8 à r 8 à a e � j � � � l k 6 à t � k � à r m � d � � � l � k 6 à W m � m k l à B @ @ @ 8
a p l j � e � à n � d m � à l � � j q à 7 à � à � e � j � � � d à � � d q k � k à � à � m � l q à j � k � 6 à f � à c � n �
r � � � Ã D Ã � Ã I
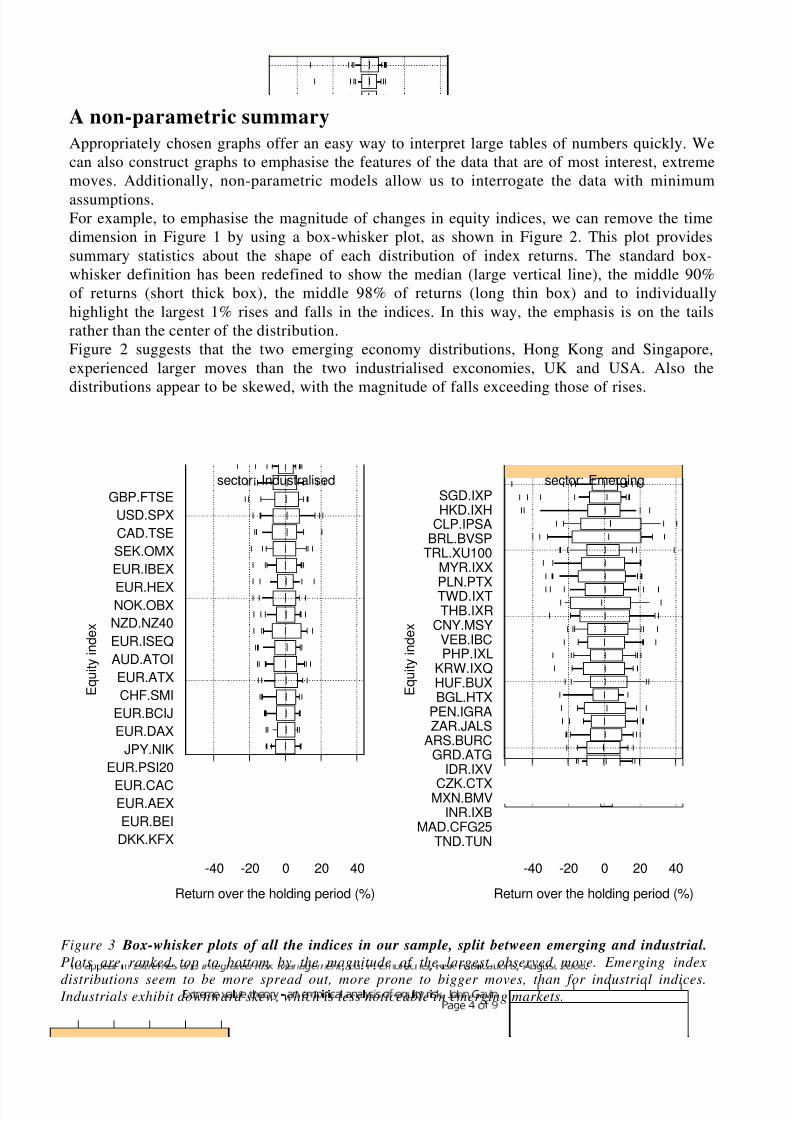
A non-parametric summary
Appropriately chosen graphs offer an easy way to interpret large tables of numbers quickly. We
can also construct graphs to emphasise the features of the data that are of most interest, extreme
moves. Additionally, non-parametric models allow us to interrogate the data with minimum
assumptions.For example, to emphasise the magnitude of changes in equity indices, we can remove the time
dimension in Figure 1 by using a box-whisker plot, as shown in Figure 2. This plot provides
summary statistics about the shape of each distribution of index returns. The standard box-
whisker definition has been redefined to show the median (large vertical line), the middle 90%
of returns (short thick box), the middle 98% of returns (long thin box) and to individually
highlight the largest 1% rises and falls in the indices. In this way, the emphasis is on the tails
rather than the center of the distribution.
Figure 2 suggests that the two emerging economy distributions, Hong Kong and Singapore,
experienced larger moves than the two industrialised exconomies, UK and USA. Also the
distributions appear to be skewed, with the magnitude of falls exceeding those of rises.
Figure 3 Box-whisker plots of all the indices in our sample, split between emerging and industrial.
Plots are ranked top to bottom by the magnitude of the largest observed move. Emerging index
distributions seem to be more spread out, more prone to bigger moves, than for industrial indices. Industrials exhibit downward skew, which is less noticeable in emerging markets.
v à � � � j à � à @ � � � r � r � à h � q à D � � r t � h � r q à S v � x à H h � h t r � r � � 6 à a � 8 à r 8 à a e � j � � � l k 6 à t � k � à r m � d � � � l � k 6 à W m � m k l à B @ @ @ 8
a p l j � e � à n � d m � à l � � j q à 7 à � à � e � j � � � d à � � d q k � k à � à � m � l q à j � k � 6 à f � à c � n �
r � � � Ã E Ã � Ã I
Figure 3 extends this approach to all of the indices in our sample but categorises the
distributions into industrial and emerging, of which there are about twenty each. Of the
industrials, the S&P and FTSE have produced the biggest moves, due to the October 1987 crash.
Singapore has produced the biggest fall among the emerging indices, followed by Hong Kong.
Belgium (BEI) and Denmark (KFX) produced the least extreme falls among the industrials. Thehistory of the time series for Madagaskar (CFG25) and Tunesian (TUN) was short relative to
other indices. Across both categories the top-ten biggest falls were in emerging indices, the
exception being the FTSE, and seventeen of the bottom twenty were industrial (not shown). So
these results, and further exploratory data anlaysis,are hinting that there might be a difference
between the fat-tailedness of the distributions between industrial and emerging indices. It also
suggests a downward skew (to the left) so we might want to distinguish between extreme
positive and negative distributions.
An EVT model
Following Embrechts, Resnick and Samorodnitsky1, we use a generalised Pareto distribution
(GPD), )(,
xG β ξ
, to approximate the distribution of large log-returns from an equity index,
++++++++++++
++++++++++
+
+
-------------
-
-
10^-3
10^-2
10^-1
USD.SPX
0 10 20 30 40 50
++++++++++++++++++
+
+
---------------
-
-
SGD.IXP
0 10 20 30 40 50
Return over holding period (%)
C u m u l a t i v e p r o b a b i l i t y
+ -Positive move - data & fit Negative move - data & fit
Figure 4 POT model fitted separately to the positive and negative returns on the S&P500 (SPX)
and Singapore (IXP) indices. The plus (+) and minus (-) signs are the largest 10% of the positive
and negative 10-day returns, respectively. Negative moves are generally fatter tailed than positive
v à � � � j à � à @ � � � r � r � à h � q à D � � r t � h � r q à S v � x à H h � h t r � r � � 6 à a � 8 à r 8 à a e � j � � � l k 6 à t � k � à r m � d � � � l � k 6 à W m � m k l à B @ @ @ 8
a p l j � e � à n � d m � à l � � j q à 7 à � à � e � j � � � d à � � d q k � k à � à � m � l q à j � k � 6 à f � à c � n �
r � � � Ã F Ã � Ã I
)( xF u
, for moves in excess of some threshold, u. The GPD is a two-parameter distribution
function
=−−
≠+−−
0), / exp(1
0,) / 1(1)(
/ 1
, ξ β
ξ β ξ ξ
β ξ x
x xG where β and ξ are called the scale and shape
parameters, respectively. This model ignores data in the centre of the distribution on theassumption that small (frequent) moves in an index do not contain any information about the
magnitude nor likelihood of large (infrequent) moves. It is sometimes called the peaks over
threshold (POT) model. The two panels in Figure 4 show the empirical and fitted cumulative
probabilities, from the POT model, for two indices in our sample. Positive and (the absolute
value of) negative moves are analysed separately with the threshold set at the 90% confidence
level (90% quantile). The x-axis measures the size of the move over 10-days and the y-axis
shows the (log-10 scale) cumulative probability, starting at the threshold. This value is equal to
one minus the confidence level, so2
10−
= y corresponds to the 99% confidence level. Observed
positive and negative moves are shown as plus (+) and minus (-), respectively. For example, the
second worst falls for the S&P and Singapore were about –10% and –22% respectively, and both
events have empirical probabilities of about2
10−
= y (99% confidence level). On to each set of
observed data a GPD distribution has been superimposed using maximum likelihood to estimate
the parameters. The threshold choice is subjective but values around this level were found to
produce satisfactory results. More generally, it is necessary to test our sensitivity to this
v à � � � j à � à @ � � � r � r � à h � q à D � � r t � h � r q à S v � x à H h � h t r � r � � 6 à a � 8 à r 8 à a e � j � � � l k 6 à t � k � à r m � d � � � l � k 6 à W m � m k l à B @ @ @ 8
a p l j � e � à n � d m � à l � � j q à 7 à � à � e � j � � � d à � � d q k � k à � à � m � l q à j � k � 6 à f � à c � n �
r � � � Ã G Ã � Ã I
From the graph, we can see that our estimates of (the absolute value of) negative and positive
moves are 11% and 8% for the S&P, and 23% and 15% for Singapore, at the 99% confidence
level. These are the x-values at which the horizontal line2
10−
= y crosses the fitted distributions.
For Singapore, the fit suggests that there is a difference between the magnitude of large positiveversus negative moves, for a fixed confidence level. For the S&P, there is little to distinguish the
magnitude of positive moves from negative moves, for absolute moves in the interval 4.5% to
+6%. Beyond that, negative moves are larger for any chosen confidence level and the difference
increases for points further out in the tail. In other examples (not shown), it is possible for the
positive and negative fits to have a crossover point, making it worthwhile to consider all points
along the tail rather than just a single point.
Notice that the distribution for positive moves on the S&P seems to have an upper bound, so our
99% estimate of an 8% rise in the index is not that different from our 99.9% estimate of a 10%
rise, approximately. This suggests that there is an upper limit to how much this index can rise
over 10-days, even in a strong bull market.
A natural question to consider is whether we could consider the positive and negative estimate
for the S&P to be about the same. It is possible to place pointwise confidence intervals around
each estimated point (Embrechts, Resnick and Samorodnitsky1, McNeil
2) but a more pertinent
question is whether this difference is materially significant from a business perspective. For this
reason we choose to look at a sample from the population of equity indices and focus on the
variation across the sample rather than the variation for a single index.
By repeating this analysis for each index, we can produce an EVT estimate for each index.
Figure 5 summarises the results for the 99% confidence level. These estimates of 10-day moves
vary from around from 5% to 35%. Industrial indices tend to produce smaller moves than
emerging market indices and a second order effect appears to be that negative moves tend to
exceed positive moves, as our earlier non-parametric analysis suggested.
Estimating risk along the tail
This penultimate section addresses two questions: For a fixed confidence level, is there a concise
way to summarise the results for our sample of equity indices? Secondly, how might the results
change if we repeat the analysis for different confidence levels?
We use a decision tree to draw general conclusions about the magnitude of large moves in equity
indices. Our goal with this model is to produce an economic description of our EVT estimates
for a fixed confidence level, by adding background information. This information is an attempt
to encapsulate expert knowledge about factors that might influence the behaviour of equity
indices under stress conditions, such as distinguishing between positive and negative moves, thematurity of the underlying economy (industrialised or emerging) or the credit rating of the
associated country. We extend this approach by building a decision tree at different confidence
levels, then we consider differences between these trees.
A decision tree is a transparent tool for summarising data using a simple set of rules. The tree is
a sequence of binary rules, each associated with some decision. First, a variable is selected, then
the population is divided into two at a selected breakpoint of that variable. Each split is then
independently subdivided further on the same principle, recursively forming a binary tree
structure. Tree models are easy to interpret and they emphasise the more important variables.
However, solutions are not unique and the technique is still being developed. Breiman,
v à � � � j à � à @ � � � r � r � à h � q à D � � r t � h � r q à S v � x à H h � h t r � r � � 6 à a � 8 à r 8 à a e � j � � � l k 6 à t � k � à r m � d � � � l � k 6 à W m � m k l à B @ @ @ 8
a p l j � e � à n � d m � à l � � j q à 7 à � à � e � j � � � d à � � d q k � k à � à � m � l q à j � k � 6 à f � à c � n �
r � � � Ã H Ã � Ã I
For example, in Figure 6, the top left tree summarises the estimates of the 95% confidence level
in our sample using their mean value, a 12% move over 10-days. By introducing an
industrial/emerging rule, this set of 88 numbers can be split into two subsets, where the 40
industrial indices (twenty positive and twenty negative time series) have a mean estimated value
of 7.7%. The corresponding mean estimate for the 48 emerging time series is 15%. The model
chose not to split the data between positive and negative moves suggesting that positive and
negative shocks are about equal in magnitude, at that point in the tail.
Repeating the process at other points further out in the tail (99%, 99.5% and 99.9%) produces
the three other trees shown in Figure 6. For example, we might summarise the 99% confidence
level estimates using two rules, which produce four shock levels of 10%, 14%, 20% and 22% forpositive and negative industrial and positive and negative emerging indices, respectively.
Differences between the tree structures highlight changes in the interactions between rules as we
move along the tail. The best split at the 95%, 99% and 99.5% levels is the industrial/emerging
rule, but further out in the tail the split between positive and negative moves provides a better
explanation of variation in the EVT estimates. This feature is also evident in Figure 4 as the
divergence between the two fitted curves, for positive and negative moves, increases sharply
further out in the tail. So our EVT model applied to our sample has produced estimates whose
magnitude and structure varies along the tail. This suggests that a detailed investigation of
results all along the tail may be worthwhile.
|
sector:Industralisedsector:Emerging
12.0n=88
7.7n=40
15.0n=48
95% confidence level
|
sector:Industralised
sign:pos sign:pos
sector:Emerging
sign:neg sign:neg
17n=88
12n=40
10n=20
14n=20
21n=48
20n=24
22n=24
99% confidence level
|
sector:Industralised
sign:pos sign:pos
sector:Emerging
sign:neg sign:neg
20n=88
15n=40
12n=20
18n=20
23n=48
21n=24
25n=24
99.5% confidence level
|
sign:pos
sector:Emerging
sign:neg
sector:Industralised
33n=88
22n=44
44n=44
37n=24
52n=20
99.9% confidence level
Figure 6 Tree models for the equity indices in our sample at various confidence levels along the
tail. Each node in the tree shows the average value and number of estimates in that node. Each
branch shows the rule used to split the tree at that level. The relative importance of each rule varies
along the tail, along with the magnitude of the average estimate.
v à � � � j à � à @ � � � r � r � à h � q à D � � r t � h � r q à S v � x à H h � h t r � r � � 6 à a � 8 à r 8 à a e � j � � � l k 6 à t � k � à r m � d � � � l � k 6 à W m � m k l à B @ @ @ 8
a p l j � e � à n � d m � à l � � j q à 7 à � à � e � j � � � d à � � d q k � k à � à � m � l q à j � k � 6 à f � à c � n �
r � � � Ã I Ã � Ã I
Final remarks
This case study discussed some of the practical issues that arise from using EVT to measure tail
risk in finance. Our overall conclusion is that EVT is a complementary tool to existing
techniques, such as VaR and stress testing. It should become a standard part of the risk
manager’s toolkit to demonstrate to traders and to regulators a consistent, robust methodologyfor stressing individual risk factors. In particular, it implies our understanding of risk is not
measured solely in terms of volatility.
Some EVT issues were only briefly mentioned and require more detailed consideration in
practice including: the choice of threshold u, the best fitting procedure to estimate the shape and
scale parameters, the extra benefit of producing pointwise confidence intervals for our estimates
and variation between samples from different data sources. We did not discuss other potentially
useful EVT estimates such as excess of loss, the expected loss given that the loss exceed some
point in the tail.
How different estimates relate to the real world is an important practical topic. For example, an
estimate at the 99.9% confidence level is likely to produce a number that few traders can relateto in they day-to-day experience of managing a market sensitive portfolio. So points that far out
in the tail may not have much practical value from a trader’s perspective.
The regression tree offers one way of adding expert knowledge to the solution by introducing
rules for partitioning the data into homogenous groups. This model might also be used to make
predictions for indices not in our sample. However, it is worth reiterating that each point is an
estimate derived from our EVT model, so each point is itself subject to measurement error.
We finish by acknowledging that this short case study ignores many important equity risks for
simplicity, especially specific, volatility and spread risk. It should be viewed as only a starting
point for equity portfolio risk analysis.
AcknowledgementsThis paper was written mainly because of the encouragement of Paul Embrecths and Alexander
McNeil. It has benefited from many conversations with colleagues, especially Helmut Glemser,
but all errors are mine alone. Analysis was carried out in SPlus4
using mainly McNeil’s EVIS5
library for the EVT results, but also Thearneau’s recursive partitioning (rpart 6 ) for the tree
model and Harrell’s hmisc6
libraries for some of the graphs. The data are taken from a
proprietary UBS database.
References
1. P. Embrechts, S. Resnick and G. Samorodnitsky, Living on the edge, Risk, January 1998, 96-
100.2. A. McNeil, History repeating, Risk, January 1998, 99.
3. L. Breiman, J. H. Friedman, R. A. Olshen, and C. J. Stone, 1984, Classification and
regression trees, Belmont, MA: Wadsworth.
4. SPlus, www.mathsoft.com /splus
5. Extreme Values in SPlus (EVIS), A. McNeil, www.math.ethz.ch/~mcneil/software.html
6. Hmisc library of SPlus routines, F. Harrell, hesweb1.med.virginia.edu/biostat/s/Hmisc.html
7. J. Atkinson and T. Therneau, An introduction to recursive partitioning using the rpart
routine, Technical report 61, Mayo Clinic, Section of Statistics, 1997 (ported to Windows by