19
651 N Waterman Ave 651 N Waterman Ave, San Bernardino CA 92410 O F F E R I N G M E M O R A N D U M
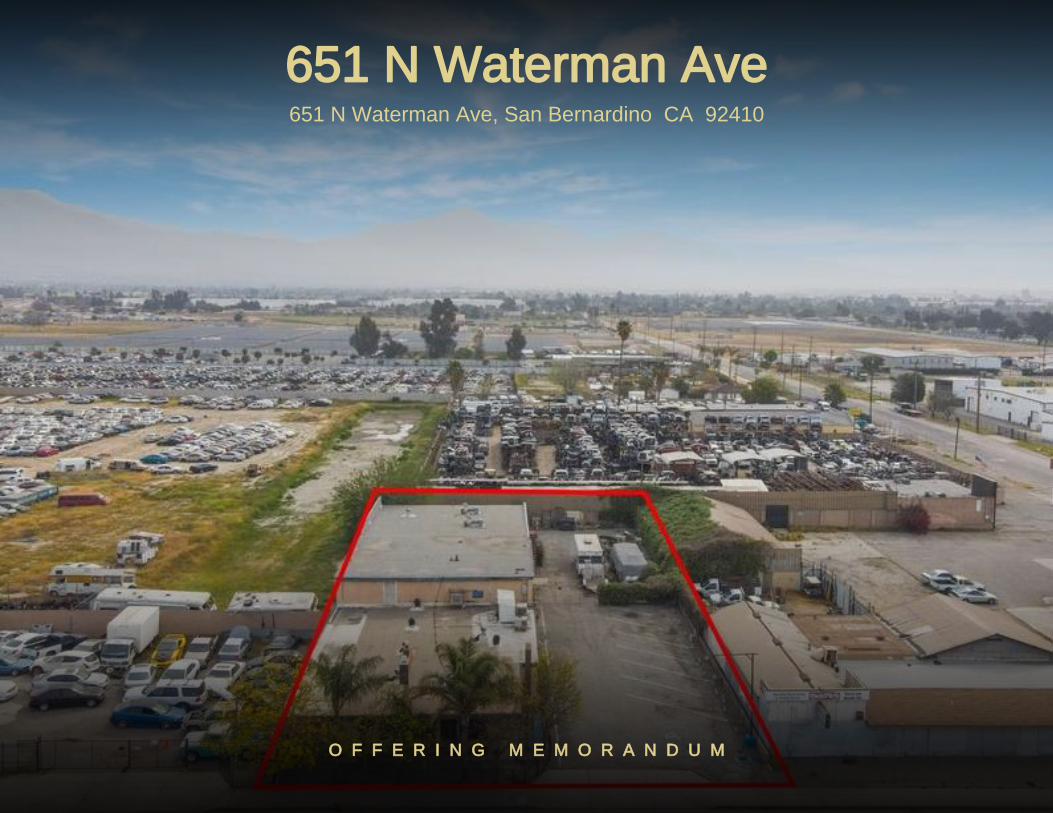
651 N Waterman Ave651 N Waterman Ave, San Bernardino CA 92410
O F F E R I N G M E M O R A N D U M
651 N Waterman AveCONTENTS
Inquire today:
Silvestre Madrigal(562) [email protected]: CalDRE #01363650
We obtained the following information above from sources we believe to be reliable. However, we have not verified its accuracy and make no guarantee, warranty or representation about it. It is submitted subject to the possibility of errors, omissions, change of price, rental or otherconditions, prior sale, lease or financing, or withdrawal without notice. We include projections, opinions, assumptions or estimates for example only, and they may not represent the current or future performance of the property. You and your tax and legal advisors should conduct yourown investigation of the property and transaction.
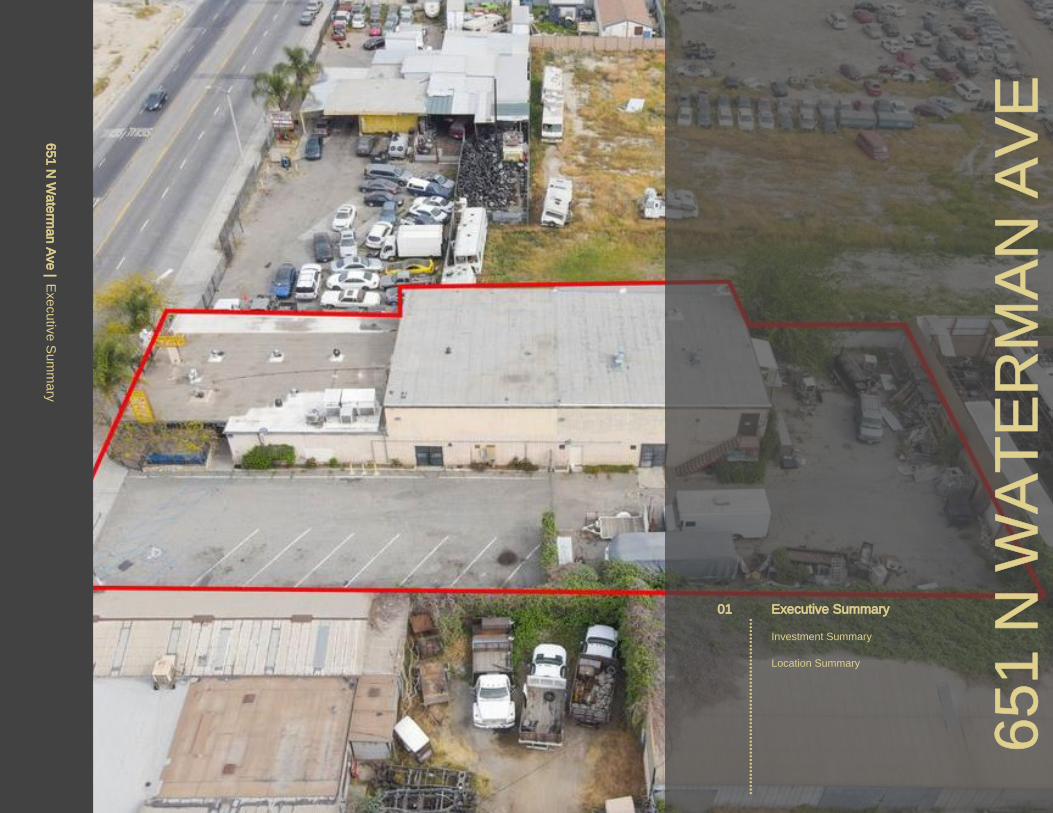
01 Executive Summary Investment Summary Location Summary
02 Property Description Property Features Aerial Map
Property Images
03 Demographics Demographics Demographic Charts
651 N W
aterman Ave | Executive Sum
mary
Executive Summary
651
N W
ATER
MAN
AVE
01
......
......
......
......
......
......
......
......
Investment Summary
Location Summary
Investment Summary | 651 N Waterman Ave 4
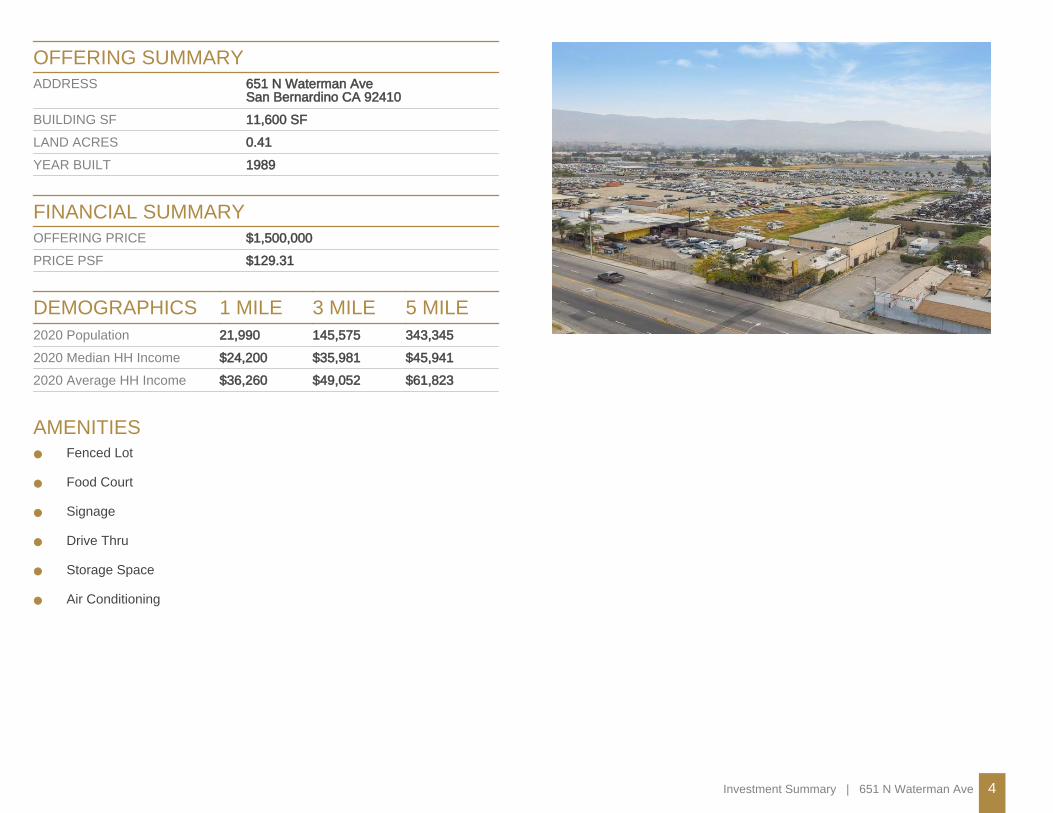
OFFERING SUMMARYADDRESS 651 N Waterman Ave
San Bernardino CA 92410BUILDING SF 11,600 SFLAND ACRES 0.41YEAR BUILT 1989
FINANCIAL SUMMARYOFFERING PRICE $1,500,000PRICE PSF $129.31
DEMOGRAPHICS 1 MILE 3 MILE 5 MILE2020 Population 21,990 145,575 343,3452020 Median HH Income $24,200 $35,981 $45,9412020 Average HH Income $36,260 $49,052 $61,823
AMENITIES• Fenced Lot
• Food Court
• Signage
• Drive Thru
• Storage Space
• Air Conditioning
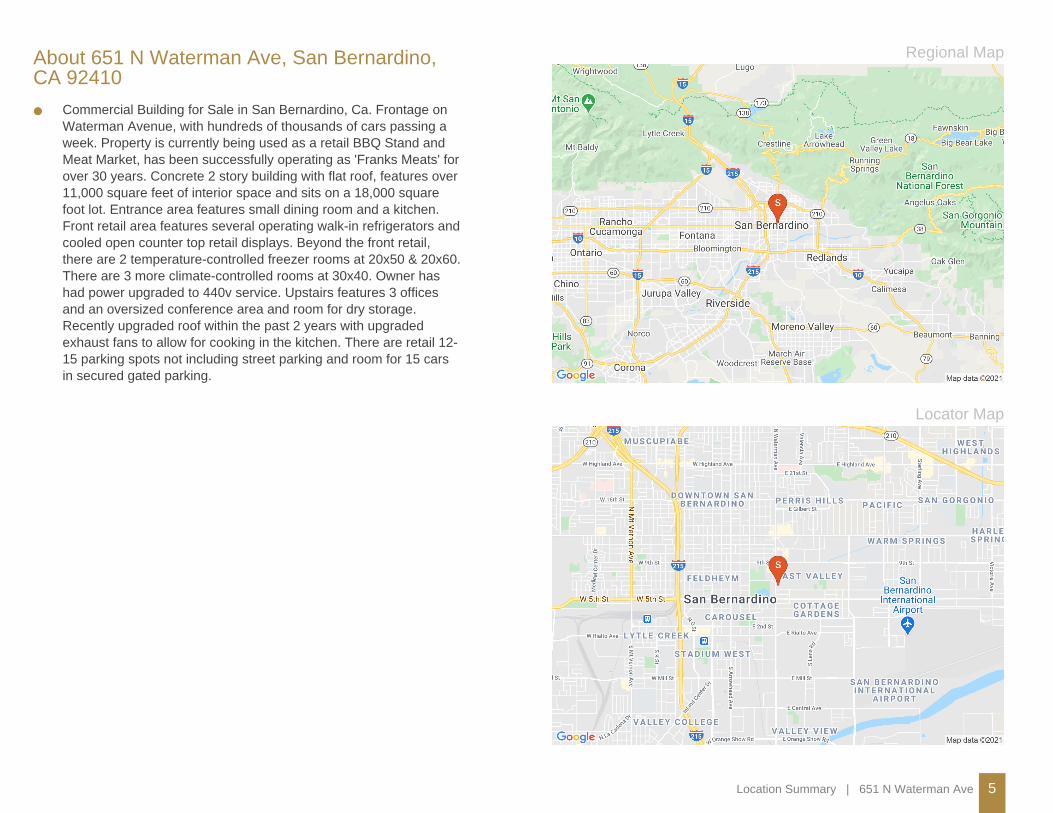
Location Summary | 651 N Waterman Ave 5
Regional Map
Locator Map
About 651 N Waterman Ave, San Bernardino,CA 92410
• Commercial Building for Sale in San Bernardino, Ca. Frontage onWaterman Avenue, with hundreds of thousands of cars passing aweek. Property is currently being used as a retail BBQ Stand andMeat Market, has been successfully operating as 'Franks Meats' forover 30 years. Concrete 2 story building with flat roof, features over11,000 square feet of interior space and sits on a 18,000 squarefoot lot. Entrance area features small dining room and a kitchen.Front retail area features several operating walk-in refrigerators andcooled open counter top retail displays. Beyond the front retail,there are 2 temperature-controlled freezer rooms at 20x50 & 20x60.There are 3 more climate-controlled rooms at 30x40. Owner hashad power upgraded to 440v service. Upstairs features 3 officesand an oversized conference area and room for dry storage.Recently upgraded roof within the past 2 years with upgradedexhaust fans to allow for cooking in the kitchen. There are retail 12-15 parking spots not including street parking and room for 15 carsin secured gated parking.
651 N W
aterman Ave | Property D
escription
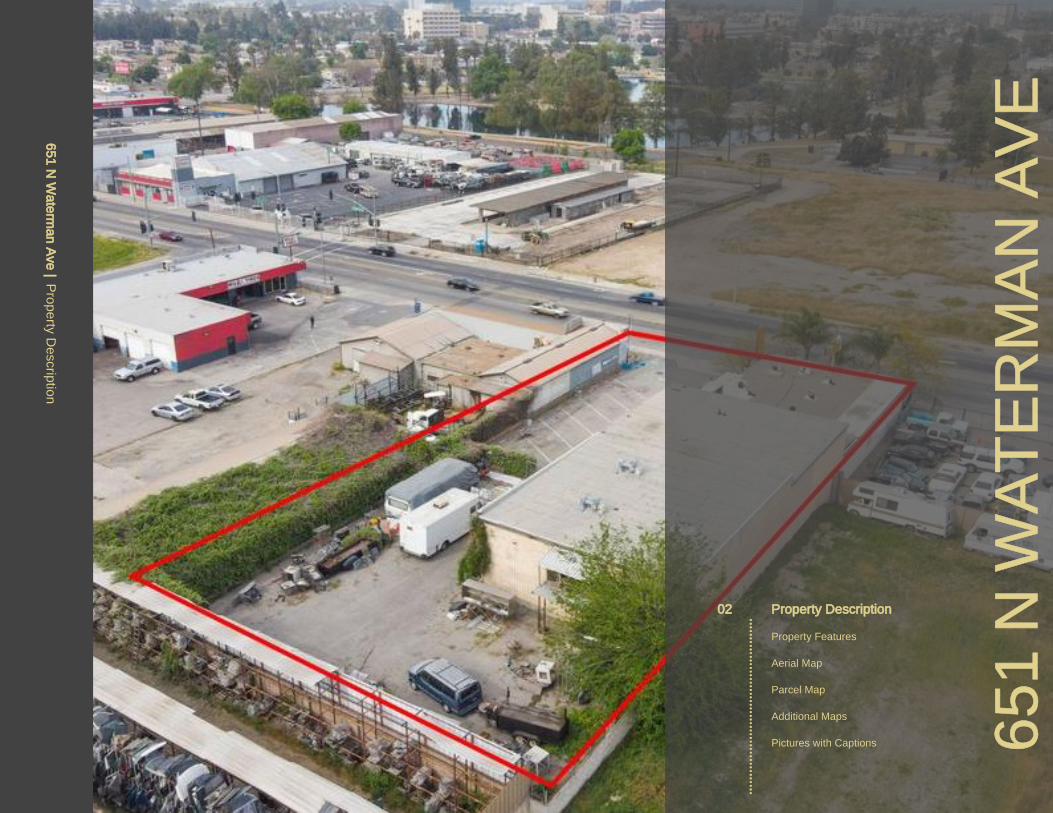
Property Description
651
N W
ATER
MAN
AVE
02
......
......
......
......
......
......
......
......
Property Features
Aerial Map
Parcel Map
Additional Maps
Pictures with Captions

Property Features | 651 N Waterman Ave 7
PROPERTY FEATURESBUILDING SF 11,600LAND ACRES 0.41YEAR BUILT 1989BUILDING CLASS CNUMBER OF STORIES 1NUMBER OF PARKING SPACES 18

Aerial Map | 651 N Waterman Ave 8

| 651 N Waterman Ave 9

Property Images | 651 N Waterman Ave 10

Property Images | 651 N Waterman Ave 11
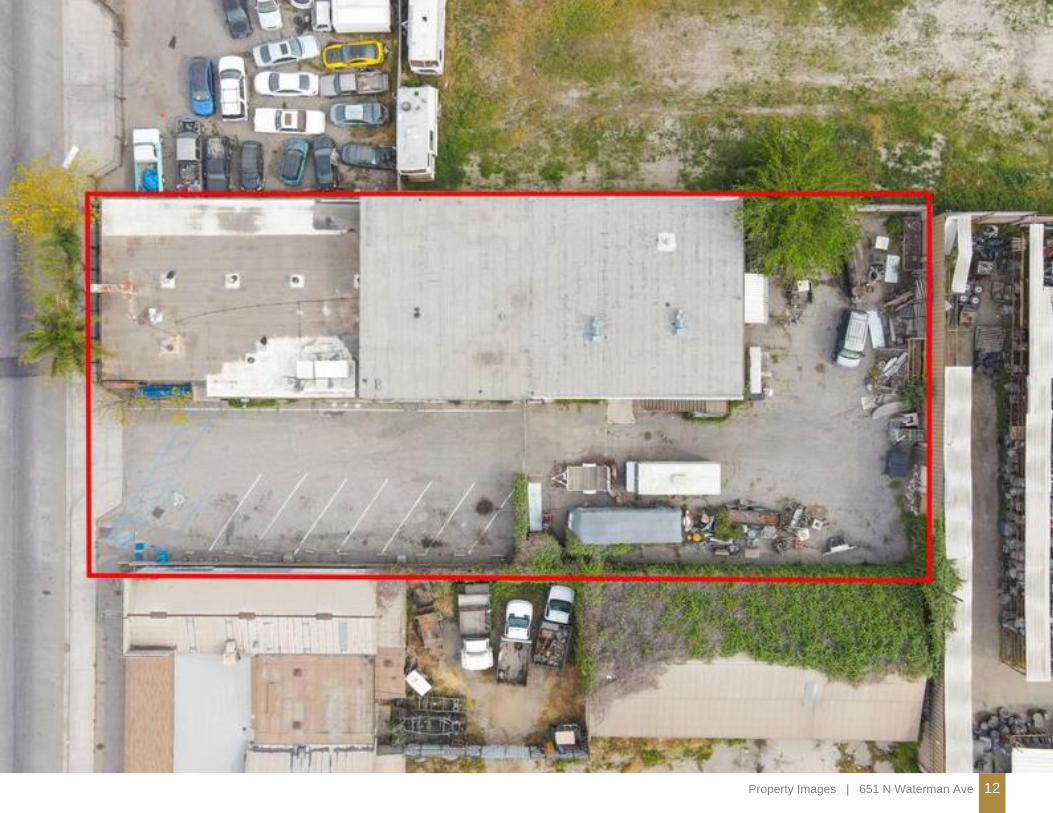
Property Images | 651 N Waterman Ave 12

Property Images | 651 N Waterman Ave 13

651 N W
aterman Ave | D
emographics
Demographics
651
N W
ATER
MAN
AVE
03
......
......
......
......
......
......
......
......
Demographic Details
Demographic Charts
Demographics | 651 N Waterman Ave 15
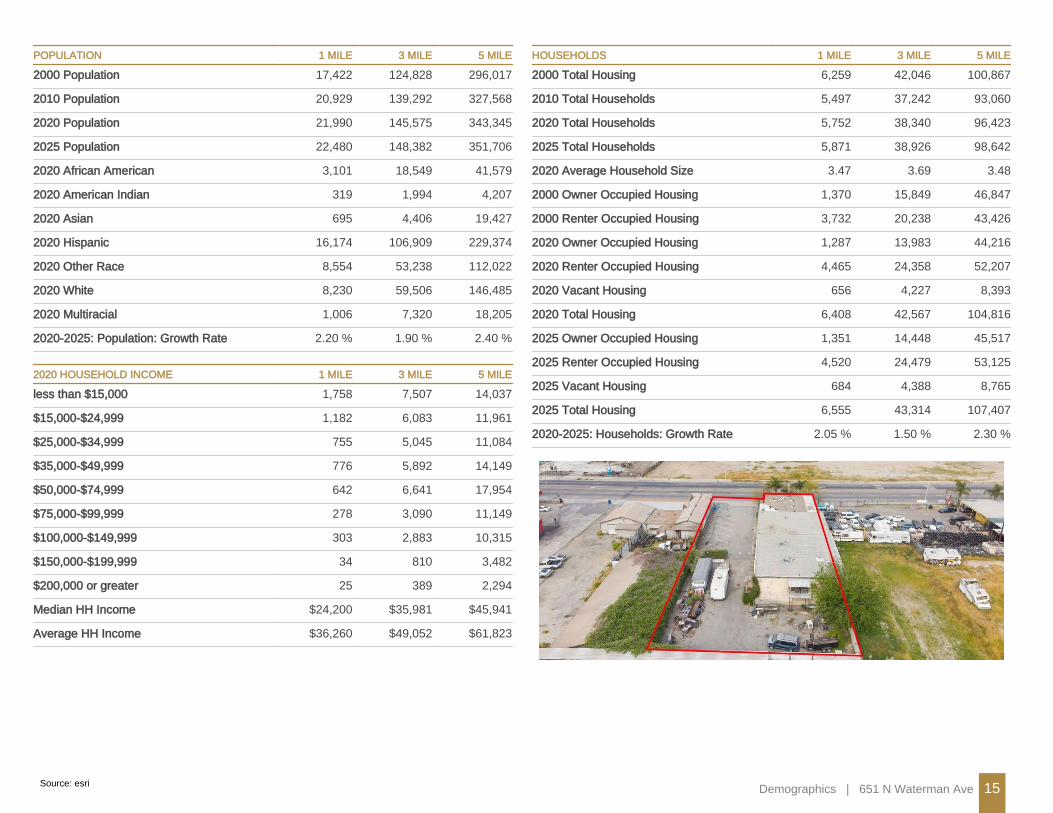
POPULATION 1 MILE 3 MILE 5 MILE
2000 Population 17,422 124,828 296,017
2010 Population 20,929 139,292 327,568
2020 Population 21,990 145,575 343,345
2025 Population 22,480 148,382 351,706
2020 African American 3,101 18,549 41,579
2020 American Indian 319 1,994 4,207
2020 Asian 695 4,406 19,427
2020 Hispanic 16,174 106,909 229,374
2020 Other Race 8,554 53,238 112,022
2020 White 8,230 59,506 146,485
2020 Multiracial 1,006 7,320 18,205
2020-2025: Population: Growth Rate 2.20 % 1.90 % 2.40 %
2020 HOUSEHOLD INCOME 1 MILE 3 MILE 5 MILE
less than $15,000 1,758 7,507 14,037
$15,000-$24,999 1,182 6,083 11,961
$25,000-$34,999 755 5,045 11,084
$35,000-$49,999 776 5,892 14,149
$50,000-$74,999 642 6,641 17,954
$75,000-$99,999 278 3,090 11,149
$100,000-$149,999 303 2,883 10,315
$150,000-$199,999 34 810 3,482
$200,000 or greater 25 389 2,294
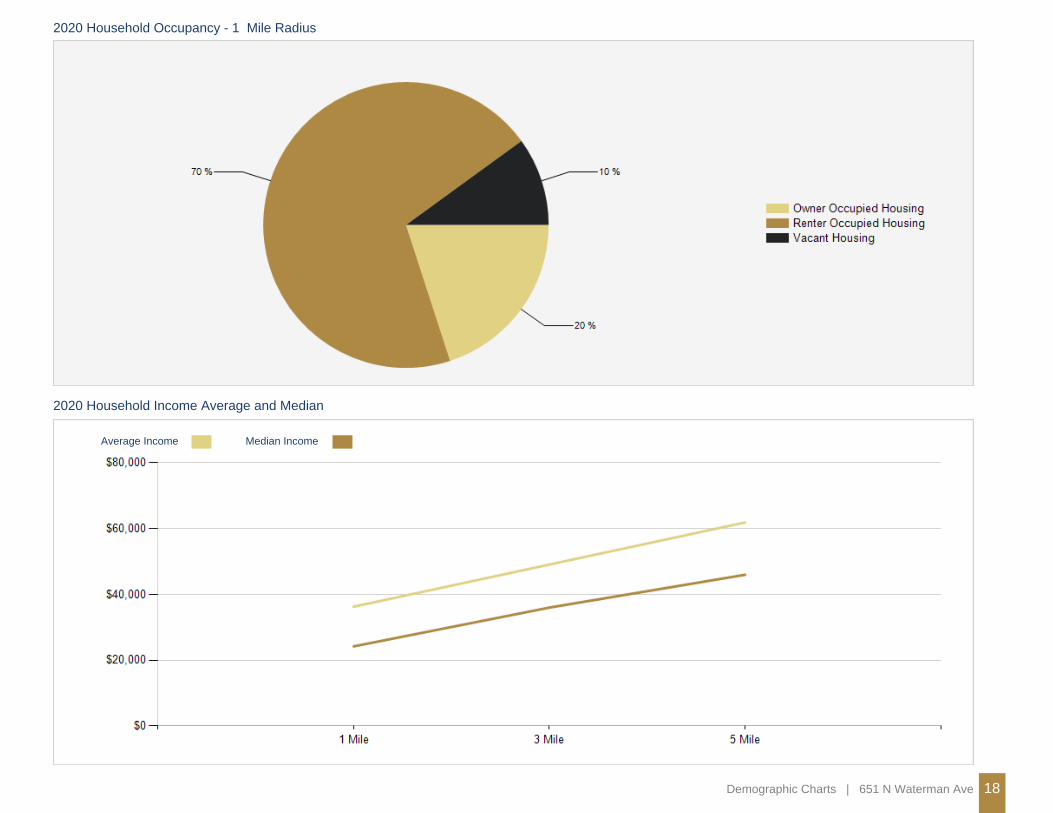
Median HH Income $24,200 $35,981 $45,941
Average HH Income $36,260 $49,052 $61,823
HOUSEHOLDS 1 MILE 3 MILE 5 MILE
2000 Total Housing 6,259 42,046 100,867
2010 Total Households 5,497 37,242 93,060
2020 Total Households 5,752 38,340 96,423
2025 Total Households 5,871 38,926 98,642
2020 Average Household Size 3.47 3.69 3.48
2000 Owner Occupied Housing 1,370 15,849 46,847
2000 Renter Occupied Housing 3,732 20,238 43,426
2020 Owner Occupied Housing 1,287 13,983 44,216
2020 Renter Occupied Housing 4,465 24,358 52,207
2020 Vacant Housing 656 4,227 8,393
2020 Total Housing 6,408 42,567 104,816
2025 Owner Occupied Housing 1,351 14,448 45,517
2025 Renter Occupied Housing 4,520 24,479 53,125
2025 Vacant Housing 684 4,388 8,765
2025 Total Housing 6,555 43,314 107,407
2020-2025: Households: Growth Rate 2.05 % 1.50 % 2.30 %
Source: esri

Demographics | 651 N Waterman Ave 16
2020 POPULATION BY AGE 1 MILE 3 MILE 5 MILE
2020 Population Age 30-34 1,764 11,233 27,562
2020 Population Age 35-39 1,554 8,935 22,190
2020 Population Age 40-44 1,216 7,545 18,415
2020 Population Age 45-49 1,146 7,485 17,981
2020 Population Age 50-54 1,047 7,332 17,810
2020 Population Age 55-59 888 6,798 17,244
2020 Population Age 60-64 770 5,891 15,601
2020 Population Age 65-69 569 4,495 12,077
2020 Population Age 70-74 419 3,149 8,800
2020 Population Age 75-79 261 2,044 5,800
2020 Population Age 80-84 130 1,244 3,742
2020 Population Age 85+ 170 1,355 4,089
2020 Population Age 18+ 14,802 98,429 242,481
2020 Median Age 28 28 30
2020 INCOME BY AGE 1 MILE 3 MILE 5 MILE
Median Household Income 25-34 $28,523 $40,111 $50,989
Average Household Income 25-34 $40,194 $51,961 $62,683
Median Household Income 35-44 $28,589 $38,040 $50,692
Average Household Income 35-44 $40,436 $53,441 $68,217
Median Household Income 45-54 $30,571 $44,305 $55,406
Average Household Income 45-54 $42,504 $56,462 $71,044
Median Household Income 55-64 $24,909 $38,609 $50,847
Average Household Income 55-64 $34,737 $49,740 $64,484
Median Household Income 65-74 $15,766 $29,843 $37,996
Average Household Income 65-74 $25,497 $39,504 $53,592
Average Household Income 75+ $23,060 $34,686 $44,018
2025 POPULATION BY AGE 1 MILE 3 MILE 5 MILE
2025 Population Age 30-34 1,890 12,516 29,664
2025 Population Age 35-39 1,704 10,608 26,358
2025 Population Age 40-44 1,396 8,636 21,536
2025 Population Age 45-49 1,171 7,309 17,944
2025 Population Age 50-54 1,013 6,956 16,985
2025 Population Age 55-59 916 6,565 16,327
2025 Population Age 60-64 787 6,028 15,670
2025 Population Age 65-69 682 5,065 13,534
2025 Population Age 70-74 475 3,672 10,143
2025 Population Age 75-79 343 2,537 7,326
2025 Population Age 80-84 184 1,442 4,390
2025 Population Age 85+ 157 1,291 4,104
2025 Population Age 18+ 15,370 100,585 248,842
2025 Median Age 29 29 31
2025 INCOME BY AGE 1 MILE 3 MILE 5 MILE
Median Household Income 25-34 $30,426 $43,758 $53,509
Average Household Income 25-34 $43,777 $55,959 $67,659
Median Household Income 35-44 $30,608 $41,074 $55,592
Average Household Income 35-44 $43,964 $58,702 $75,642
Median Household Income 45-54 $33,591 $49,027 $59,197
Average Household Income 45-54 $46,859 $62,432 $78,760
Median Household Income 55-64 $27,075 $41,345 $53,754
Average Household Income 55-64 $38,504 $54,616 $71,365
Median Household Income 65-74 $16,691 $31,907 $40,161
Average Household Income 65-74 $27,872 $42,949 $58,950
Average Household Income 75+ $25,217 $37,571 $49,205

Demographic Charts | 651 N Waterman Ave 17
1 Mile Radius 3 Mile Radius 5 Mile Radius
2020 Household Income
1 Mile Radius 3 Mile Radius 5 Mile Radius
2020 Population by Race
Demographic Charts | 651 N Waterman Ave 18
2020 Household Occupancy - 1 Mile Radius
Average Income Median Income
2020 Household Income Average and Median

651 N Waterman Ave
Inquire today:
Silvestre Madrigal(562) [email protected]: CalDRE #01363650
CONFIDENTIALITY and DISCLAIMERThe information contained in the following offering memorandum is proprietary andstrictly confidential. It is intended to be reviewed only by the party receiving it fromCentury 21 Commercial Cornerstone Group and it should not be made available toany other person or entity without the written consent of Century 21 CommercialCornerstone Group.
By taking possession of and reviewing the information contained herein the recipientagrees to hold and treat all such information in the strictest confidence. Therecipient further agrees that recipient will not photocopy or duplicate any part of theoffering memorandum. If you have no interest in the subject property, pleasepromptly return this offering memorandum to Century 21 Commercial CornerstoneGroup. This offering memorandum has been prepared to provide summary,unverified financial and physical information to prospective purchasers, and toestablish only a preliminary level of interest in the subject property.
The information contained herein is not a substitute for a thorough due diligenceinvestigation. Century 21 Commercial Cornerstone Group has not made anyinvestigation, and makes no warranty or representation with respect to the income orexpenses for the subject property, the future projected financial performance of theproperty, the size and square footage of the property and improvements, thepresence or absence of contaminating substances, PCBs or asbestos, thecompliance with local, state and federal regulations, the physical condition of theimprovements thereon, or financial condition or business prospects of any tenant, orany tenant’s plans or intentions to continue its occupancy of the subject property.
The information contained in this offering memorandum has been obtained fromsources we believe reliable; however, Century 21 Commercial Cornerstone Grouphas not verified, and will not verify, any of the information contained herein, nor hasCentury 21 Commercial Cornerstone Group conducted any investigation regardingthese matters and makes no warranty or representation whatsoever regarding theaccuracy or completeness of the information provided. All potential buyers must takeappropriate measures to verify all of the information set forth herein. Prospectivebuyers shall be responsible for their costs and expenses of investigating the subjectproperty.
powered by CREOP


