6DoF Motion Estimation for UAV Landing on a Moving Shipdeck using Real-Time On-Board Vision Shanggang Lin 1 , Matt Garratt 1 , Andrew Lambert 1 , and Ping Li 1 1 UNSW Australia, Canberra, ACT 2612, Australia {Shanggang.Lin,[email protected],{M.Garratt,A.Lambert}@adfa.edu.au} Abstract We present a vision system for UAV ship- board landing applications. It aims to de- tect and track the international landing marker and measures the relative 6DoF pose of the shipdeck with respect to the vehicle. An ad- ditional vision sensor is adopted to increase re- dundancy. Real-time on-board flight tests with achieved closed-loop control demonstrate that the vision system is fast, precise and capable of estimating 6DoF motion of a moving shipdeck while performing target tracking, which proves the feasibility and quality of our approach. 1 Introduction We aim at developing a feasible way for autonomously landing an Unmanned Aerial Vehicles (UAV) on a ship’s moving flight deck, after it completes operations such as coastline patrol, reconnaissance, surveillance and pay- load delivery. Among those different types of UAVs, fixed-wing UAVs travel at higher speeds and fly for longer ranges than rotary-wing UAVs (RUAVs), but re- quire runway that small ships don’t have for taking- off and landing in many scenarios. In contrast, RU- AVs including multi-rotor UAVs and conventional he- licopters are able to perform vertical take-off and land- ing (VTOL), low-speed fight, low-altitude hovering and are highly maneuverable. These unique abilities make them particularly suitable for small ships, thus we tar- get RUAV operations in our work. The whole landing procedure consists of several stages, each stage comes with critical challenges. First, a proper landing area must be pre-located before approaching to the deck. Second, once located the UAV should be able to lock on that specific area and start following the ship. Then the relative pose between the UAV and the deck is to be properly estimated. Finally, a safe trajectory must be generated to finalize landing. We consider the first and second stages as landing target recognition and tracking problem, treat the third stage as pose estima- tion problem, and regard the final stage as a combination of path planning and quiescent period prediction prob- lem. At the current stage of development, we aim to solve the first two problems and leave the last one for our future research. We address the necessity of developing a vision sys- tem to assist UAVs landing on shipdeck, which provides reliable target tracking and pose estimation, whilst be- ing able to deal with a partially occluded target caused by rain, fog or shipdeck infrastructures. In this paper a further improved vision system based on our previous development is proposed [Lin et al., 2015]. While main- taining robustness, precision, real-time implementation and the capability of dealing with occlusion, the vision system has the ability to track the international land- ing marker and estimate the relative 6 degrees of free- dom (6DoF) pose between the UAV and the deck during continuous shipdeck movements, where its feasibility is demonstrated via closed-loop flight tests with on-board vision processing. To our best knowledge, other research groups haven’t reached this stage yet. This paper is constructed as follows: in Section 2 the relevant state of the art is introduced, then the vision system is explained in detail in Section 3. Section 4 and 5 show the experiment platform and discuss the flight test results. 2 Related Work Some previous achievements require additional on-deck infrastructures to assist VTOL UAVs landing, which include the UAV Common Automatic Recovery Sys- tem (UCARS) provided by Sierra Nevada Corp. and other systems based on high precision differential GPS (DGPS) and beacons [S. N. Corporation, 2006]. Al- though these systems can provide precise relative pose measurement of the shipdeck, they need to have a sub- system on the deck to transmit the measured data to the UAV by radio signals. Such configuration prevents an UAV from landing on an unequipped ship, which is
Transcript
6DoF Motion Estimation for UAV Landing on a Moving Shipdeckusing Real-Time On-Board Vision
Shanggang Lin1, Matt Garratt1, Andrew Lambert1, and Ping Li11UNSW Australia, Canberra, ACT 2612, Australia
We present a vision system for UAV ship-board landing applications. It aims to de-tect and track the international landing markerand measures the relative 6DoF pose of theshipdeck with respect to the vehicle. An ad-ditional vision sensor is adopted to increase re-dundancy. Real-time on-board flight tests withachieved closed-loop control demonstrate thatthe vision system is fast, precise and capable ofestimating 6DoF motion of a moving shipdeckwhile performing target tracking, which provesthe feasibility and quality of our approach.
1 Introduction
We aim at developing a feasible way for autonomouslylanding an Unmanned Aerial Vehicles (UAV) on a ship’smoving flight deck, after it completes operations such ascoastline patrol, reconnaissance, surveillance and pay-load delivery. Among those different types of UAVs,fixed-wing UAVs travel at higher speeds and fly forlonger ranges than rotary-wing UAVs (RUAVs), but re-quire runway that small ships don’t have for taking-off and landing in many scenarios. In contrast, RU-AVs including multi-rotor UAVs and conventional he-licopters are able to perform vertical take-off and land-ing (VTOL), low-speed fight, low-altitude hovering andare highly maneuverable. These unique abilities makethem particularly suitable for small ships, thus we tar-get RUAV operations in our work.
The whole landing procedure consists of several stages,each stage comes with critical challenges. First, a properlanding area must be pre-located before approaching tothe deck. Second, once located the UAV should be ableto lock on that specific area and start following the ship.Then the relative pose between the UAV and the deckis to be properly estimated. Finally, a safe trajectorymust be generated to finalize landing. We consider thefirst and second stages as landing target recognition and
tracking problem, treat the third stage as pose estima-tion problem, and regard the final stage as a combinationof path planning and quiescent period prediction prob-lem. At the current stage of development, we aim tosolve the first two problems and leave the last one forour future research.
We address the necessity of developing a vision sys-tem to assist UAVs landing on shipdeck, which providesreliable target tracking and pose estimation, whilst be-ing able to deal with a partially occluded target causedby rain, fog or shipdeck infrastructures. In this papera further improved vision system based on our previousdevelopment is proposed [Lin et al., 2015]. While main-taining robustness, precision, real-time implementationand the capability of dealing with occlusion, the visionsystem has the ability to track the international land-ing marker and estimate the relative 6 degrees of free-dom (6DoF) pose between the UAV and the deck duringcontinuous shipdeck movements, where its feasibility isdemonstrated via closed-loop flight tests with on-boardvision processing. To our best knowledge, other researchgroups haven’t reached this stage yet.
This paper is constructed as follows: in Section 2 therelevant state of the art is introduced, then the visionsystem is explained in detail in Section 3. Section 4 and5 show the experiment platform and discuss the flighttest results.
2 Related Work
Some previous achievements require additional on-deckinfrastructures to assist VTOL UAVs landing, whichinclude the UAV Common Automatic Recovery Sys-tem (UCARS) provided by Sierra Nevada Corp. andother systems based on high precision differential GPS(DGPS) and beacons [S. N. Corporation, 2006]. Al-though these systems can provide precise relative posemeasurement of the shipdeck, they need to have a sub-system on the deck to transmit the measured data tothe UAV by radio signals. Such configuration preventsan UAV from landing on an unequipped ship, which is
the main disadvantage of these systems. Moreover, theexpensive cost prohibits the widespread use of these sys-tems.
Instead, using vision sensors in guiding an UAV to-ward the shipdeck and land has become a researchhotspot recently. The advantages of vision sensors arelight weight, low cost, and easy operation. They can pro-vide rich information about the shipdeck environment forvisual processing. Moreover, they can couple with othersensor setups such as Inertial Measurement Units (IMU)or GPS to form more reliable measurements.
Some vision-based approaches for locating the land-ing area rely on having artificial, customized markerson the deck, with distinguishing features that have astrong contrast to the background (usually painted inblack color within a white background or vice versa).Common shapes used for markers are squares, cir-cles and other geometric patterns [Xu et al., 2006;Lee et al., 2012]. After thresholding, certain image pro-cessing techniques such as corner detection and labeling,ellipse fitting and contour detection are applied to locatethe marker within the image. For example, Xu et al.make use of a ”T” shaped pattern with an infrared cam-era to detect the pose and position of the ship deck [Xuet al., 2009]. Arora et al. apply a LIDAR-based tech-nique for tracking a standard US Naval shipdeck mark-ing, which declares that it is infrastructure free, but mul-tiple sensors are needed including active laser to increasethe redundancy [Arora et al., 2013]. Previously our re-search group developed a system based on LIDAR inconjunction with a single beacon to locate the shipdeck[Garratt et al., 2009]. Although the works summarizedhere have demonstrated the capability of the vision sys-tems, having a customized marker on the deck may inter-fere with manned landing operations which have strictstandards for deck markings and lighting arrangements.
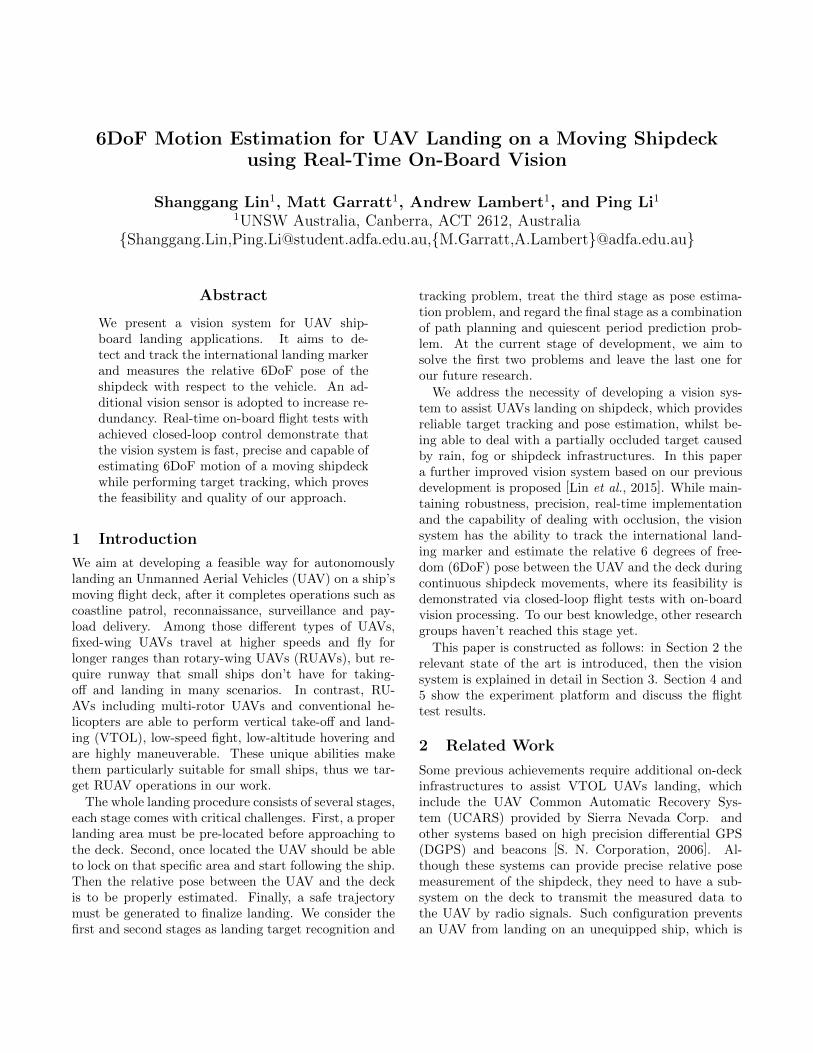
An alternative to custom markers is to use the inter-national landing pattern, which consists of a letter “H”and a surrounding circle. Beneficially, RUAVs can landon ships equipped with such a pattern whilst not inter-fering with the existing manned helicopter operations.An early approach by Saripalli et al. performed invari-ant moment calculation on a landing marker which hasan individual “H” letter, but the method is sensitive tosize variation and rotation [Saripalli et al., 2003]. Shiet al. treat a similar “H” marker by means of cornerlabeling and rectangle fitting, using a method which isable to recognize a slightly incomplete marker [Shi andWang, 2009]. However, both of the works only deal withthe “H” letter. None of them has proven applicable torecognize an international landing marker. Yang et al.apply the solution of solving the sign detection problemto detect the international landing marker [Yang et al.,2009]. Evidence show that they can locate the marker ly-
ing within a cluttered background, but it has to be fullypresented (Figure 1(a)). Sanchez-Lopez et al. introducean Artificial Neural Network (ANN) with a 7-layers de-cision tree to recognize the marker in a cluttered envi-ronment (Figure 1(b)), but only achieve 6fps on a lap-top computer equipped with an Intel i3 CPU due to theheavy-processing load and no on-board vision processingor closed-loop flight tests is proposed [Sanchez-Lopez etal., 2014]. We address the need to have a marker detec-tion method which is accurate, robust to random occlu-sion and running at a much faster speed.
(a) (b)
Figure 1: The international landing marker: (a) Marker de-tection based on connected component method [Yang et al.,2009]. (b) Marker recognition with occlusion using ArtificialNeural Network [Sanchez-Lopez et al., 2014].
In order to land, the vision system should have theability to estimate the relative pose between the shipdeckand itself after successfully locating the landing marker.The precision of pose estimation is of crucial importanceto the control system. Yakimenko et al. solve the poseestimation problem by means of contributing a solu-tion to the P3P (Perspective-3-Points) problem basedon three infrared reference points on a runway [Yaki-menko et al., 2002]. In Saripalli’s work it obtains 3DoFpose estimation from vision, but relies on the GPS’s ve-hicle height information as a precondition [Saripalli etal., 2003]. Their method for estimating x and y posi-tions is also adopted in Shi’s implementation [Shi andWang, 2009]. Xu et al. derive the 3D positions andyaw angle of their landing marker based on stereo tri-angulation, but no pitch or roll movement is involved[Xu et al., 2006]. Eberli et al. propose a 5DoF poseestimation method based on a landmark comprised oftwo concentric circles, whereas the heading of the UAVstill remains ambiguous [Eberli et al., 2011]. In [Yanget al., 2009], the 5DoF pose estimation is achieved bymeans of ellipse fitting, whilst the yaw angle is calcu-lated from the “H” pattern. However, it may producea much larger error if distortion occurs on the ellipse,especially when the ellipse is occluded. The works sum-marized above assume the landing marker to be station-ary or only has several DoF motion. Sanchez-Lopez’swork is the first to consider landing on a 6DoF movingplatform [Sanchez-Lopez et al., 2014]. The relative pose
No
Yes
No
Yes
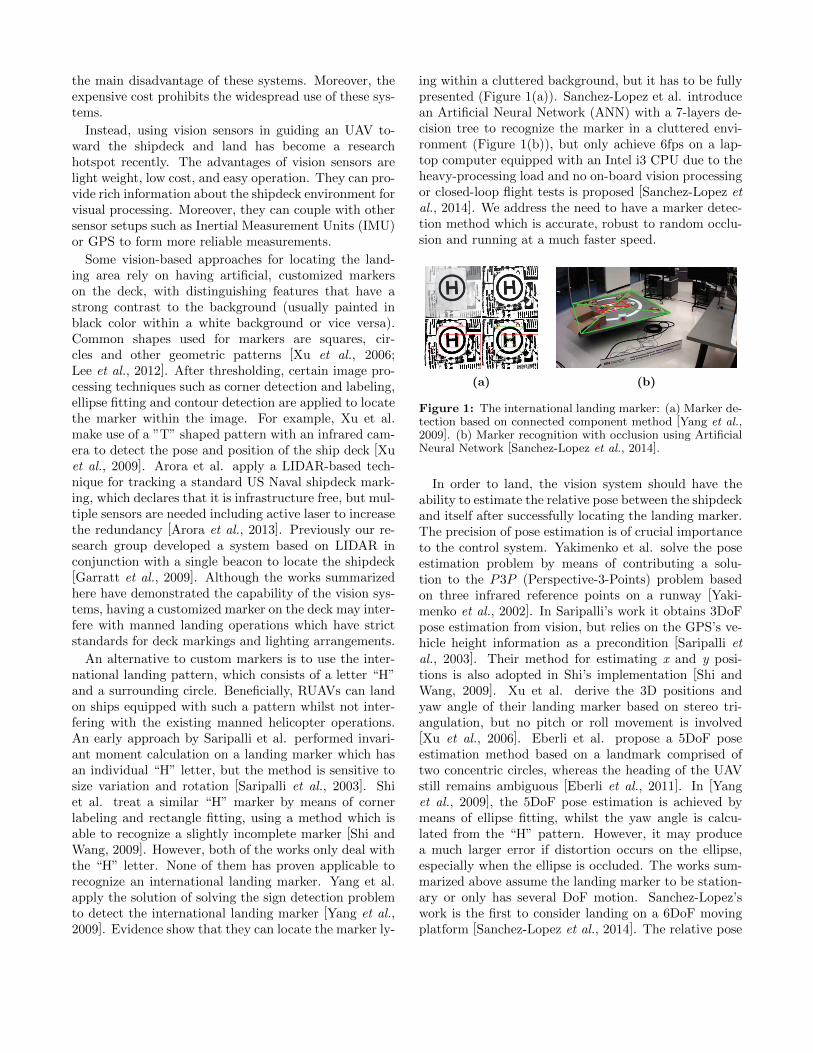
Figure 2: Vision system flow chart.
estimation is mainly based on solving the Perspective-n-Points (PnP) problem, which requires at least the “H”pattern to be complete so that the co-planar correspond-ing points can be located [Lepetit et al., 2009]. Never-theless, PnP is very sensitive to image pixel error. In ourwork, we only introduce PnP as a supplementary methodto work out pitch and roll angles, whilst adopting an-other vision-based approach to calculate the relative 3Dpositions and yaw angle. Moreover, the target detectionoutput minimizes the pixel error of the correspondingpoints, which guarantees the precision of measurement.An evaluation scheme in conjunction with an additionalvision sensor are adopted to further increase the preci-sion of pose estimation and redundancy of the system.
3 The Vision Approach
Our vision system consists of six stages: image pre-processing, line segment processing, cascade filtering,target refinement, information gathering with patternreconstruction and pose estimation. The output of thesystem will be the 3D positions as well as the pitch androll angles of the landing marker w.r.t the UAV, and theheading (yaw angle) of the vehicle. Figure 2 is a flowchart of the vision system.
3.1 Landing Marker Analysis
Due to the symmetry of the “H” marker, we can cat-egorize the 12 line segments into four different groupsdue to their positions and lengths. Moreover, the per-pendicularity and parallelity of the line groups are otherimportant properties. During large shipdeck motions,perspective distortion may degrade these features. Butwe can still use such properties to a certain extent. Be-fore the experiment we take a scaled international land-ing marker and measure the physical length of each line
group as well as the proportion of lengths of every twoconnected lines, as illustrated in Figure 3 and Table 1.We will make use of them in the following sections.
Figure 3: Properties of the international landing marker.
Table 1: Look-up table for proportion calculation
color
value colorblue yellow green red
blue 4.27yellow 1.146green 0.873 1.45red 0.234 0.688
3.2 Image Pre-processing
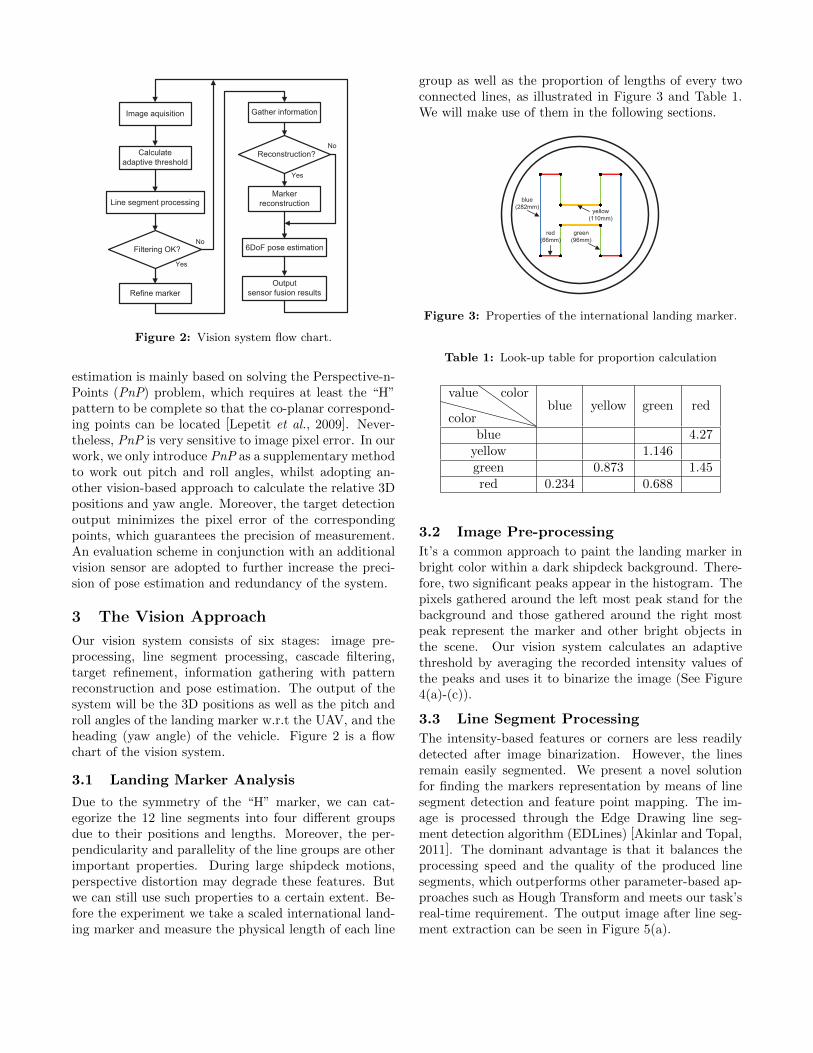
It’s a common approach to paint the landing marker inbright color within a dark shipdeck background. There-fore, two significant peaks appear in the histogram. Thepixels gathered around the left most peak stand for thebackground and those gathered around the right mostpeak represent the marker and other bright objects inthe scene. Our vision system calculates an adaptivethreshold by averaging the recorded intensity values ofthe peaks and uses it to binarize the image (See Figure4(a)-(c)).
3.3 Line Segment Processing
The intensity-based features or corners are less readilydetected after image binarization. However, the linesremain easily segmented. We present a novel solutionfor finding the markers representation by means of linesegment detection and feature point mapping. The im-age is processed through the Edge Drawing line seg-ment detection algorithm (EDLines) [Akinlar and Topal,2011]. The dominant advantage is that it balances theprocessing speed and the quality of the produced linesegments, which outperforms other parameter-based ap-proaches such as Hough Transform and meets our task’sreal-time requirement. The output image after line seg-ment extraction can be seen in Figure 5(a).
(a) (c)
0
2000
4000
6000
8000
10000
12000
14000
nu
mb
er
of
pix
el
intensity value
0 50 100 150 200 250
threshold
peakpeak
(b)
Figure 4: Image pre-processing: (a) The input imitatedshipdeck image. (b) Adaptive threshold calculation based onhistogram analysis. (c) Image after binarization.
Each detected line segment contains a start-point(x1,y1) and an end-point (x2,y2) (units in pixel coor-dinates). The slope k and length l of it are calculatedusing (1) and (2):
k = (y2 − y1)/(x2 − x1). (1)
l =√
(y2 − y1)2 + (x2 − x1)2. (2)
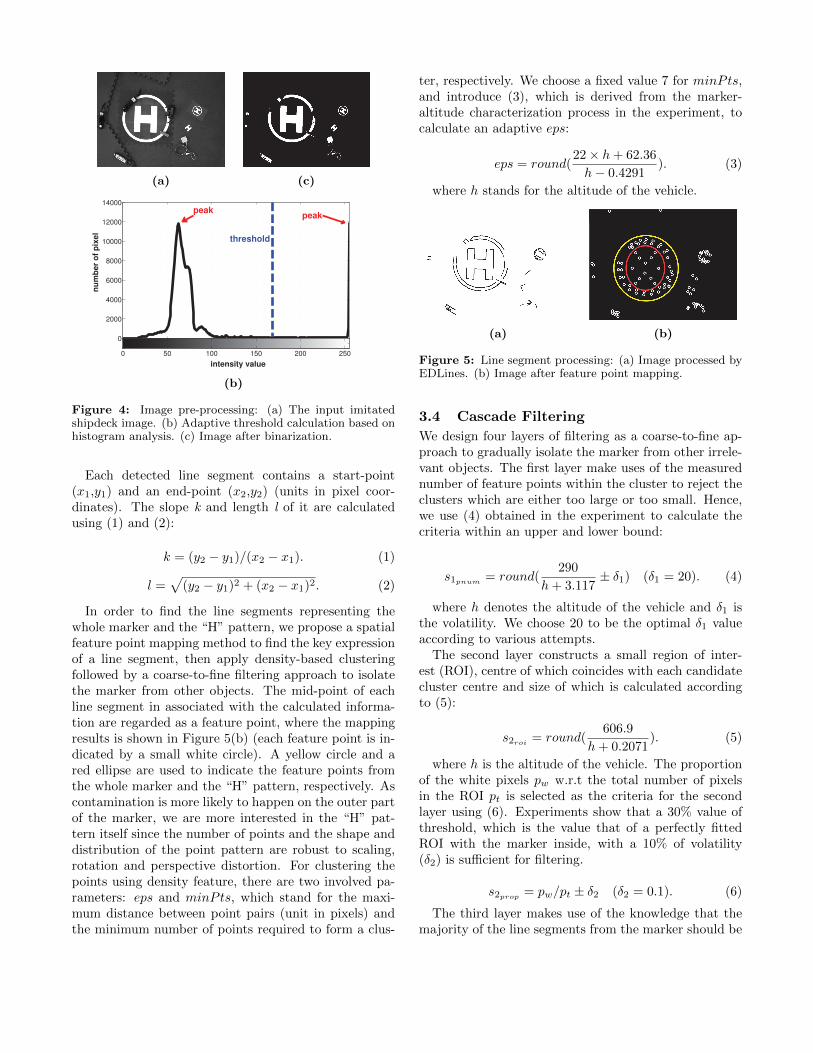
In order to find the line segments representing thewhole marker and the “H” pattern, we propose a spatialfeature point mapping method to find the key expressionof a line segment, then apply density-based clusteringfollowed by a coarse-to-fine filtering approach to isolatethe marker from other objects. The mid-point of eachline segment in associated with the calculated informa-tion are regarded as a feature point, where the mappingresults is shown in Figure 5(b) (each feature point is in-dicated by a small white circle). A yellow circle and ared ellipse are used to indicate the feature points fromthe whole marker and the “H” pattern, respectively. Ascontamination is more likely to happen on the outer partof the marker, we are more interested in the “H” pat-tern itself since the number of points and the shape anddistribution of the point pattern are robust to scaling,rotation and perspective distortion. For clustering thepoints using density feature, there are two involved pa-rameters: eps and minPts, which stand for the maxi-mum distance between point pairs (unit in pixels) andthe minimum number of points required to form a clus-
ter, respectively. We choose a fixed value 7 for minPts,and introduce (3), which is derived from the marker-altitude characterization process in the experiment, tocalculate an adaptive eps:
eps = round(22× h+ 62.36
h− 0.4291). (3)
where h stands for the altitude of the vehicle.
(a) (b)
Figure 5: Line segment processing: (a) Image processed byEDLines. (b) Image after feature point mapping.
3.4 Cascade Filtering
We design four layers of filtering as a coarse-to-fine ap-proach to gradually isolate the marker from other irrele-vant objects. The first layer make uses of the measurednumber of feature points within the cluster to reject theclusters which are either too large or too small. Hence,we use (4) obtained in the experiment to calculate thecriteria within an upper and lower bound:
s1pnum = round(290
h+ 3.117± δ1) (δ1 = 20). (4)
where h denotes the altitude of the vehicle and δ1 isthe volatility. We choose 20 to be the optimal δ1 valueaccording to various attempts.
The second layer constructs a small region of inter-est (ROI), centre of which coincides with each candidatecluster centre and size of which is calculated accordingto (5):
s2roi = round(606.9
h+ 0.2071). (5)
where h is the altitude of the vehicle. The proportionof the white pixels pw w.r.t the total number of pixelsin the ROI pt is selected as the criteria for the secondlayer using (6). Experiments show that a 30% value ofthreshold, which is the value that of a perfectly fittedROI with the marker inside, with a 10% of volatility(δ2) is sufficient for filtering.
s2prop = pw/pt ± δ2 (δ2 = 0.1). (6)
The third layer makes use of the knowledge that themajority of the line segments from the marker should be
within the ROI. If more than 70% of the line segmentsare partially or completely inside the ROI, we considerthe cluster as a candidate.
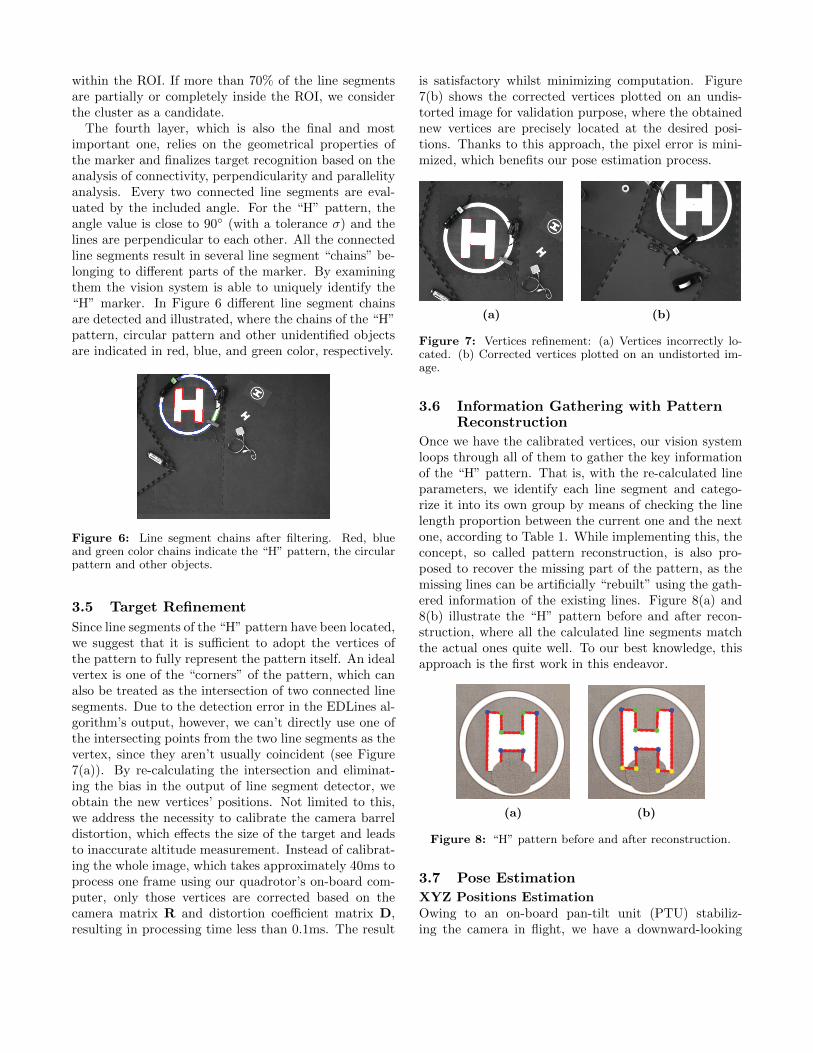
The fourth layer, which is also the final and mostimportant one, relies on the geometrical properties ofthe marker and finalizes target recognition based on theanalysis of connectivity, perpendicularity and parallelityanalysis. Every two connected line segments are eval-uated by the included angle. For the “H” pattern, theangle value is close to 90◦ (with a tolerance σ) and thelines are perpendicular to each other. All the connectedline segments result in several line segment “chains” be-longing to different parts of the marker. By examiningthem the vision system is able to uniquely identify the“H” marker. In Figure 6 different line segment chainsare detected and illustrated, where the chains of the “H”pattern, circular pattern and other unidentified objectsare indicated in red, blue, and green color, respectively.
Figure 6: Line segment chains after filtering. Red, blueand green color chains indicate the “H” pattern, the circularpattern and other objects.
3.5 Target Refinement
Since line segments of the “H” pattern have been located,we suggest that it is sufficient to adopt the vertices ofthe pattern to fully represent the pattern itself. An idealvertex is one of the “corners” of the pattern, which canalso be treated as the intersection of two connected linesegments. Due to the detection error in the EDLines al-gorithm’s output, however, we can’t directly use one ofthe intersecting points from the two line segments as thevertex, since they aren’t usually coincident (see Figure7(a)). By re-calculating the intersection and eliminat-ing the bias in the output of line segment detector, weobtain the new vertices’ positions. Not limited to this,we address the necessity to calibrate the camera barreldistortion, which effects the size of the target and leadsto inaccurate altitude measurement. Instead of calibrat-ing the whole image, which takes approximately 40ms toprocess one frame using our quadrotor’s on-board com-puter, only those vertices are corrected based on thecamera matrix R and distortion coefficient matrix D,resulting in processing time less than 0.1ms. The result
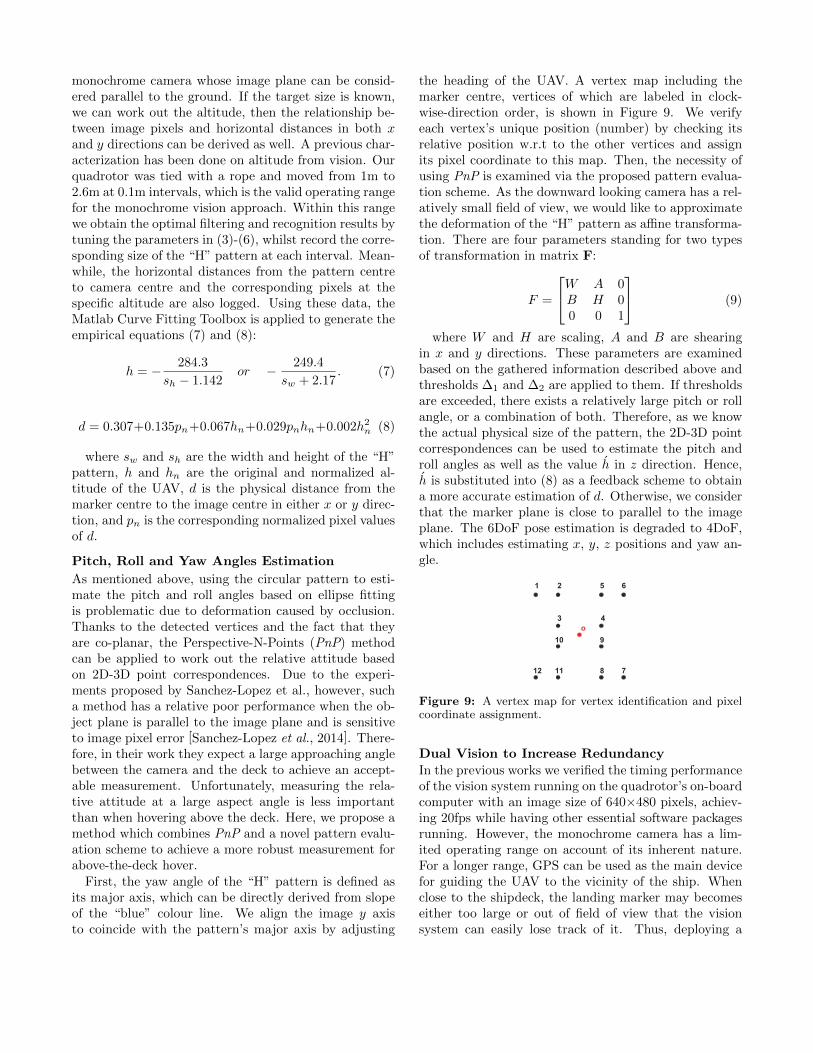
is satisfactory whilst minimizing computation. Figure7(b) shows the corrected vertices plotted on an undis-torted image for validation purpose, where the obtainednew vertices are precisely located at the desired posi-tions. Thanks to this approach, the pixel error is mini-mized, which benefits our pose estimation process.
(a) (b)
Figure 7: Vertices refinement: (a) Vertices incorrectly lo-cated. (b) Corrected vertices plotted on an undistorted im-age.
3.6 Information Gathering with PatternReconstruction
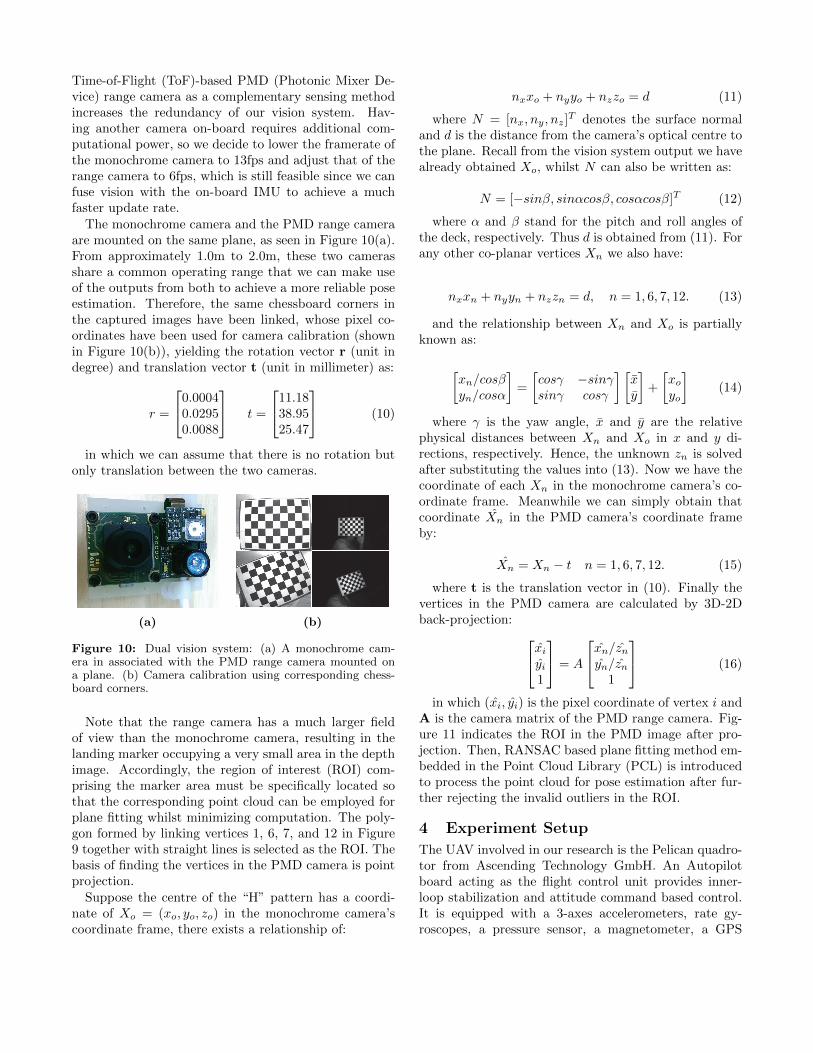
Once we have the calibrated vertices, our vision systemloops through all of them to gather the key informationof the “H” pattern. That is, with the re-calculated lineparameters, we identify each line segment and catego-rize it into its own group by means of checking the linelength proportion between the current one and the nextone, according to Table 1. While implementing this, theconcept, so called pattern reconstruction, is also pro-posed to recover the missing part of the pattern, as themissing lines can be artificially “rebuilt” using the gath-ered information of the existing lines. Figure 8(a) and8(b) illustrate the “H” pattern before and after recon-struction, where all the calculated line segments matchthe actual ones quite well. To our best knowledge, thisapproach is the first work in this endeavor.
(a) (b)
Figure 8: “H” pattern before and after reconstruction.
3.7 Pose Estimation
XYZ Positions EstimationOwing to an on-board pan-tilt unit (PTU) stabiliz-ing the camera in flight, we have a downward-looking
monochrome camera whose image plane can be consid-ered parallel to the ground. If the target size is known,we can work out the altitude, then the relationship be-tween image pixels and horizontal distances in both xand y directions can be derived as well. A previous char-acterization has been done on altitude from vision. Ourquadrotor was tied with a rope and moved from 1m to2.6m at 0.1m intervals, which is the valid operating rangefor the monochrome vision approach. Within this rangewe obtain the optimal filtering and recognition results bytuning the parameters in (3)-(6), whilst record the corre-sponding size of the “H” pattern at each interval. Mean-while, the horizontal distances from the pattern centreto camera centre and the corresponding pixels at thespecific altitude are also logged. Using these data, theMatlab Curve Fitting Toolbox is applied to generate theempirical equations (7) and (8):
h = − 284.3
sh − 1.142or − 249.4
sw + 2.17. (7)
d = 0.307+0.135pn+0.067hn+0.029pnhn+0.002h2n (8)
where sw and sh are the width and height of the “H”pattern, h and hn are the original and normalized al-titude of the UAV, d is the physical distance from themarker centre to the image centre in either x or y direc-tion, and pn is the corresponding normalized pixel valuesof d.
Pitch, Roll and Yaw Angles Estimation
As mentioned above, using the circular pattern to esti-mate the pitch and roll angles based on ellipse fittingis problematic due to deformation caused by occlusion.Thanks to the detected vertices and the fact that theyare co-planar, the Perspective-N-Points (PnP) methodcan be applied to work out the relative attitude basedon 2D-3D point correspondences. Due to the experi-ments proposed by Sanchez-Lopez et al., however, sucha method has a relative poor performance when the ob-ject plane is parallel to the image plane and is sensitiveto image pixel error [Sanchez-Lopez et al., 2014]. There-fore, in their work they expect a large approaching anglebetween the camera and the deck to achieve an accept-able measurement. Unfortunately, measuring the rela-tive attitude at a large aspect angle is less importantthan when hovering above the deck. Here, we propose amethod which combines PnP and a novel pattern evalu-ation scheme to achieve a more robust measurement forabove-the-deck hover.
First, the yaw angle of the “H” pattern is defined asits major axis, which can be directly derived from slopeof the “blue” colour line. We align the image y axisto coincide with the pattern’s major axis by adjusting
the heading of the UAV. A vertex map including themarker centre, vertices of which are labeled in clock-wise-direction order, is shown in Figure 9. We verifyeach vertex’s unique position (number) by checking itsrelative position w.r.t to the other vertices and assignits pixel coordinate to this map. Then, the necessity ofusing PnP is examined via the proposed pattern evalua-tion scheme. As the downward looking camera has a rel-atively small field of view, we would like to approximatethe deformation of the “H” pattern as affine transforma-tion. There are four parameters standing for two typesof transformation in matrix F:
F =
W A 0B H 00 0 1
(9)
where W and H are scaling, A and B are shearingin x and y directions. These parameters are examinedbased on the gathered information described above andthresholds ∆1 and ∆2 are applied to them. If thresholdsare exceeded, there exists a relatively large pitch or rollangle, or a combination of both. Therefore, as we knowthe actual physical size of the pattern, the 2D-3D pointcorrespondences can be used to estimate the pitch androll angles as well as the value h in z direction. Hence,h is substituted into (8) as a feedback scheme to obtaina more accurate estimation of d. Otherwise, we considerthat the marker plane is close to parallel to the imageplane. The 6DoF pose estimation is degraded to 4DoF,which includes estimating x, y, z positions and yaw an-gle.
Figure 9: A vertex map for vertex identification and pixelcoordinate assignment.
Dual Vision to Increase Redundancy
In the previous works we verified the timing performanceof the vision system running on the quadrotor’s on-boardcomputer with an image size of 640×480 pixels, achiev-ing 20fps while having other essential software packagesrunning. However, the monochrome camera has a lim-ited operating range on account of its inherent nature.For a longer range, GPS can be used as the main devicefor guiding the UAV to the vicinity of the ship. Whenclose to the shipdeck, the landing marker may becomeseither too large or out of field of view that the visionsystem can easily lose track of it. Thus, deploying a
Time-of-Flight (ToF)-based PMD (Photonic Mixer De-vice) range camera as a complementary sensing methodincreases the redundancy of our vision system. Hav-ing another camera on-board requires additional com-putational power, so we decide to lower the framerate ofthe monochrome camera to 13fps and adjust that of therange camera to 6fps, which is still feasible since we canfuse vision with the on-board IMU to achieve a muchfaster update rate.
The monochrome camera and the PMD range cameraare mounted on the same plane, as seen in Figure 10(a).From approximately 1.0m to 2.0m, these two camerasshare a common operating range that we can make useof the outputs from both to achieve a more reliable poseestimation. Therefore, the same chessboard corners inthe captured images have been linked, whose pixel co-ordinates have been used for camera calibration (shownin Figure 10(b)), yielding the rotation vector r (unit indegree) and translation vector t (unit in millimeter) as:
r =
0.00040.02950.0088
t =
11.1838.9525.47
(10)
in which we can assume that there is no rotation butonly translation between the two cameras.
(a) (b)
Figure 10: Dual vision system: (a) A monochrome cam-era in associated with the PMD range camera mounted ona plane. (b) Camera calibration using corresponding chess-board corners.
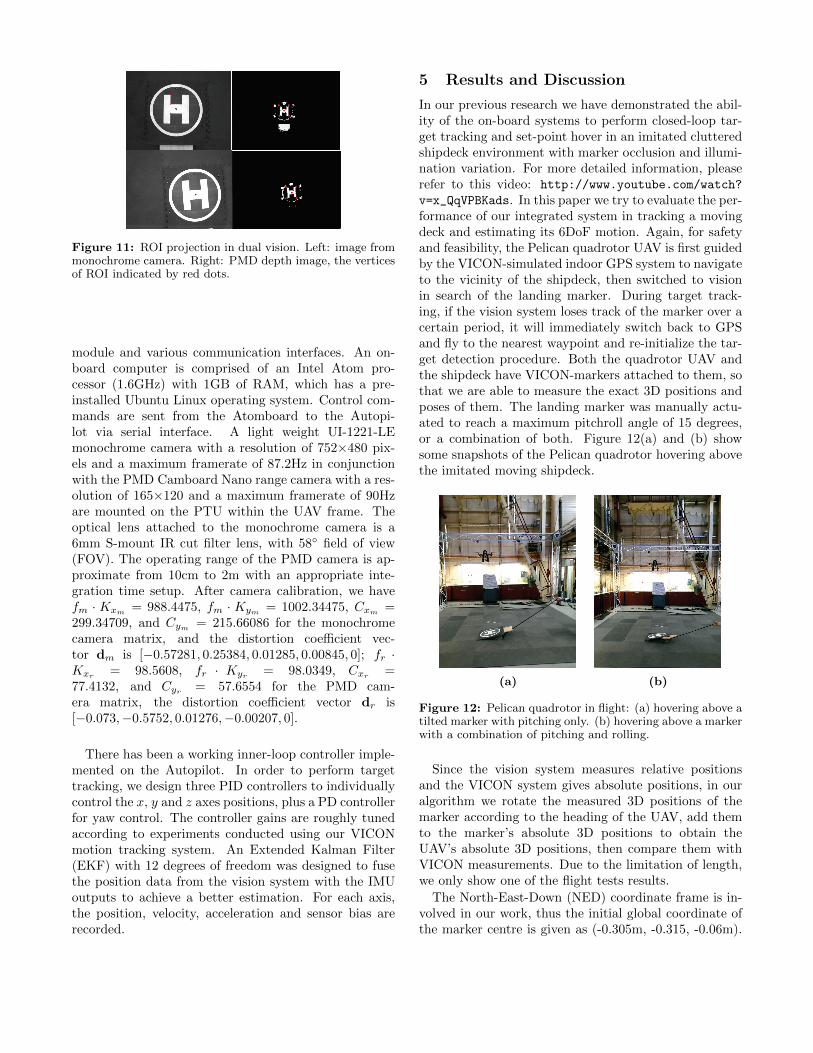
Note that the range camera has a much larger fieldof view than the monochrome camera, resulting in thelanding marker occupying a very small area in the depthimage. Accordingly, the region of interest (ROI) com-prising the marker area must be specifically located sothat the corresponding point cloud can be employed forplane fitting whilst minimizing computation. The poly-gon formed by linking vertices 1, 6, 7, and 12 in Figure9 together with straight lines is selected as the ROI. Thebasis of finding the vertices in the PMD camera is pointprojection.
Suppose the centre of the “H” pattern has a coordi-nate of Xo = (xo, yo, zo) in the monochrome camera’scoordinate frame, there exists a relationship of:
nxxo + nyyo + nzzo = d (11)
where N = [nx, ny, nz]T denotes the surface normaland d is the distance from the camera’s optical centre tothe plane. Recall from the vision system output we havealready obtained Xo, whilst N can also be written as:
N = [−sinβ, sinαcosβ, cosαcosβ]T (12)
where α and β stand for the pitch and roll angles ofthe deck, respectively. Thus d is obtained from (11). Forany other co-planar vertices Xn we also have:
nxxn + nyyn + nzzn = d, n = 1, 6, 7, 12. (13)
and the relationship between Xn and Xo is partiallyknown as:
[xn/cosβyn/cosα
]=
[cosγ −sinγsinγ cosγ
] [xy
]+
[xoyo
](14)
where γ is the yaw angle, x and y are the relativephysical distances between Xn and Xo in x and y di-rections, respectively. Hence, the unknown zn is solvedafter substituting the values into (13). Now we have thecoordinate of each Xn in the monochrome camera’s co-ordinate frame. Meanwhile we can simply obtain thatcoordinate Xn in the PMD camera’s coordinate frameby:
Xn = Xn − t n = 1, 6, 7, 12. (15)
where t is the translation vector in (10). Finally thevertices in the PMD camera are calculated by 3D-2Dback-projection: xiyi
1
= A
xn/znyn/zn1
(16)
in which (xi, yi) is the pixel coordinate of vertex i andA is the camera matrix of the PMD range camera. Fig-ure 11 indicates the ROI in the PMD image after pro-jection. Then, RANSAC based plane fitting method em-bedded in the Point Cloud Library (PCL) is introducedto process the point cloud for pose estimation after fur-ther rejecting the invalid outliers in the ROI.
4 Experiment Setup
The UAV involved in our research is the Pelican quadro-tor from Ascending Technology GmbH. An Autopilotboard acting as the flight control unit provides inner-loop stabilization and attitude command based control.It is equipped with a 3-axes accelerometers, rate gy-roscopes, a pressure sensor, a magnetometer, a GPS
Figure 11: ROI projection in dual vision. Left: image frommonochrome camera. Right: PMD depth image, the verticesof ROI indicated by red dots.
module and various communication interfaces. An on-board computer is comprised of an Intel Atom pro-cessor (1.6GHz) with 1GB of RAM, which has a pre-installed Ubuntu Linux operating system. Control com-mands are sent from the Atomboard to the Autopi-lot via serial interface. A light weight UI-1221-LEmonochrome camera with a resolution of 752×480 pix-els and a maximum framerate of 87.2Hz in conjunctionwith the PMD Camboard Nano range camera with a res-olution of 165×120 and a maximum framerate of 90Hzare mounted on the PTU within the UAV frame. Theoptical lens attached to the monochrome camera is a6mm S-mount IR cut filter lens, with 58◦ field of view(FOV). The operating range of the PMD camera is ap-proximate from 10cm to 2m with an appropriate inte-gration time setup. After camera calibration, we havefm · Kxm = 988.4475, fm · Kym = 1002.34475, Cxm =299.34709, and Cym = 215.66086 for the monochromecamera matrix, and the distortion coefficient vec-tor dm is [−0.57281, 0.25384, 0.01285, 0.00845, 0]; fr ·Kxr
= 98.5608, fr · Kyr= 98.0349, Cxr
=77.4132, and Cyr = 57.6554 for the PMD cam-era matrix, the distortion coefficient vector dr is[−0.073,−0.5752, 0.01276,−0.00207, 0].
There has been a working inner-loop controller imple-mented on the Autopilot. In order to perform targettracking, we design three PID controllers to individuallycontrol the x, y and z axes positions, plus a PD controllerfor yaw control. The controller gains are roughly tunedaccording to experiments conducted using our VICONmotion tracking system. An Extended Kalman Filter(EKF) with 12 degrees of freedom was designed to fusethe position data from the vision system with the IMUoutputs to achieve a better estimation. For each axis,the position, velocity, acceleration and sensor bias arerecorded.
5 Results and Discussion
In our previous research we have demonstrated the abil-ity of the on-board systems to perform closed-loop tar-get tracking and set-point hover in an imitated clutteredshipdeck environment with marker occlusion and illumi-nation variation. For more detailed information, pleaserefer to this video: http://www.youtube.com/watch?
v=x_QqVPBKads. In this paper we try to evaluate the per-formance of our integrated system in tracking a movingdeck and estimating its 6DoF motion. Again, for safetyand feasibility, the Pelican quadrotor UAV is first guidedby the VICON-simulated indoor GPS system to navigateto the vicinity of the shipdeck, then switched to visionin search of the landing marker. During target track-ing, if the vision system loses track of the marker over acertain period, it will immediately switch back to GPSand fly to the nearest waypoint and re-initialize the tar-get detection procedure. Both the quadrotor UAV andthe shipdeck have VICON-markers attached to them, sothat we are able to measure the exact 3D positions andposes of them. The landing marker was manually actu-ated to reach a maximum pitchroll angle of 15 degrees,or a combination of both. Figure 12(a) and (b) showsome snapshots of the Pelican quadrotor hovering abovethe imitated moving shipdeck.
(a) (b)
Figure 12: Pelican quadrotor in flight: (a) hovering above atilted marker with pitching only. (b) hovering above a markerwith a combination of pitching and rolling.
Since the vision system measures relative positionsand the VICON system gives absolute positions, in ouralgorithm we rotate the measured 3D positions of themarker according to the heading of the UAV, add themto the marker’s absolute 3D positions to obtain theUAV’s absolute 3D positions, then compare them withVICON measurements. Due to the limitation of length,we only show one of the flight tests results.
The North-East-Down (NED) coordinate frame is in-volved in our work, thus the initial global coordinate ofthe marker centre is given as (-0.305m, -0.315, -0.06m).
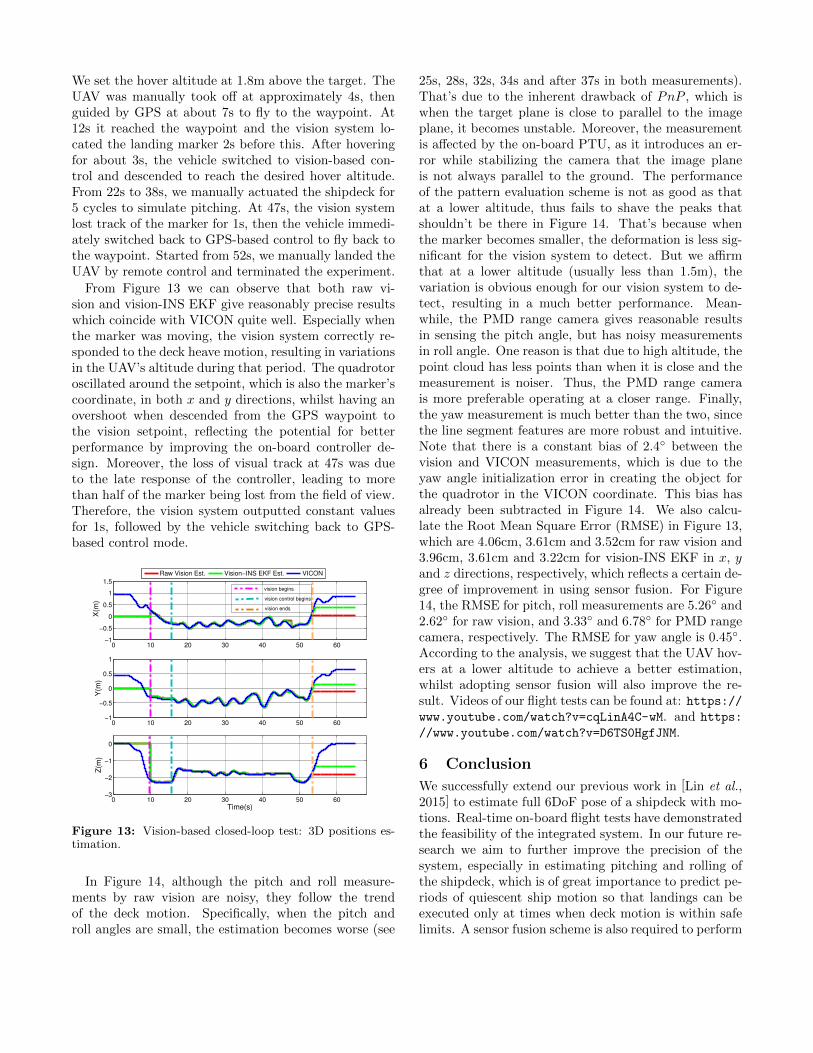
We set the hover altitude at 1.8m above the target. TheUAV was manually took off at approximately 4s, thenguided by GPS at about 7s to fly to the waypoint. At12s it reached the waypoint and the vision system lo-cated the landing marker 2s before this. After hoveringfor about 3s, the vehicle switched to vision-based con-trol and descended to reach the desired hover altitude.From 22s to 38s, we manually actuated the shipdeck for5 cycles to simulate pitching. At 47s, the vision systemlost track of the marker for 1s, then the vehicle immedi-ately switched back to GPS-based control to fly back tothe waypoint. Started from 52s, we manually landed theUAV by remote control and terminated the experiment.
From Figure 13 we can observe that both raw vi-sion and vision-INS EKF give reasonably precise resultswhich coincide with VICON quite well. Especially whenthe marker was moving, the vision system correctly re-sponded to the deck heave motion, resulting in variationsin the UAV’s altitude during that period. The quadrotoroscillated around the setpoint, which is also the marker’scoordinate, in both x and y directions, whilst having anovershoot when descended from the GPS waypoint tothe vision setpoint, reflecting the potential for betterperformance by improving the on-board controller de-sign. Moreover, the loss of visual track at 47s was dueto the late response of the controller, leading to morethan half of the marker being lost from the field of view.Therefore, the vision system outputted constant valuesfor 1s, followed by the vehicle switching back to GPS-based control mode.
0 10 20 30 40 50 60−1
−0.5
0
0.5
1
1.5
X(m
)
0 10 20 30 40 50 60−1
−0.5
0
0.5
1
Y(m
)
0 10 20 30 40 50 60−3
−2
−1
0
Time(s)
Z(m
)
Raw Vision Est. Vision−INS EKF Est. VICON
vision ends
vision control begins
vision begins
Figure 13: Vision-based closed-loop test: 3D positions es-timation.
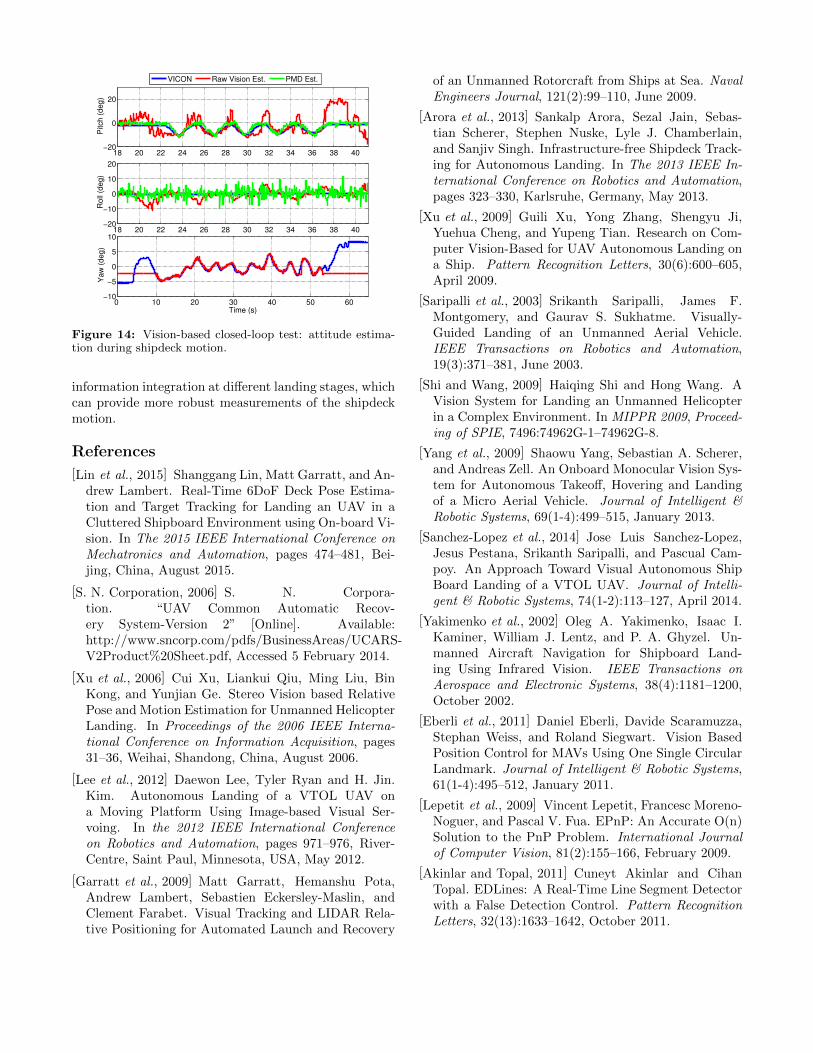
In Figure 14, although the pitch and roll measure-ments by raw vision are noisy, they follow the trendof the deck motion. Specifically, when the pitch androll angles are small, the estimation becomes worse (see
25s, 28s, 32s, 34s and after 37s in both measurements).That’s due to the inherent drawback of PnP , which iswhen the target plane is close to parallel to the imageplane, it becomes unstable. Moreover, the measurementis affected by the on-board PTU, as it introduces an er-ror while stabilizing the camera that the image planeis not always parallel to the ground. The performanceof the pattern evaluation scheme is not as good as thatat a lower altitude, thus fails to shave the peaks thatshouldn’t be there in Figure 14. That’s because whenthe marker becomes smaller, the deformation is less sig-nificant for the vision system to detect. But we affirmthat at a lower altitude (usually less than 1.5m), thevariation is obvious enough for our vision system to de-tect, resulting in a much better performance. Mean-while, the PMD range camera gives reasonable resultsin sensing the pitch angle, but has noisy measurementsin roll angle. One reason is that due to high altitude, thepoint cloud has less points than when it is close and themeasurement is noiser. Thus, the PMD range camerais more preferable operating at a closer range. Finally,the yaw measurement is much better than the two, sincethe line segment features are more robust and intuitive.Note that there is a constant bias of 2.4◦ between thevision and VICON measurements, which is due to theyaw angle initialization error in creating the object forthe quadrotor in the VICON coordinate. This bias hasalready been subtracted in Figure 14. We also calcu-late the Root Mean Square Error (RMSE) in Figure 13,which are 4.06cm, 3.61cm and 3.52cm for raw vision and3.96cm, 3.61cm and 3.22cm for vision-INS EKF in x, yand z directions, respectively, which reflects a certain de-gree of improvement in using sensor fusion. For Figure14, the RMSE for pitch, roll measurements are 5.26◦ and2.62◦ for raw vision, and 3.33◦ and 6.78◦ for PMD rangecamera, respectively. The RMSE for yaw angle is 0.45◦.According to the analysis, we suggest that the UAV hov-ers at a lower altitude to achieve a better estimation,whilst adopting sensor fusion will also improve the re-sult. Videos of our flight tests can be found at: https://www.youtube.com/watch?v=cqLinA4C-wM. and https:
//www.youtube.com/watch?v=D6TS0HgfJNM.
6 Conclusion
We successfully extend our previous work in [Lin et al.,2015] to estimate full 6DoF pose of a shipdeck with mo-tions. Real-time on-board flight tests have demonstratedthe feasibility of the integrated system. In our future re-search we aim to further improve the precision of thesystem, especially in estimating pitching and rolling ofthe shipdeck, which is of great importance to predict pe-riods of quiescent ship motion so that landings can beexecuted only at times when deck motion is within safelimits. A sensor fusion scheme is also required to perform
Figure 14: Vision-based closed-loop test: attitude estima-tion during shipdeck motion.
information integration at different landing stages, whichcan provide more robust measurements of the shipdeckmotion.
References
[Lin et al., 2015] Shanggang Lin, Matt Garratt, and An-drew Lambert. Real-Time 6DoF Deck Pose Estima-tion and Target Tracking for Landing an UAV in aCluttered Shipboard Environment using On-board Vi-sion. In The 2015 IEEE International Conference onMechatronics and Automation, pages 474–481, Bei-jing, China, August 2015.
[S. N. Corporation, 2006] S. N. Corpora-tion. “UAV Common Automatic Recov-ery System-Version 2” [Online]. Available:http://www.sncorp.com/pdfs/BusinessAreas/UCARS-V2Product%20Sheet.pdf, Accessed 5 February 2014.
[Xu et al., 2006] Cui Xu, Liankui Qiu, Ming Liu, BinKong, and Yunjian Ge. Stereo Vision based RelativePose and Motion Estimation for Unmanned HelicopterLanding. In Proceedings of the 2006 IEEE Interna-tional Conference on Information Acquisition, pages31–36, Weihai, Shandong, China, August 2006.
[Lee et al., 2012] Daewon Lee, Tyler Ryan and H. Jin.Kim. Autonomous Landing of a VTOL UAV ona Moving Platform Using Image-based Visual Ser-voing. In the 2012 IEEE International Conferenceon Robotics and Automation, pages 971–976, River-Centre, Saint Paul, Minnesota, USA, May 2012.
[Garratt et al., 2009] Matt Garratt, Hemanshu Pota,Andrew Lambert, Sebastien Eckersley-Maslin, andClement Farabet. Visual Tracking and LIDAR Rela-tive Positioning for Automated Launch and Recovery
of an Unmanned Rotorcraft from Ships at Sea. NavalEngineers Journal, 121(2):99–110, June 2009.
[Arora et al., 2013] Sankalp Arora, Sezal Jain, Sebas-tian Scherer, Stephen Nuske, Lyle J. Chamberlain,and Sanjiv Singh. Infrastructure-free Shipdeck Track-ing for Autonomous Landing. In The 2013 IEEE In-ternational Conference on Robotics and Automation,pages 323–330, Karlsruhe, Germany, May 2013.
[Xu et al., 2009] Guili Xu, Yong Zhang, Shengyu Ji,Yuehua Cheng, and Yupeng Tian. Research on Com-puter Vision-Based for UAV Autonomous Landing ona Ship. Pattern Recognition Letters, 30(6):600–605,April 2009.
[Saripalli et al., 2003] Srikanth Saripalli, James F.Montgomery, and Gaurav S. Sukhatme. Visually-Guided Landing of an Unmanned Aerial Vehicle.IEEE Transactions on Robotics and Automation,19(3):371–381, June 2003.
[Shi and Wang, 2009] Haiqing Shi and Hong Wang. AVision System for Landing an Unmanned Helicopterin a Complex Environment. In MIPPR 2009, Proceed-ing of SPIE, 7496:74962G-1–74962G-8.
[Yang et al., 2009] Shaowu Yang, Sebastian A. Scherer,and Andreas Zell. An Onboard Monocular Vision Sys-tem for Autonomous Takeoff, Hovering and Landingof a Micro Aerial Vehicle. Journal of Intelligent &Robotic Systems, 69(1-4):499–515, January 2013.
[Sanchez-Lopez et al., 2014] Jose Luis Sanchez-Lopez,Jesus Pestana, Srikanth Saripalli, and Pascual Cam-poy. An Approach Toward Visual Autonomous ShipBoard Landing of a VTOL UAV. Journal of Intelli-gent & Robotic Systems, 74(1-2):113–127, April 2014.
[Yakimenko et al., 2002] Oleg A. Yakimenko, Isaac I.Kaminer, William J. Lentz, and P. A. Ghyzel. Un-manned Aircraft Navigation for Shipboard Land-ing Using Infrared Vision. IEEE Transactions onAerospace and Electronic Systems, 38(4):1181–1200,October 2002.
[Eberli et al., 2011] Daniel Eberli, Davide Scaramuzza,Stephan Weiss, and Roland Siegwart. Vision BasedPosition Control for MAVs Using One Single CircularLandmark. Journal of Intelligent & Robotic Systems,61(1-4):495–512, January 2011.
[Lepetit et al., 2009] Vincent Lepetit, Francesc Moreno-Noguer, and Pascal V. Fua. EPnP: An Accurate O(n)Solution to the PnP Problem. International Journalof Computer Vision, 81(2):155–166, February 2009.
[Akinlar and Topal, 2011] Cuneyt Akinlar and CihanTopal. EDLines: A Real-Time Line Segment Detectorwith a False Detection Control. Pattern RecognitionLetters, 32(13):1633–1642, October 2011.