38
Management Accounting: Marginal Costing & Cost Volume Profit Analysis
| Date post: | 07-Apr-2018 |
| Category: |
Documents |
| Upload: | jyoti-meghani |
| View: | 220 times |
| Download: | 0 times |

8/6/2019 6.Mgmt Accounting
http://slidepdf.com/reader/full/6mgmt-accounting 1/38
Management Accounting:
Marginal Costing & Cost Volume
Profit Analysis

8/6/2019 6.Mgmt Accounting
http://slidepdf.com/reader/full/6mgmt-accounting 2/38
Meaning of Management
Accounting According to Anglo-American Council of
Productivity -:
³ It is the presentation of accountinginformation in such a way as to assistmanagement in the creation of policy and
the day to day operation of theundertaking.´

8/6/2019 6.Mgmt Accounting
http://slidepdf.com/reader/full/6mgmt-accounting 3/38
Management Accounting and
Financial AccountingFinancial Accounting
� Objective
To maintain account to
determine financial
position of business
� NatureIt deals with historical
data.
Management Accounting
� Objective
To help management to
formulate policies and
plan
� NatureIt deals with projection of
data for the future.
8/6/2019 6.Mgmt Accounting
http://slidepdf.com/reader/full/6mgmt-accounting 4/38
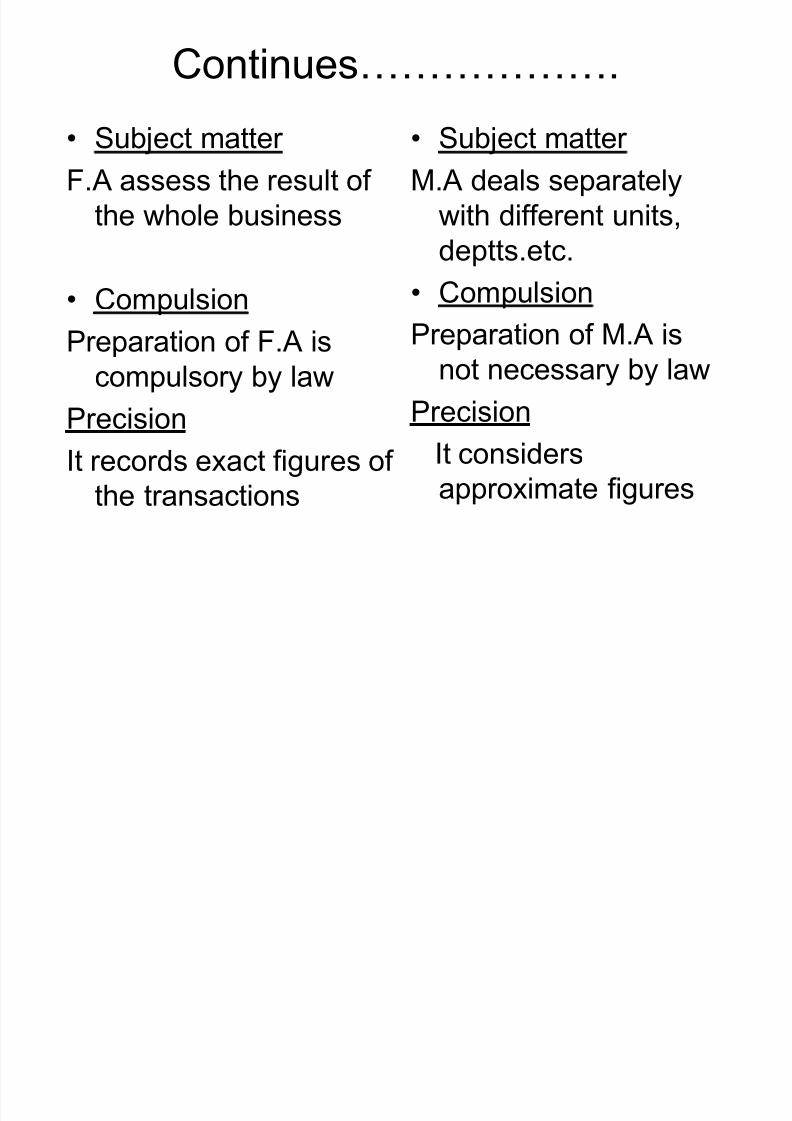
Continues««««««.
� Subject matter F.A assess the result of
the whole business
� Compulsion
Preparation of F.A is
compulsory by law
Precision
It records exact figures of
the transactions
� Subject matter M.A deals separately
with different units,
deptts.etc.
� Compulsion
Preparation of M.A is
not necessary by law
PrecisionIt considers
approximate figures

8/6/2019 6.Mgmt Accounting
http://slidepdf.com/reader/full/6mgmt-accounting 5/38
Cost Accounting and Management
Accounting� Cost Accounting
1. It records the
quantitative aspect of
a transaction2. Records the cost of
producing a product
and providing service
3. It only deals with cost
ascertainment
� Management Accounting
1. it records both qualitative
and quantitative aspect of
a transaction2. Provides information to
management for planning
and co-ordination
3. It is wider in scope as it
includes F.A, budgeting,
Tax, Planning.

8/6/2019 6.Mgmt Accounting
http://slidepdf.com/reader/full/6mgmt-accounting 6/38
Continue««««««..
� Cost Accounting4. It uses both past and
present figures
5. It¶s development is
related to industrial
revolution
6. It follows certainprinciples and
procedures for
recording costs of
different products
� Management Accounting4. It is concerned with the
projection of figures for
future.
5. It develops inaccordance to the
modern business world
6. It does not follow any
specific rules and
regulations.

8/6/2019 6.Mgmt Accounting
http://slidepdf.com/reader/full/6mgmt-accounting 7/38
MARGINAL COSTING

8/6/2019 6.Mgmt Accounting
http://slidepdf.com/reader/full/6mgmt-accounting 8/38
Marginal Cost
� According CIMA, London, Marginal Cost represents ³theamount of any volume of given output by which aggregatecost are changed if the volume of output is increased byone units.
� In practice, it is measured by the total variable costsattributable to one unit.
� For example, the cost of production of 1,000 units of
radios is Rs. 200000 and that of 1001 units is Rs. 200150the marginal cost is Rs. 150, i.e., 200150 ± 200000.

8/6/2019 6.Mgmt Accounting
http://slidepdf.com/reader/full/6mgmt-accounting 9/38
Marginal Costing
� The Institute of Cost and Management,
London, has defined Marginal costing as
³the ascertainment of marginal costs and
of the effects on profit of changes in
volume or type of output by differentiating
between fixed costs and variable costs´.

8/6/2019 6.Mgmt Accounting
http://slidepdf.com/reader/full/6mgmt-accounting 10/38
Marginal Costing
� ³In this technique of costing only variable
costs are charged to operational process
or products, leaving all indirect cost to be
written off against profit in the period in
which they arise´.

8/6/2019 6.Mgmt Accounting
http://slidepdf.com/reader/full/6mgmt-accounting 11/38
Marginal Costing
� Is not a system of costing such as
process costing, job costing, operating
costing, etc.� A technique which is concerned with the
changes in costs and profits resulting
from changes in the volume of output.� It is also known as variable costing.
8/6/2019 6.Mgmt Accounting
http://slidepdf.com/reader/full/6mgmt-accounting 12/38
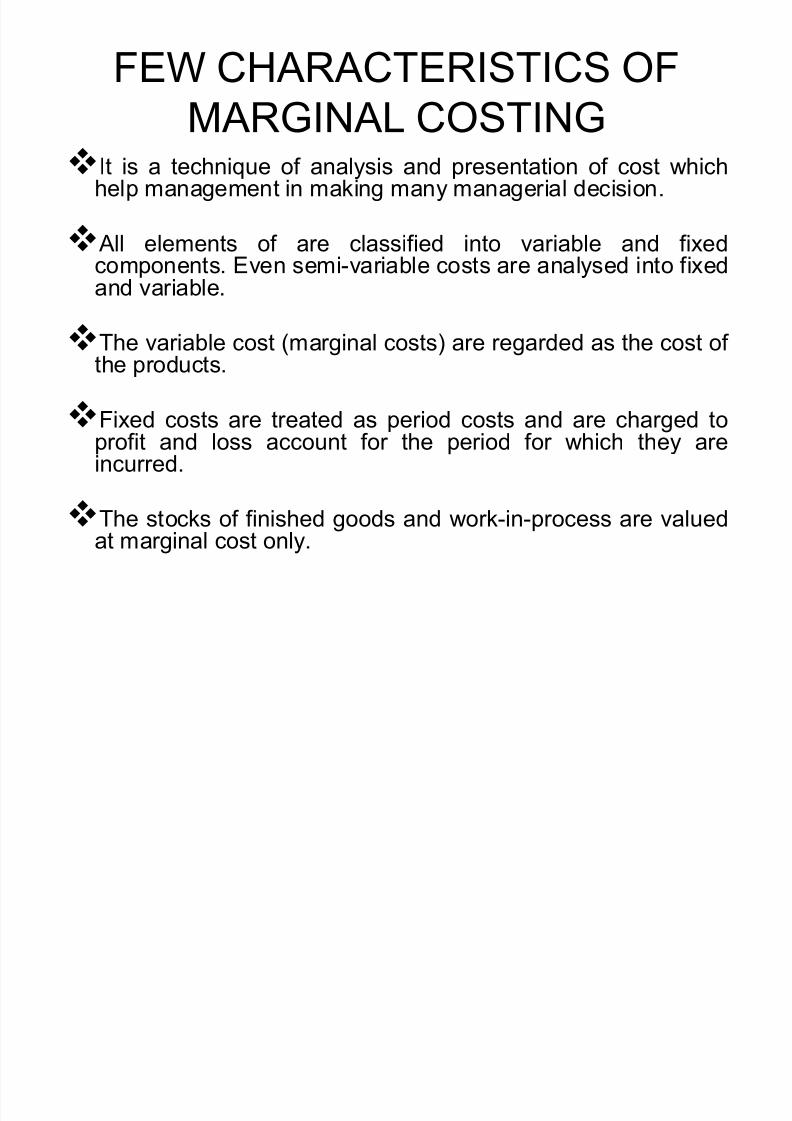
FEW CHARACTERISTICS OF
MARGINAL COSTINGIt is a technique of analysis and presentation of cost whichhelp management in making many managerial decision.
All elements of are classified into variable and fixed
components. Even semi-variable costs are analysed into fixedand variable.
The variable cost (marginal costs) are regarded as the cost of the products.
Fixed costs are treated as period costs and are charged toprofit and loss account for the period for which they areincurred.
The stocks of finished goods and work-in-process are valuedat marginal cost only.

8/6/2019 6.Mgmt Accounting
http://slidepdf.com/reader/full/6mgmt-accounting 13/38

8/6/2019 6.Mgmt Accounting
http://slidepdf.com/reader/full/6mgmt-accounting 14/38
MARGINAL COST EQUATION
FOR THE SAKE OF CONVINIENCE, A MARGAL COST EQUATION CAN BEDERIVED AS FOLLOWS:-
Sales ± Variable cost = contribution.
Or, Sales = Variable cost + contribution.
Or, Sales = Variable cost + Fixed cost ± Profit / Loss.Or, Sales - Variable cost = Fixed cost ± Profit / Loss.
Or, S ± V = F ± P
Where µS¶ stands for Sales.
µV¶ stands for Variable cost.µF¶ stands for Fixed cost.
µP¶ stands for Profit / Loss.

8/6/2019 6.Mgmt Accounting
http://slidepdf.com/reader/full/6mgmt-accounting 15/38
Profit / Volume Ratio (P/V Ratio or C /S Ratio)
P/V Ratio =Sales
Contribution
C S-V
= ---- = ------S S
Profit volume ratio is the ratio of contribution denoting the difference
between sales and variable cost. Since in the short term fixed cost does
not change, Profit/volume ratio also measures the rate of change of
profit due to change in the volume of sales.
If the sales price increases without corresponding increase in marginal
cost the contribution increases and the Profit volume ratio improves.
Similarly if the marginal cost is reduced with sale price remaining same
Profit/Volume ratio improves.

8/6/2019 6.Mgmt Accounting
http://slidepdf.com/reader/full/6mgmt-accounting 16/38
Is a technique for studying the relationship between cost, volumeand profit.
Profits of an undertaking depends upon a large number of factors.
But the most important of these factors are the cost of manufacture,volume of sales and the selling price of the products.
In words of Herman C. Heiser,³the most significant single factor inprofit planning of the average business is the relationship betweenvolume of business, cost and profits .́
The CVP relationship is an important tool used for profit planning of a business.
Cost-Volume-Profit Analysis
8/6/2019 6.Mgmt Accounting
http://slidepdf.com/reader/full/6mgmt-accounting 17/38
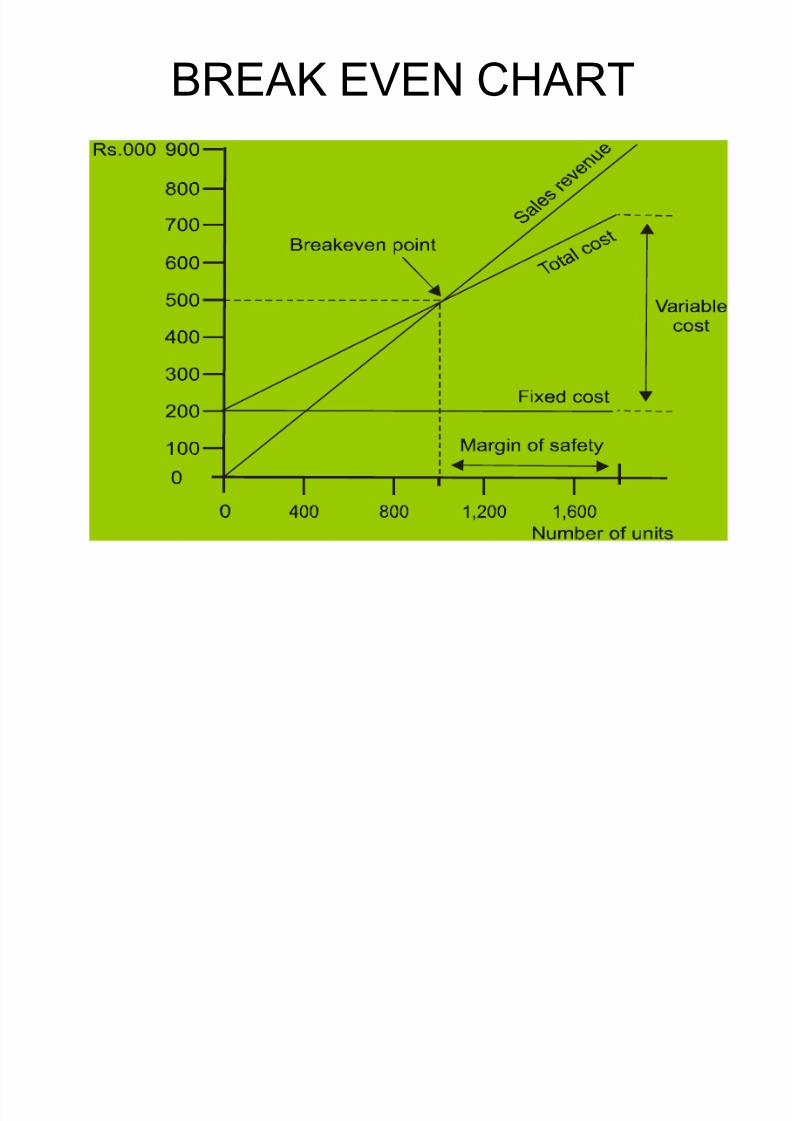
BREAK EVEN CHART

8/6/2019 6.Mgmt Accounting
http://slidepdf.com/reader/full/6mgmt-accounting 18/38
Break Even Point
� Break even point represents that volume of productionwhere total cost equal total revenue resulting into a no-profitno-loss situation. If output falls below that point, there is lossand if output exceeds the point there is profit. Therefore at
break even pointRevenue = Total Cost
Sales(S) = Cost (C) = Fixed Cost + Variable Cost
Sales - variable Cost = Contribution = Fixed Cost
� At break even point the contribution earned just covers thefixed cost and at levels below the point contribution earned isnot adequate to match the fixed cost and at levels above thepoint contribution earned more than recovers the fixed cost.
BEP = Fixed Cost/ PV Ratio

8/6/2019 6.Mgmt Accounting
http://slidepdf.com/reader/full/6mgmt-accounting 19/38
Margin of Safety
� Margin of safety is the difference between the sales or production ata particular level of activity and the break even sales a production.
M/S Ratio = ASR-BESR
ASR
M/S Ratio = margin of safety ratio, ASR = Actual Sales Revenue, BESR =
Break Even Sales Revenue
� A large margin of safety indicates the soundness of the businessand correspondingly a small margin of business indicates a not too-sound position. Margin of safety can be improved by lowering thefixed cost and variable costs, increasing the volumes of sales andproduction, increasing the selling prices or changing the product mixresulting into a better overall Profit/Volume ratio.
Profit
Margin of safety = -----------------------
Profit/Volume ratio

8/6/2019 6.Mgmt Accounting
http://slidepdf.com/reader/full/6mgmt-accounting 20/38
You are given the following data for the year 2007 of B Co. Ltd:
Variable cost 60000 60%
Fixed cost 30000 30%Net profit 10000 10%
Sales 100000 100%
Find out
(a)Break-even point
(b)P/V ratio(c)Margin of safety
(a)
(b)
(c) Margin of safety = Actual Sales ± BE point = 1,00,000 ± 75,000= Rs. 25,000
40% 1,00,000
60,0001,00,000
S
VS ratioP/V !
!
!
75,000Rs.40%
30,000
ratio P/V
F point BE !!!

8/6/2019 6.Mgmt Accounting
http://slidepdf.com/reader/full/6mgmt-accounting 21/38
(a) You are given the following data for the coming year for a factory.
Budgeted output 800000 units
Fixed expenses Rs. 4000000
Variable expenses/ unit Rs. 10Selling price/ unit Rs. 20
Find the break-even point.
(b) If price is reduced to Rs. 18, what will be the new break-evenpoint?
(a) Contribution = S ± V = Rs. 20 ± Rs. 10 = Rs. 10 per unit.
(b) When selling price is reduced
New selling price = Rs. 18New Contribution = Rs. 18 ± Rs. 10 = Rs. 8 per unit.
New
units 40000010Rs.
4000000
unit per on Contributi
cost Fixed ointB.E. !!!
units. 5000008s.
4000000s. Point. . !!

8/6/2019 6.Mgmt Accounting
http://slidepdf.com/reader/full/6mgmt-accounting 22/38
X Ltd. which is a multi product Company furnishes thefollowing data for the current year
Particulars First Half Year Second Half Year
Sales Rs 450000 Rs 500000
Total Cost Rs 400000 Rs 430000
Assuming that there is no change in prices and variable costand that the fixed expenses are incurred equally in the twohalf-year periods, calculate for the year
(i) Profit volume ratio
(ii) Fixed expenses
(iii) Break even sales
(iv) Margin of Safety Ratio

8/6/2019 6.Mgmt Accounting
http://slidepdf.com/reader/full/6mgmt-accounting 23/38
Sales Revenue ± Total Cost = Net Profit
Rs. 450000 - Rs 400000 = Rs 50000(1st Half)
Rs. 500000 - Rs 430000 = Rs 70000(2nd Half)
On a differential basis,
Sales Revenue-Total Cost=Net Profit
50000 ± 30000 = 20000
Only VC changes with change in S, Total Cost = VC
PV Ratio = (S-V)/S = (50000-30000)/50000 = 40%
VV Ratio = V/S = 30000/50000=60%
SR=FC + VC + NP
950000= FC + 0.60(950000) + 120000FC = 950000 ± 570000 ± 120000 = Rs 260000
BEP = FC/PV Ratio = 260000/0.40 = Rs 650000
M /S Ratio = (950000-650000)/950000 = 31.58%
8/6/2019 6.Mgmt Accounting
http://slidepdf.com/reader/full/6mgmt-accounting 24/38
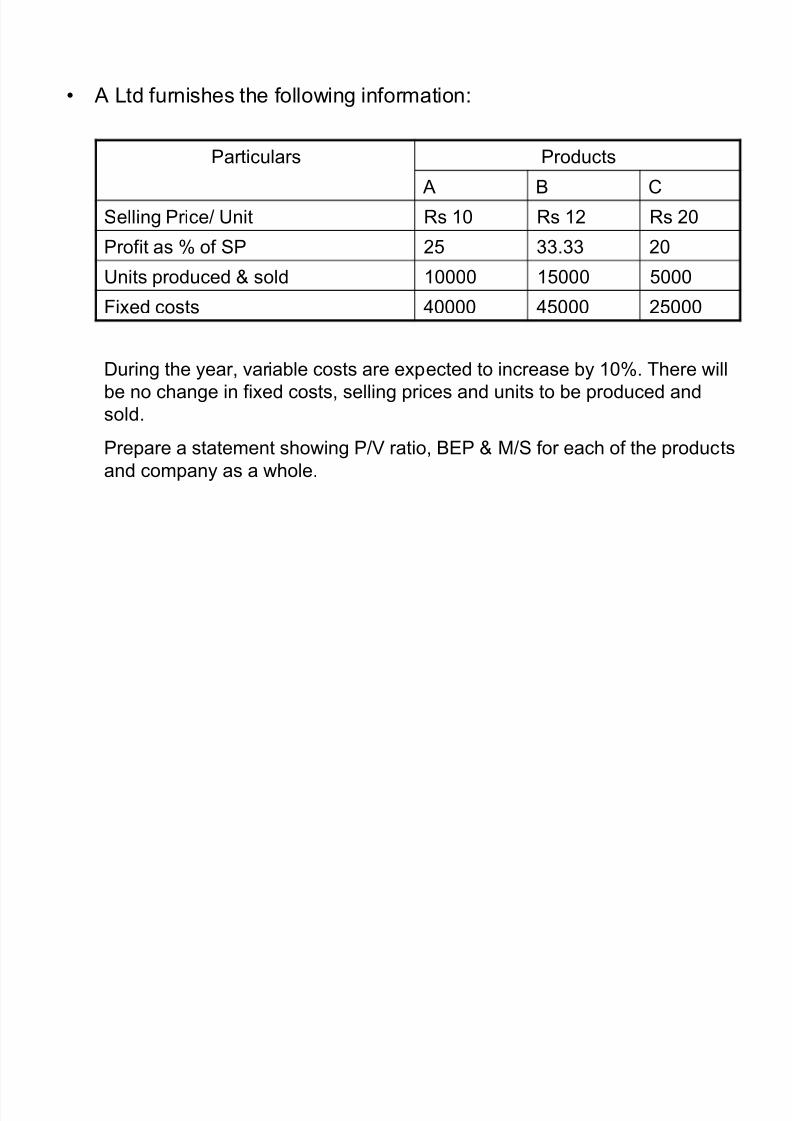
� A Ltd furnishes the following information:
Particulars Products
A B C
Selling Price/ Unit Rs 10 Rs 12 Rs 20
Profit as % of SP 25 33.33 20
Units produced & sold 10000 15000 5000Fixed costs 40000 45000 25000
During the year, variable costs are expected to increase by 10%. There will
be no change in fixed costs, selling prices and units to be produced and
sold.
Prepare a statement showing P/V ratio, BEP & M/S for each of the products
and company as a whole.

8/6/2019 6.Mgmt Accounting
http://slidepdf.com/reader/full/6mgmt-accounting 25/38
Particulars
Year 1 Year 2
A B C COMBINED A B C COMBINED
Units produced & sold 10000 15000 5000 30000 10000 15000 5000 30000
Selling Price/Unit 10 12 20 12.667 10 12 20 12.667
Sales Revenue 100000 180000 100000 380000 100000 180000 100000 380000
Less: Variable Cost 35000 75000 55000 165000 38500 82500 60500 181500
Contribution 65000 105000 45000 215000 61500 97500 39500 198500
Less: Fixed Cost 40000 45000 25000 110000 40000 45000 25000 110000
Operating Profit 25000 60000 20000 105000 21500 52500 14500 88500
P/V Ratio (%) 65 58.33 45 56.58 61.5 54.17 39.5 52.24
BEP 194419 210579
Margin of Safety 185581 169421
Variable Cost = Sale Revenue - Fixed Cost - Net Profit
For Product A 100000-40000-(0.25*100000) = 35000 (Y1) Y2=35000*1.10 = 38500
For Product B 180000-45000-(0.3333*180000) = 75000 (Y1) Y2=75000*1.10 = 82500
For Product C 100000-25000-(0.20*100000) = 55000 (Y1) Y2=55000*1.10 = 60500
8/6/2019 6.Mgmt Accounting
http://slidepdf.com/reader/full/6mgmt-accounting 26/38
MANAGERIAL APPLICATION OF MARGINAL
COSTING
� PRICING DECISION
� PROFIT PLANNING
� MAKE OR BUY DECISIONS
� KEY FACTORS OR LIMITING FACTORS
� SELECTION OF A SUITABLE SALES MIX
� EFFECT OF CHANGES IN SALES PRICE
� DETERMINATION OF OPTIMUM LEVEL OF ACTIVITY
� EVALUATION OF PERFORMANCE
8/6/2019 6.Mgmt Accounting
http://slidepdf.com/reader/full/6mgmt-accounting 27/38
PRICING DECISION
� PRICING UNDER NORMAL CONDITION (Prices are basedon total cost of sales or marginal cost plus high margin on marginal cost)
� SELLING PRICE BELOW THE MARGINAL COST(Different circumstances such as introduction of new product, making aproduct popular, helping a joint product, goods are of perishable nature, theconcern had already purchased huge quantities of raw materials and theprices of these materials is falling considerably in the market, to obviateshut-down costs, to capture future market, to capture foreign market)
� PRICING DURING STIFF COMPETITION AND TRADEDEPRESSION (Some part of fixed cost to be covered, competitors
are to be eliminated from the market )
� ACEPTING SPECIAL ORDERS,BULK ORDERS, ADDITIONAL ORDERS, EXPORT ORDERS AND EXPLORING NEW MARKETS (below normal market price toutilise idle capacity)

8/6/2019 6.Mgmt Accounting
http://slidepdf.com/reader/full/6mgmt-accounting 28/38
PROFIT PLANNING
� DESIRED SALES WITH DESIRED LEVEL OF PROFIT
� DESIRED PROFIT WITH DESIRED LEVEL OF SALES

8/6/2019 6.Mgmt Accounting
http://slidepdf.com/reader/full/6mgmt-accounting 29/38
ILLUSTRATION
From the following particular s, calculate:i. Break-even point in terms of sales value.
ii. Number of units that must be sold to earn a profit of Rs. 90,000.
Fixed Factory Overhead cost = Rs. 60,000.
Fixed Selling Overhead cost = Rs. 12,000.
Variable Manufacturing Cost per Unit = Rs. 12.
Variable Selling Cost per unit = Rs. 3.
Selling Price per unit = Rs. 24.
BEP = Fixed Cost/P/V Ratio
Fixed Cost = Fixed Factory Overhead + Fixed Selling Overhead
= 60000 + 12000 = 72000P/V Ratio = (S ± V)/S = [24 ± (12+3)]/24 = 9/24 = 37.5%
BEP = 72000/0.375 = Rs 192000
Desired Sales volume for profit of Rs 90000 = (F + P)/(S - V) = (F + P)/C=72000+90000/9 = 18000 units
8/6/2019 6.Mgmt Accounting
http://slidepdf.com/reader/full/6mgmt-accounting 30/38
MAKE OR BUY DECISION
� Variable cost of manufacturing (internal) should be
compared with purchase price (outside)
� If variable cost of manufacturing is lower than purchase
price-MAKE
� If purchase price is lower than variable cost of manufacturing -BUY

8/6/2019 6.Mgmt Accounting
http://slidepdf.com/reader/full/6mgmt-accounting 31/38
� A manufacturing company finds that while the cost of making a component No. 0.51 in its own workshop is Rs.8.00 each, the same is available in market at Rs. 6.50
with an assurance of continuous supply. Give your suggestion whether to make or buy this component.
� Give also your views in case the supplier reduces theprice from Rs. 6.50 to Rs. 5.50. The cost of data follows:-
Materials 3. 00
Direct Labor 2. 00
Other Variable Expenses. 1. 00
Depreciation And Other
Fixed Expenses.
2. 00
Total . 8. 00
8/6/2019 6.Mgmt Accounting
http://slidepdf.com/reader/full/6mgmt-accounting 32/38
KEY FACTORS OR LIMITING FACTORS
� Contribution per unit of limiting factor should be
the criteria to assess the profitability of a product
� Product giving highest contribution should be
preferred .

8/6/2019 6.Mgmt Accounting
http://slidepdf.com/reader/full/6mgmt-accounting 33/38
SELECTION OF A SUITABLE SALES MIX
� Product with higher contribution should be
retained and their production to be increased
� Product with lower contribution should be
dropped or their production to be reduced

8/6/2019 6.Mgmt Accounting
http://slidepdf.com/reader/full/6mgmt-accounting 34/38
EFFECT OF CHANGES IN SALES PRICE
� Effect of changes in any of the component
particularly sales price can be easily analysed
under marginal costing

8/6/2019 6.Mgmt Accounting
http://slidepdf.com/reader/full/6mgmt-accounting 35/38
DETERMINATION OF OPTIMUM LEVEL
OF ACTIVITY
� Contribution at the different level of activity can
be found
� Level of activity which gives the highest
contribution will be the optimum level

8/6/2019 6.Mgmt Accounting
http://slidepdf.com/reader/full/6mgmt-accounting 36/38
EVALUATION OF PERFORMANCE
� Contribution of different products,
department or sales divisions can becompared.
� Addition/ Elimination of product lines/divisions/shifts/departments

8/6/2019 6.Mgmt Accounting
http://slidepdf.com/reader/full/6mgmt-accounting 37/38
Fun Garments Ltd. manufactures readymade garments anduses its cut pieces of cloth to manufacture toys. The followingstatement of cost has been prepared:
(Amount in Rs.)
Particular s Readymade Garments Toys Total
Direct Material 80000 6000 86000
Direct Labour 13000 1200 14200
Variable Overheads 17000 2800 19800Fixed Overheads 24000 3000 27000
Total Cost 134000 13000 147000
Sales 170000 12000 182000
Profit (loss) 36000 (1000) 35000
The cut pieces used in toys have a scrap value of Rs 1000 if sold in the market. On account of loss in manufacturing of toys, it is suggested to discontinue their manufacturing. Advisethe management.

8/6/2019 6.Mgmt Accounting
http://slidepdf.com/reader/full/6mgmt-accounting 38/38
Particulars Production
of Toys
Non-
Production
of ToysSales Revenue 12000 -
Scrap Value - 1000
Less: Avoidable costsDirect Material 6000
Direct Labour 1200
Variable Overheads 2800
Differential Revenue 2000 1000
Management is advised that differential revenue
favours continuation of production of Toys.


