6th ECEN Assembly, Flämslätt, Sweden, 28-30 September 2006 Climate Change and Energy Trends and Projections André Jol Head of Group Climate Change and Energy European Environment Agency. Content. EEA background Climate change impacts Adaptation and mitigation strategies - PowerPoint PPT Presentation
1 6th ECEN Assembly, Flämslätt, Sweden, 28-30 September 2006 Climate Change and Energy Climate Change and Energy Trends and Projections Trends and Projections André Jol Head of Group Climate Change and Energy European Environment Agency
Transcript
1
6th ECEN Assembly, Flämslätt, Sweden, 28-30 September 2006
Climate Change and EnergyClimate Change and Energy
Trends and ProjectionsTrends and Projections
André Jol
Head of Group Climate Change and Energy
European Environment Agency
2
ContentContent
• EEA background• Climate change impacts• Adaptation and mitigation strategies• Global emissions and pathways• Global energy system• Energy and greenhouse gases in Europe• Bio-energy potential in Europe• Conclusions
3
The European Environment Agency is the EU The European Environment Agency is the EU body dedicated to providing sound, independent body dedicated to providing sound, independent
information on the environmentinformation on the environment
European Environment Agency
http://www.eea.eu.intCopenhagen, Denmark
4
The EEA is...The EEA is...
• An independent information provider • An analyst and assessor• Building bridges between science and policy• Dependent upon strong networks to carry
out its work
• ...to support policy processes and inform the public
5
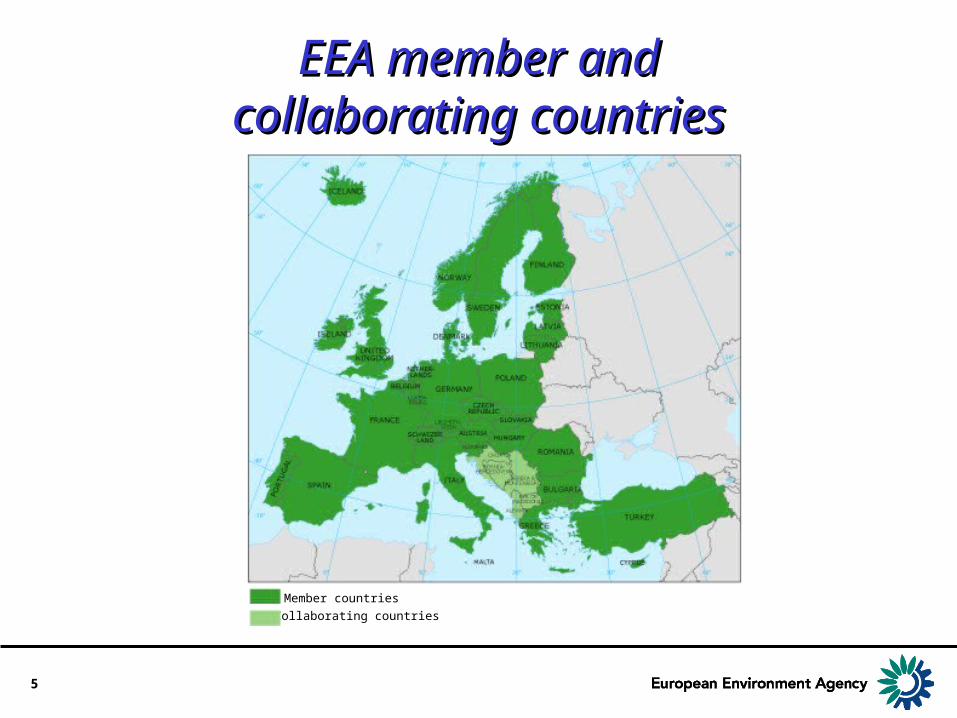
EEA member andEEA member andcollaborating countriescollaborating countries
Member countries
Collaborating countries
6
Climate change and its impactsClimate change and its impacts
7
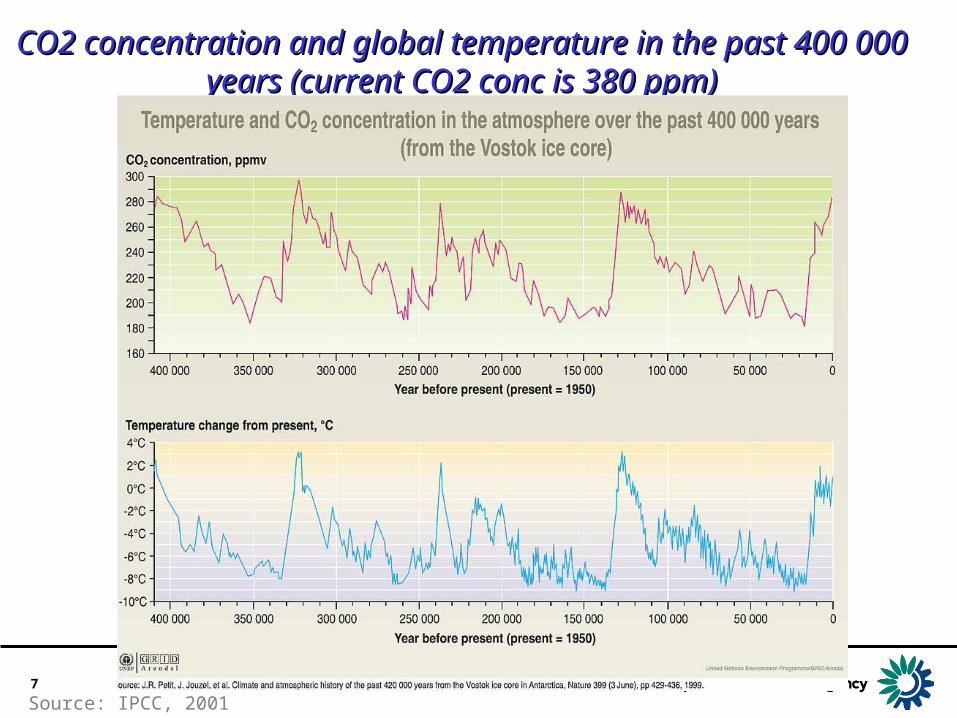
CO2 concentration and global temperature in the past CO2 concentration and global temperature in the past 400 000 years (current CO2 conc is 380 ppm)400 000 years (current CO2 conc is 380 ppm)
Source: IPCC, 2001
8
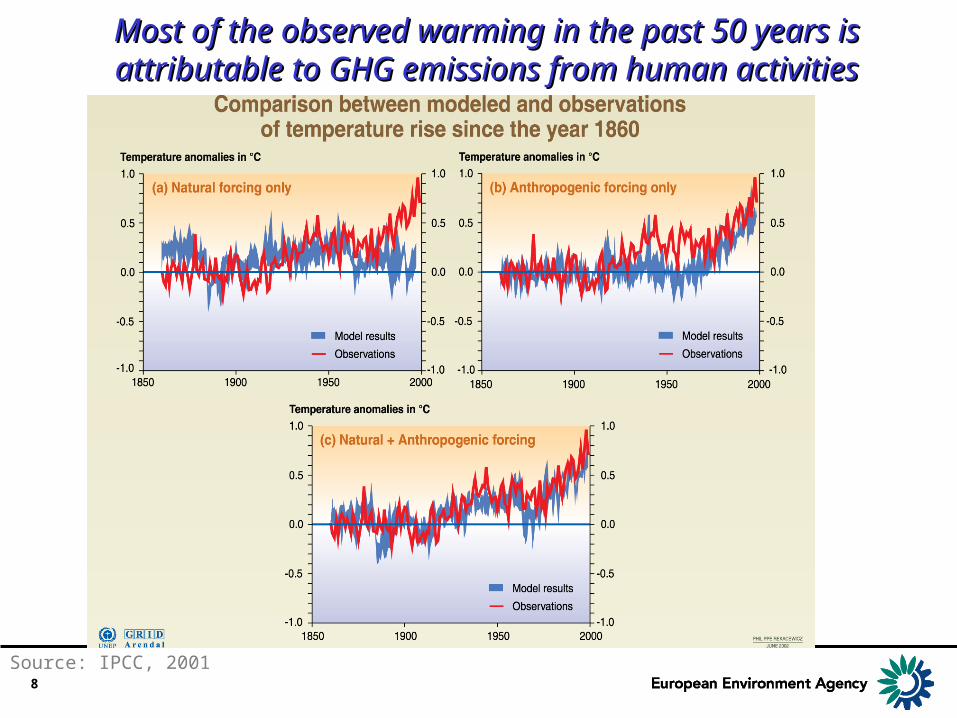
Most of the observed warming in the past 50 years is Most of the observed warming in the past 50 years is attributable to GHG emissions from human activitiesattributable to GHG emissions from human activities
Source: IPCC, 2001
9
Global temperature increased by 0.7 °C over the past 100 years Global temperature increased by 0.7 °C over the past 100 years and is projected to be + 1.4–5.8 °C (1990-2100). The top 5 and is projected to be + 1.4–5.8 °C (1990-2100). The top 5
warmest years worldwide were: 2005, 1998, 2002, 2003, 2004 warmest years worldwide were: 2005, 1998, 2002, 2003, 2004
Source: IPCC, 2001
10
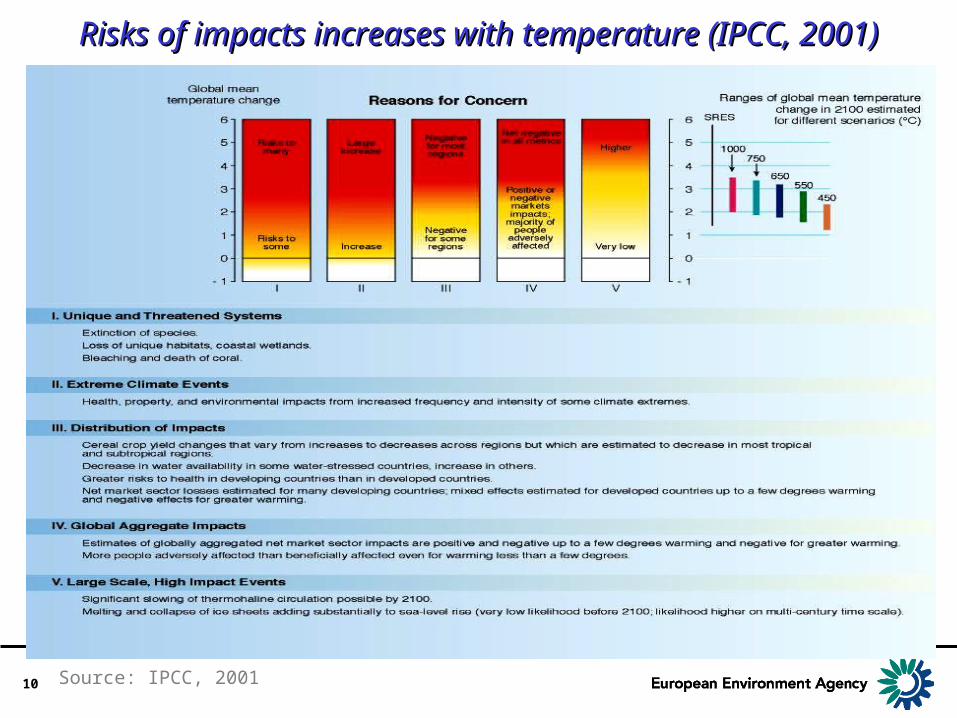
Risks of impacts increases with temperature (IPCC, 2001)Risks of impacts increases with temperature (IPCC, 2001)
Source: IPCC, 2001
11
Ocean acidification, ocean warming and sea Ocean acidification, ocean warming and sea level rise are also key concernslevel rise are also key concerns
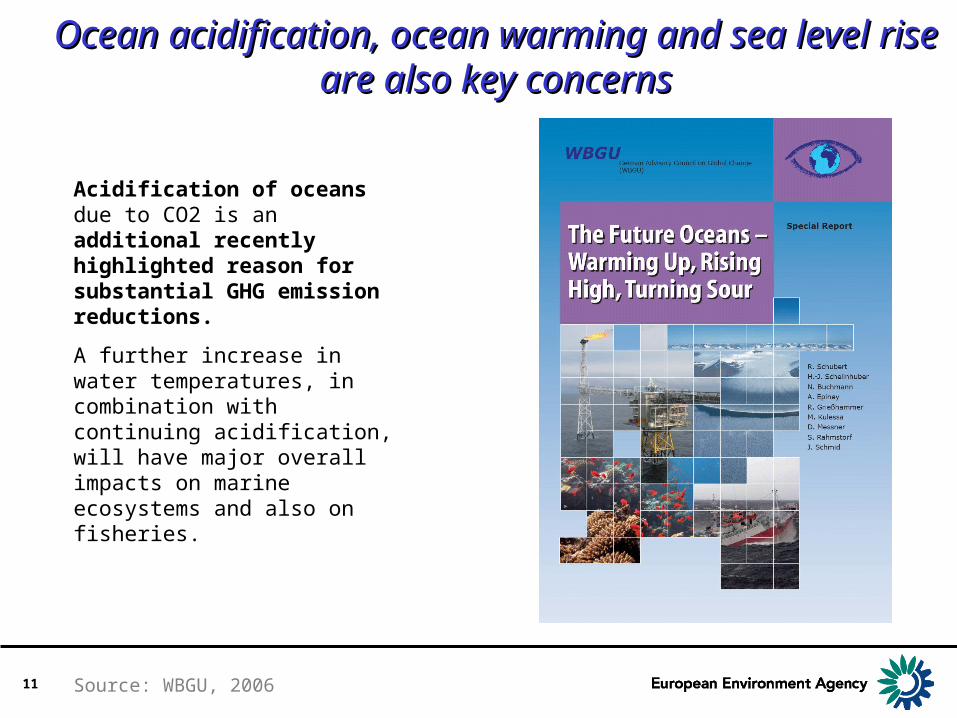
Acidification of oceans due to CO2 is an additional recently highlighted reason for substantial GHG emission reductions.
A further increase in water temperatures, in combination with continuing acidification, will have major overall impacts on marine ecosystems and also on fisheries.
Source: WBGU, 2006
12
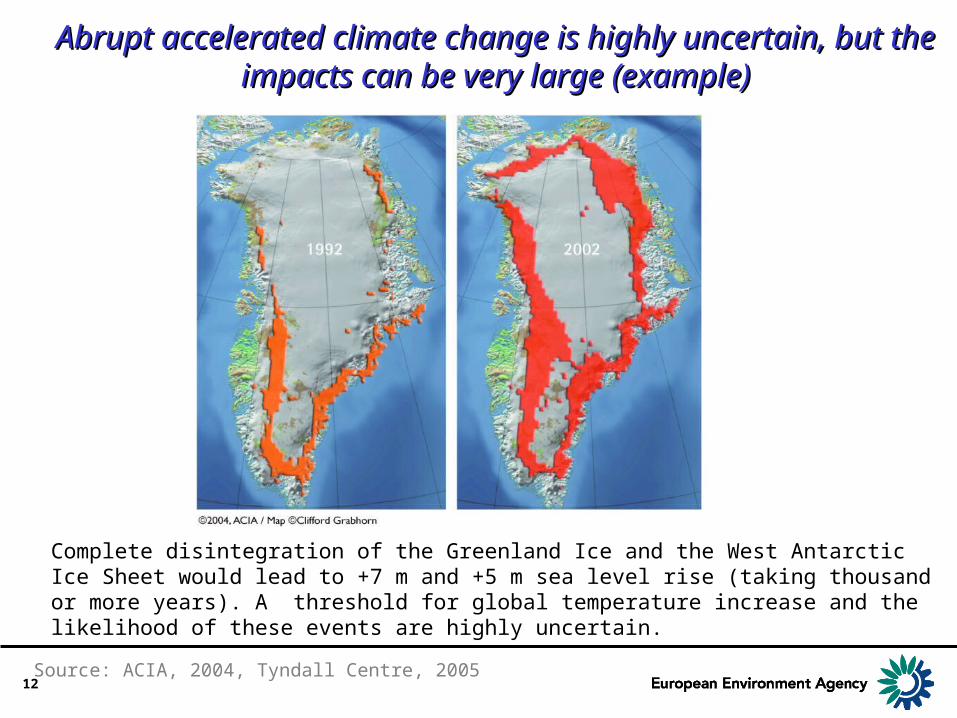
Abrupt accelerated climate change is highly uncertain, Abrupt accelerated climate change is highly uncertain, but the impacts can be very large (example)but the impacts can be very large (example)
Complete disintegration of the Greenland Ice and the West Antarctic Ice Sheet would lead to +7 m and +5 m sea level rise (taking thousand or more years). A threshold for global temperature increase and the likelihood of these events are highly uncertain.
Source: ACIA, 2004, Tyndall Centre, 2005
13
European summer temperature 2003European summer temperature 2003• Very likely that greenhouse gases have doubled the risk of summer
temperatures as hot as 2003• Such a heat wave is now four times more likely. By 2050 every other summer
could be as hot as 2003
Sources: IPCC, WMO, CRU, Stott et. al. (in Nature, 2004)
14
Projected precipitation changes in 2080Projected precipitation changes in 2080• Average annual precipitation is projected to increase in northern Europe (up to
25%) but decrease in southern Europe (up to 25%)• More frequent droughts and intense precipitation events are likely
Source: Hadley Centre HadCM3 model, B2 scenario
15
River flooding events 1998-2005River flooding events 1998-2005 • About 100 (river) floods: more than 700 fatalities, a million people affected and
25 billion EUR in insured economic losses
Source: EEA, 2006
16
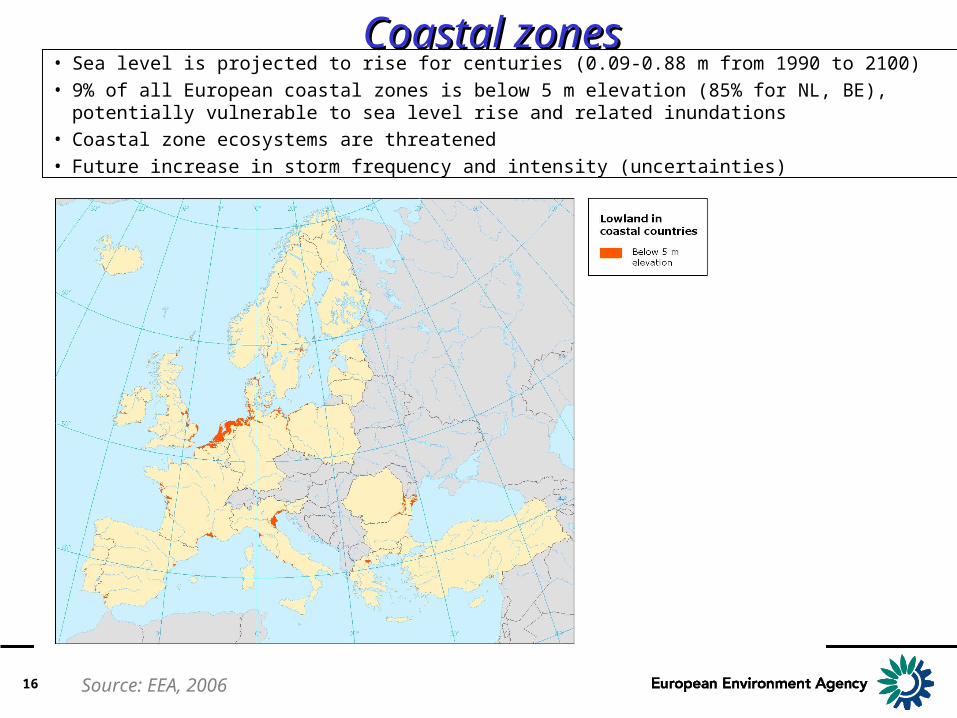
Coastal zonesCoastal zones• Sea level is projected to rise for centuries (0.09-0.88 m from 1990 to 2100)• 9% of all European coastal zones is below 5 m elevation (85% for NL, BE), potentially
vulnerable to sea level rise and related inundations• Coastal zone ecosystems are threatened• Future increase in storm frequency and intensity (uncertainties)
Source: EEA, 2006
17 Source: Henrichs and Alcamo, 2001. Hadley Centre HadCM3 model, baseline scenario
Water resourcesWater resources • Temperature rise and changing precipitation are likely to exacerbate the water
shortage in southern and south-eastern Europe (increasing demand for irrigation in agriculture) and eastern Europe (increasing demand for households and industry)
18
Adaptation and mitigation strategiesAdaptation and mitigation strategies
19
• EU Council target of limiting global temperature increase to +2°C above pre-industrial levels needs global emission reduction of 15% up to 50% by 2050 (from 1990 levels)
• Some global and European climate change is inevitable due to historical built up of greenhouse gases in the atmosphere, and time lags in climate and ocean systems
• EU Council recognised the need to prepare for and adapt to climate change in both developing and developed countries, to complement mitigation policies
• Addressing climate change has costs, but also brings benefits and opportunities e.g. for innovation
Balancing mitigation and adaptation: “Balancing mitigation and adaptation: “Avoiding the Avoiding the unmanageable, managing the unavoidable”unmanageable, managing the unavoidable”
20
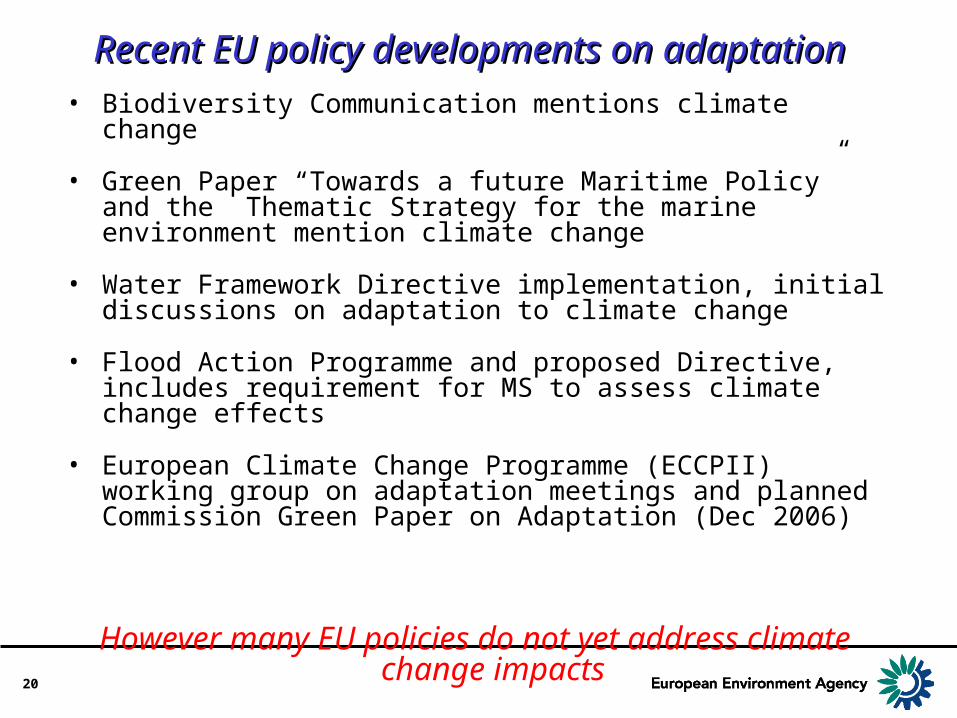
• Biodiversity Communication mentions climate change
• Green Paper “Towards a future Maritime Policy” and the Thematic Strategy for the marine environment mention climate change
• Water Framework Directive implementation, initial discussions on adaptation to climate change
• Flood Action Programme and proposed Directive, includes requirement for MS to assess climate change effects
• European Climate Change Programme (ECCPII) working group on adaptation meetings and planned Commission Green Paper on Adaptation (Dec 2006)
However many EU policies do not yet address climate change impacts
Recent EU policy developments on adaptationRecent EU policy developments on adaptation
21
Global CO2 emissions have increased Global CO2 emissions have increased substantially, especially since the 1950ssubstantially, especially since the 1950s
Source: CDIAC, 2004
22
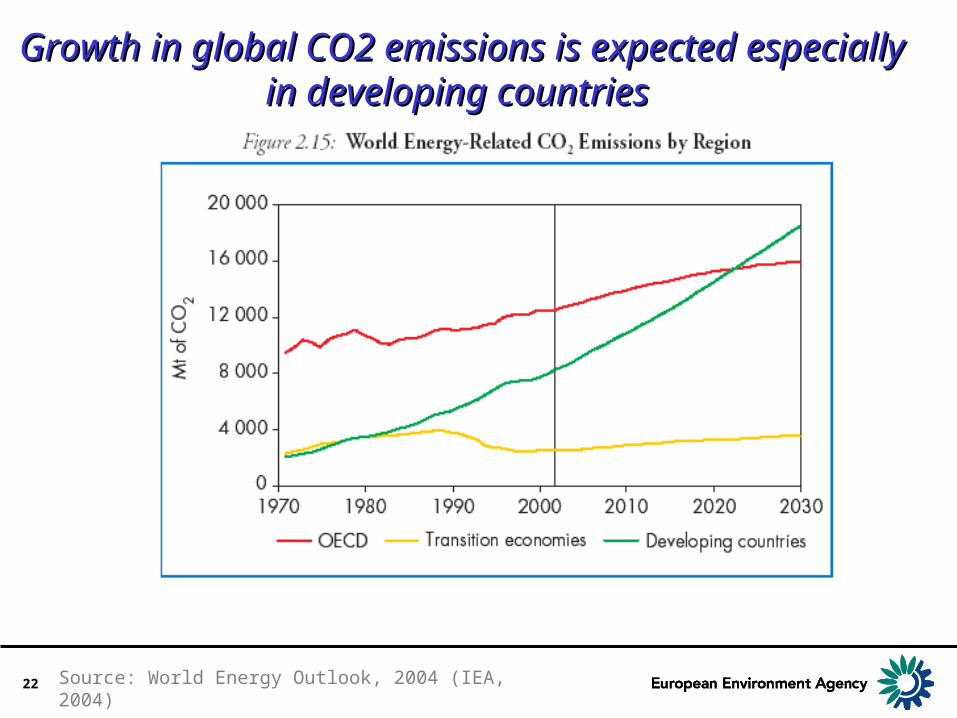
Growth in global CO2 emissions is expected Growth in global CO2 emissions is expected especially in developing countries especially in developing countries
Source: World Energy Outlook, 2004 (IEA, 2004)
23
The EU target of max + 2 °C temperature increase requires at least stabilising at 550 ppm CO2–equivalent. Most likely a lower target is needed, e.g. 450 ppm. The latter would mean 80% emission reduction by 2050 for developed countries (from 1990 levels). However also other countries should limit increase or reduce emissions
The EU proposed that developed countries would reduce total GHG The EU proposed that developed countries would reduce total GHG emissions by 15-30% by 2020 and 60-80% by 2050 emissions by 15-30% by 2020 and 60-80% by 2050
Source: EEA, 2005
24
Pathway towards 550 ppm CO2 eq or ca. 450 ppm CO2Pathway towards 550 ppm CO2 eq or ca. 450 ppm CO2
Source: EEA, 2005
25
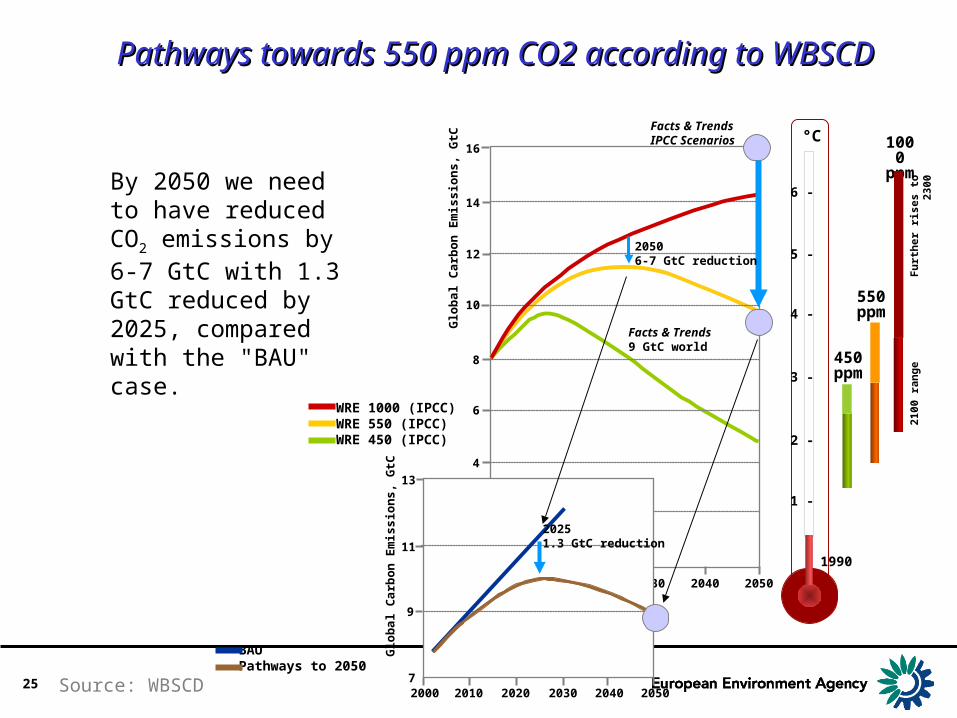
By 2050 we need to have reduced CO2 emissions by 6-7 GtC with 1.3 GtC reduced by 2025, compared with the "BAU" case.
1990
550 ppm
450 ppm
6 -
5 -
4 -
3 -
2 -
1 -
°C
Glo
ba
l C
arb
on
Em
iss
ion
s,
GtC
WRE 1000 (IPCC)WRE 550 (IPCC)WRE 450 (IPCC)
1000 ppm
2100
ran
ge
Fu
rth
er r
ises
to
230
0
205020402030202020102000
6
8
10
4
12
14
16
2
2000 2010 2020 2030 2040 2050
9
11
13
7
Glo
ba
l C
arb
on
Em
iss
ion
s,
GtC
20251.3 GtC reduction
Facts & TrendsIPCC Scenarios
20506-7 GtC reduction
Facts & Trends9 GtC world
BAUPathways to 2050
Pathways towards 550 ppm CO2 according to WBSCDPathways towards 550 ppm CO2 according to WBSCD
Source: WBSCD
26
World energy systemWorld energy system
27
World energy demandWorld energy demand
•global energy market is projected to grow by two-thirds over the next three decades, annual demand growth of 1.7% p.a.•Worldwide consumption of natural gas will almost double by 2030, overtaking that of coal within the next decade.
Source: IEA, 2004
28
China and Asia’s energy demand will growChina and Asia’s energy demand will grow
Source: IEA, 2004
29
We probably will not run out of resources by 2030, non-We probably will not run out of resources by 2030, non-conventional oil becomes important conventional oil becomes important
Source: IEA, 2004
30
Increases in energy prices may lead to some reduction in Increases in energy prices may lead to some reduction in demand and may make renewable energy more attractive, but demand and may make renewable energy more attractive, but
is problematic especially for developing countriesis problematic especially for developing countries
31
World oil reserves and productionWorld oil reserves and production
Source: IEA, 2004
32
World gas productionWorld gas production
Source: IEA, 2004
33
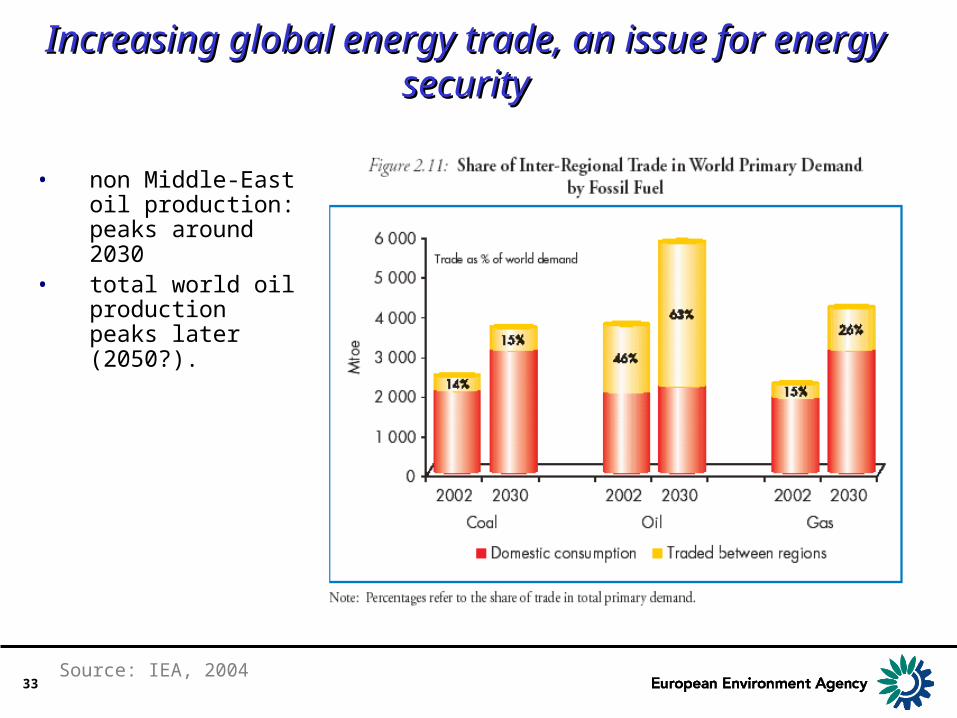
Increasing global energy trade, an issue for Increasing global energy trade, an issue for energy securityenergy security
• non Middle-East oil production: peaks around 2030
• total world oil production peaks later (2050?).
Source: IEA, 2004
34
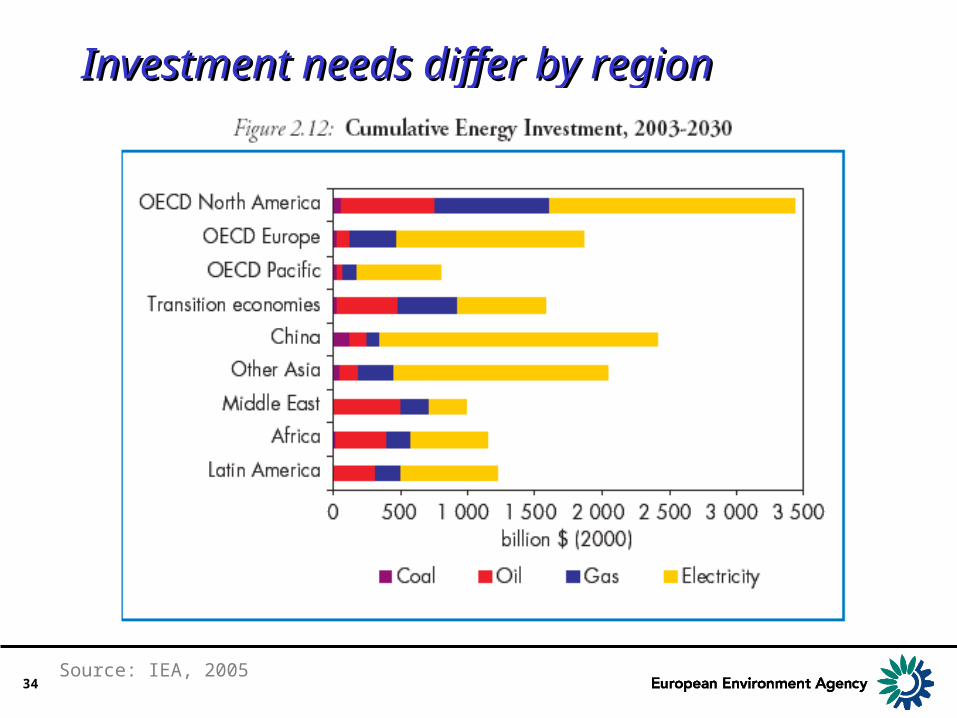
Investment needs differ by regionInvestment needs differ by region
Source: IEA, 2005
35
Global investment needsGlobal investment needs• Total energy-supply infrastructure investment
needs up to 2030: $16 trillion
• The electricity sector dominates (60%), oil and gas sectors will be 19%
• Total investment needs are 1% of global GDP
• Russia’s investment requirement will be 5% of GDP, Africa’s 4%, much lower in OECD countries
• More private sector involvement in developing countries will be required
• The projected rate of growth in investment and supply projected still leaves 1.4 billion people without access to electricity in 2030
Opportunities to invest in sustainable energy
Source: IEA, 2005
36
• There is a substantial potential for energy savings and energy efficiency in all sectors (transport, industry, buildings)
• In power and heat generation a combination of low carbon energy technologies is needed, including substantial increases in all renewable energy technologies and high-efficient natural gas plants
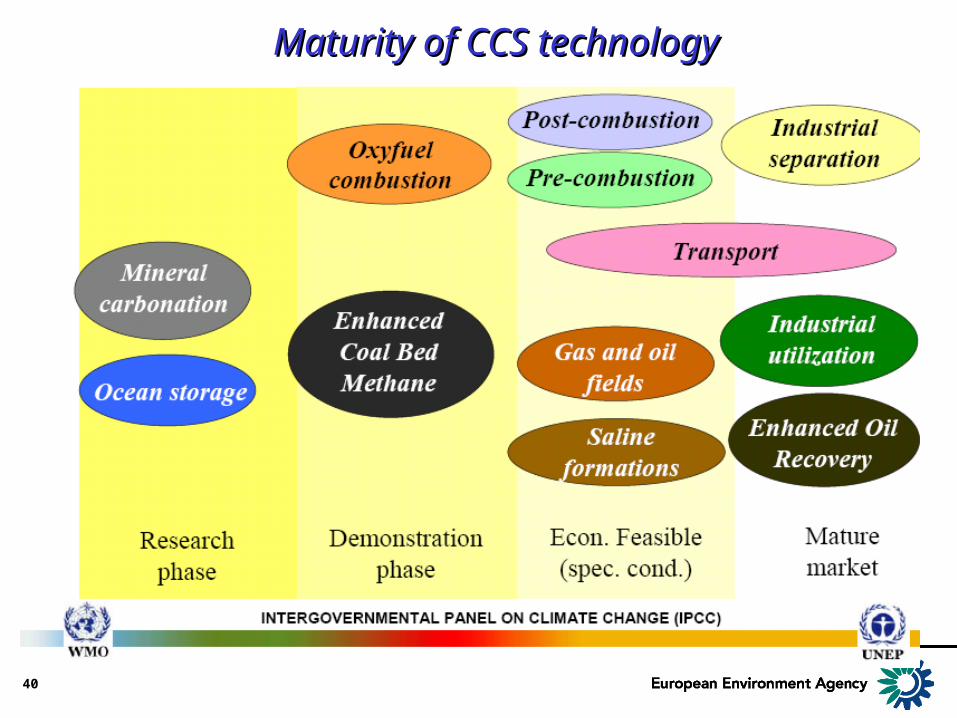
• The use of carbon capture and storage (CCS) at a large scale may contribute, however further research and demonstration of the technology with manageable environmental and other risks is needed. Risks of CO2 storage in the ocean, i.e. in the water column and on the sea floor, are high
• Nuclear might also contribute. However there is still no acceptable long term waste storage available, some risks of accidental radioactive releases remain, risk of possible use for nuclear weapons, costs estimates differ, long preparation and building time
The need for a portfolio for achieving substantial The need for a portfolio for achieving substantial global CO2 emission reductions global CO2 emission reductions
37
Carbon capture and storageCarbon capture and storage
38
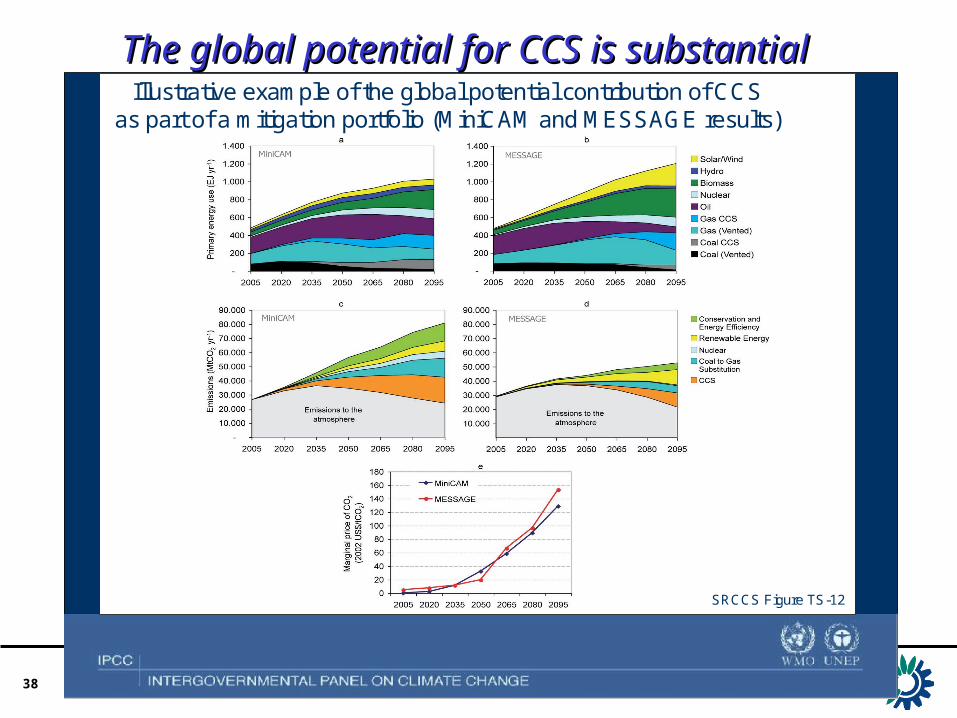
The global potential for CCS is substantial The global potential for CCS is substantial
SRCCS Figure TS-12
Illustrative example of the global potential contribution of CCSas part of a mitigation portfolio (MiniCAM and MESSAGE results)
39
CO2 storage prospectiveCO2 storage prospective
40
Maturity of CCS technologyMaturity of CCS technology
41
EU China partnership on climate changeEU China partnership on climate change
• China relies for 70% of its energy consumption on coal. In 2004 China consumed some 34% of the coal used worldwide and generated 74% of the growth in world coal consumption. China wishes to reduce coal-related environmental pollution in cities.
• EU cooperation with China includes:
• Partnership to develop and demonstrate near zero emissions coal technology through carbon capture and storage
• Action Plans on clean coal technologies and energy efficiency & renewable energy
• Joint research projects in many areas
42
EU GHG emissions and energy trendsEU GHG emissions and energy trends
43
The EU15 will reach its Kyoto target (-8%) only with The EU15 will reach its Kyoto target (-8%) only with additional domestic measures and Kyoto mechanismsadditional domestic measures and Kyoto mechanisms
44
Various EU15 MS are not on track to their Kyoto targets Various EU15 MS are not on track to their Kyoto targets (2005 information)(2005 information)
Projects to meet its national burden sharing (Kyoto Protocol) target through:
EU-15 EU-10
Existing domestic policies and measures Sweden, UK Czech Republic, Estonia, Hungary, Lithuania, Latvia, Poland and Slovak Republic
Existing and planned domestic policies and measures
France, Germany, Greece
Slovenia
Existing domestic policies and measures and use
of Kyoto mechanisms
Luxembourg
Existing and planned domestic policies and measures and use of Kyoto mechanisms
Austria, Belgium, Finland, Netherlands
Projects not to meet its national target Denmark, Ireland, Italy, Portugal, Spain
No Kyoto Protocol target Malta, Cyprus
45
EU-15 GHG emissions from transport are projected to EU-15 GHG emissions from transport are projected to increase further, emissions from other sectors decreaseincrease further, emissions from other sectors decrease
46
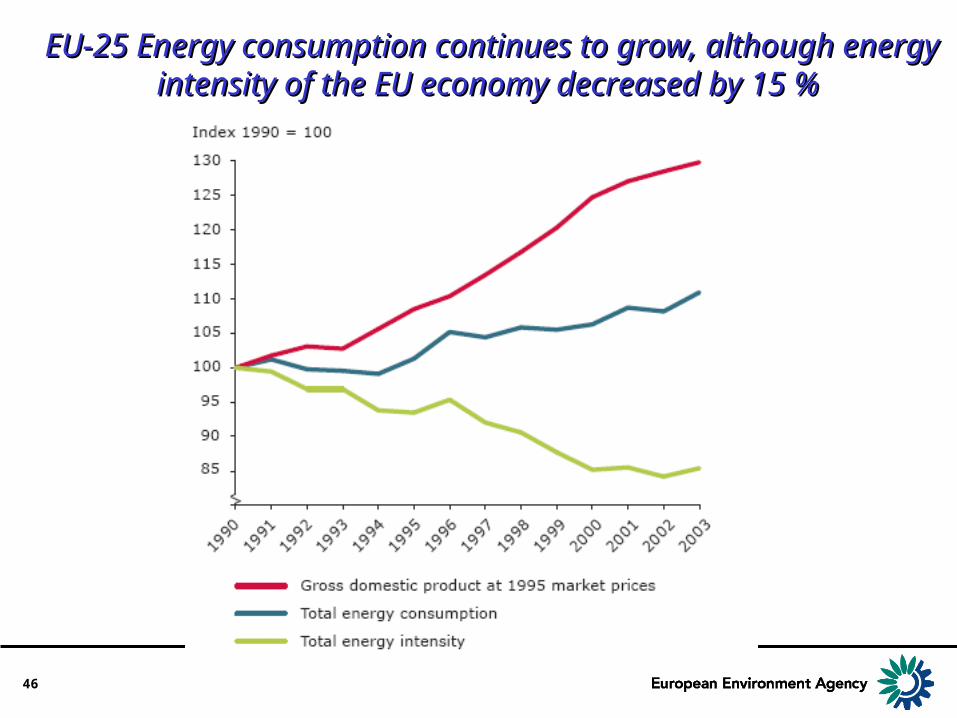
EU-25 Energy consumption continues to grow, although EU-25 Energy consumption continues to grow, although energy intensity of the EU economy decreased by 15 %energy intensity of the EU economy decreased by 15 %
47
Share of combined heat and power in electricity Share of combined heat and power in electricity production in 2002 is low in many MSproduction in 2002 is low in many MS
48
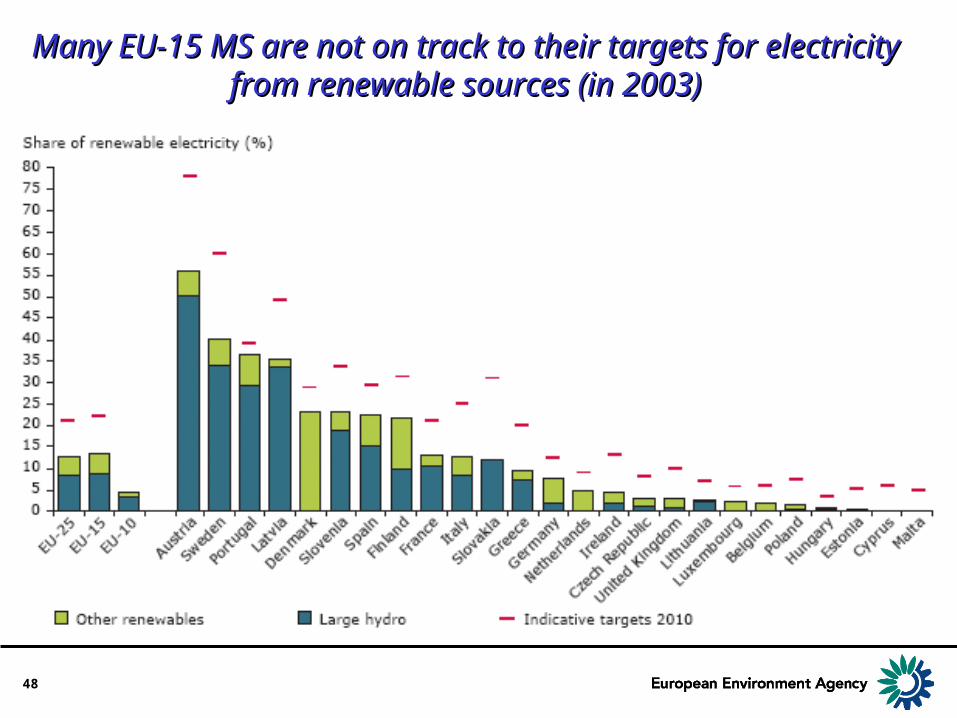
Many EU-15 MS are not on track to their targets for Many EU-15 MS are not on track to their targets for electricity from renewable sources (in 2003)electricity from renewable sources (in 2003)
EU indicative targetof 12% by 2010
Sce
nari
o pr
ojec
tions
49
Key EU (domestic) policies and measures to Key EU (domestic) policies and measures to reduce GHG emissionsreduce GHG emissions
• EU CO2 emissions trading schemeEU CO2 emissions trading scheme• Electricity from renewable energy• Combined heat and power (CHP)• Energy efficiency (buildings, industry,
household appliances, cars)• Biofuels in transport • Recovery of methane from landfills• Reduction of fluorinated gases• Remove potentially environmentally harmful
subsidies• Research and development • Raise awareness
50
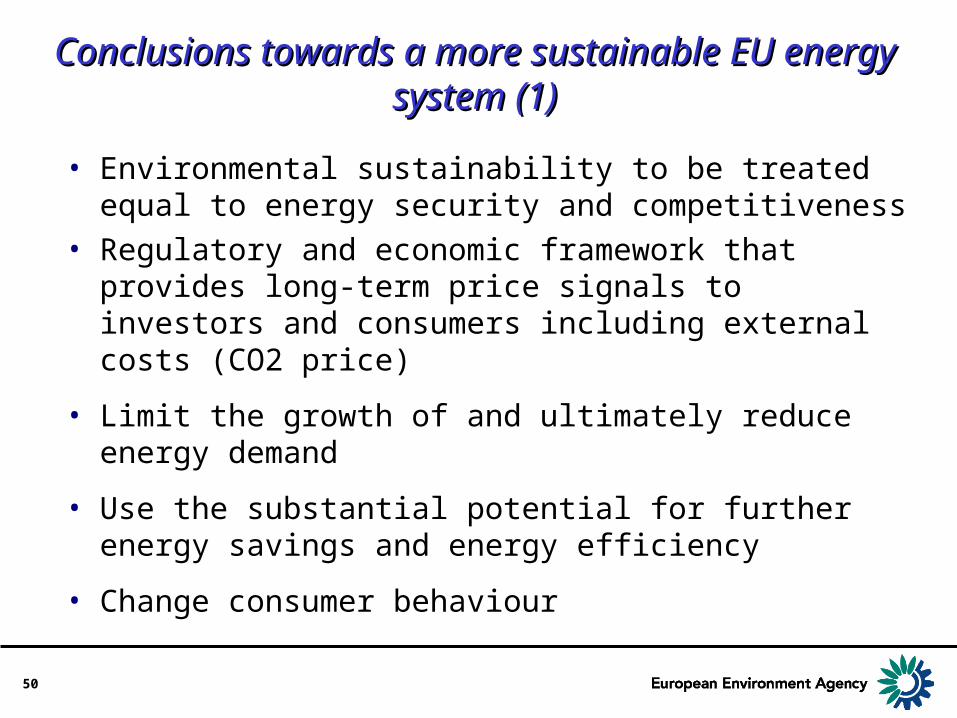
• Environmental sustainability to be treated equal to energy security and competitiveness
• Regulatory and economic framework that provides long-term price signals to investors and consumers including external costs (CO2 price)
• Limit the growth of and ultimately reduce energy demand
• Use the substantial potential for further energy savings and energy efficiency
• Change consumer behaviour
Conclusions towards a more sustainable EU Conclusions towards a more sustainable EU energy system (1)energy system (1)
51
• Use mix of many different technologies to reduce greenhouse gas emissions
• Substantial increase in the use of renewable energy
• Sufficient funding for energy research and development
• Change energy subsidies which still focus primarily on fossil fuels despite their adverse environmental impacts
Conclusions towards a more sustainable EU Conclusions towards a more sustainable EU energy system (2)energy system (2)
52
Source: Scenarios on energy efficiency and renewables, European Commission, 2006
EU high renewables and energy efficiency scenario is possible (1)EU high renewables and energy efficiency scenario is possible (1)
Reduction in total primary energy use (-2.5%) and CO2 emissions (-Reduction in total primary energy use (-2.5%) and CO2 emissions (-29%) by 2030 from 1990 levels29%) by 2030 from 1990 levels
53
EU high renewables and energy efficiency scenario (2)EU high renewables and energy efficiency scenario (2)
Renewables: 12% of primary energy needs (2010) (which is the EU Renewables: 12% of primary energy needs (2010) (which is the EU target) and 26% in 2030target) and 26% in 2030
Nuclear reduces (more than in the baseline)Nuclear reduces (more than in the baseline)
Source: Scenarios on energy efficiency and renewables, European Commission, 2006
54
EU high renewables and energy efficiency scenario (3)EU high renewables and energy efficiency scenario (3)
Total electricity almost same in 2030 as in 2000, Renewables: 43% Total electricity almost same in 2030 as in 2000, Renewables: 43% in 2020 and 56% in 2030 (biomass 22%; wind 18%)in 2020 and 56% in 2030 (biomass 22%; wind 18%)
Electricity generation in TWh
Source: Scenarios on energy efficiency and renewables, European Commission, 2006
55
EU high renewables and energy efficiency scenario (4)EU high renewables and energy efficiency scenario (4)
Import dependency is better than in the baseline (total Import dependency is better than in the baseline (total 59.3% in 2030)59.3% in 2030)
Source: Scenarios on energy efficiency and renewables, European Commission, 2006
56
Environmental criteria for increase of biomassEnvironmental criteria for increase of biomass
Extensively cultivated farmland usually has higher biodiversity value
30% of Utilized Agricultural Area ‘environmentally oriented’ farming in 2030 (except Be, Lux, Malta, NL)
High loss of biodiversity & release of soil carbon if grassland is transformed into arable land
Only extensive bioenergy use from grassland
Some farmland species require “ecological stepping stones”
set-aside 3% of intensively used farmland for nature conservation
Source: EEA, 2006
57
Agricultural bioenergy: minimise environ-Agricultural bioenergy: minimise environ-mental pressure by growing the right cropsmental pressure by growing the right crops
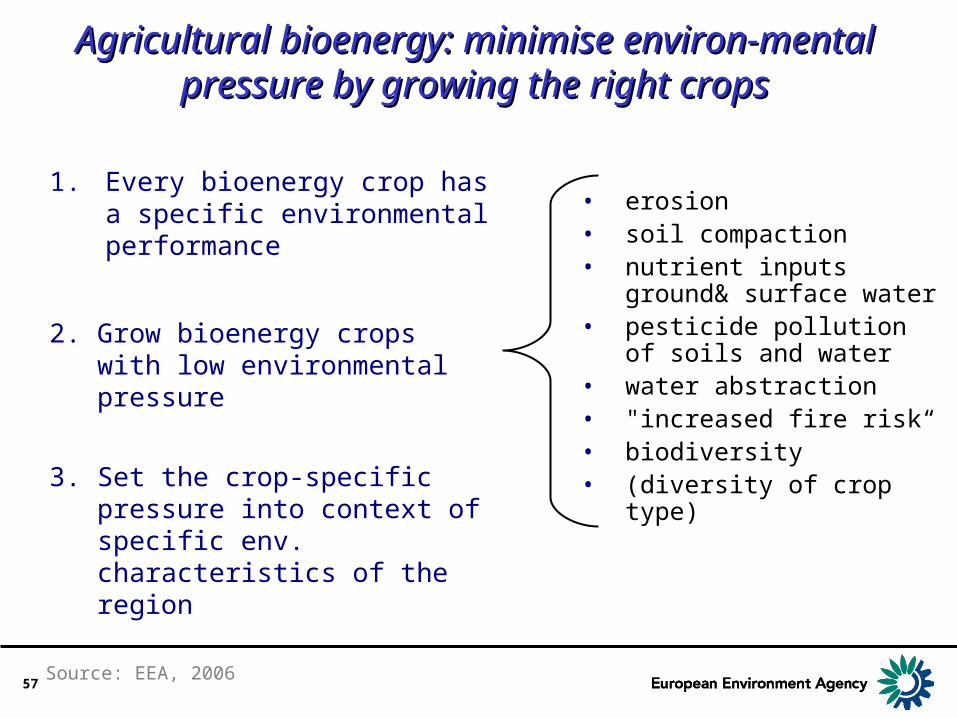
1. Every bioenergy crop has a specific environmental performance
2. Grow bioenergy crops with low environmental pressure
3. Set the crop-specific pressure into context of specific env. characteristics of the region
• erosion• soil compaction• nutrient inputs
ground& surface water• pesticide pollution of
soils and water• water abstraction• "increased fire risk“• biodiversity• (diversity of crop type)
Source: EEA, 2006
58
Even under environmental criteria EU-25 Even under environmental criteria EU-25 bio-energy potential is substantialbio-energy potential is substantial
Potentials for 2030 are (MtOE): Waste 100; Agriculture 140; Forestry 55 (total 295) (in 2003: 69)
Source: EEA, 2006
59
Co-benefits between energy use and Co-benefits between energy use and nature protection are possiblenature protection are possible
1. Use cuttings from grassland • necessary to maintain biodiversity-rich grassland and landscape
diversity• provide (limited) amount of bioenergy (5-7% of total agric. potential)
2. Use new bioenergy crop systems and varieties• reduced environmental pressure: less nutrient input, enhanced crop diversity, less use of heavy machines lower, structural elements• high energy yield
3. Use forest residues • Can support fire prevention measures in otherwise unmanaged forests
in Southern Europe• provides bioenergy, covering (parts of) the cost of collection
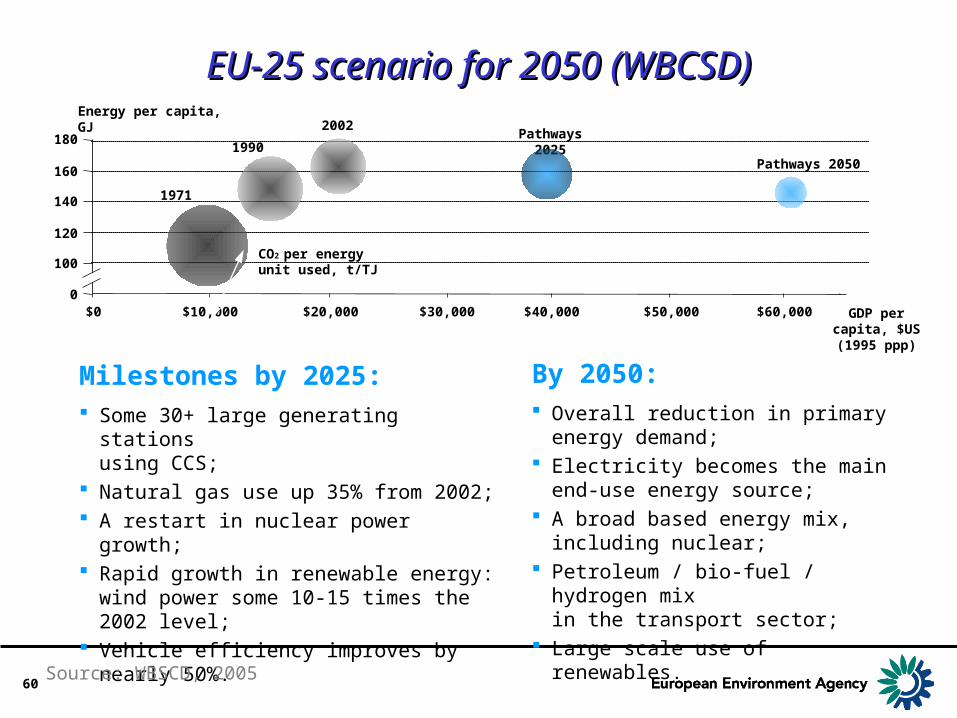
Milestones by 2025: Some 30+ large generating stations
using CCS; Natural gas use up 35% from 2002; A restart in nuclear power growth; Rapid growth in renewable energy: wind
power some 10-15 times the 2002 level; Vehicle efficiency improves by nearly 50%.
Pathways 2050
By 2050: Overall reduction in primary energy
demand; Electricity becomes the main end-use
energy source; A broad based energy mix, including
nuclear; Petroleum / bio-fuel / hydrogen mix
in the transport sector; Large scale use of renewables.
EU-25 scenario for 2050 (WBCSD)EU-25 scenario for 2050 (WBCSD)
Source: WBSCD, 2005
61
• More efforts are required to reach the modest Kyoto targets (which are only a first step)
• Substantial further reductions in global and EU GHG emissions are needed to avoid unacceptable impacts, hence strong global and EU action is needed in energy use and supply
• The challenges are enormous and all should contribute – governments, industries, private persons, researchers, NGOs, etc
Overall conclusions on climate change and Overall conclusions on climate change and sustainable energysustainable energy
62
EU Climate change campaign for citizensEU Climate change campaign for citizens