7 Functional, Physiological and Molecular Imaging DR MUHAMMAD BIN ZULFIQAR PGR III FCPS Services institute of Medical Sciences/ Services Hospital Lahore GRAINGER & ALLISON’S DIAGNOSTIC RADIOLOGY
Transcript
7Functional, Physiological and
Molecular Imaging
DR MUHAMMAD BIN ZULFIQARPGR III FCPS Services institute of Medical
• FIGURE 7-1 ■ A plot of echogenicity against triggering interval for microbubble infusion will be asymptotic. The initial upslope (thick) measures microcirculatory flow speed whilst the asymptote measure is proportional to fractional vascular volume. (After Wei K et al.12)
• FIGURE 7-2 ■ Examples of ‘everyday’ molecular imaging. (A) Peak contrast enhancement of a lung nodule (arrow) on C correlates with expression of vascular endothelial growth factor (VEGF). (B) Uptake of radioiodine (131I) in miliary lung metastases (arrowheads) of thyroid cancer reflecting expression of the sodium/iodide (Na+/I–) symporter. (C) Uptake of 111In-octreotide in a pelvic carcinoid tumour (arrow) indicates expression of somatostatin receptors. (D) Uptake of 18F-fluorodeoxyglucose (FDG) in multiple metastases due to expression of Glut-1 glucose transporters.
• FIGURE 7-2 ■ Examples of ‘everyday’ molecular imaging. (A) Peak contrast enhancement of a lung nodule (arrow) on C correlates with expression of vascular endothelial growth factor (VEGF). (B) Uptake of radioiodine (131I) in miliary lung metastases (arrowheads) of thyroid cancer reflecting expression of the sodium/iodide (Na+/I–) symporter. (C) Uptake of 111In-octreotide in a pelvic carcinoid tumour (arrow) indicates expression of somatostatin receptors. (D) Uptake of 18F-fluorodeoxyglucose (FDG) in multiple metastases due to expression of Glut-1 glucose transporters.
• FIGURE 7-3 ■ Summary of the imaging reporter gene concept. The reporter gene is incorporated into the nuclear DNA of the target cells by transfection (e.g. viral vector). If the reference gene is active, the cell translates the reporter gene to produce reporter messenger RNA (mRNA) which is translated to the reporter protein. The reporter substrate interacts with the reporter protein to produce an imaging signal (e.g. gamma ray, paramagnetic effect).
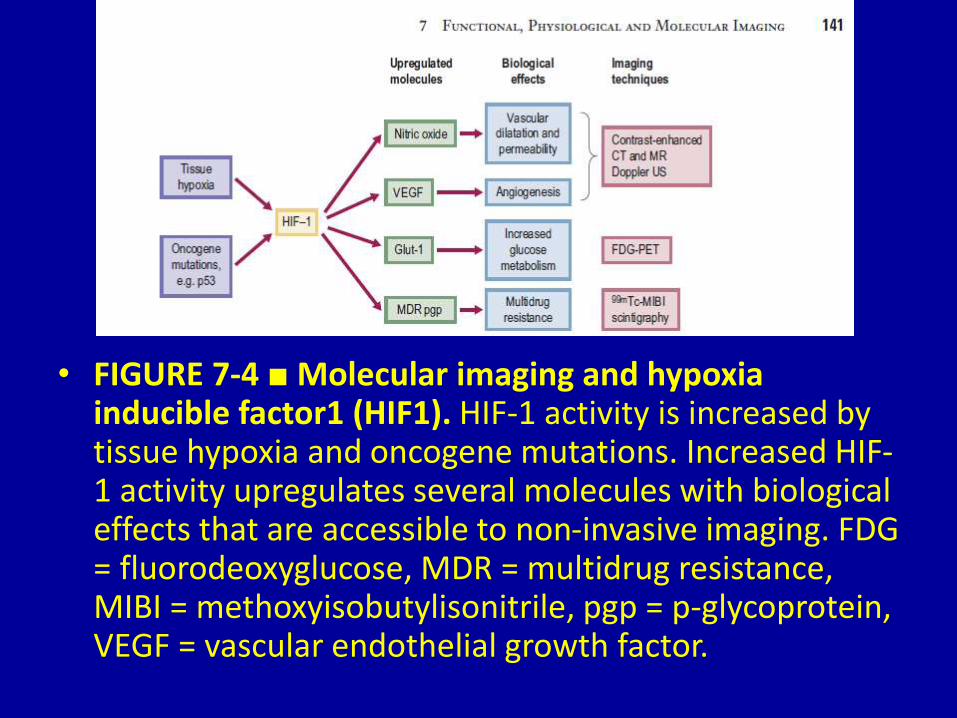
• FIGURE 7-4 ■Molecular imaging and hypoxia inducible factor1 (HIF1). HIF-1 activity is increased by tissue hypoxia and oncogene mutations. Increased HIF-1 activity upregulates several molecules with biological effects that are accessible to non-invasive imaging. FDG = fluorodeoxyglucose, MDR = multidrug resistance, MIBI = methoxyisobutylisonitrile, pgp = p-glycoprotein, VEGF = vascular endothelial growth factor.
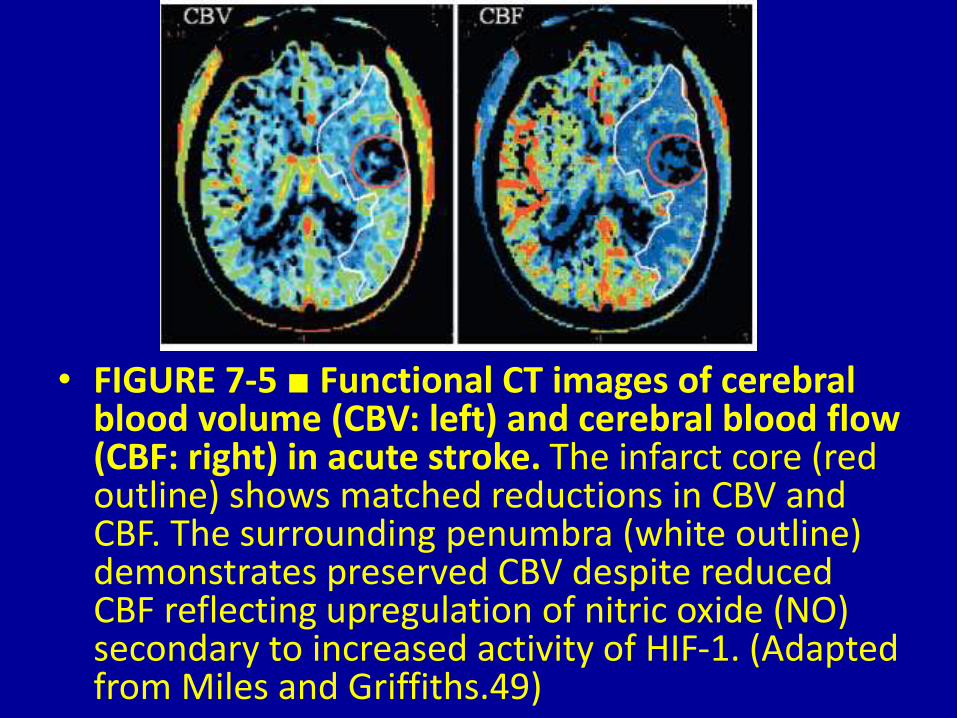
• FIGURE 7-5 ■ Functional CT images of cerebral blood volume (CBV: left) and cerebral blood flow (CBF: right) in acute stroke. The infarct core (red outline) shows matched reductions in CBV and CBF. The surrounding penumbra (white outline) demonstrates preserved CBV despite reduced CBF reflecting upregulation of nitric oxide (NO) secondary to increased activity of HIF-1. (Adapted from Miles and Griffiths.49)
• FIGURE 7-6 ■ Indirect molecular imaging of the expression of p53 (A) and HIF1 (B) in experimental animals. (A) Positive and negative control tumours were grafted onto the left shoulder and left thigh, respectively. The test tumour on the right shoulder only accumulates radioactivity after activation of the p53 pathway in response to DNA damage produced by administration of N,N′-bis(2- chloroethyl)-N-nitrosourea (BCNU). (From Doubrovin M, Pnonmarev V, Beresten T et al 2001 Imaging transcriptional regulation of p53- dependent genes with positron emission tomography in vivo. Proc Natl Acad Sci 98: 9300–9305.) (B) Tumours grafted onto the animal’s left side accumulate radioactivity due to activation of HIF-1. Greater activity is seen in larger tumours, reflecting more severe hypoxia. Control tumours on the animal’s right side show no accumulation of radioactivity. (From Serganova I, Doubrovin M, Vider J et al 2004 Molecular imaging of temporal dynamics and spatial heterogeneity of hypoxia-inducible factor-1 signal transduction activity in tumors in living mice. Cancer Res 64: 6101–6108. With permission of the American Association for Cancer Research.)
• FIGURE 7-6 ■ Indirect molecular imaging of the expression of p53 (A) and HIF1 (B) in experimental animals. (A) Positive and negative control tumours were grafted onto the left shoulder and left thigh, respectively. The test tumour on the right shoulder only accumulates radioactivity after activation of the p53 pathway in response to DNA damage produced by administration of N,N′-bis(2- chloroethyl)-N-nitrosourea (BCNU). (From Doubrovin M, Pnonmarev V, Beresten T et al 2001 Imaging transcriptional regulation of p53- dependent genes with positron emission tomography in vivo. Proc Natl Acad Sci 98: 9300–9305.) (B) Tumours grafted onto the animal’s left side accumulate radioactivity due to activation of HIF-1. Greater activity is seen in larger tumours, reflecting more severe hypoxia. Control tumours on the animal’s right side show no accumulation of radioactivity. (From Serganova I, Doubrovin M, Vider J et al 2004 Molecular imaging of temporal dynamics and spatial heterogeneity of hypoxia-inducible factor-1 signal transduction activity in tumors in living mice. Cancer Res 64: 6101–6108. With permission of the American Association for Cancer Research.)
• FIGURE 7-7 ■Combined physiological and molecular imaging of leftsided nonsmall cell lung cancer. (A) Conventional CT. (B) Molecular imaging of tumour glucose metabolism with FDG-PET. (C) Physiological imaging of tumour blood flow with DCE-CT.
• FIGURE 7-8 ■ The simplest twocompartmental model in which exchange occurs from plasma to interstitium governed by a rate constant k1.
• FIGURE 7-9 ■ Patlak graphical analysis. If a(t) is vascular concentration and c(t) is tissue concentration, a plot of c(t)/a(t) against .a(t)dt/a(t) will tend towards a straight line.