7 March 2019 IndigoVision Group plc (“IndigoVision”, the “Company” or the “Group”) Final Results for the year ended 31 December 2018 The Board of IndigoVision is pleased to report the financial results for the year ended 31 December 2018. Financial highlights Revenue up 9% to $46.0m (2017: $42.1m as restated for IFRS 15) Gross margin increased by 3.4% to 57.4%, driven by increased software sales Operating loss $0.6m (2017 loss: $2.8m) Underlying operating loss $0.6m (2017: Underlying operating loss 1 $2.4m) Net cash balance of $2.0m at 31 December 2018 (2017: $2.6m) Basic and diluted loss per share 4.1 cents (2017: loss per share 34.9 cents) Adjusted loss per share 4.1 cents (2017 adjusted loss per share 2 : 29.6 cents) No final dividend proposed (2017: nil) Operational highlights Key US market sales growth 20% Authorised resellers increased by 10% and new value added reseller channel established Launch of Integra®, all-in-one appliance aimed at the SME market Replacement Ultra camera range launched and new camera supply sources currently under development Max Thowless-Reeves replaces George Elliott as Chairman, with George remaining as a Non- executive Director Martin Pengelley to retire from the Board at the forthcoming AGM Pedro Simoes, Chief Executive, commented: “I am pleased with the progress we have made to date, in strengthening our sales team, growing our customer base and opening up a new value added distribution channel. The launch of a number of new products has helped reposition the business and facilitate growth. In 2018, our software revenues grew by approximately one quarter year-on-year and we continue to seek out new technology partnerships to bring value to our customers through IndigoVision’s Control Center video management software.” 1 Underlying operating loss represents operating loss of $2.8m prior to the exceptional compensation and settlement costs of $0.40m 2 Adjusted loss per share is based on the 2017 loss after tax of $2.6m prior to the exceptional compensation and settlement costs of $0.40m Enquiries to:
Transcript
7 March 2019
IndigoVision Group plc
(“IndigoVision”, the “Company” or the “Group”)
Final Results for the year ended 31 December 2018
The Board of IndigoVision is pleased to report the financial results for the year ended 31 December 2018.
Financial highlights
Revenue up 9% to $46.0m (2017: $42.1m as restated for IFRS 15)
Gross margin increased by 3.4% to 57.4%, driven by increased software sales
Operating loss $0.6m (2017 loss: $2.8m)
Underlying operating loss $0.6m (2017: Underlying operating loss1 $2.4m)
Net cash balance of $2.0m at 31 December 2018 (2017: $2.6m)
Basic and diluted loss per share 4.1 cents (2017: loss per share 34.9 cents)
Adjusted loss per share 4.1 cents (2017 adjusted loss per share2: 29.6 cents)
No final dividend proposed (2017: nil)
Operational highlights
Key US market sales growth 20%
Authorised resellers increased by 10% and new value added reseller channel established
Launch of Integra®, all-in-one appliance aimed at the SME market
Replacement Ultra camera range launched and new camera supply sources currently under development
Max Thowless-Reeves replaces George Elliott as Chairman, with George remaining as a Non-executive Director
Martin Pengelley to retire from the Board at the forthcoming AGM
Pedro Simoes, Chief Executive, commented:
“I am pleased with the progress we have made to date, in strengthening our sales team, growing our customer base and opening up a new value added distribution channel. The launch of a number of new products has helped reposition the business and facilitate growth. In 2018, our software revenues grew by approximately one quarter year-on-year and we continue to seek out new technology partnerships to bring value to our customers through IndigoVision’s Control Center video management software.”
1 Underlying operating loss represents operating loss of $2.8m prior to the exceptional compensation and
settlement costs of $0.40m
2 Adjusted loss per share is based on the 2017 loss after tax of $2.6m prior to the exceptional compensation
and settlement costs of $0.40m
Enquiries to:
IndigoVision Group plc Pedro Simoes (CEO) +44 (0) 131 475 7200
This time last year, I indicated the Group’s financial performance in 2017 and indeed, prior years, had not been acceptable and that IndigoVision was not achieving its full potential. The change of leadership undertaken in 2017 was designed to reverse this and it is taking effect. There is a high pace of internal change and momentum is building throughout the Group. This momentum has been reflected in the significantly improved operational performance in 2018 and is expected to continue into 2019 and beyond.
I am pleased to report that under the stewardship of the new leadership team, the Group has increased revenue by 9%, improved the gross margin by 3.4 percentage points and reduced the operating loss by $2.2m as compared with 2017. The Group made an operating loss of $0.6m in the year ended 31 December 2018 compared to an operating loss of $2.8m the previous year. Despite this substantial improvement, there remains much work still to be done to return the Group to an acceptable level of profitability and this remains the focus for the Board and the leadership team for the year ahead.
Strategy
As reported previously the Group’s strategy to grow its market share and profitability is to:
increase and improve the quality of its sales presence in key geographies;
develop differentiated products in collaboration with other software developers to meet the growing demand for cyber security and intelligent video security systems;
work closely with our OEM partners; and
improve productivity and efficiency and control costs.
Sales
During the year the significant investment made in strengthening the Group’s sales presence in North America in 2017, in particular in the United States, has begun to yield results.
In addition, the number of authorised system integrators that resell the Group’s products has increased by 10% during the year. Furthermore, following the development of new products targeted at small and medium sized enterprises, the Group has opened up a new value added reseller channel, with 19 new distributors located in strategic markets.
Product roadmap
The Group’s current product range has been reviewed and repositioned to be more competitive. New products in the pipeline have also been assessed to ensure that priority is given to the benefits and features that our customers need and to focus on cyber security and artificial intelligence. Relationships with third party software developers have also been strengthened during the year.
Relationship with equipment suppliers
We are working closely with our hardware equipment suppliers to provide our customers with the best integrated end-to-end solutions for their security needs, allowing them to take maximum advantage of
IndigoVision’s software. In September 2018, the US Government introduced a 10% tariff on cameras manufactured in China and, depending on the ongoing bi-lateral trade negotiations between the two countries, there is the possibility that this tariff will increase to 25% in the very near term. In response to this change, the Group’s primary camera supplier is opening a production facility in Central America and the Group is broadening its supply chain to offer cameras manufactured in other parts of Asia, both of which initiatives should mitigate the impact of any incremental duties.
BREXIT
Whilst the majority of the Group’s products are manufactured outside the European Union, certain network video recorders are manufactured within the EU. The Group has recently increased inventory within its UK warehouse and has developed contingency plans to minimise supply interruption in the event of a no-deal Brexit. With supply locations in the UK, USA and Malaysia, the Group has inherent flexibility within its supply chain to enable it to meet customer demand throughout any transitionary arrangements after 29 March 2019.
Results
Revenue in the year ended 31 December 2018 was $46.0m, in line with expectations. Overall revenues were $3.9m (9%) higher than 2017 ($42.1m, as restated for the adoption of IFRS 15).
Regional sales performance continues to be mixed, with revenue growth of 45% in APAC, 8% growth in North America (including 20% growth in the USA), 5% growth in EMEA, but a 9% decline in Latin America.
Encouragingly, gross margin improved substantially in the year to 57.4% from 54.0% in 2017, continuing the upward trend seen since the latter half of 2016. This was achieved, primarily, by increased software sales, improved warranty cost management and a shift towards more profitable geographic markets.
The overall result for the year was an operating loss of $0.6m (2017: $2.8m). The operating loss before exceptional items was $0.6m (2017: $2.4m). Included within these results were professional fees of $0.2m in relation to acquisitions which were not completed (2017: $nil) and an FX loss of $0.2m (2017: FX gain of $0.3m). The first time adoption of IFRS 15 has increased the 2018 operating loss by $0.3m (2017: nil), through the net deferral of extended warranty income to subsequent periods.
Board Changes
The last eighteen months have seen substantial changes in the Board, which have in turn driven rapid and far-reaching changes in both the strategic direction and operation of the business. The Board recognises the need to provide additional support to the executive management team. I am therefore pleased to confirm that one of my fellow non-executive directors, Max Thowless-Reeves, has agreed to dedicate additional time to the affairs of the Group and will become Chairman with immediate effect. Unfortunately, my other business commitments do not allow me to devote the necessary time to undertake this role, but I will remain as a non-executive director of the Company.
Martin Pengelley has indicated his intention to retire from the Board at the forthcoming AGM and I should like to thank him for his contribution over the last five years. The Board expects to announce Martin’s replacement shortly.
Cash and Dividends
The net cash balance at 31 December 2018 was $2.0m (2017: $2.6m). The Group is in the latter stages of negotiating a new invoice finance facility, to provide additional working capital to facilitate organic and acquisitive growth and replaces the $4.0m overdraft facility previously provided by Royal Bank of Scotland plc.
The Company will not pay a dividend this year (2017: nil).
Outlook
The Board and senior management expect to make further significant progress in delivering the Group’s strategy and returning the business to profitability in 2019.
Operational Review
2018 started to show positive results of the new strategic direction set during the previous year. The significant
investment made in strengthening the Group’s sales presence in North America in 2017, in particular in the
United States, has started to pay off. In addition, the number of authorised system integrators that resell the
Group’s products has increased by 10% during the year and, following the development of new products
targeted at small and medium sized enterprises, the Group has opened up a new value added reseller
channel, with 19 new distributors located in strategic markets.
During the first half of 2018 the Group launched a range of new products and services including the Integra all-
in-one device, which combines video storage and Control Center video management software in a single piece
of hardware. The product targets the SME market, and has attracted a strong pipeline of orders since its
launch in April. The Group also enhanced its patent-pending CyberVigilant® technology, using software to
identify and report on anomalies within a customer’s CCTV network. This second generation of IndigoVision’s
cyber technology is now embedded within the camera, allowing for real time protection at the edge of the
network and differentiating the Company’s products from the competition.
On 13 August 2018, the US Government enacted legislation, the National Defense Authorization Act (NDAA),
placing restrictions on the use of certain named manufacturers’ hardware products, either for standalone
supply or as a substantial or essential component or as critical technology within any system for US
government and US government-funded contracts; the legislation takes effect in fiscal year 2019.
In addition, the impact and extent of tariffs, especially in relation to the distribution of Chinese manufactured
product into the US, remains dynamic. The high pace of change in this regard brings a corresponding amount
of uncertainty, however the Group does not currently foresee these factors impacting materially on its ability to
fulfil contractual commitments in the US. Also our developing supply chain partnerships and flexibility diminish
our reliance on specific companies and Chinese manufacturers.
Markets and Products
IndigoVision products are deployed in many market sectors for a variety of customers from small and medium
sized enterprises to large and multinational corporations. The Group is particularly well known in the enterprise
markets of airports, safe cities, banks, casinos and law enforcement. End users value the quality, reliability and
scalability of the IndigoVision system, together with the end-to-end customised solutions achieved through an
extensive suite of integration modules with operational and other security software. 2018 saw major project
wins in safe city projects, airports, shopping malls and a number of casinos.
IndigoVision’s product strategy continues to be the design and sale of complete end-to-end video security
solutions, inclusive of video management software, cameras, encoders, storage devices and integration to
security and operational systems. There are few competitors that provide full end-to-end solutions, and buyers
value the system reliability inherent in designing the complete solution, as well as the ease of one-stop
sourcing.
Business Model
IndigoVision designs and manufactures high performance, video security systems for a wide range of users
from large scale and complex security installations to small, eight camera systems. From video capture and
transmission to analysis and storage, IndigoVision networked video security systems provide the best quality
and most secure video evidence, using market leading compression technology to minimise network
bandwidth usage and reduce storage costs.
The Group develops its end-to-end networked video systems through in-house design, use of OEM
manufacturers and working with technology partners. Product is manufactured in Asia and Europe and brought
into inventory based on forecast sales.
The Group utilises both in-house and third party warehouses in Europe, North America and Asia to store
product, enabling timely order despatch to its global customer base and offering local product repair services.
The Group sells its products and services through a global network of authorised partners who install the
Group’s systems at end user sites. The Group’s partners vary in size from large international security
companies to local system integrators; value added resellers; and distributors in limited geographies. These
companies offer first line technical support to end users and can maintain the system post sale. The Group
provides second line technical support to authorised partners.
The Group is structured into four regional sales and support teams, with people in 23 countries, generating
sales across many more countries.
Strategy
Key areas of strategic development for the business include:
Technology innovation
New products are brought to market regularly to maintain the Group’s competitive position as technology
advances. The Group operates a dual development strategy of in-house software development and OEM
product sourcing and qualification. The in-house engineering team ensures all products supplied within the
end-to-end offering are tested robustly and fully optimised as a complete solution to deliver market leading
performance and reliability. Hardware life-cycles in the security market are reducing and, by sourcing products
from a number of suppliers, the Group can offer a broader product range and increase speed to market for
new technology. The Group’s in-house development resource is strategically weighted towards software
development, to meet increased market demand for intelligent video systems for both security and operational
needs.
The Group continues to look at exciting partnership opportunities to combine IndigoVision’s scale and
technology base with emerging technology providers to create further innovative new products, possibly
including bolt-on acquisitions of complementary technologies.
Sales and marketing
New and repeat business is being won continually; new markets have been developed in line with the Group’s
strategy; key customer relationships are monitored on a regular basis and the performance of the regional
sales teams is continually reviewed to ensure appropriate development is provided and teams resourced
accordingly. The sales and marketing team structure is evolving to manage the targeted growth.
Supply chain and logistics
The Group sources products from multiple suppliers in Asia and Europe, and consolidates these in three main
logistics centres in Malaysia, the USA and the UK, operated by third parties. The Group also operates service
centres in Colombia and Brazil. The Group continually strives to improve efficiency in the supply chain and
logistics functions, to provide market leading service to our global customer base.
Employees
The continuing success of the Group primarily depends on its employees across the world, who contribute
daily to the achievement of the organisational goals. The Group respects its staff and recognises that they are
its most valuable asset. The Group recruits and retains staff globally by offering challenging opportunities,
competitive compensation packages and a good working environment.
The Group strives to provide a working environment which encourages continuous learning and development
for all employees and is committed to effective investment in training and development to achieve its business
goals. The Group conducts an annual staff engagement survey to gauge employees’ professional and
emotional commitment to the Group and to seek feedback to drive continuous improvement.
The Group is committed to employee involvement throughout the business and operates a number of share option, share incentive and long term incentive plans which were adopted in 2018, along with a variety of cash
bonus schemes. The Group has established an employee benefit trust in connection with these share option plans.
Financial Review
Results
In the year to 31 December 2018 revenue was $46.0m (2017: $42.1m), an increase of 9%. Three of the four sales regions achieved sales growth in 2018, with APAC recording year on year growth of 45%. North America and EMEA achieved growth of 8% and 5% respectively. Latin American sales were 9% lower than 2017. Software sales achieved an increase of 26%, with the sale of licences up by 32%. The value of software upgrade plans which entitle customers to receive new versions of IndigoVision Control Center software increased by 35%, the benefit of which will be seen in future years. The Company’s premium “Ultra” software still accounts for the vast majority of licence sales, although recent changes to enhance the functionality of the Pro and Lite versions of the software are expected to yield volume increases. Camera volumes increased by 18% but average prices continued to fall. Overall, camera revenues increased by 8%. Storage revenue declined 2% in the year, with further pressure on selling prices. Storage now represents 26% of revenue (2017: 29%) In line with the Group’s strategic focus on the North American market, the Group implemented a major change in its North American operations in 2017, with a number of changes in personnel, strengthened management, expanded sales and sales support team and a re-positioning of the IndigoVision brand. North American revenues grew 8% in 2018 (2017: 6%). Revenue growth in the key US market was 20%. Within EMEA, performance was mixed with growth in the Middle East & India, as well as in Southern Europe and France offsetting falls in the UK, Northern Europe & Sub-Saharan Africa. Middle East & India growth was 47%, almost completely reversing the 53% fall in 2017.
Difficult market conditions continue in Latin America with sales in the region falling by 9%. There are promising signs however, with the southern part of the region achieving sales growth of 55%.
APAC revenues grew by 45%, represented by growth of 35% in Australia, 267% in China where the Group’s software was selected for Shanghai Pudong Airport, to manage a network of 9,100 cameras, and 26% in South East Asia.
The gross margin improved substantially in the year to 57.4% from 54.0% in 2017, continuing the trend seen since the latter half of 2016. This was achieved through an increasing proportion of software within overall revenue, better control over sales pricing, improved warranty cost management with the increasing proportion of OEM hardware passing more warranty risk back to the supplier and a shift towards more profitable geographic markets. Overheads (excluding foreign exchange), at $26.8m, were 4% higher than last year (2017: $25.9m). This includes an increase of 16% in engineering costs, which now represent 7% of revenue (2017: 6%). Research and development spend has been increased to enable the Group to continue to differentiate its offering through innovation, with research and development now focused on software-led end-to-end video security. The operating loss for the year was $0.6m compared to a loss of $2.8m in 2017. This loss is stated after
expensing $0.2m in relation to acquisitions which were not completed (2017: $nil), together with a foreign
exchange loss of $0.2m (2017: foreign exchange gain of $0.3m). The first time adoption of IFRS 15 has
increased the 2018 operating loss by $0.3m (2017: $nil), through the net deferral of extended warranty income
to subsequent periods.
Cash
The net cash balance at 31 December 2018 was $2.0m (2017: $2.6m). Cash balances are mainly held in US
dollars, sterling, euros and Canadian dollars. Cash reserves in excess of current requirements are placed on a
variety of term deposits. Term deposits are placed with banks from the list of the Group’s approved institutions.
Cash on term deposits is included within cash and cash equivalents on the balance sheet.
During the year, The Royal Bank of Scotland plc indicated that it would be withdrawing the Group’s unutilised
overdraft facility of $4.0m. The Group is in the latter stages of negotiating a new invoice finance facility to
provide additional working capital to facilitate organic and acquisitive growth.
Dividends
It is the Board’s policy that dividends should reflect earnings and, given the full year loss, the Company will not pay a dividend this year.
Consolidated statement of comprehensive income
For the year ended 31 December 2018
Note
2018
$’000
2017 Restated*
$’000
Revenue 3 45,964 42,100
Cost of sales
(19,567) (19,327)
Gross profit
26,397 22,773
Research and development expenses
(3,311) (3,090)
Selling and distribution expenses
(19,114) (17,081)
Administrative expenses
(4,406) (5,699)
Foreign exchange (loss)/gain (206) 281
Operating loss 4 (640) (2,816)
Analysed as:
Underlying operating loss (640) (2,420)
Exceptional salary costs 4 - (396)
Financial income 6 1 12
Loss before tax
(639) (2,804)
Income tax credit 7 337 204
Loss for the period attributable to equity holders of the parent
(302) (2,600)
Analysed as:
Underlying loss for the period attributable to equity holders of the parent
(302) (2,204)
Exceptional salary costs 4 - (396)
Other comprehensive income
Foreign exchange translation differences on foreign operations
(133) (255)
Total comprehensive loss for the year attributable to equity holders of the parent
(435)
(2,855)
Basic loss per share (cents) 8 (4.1) (34.9)
Diluted loss per share (cents) 8 (4.1) (34.9)
Adjusted loss per share (cents) 8 (4.1) (29.6)
Consolidated Balance Sheet
As at 31 December 2018
Note
2018
$’000
2017 Restated*
$’000
Non-current assets
Property, plant and equipment 9 989 1,504
Intangible assets 10 352 352
Deferred tax 12 1,732 1,846
Total non-current assets 3,073 3,702
Current assets
Inventories 13 8,011 8,936
Trade and other receivables 14 14,691 13,100
Cash and cash equivalents 15 2,024 2,574
Total current assets 24,726 24,610
Total assets 27,799 28,312
Current liabilities Trade and other payables 16 9,188 10,081
Provisions 17 138 138
Total current liabilities 9,326 10,219
Non-current liabilities
Provisions 17 45 45
Other non-current liabilities 18 1,932 1,117
Total non-current liabilities 1,977 1,162
Total liabilities 11,303 11,381
Net assets 16,496 16,931
Equity
Called up share capital 19 120 120
Share premium account 19 2,684 2,684
Other reserve 19 8,080 8,080
Translation reserve 19 (729) (596)
Treasury/own share reserve 19 (268) (268)
Profit and loss account
6,609 6,911
Total equity attributable to equity holders of the parent 16,496 16,931
Statement of changes in equity
For the year ended 31 December 2018
Group
Share capital
Share premiu
m
Other reserv
e
Treasury / own share
reserve
Translation
reserve
Retained
earnings
Total equity
$’000 $’000 $’000 $’000 $’000 $’000 $’000
Balance at 31 December 2016 120 2,684 8,080 - (341) 9,243 19,786
Total comprehensive income
Loss for the year - - - - - (2,600) (2,600)
Difference on translation - - - - (255) - (255)
Total comprehensive income - - - - (255) (2,600) (2,855)
Transactions with the owners of the Company
Equity-settled transactions, including deferred tax effect
- - - - - - -
Purchase of own shares - - - (268) - 268 -
Dividends paid to equity holders - - - - - - -
Total transactions with the owners of the Company
- - - (268) - 268 -
Balance at 31 December 2017 120 2,684 8,080 (268) (596) 6,911 16,931
Total comprehensive income
Loss for the year - - - - - (302) (302)
Difference on translation - - - - (133) - (133)
Total comprehensive income - - - - (133) (302) (435)
Transactions with the owners of the Company
Equity-settled transactions, including deferred tax effect
- - - - - - -
Purchase of own shares - - - - - - -
Dividends paid to equity holders - - - - - - -
Total transactions with the owners of the Company
- - - - - - -
Balance at 31 December 2018 120 2,684 8,080 (268) (729) 6,609 16,496
Consolidated statement of cash flows
For the year ended 31 December 2018
2018
$’000
2017 Restated*
$’000
Cash flows from operating activities
Loss for the year (302) (2,600)
Adjusted for:
Depreciation and amortisation 886 850
Financial income (1) (12)
Share based payment expense 25 36
Foreign exchange loss/(gain) 206 (281)
Loss on disposal of fixed assets 37 104
Income tax credit (337) (204)
Decrease/(increase) in inventories 925 (864)
Increase in trade and other receivables (1,591) (328)
(Decrease)/increase in trade and other payables (78) 1,797
Cash generated absorbed by operations (230) (1,502)
Income taxes repaid 228 179
Net cash outflow from operating activities (2) (1,323)
Cash flows from investing activities
Interest received 1 12
Acquisition of property, plant and equipment (275) (1,139)
Acquisition of intangible assets (133) (414)
Proceeds from the sale of fixed assets - 28
Net cash outflow from investing activities (407) (1,513)
Cash flows from financing activities
Purchase of own shares - (268)
Finance lease payments (19) (18)
Dividends paid - (289)
Net cash outflow from financing activities (19) (575)
Net decrease in cash and cash equivalents (428) (3,411)
Cash and cash equivalents at 1 January 2,574 6,203
Effect of exchange rate fluctuations on cash held (122) (218)
Cash and cash equivalents at 31 December 2,024 2,574
Notes to the consolidated financial statements
1. Significant accounting policies
IndigoVision Group plc (the “Company”) is a company domiciled and registered in Scotland. The consolidated financial statements of the Company for the year ended 31 December 2018 comprise those of the Company and its subsidiaries (together referred to as the “Group”).
The address of its registered office is: Charles Darwin House The Edinburgh Technopole Milton Bridge Edinburgh Midlothian EH26 0PY
The financial statements were authorised for issue by the directors on 6 March 2019.
(a) Statement of compliance
Both the Company financial statements and the Group financial statements have been prepared and approved by the Directors in accordance with International Financial Reporting Standards as adopted by the EU (“Adopted IFRSs”). On publishing the Company financial statements here together with the Group financial statements, the Company is taking advantage of the exemption in s408 of the Companies Act 2006 not to present its individual income statement and related notes that form a part of these approved financial statements.
(b) New Accounting Standards and Interpretations adopted
The Group has adopted all of the new or amended Accounting Standards and Interpretations issued by the International Accounting Standards Board ('IASB') that are mandatory for the current reporting period.
Any new or amended Accounting Standards or Interpretations that are not yet mandatory have not been early adopted.
The following Accounting Standards and Interpretations are most relevant to the consolidated entity:
(i) IFRS 9 Financial Instruments
The Group has adopted IFRS 9 from 1 January 2018. The standard introduced new classification and measurement models for financial assets. A financial asset shall be measured at amortised cost if it is held within a business model whose objective is to hold assets in order to collect contractual cash flows which arise on specified dates and that are solely principal and interest. A debt investment shall be measured at fair value through other comprehensive income if it is held within a business model whose objective is to both hold assets in order to collect contractual cash flows which arise on specified dates that are solely principal and interest as well as selling the asset on the basis of its fair value. All other financial assets are classified and measured at fair value through profit or loss unless the entity makes an irrevocable election on initial recognition to present gains and losses on equity instruments (that are not held-for-trading or contingent consideration recognised in a business combination) in other comprehensive income ('OCI'). Despite these requirements, a financial asset may be irrevocably designated as measured at fair value through profit or loss to reduce the effect of, or eliminate, an accounting mismatch. For financial liabilities designated at fair value through profit or loss, the standard requires the portion of the change in fair value that relates to the entity's own credit risk to be presented in OCI (unless it would create an accounting mismatch). New simpler hedge accounting requirements are intended to more closely align the accounting treatment with the risk management activities of the entity. New impairment requirements use an 'expected credit loss' ('ECL') model to recognise an allowance. Impairment is measured using a 12-month ECL method unless the credit risk on a financial instrument has increased significantly since initial recognition in which case the lifetime ECL method is adopted. For receivables, a simplified approach to measuring expected credit losses using a lifetime expected loss allowance is available.
(ii) IFRS 15 Revenue from Contracts with Customers
The Group has adopted IFRS 15 from 1 January 2018. The standard provides a single comprehensive model for revenue recognition. The core principle of the standard is that an entity shall recognise revenue to depict the transfer of promised goods or services to customers at an amount that reflects the consideration to which the entity expects to be entitled in exchange for those goods or services. The standard introduced a new contract-based revenue recognition model with a measurement approach that is based on an allocation of the transaction price. This is described further in the accounting policies below.
Credit risk is presented separately as an expense rather than adjusted against revenue. Contracts with customers are presented in an entity's statement of financial position as a contract liability, a contract asset, or a receivable, depending on the relationship between the entity's performance and the customer's payment. Customer acquisition costs and costs to fulfil a contract can, subject to certain criteria, be capitalised as an asset and amortised over the contract period.
The impact on the financial performance and position of the Group from the adoption of these Accounting Standards is detailed in note 2.
(c) Basis of preparation
The financial statements are presented in US Dollars, rounded to the nearest thousand. They are prepared on the historical cost basis.
(i) Going concern
As part of its going concern review the Board has followed the guidelines published by the Financial Reporting Council entitled ‘Going Concern and Liquidity Risk Guidance for UK Companies 2009’. In determining the appropriate basis of preparing the financial statements, the Directors are required to consider whether the Company can continue in operational existence for the foreseeable future, being a period of not less than 12 months from the date of the approval of the financial statements. As at 31 December 2018 the Group had cash and cash equivalents of $2.0m and net current assets of $13.8m.
Management prepares detailed working capital forecasts which are reviewed by the Board on a regular basis. Cash flow forecasts and projections have been prepared through to December 2020 and take into account sensitivities on revenues and costs. Having made relevant and appropriate enquiries, including consideration of the Company’s and the Group’s current cash resources and the working capital forecasts, the Directors have a reasonable expectation that the Company and the Group will have adequate cash resources to continue to meet the requirements of the business for at least the next 12 months. Accordingly, the Board continues to adopt the going concern basis in preparing the financial statements.
(ii) Management judgement, estimates and assumptions
The preparation of financial statements in conformity with adopted IFRSs requires management to make judgements, estimates and assumptions that affect the application of policies and reported amounts of assets and liabilities, income and expenses. The estimates and associated assumptions are based on historical experience and various other factors that are believed to be reasonable under the circumstances, the results of
which form the basis of making the judgements about carrying values of assets and liabilities that are not readily apparent from other sources. Actual results may differ from these estimates.
The estimates and underlying assumptions are reviewed on an ongoing basis. Revisions to accounting estimates are recognised in the period in which the estimate is revised if the revision affects only that period or in the period of the revision and future periods if the revision affects both current and future periods.
Judgements made by management in the application of adopted IFRSs that have a significant effect on the financial statements and estimates with a significant risk of material adjustment in the next period are discussed in note 27.
The accounting policies set out below have been applied consistently to all periods presented in the consolidated financial statements.
(d) Basis of consolidation
(i) Subsidiaries
Subsidiaries are entities controlled by the Company. Control exists when the Company has the power to direct relevant activities. In assessing control, potential voting rights that presently are exercisable or convertible are taken into account. The financial statements of subsidiaries are included in the consolidated financial statements from the date that control commences until the date that control ceases. All subsidiaries are 100% controlled.
(ii) Transactions eliminated on consolidation
Intra-group balances, and income and expenses arising from intragroup transactions, are eliminated in preparing the consolidated financial statements. Exchange gains and losses on intra-group balances remain on consolidation.
(iii) Investments in subsidiaries
Investments by the Company in subsidiaries are carried at cost less provision for any impairment. The sterling value of the investments are translated to US dollars at the exchange rates ruling at the balance sheet date for presentation purposes in the Company financial statements.
(e) Foreign currency
(i) Functional currency
The Group’s earnings stream is primarily US dollars and the principal functional currency is the US dollar, being the most representative currency of the Group. The Group’s financial statements are therefore prepared in US dollars.
The exchange rates used in the preparation of the financial statements are stated in note 23.
(ii) Foreign currencies
Income statements of entities whose functional currency is not US dollars are translated into US dollars at average rates of exchange for the period and assets and liabilities are translated into US dollars at the rates of exchange ruling at the balance sheet date. Exchange differences arising on translation of net assets in such entities held at the beginning of the year, together with those differences resulting from the restatement of profits and losses from average to year end rates, are taken to the currency translation reserve.
In each individual entity, transactions in overseas currencies are translated into the relevant functional currency at the exchange rates ruling at the date of the transaction. Where more than one exchange rate is available, the appropriate rate at which assets can be readily realised and liabilities can be extinguished is used. Monetary assets and liabilities denominated in foreign currencies are retranslated at the exchange rates ruling at the balance sheet date. Any exchange differences are taken to the income statement.
(f) Property, plant and equipment
(i) Owned assets
Items of property, plant and equipment are stated at cost less accumulated depreciation (see below). Cost includes expenditure that is directly attributable to the acquisition of the asset.
Where parts of an item of property, plant and equipment have different useful lives, they are accounted for as separate items of property, plant and equipment.
(ii) Depreciation
Depreciation is charged to the income statement on a straight-line basis over the estimated useful life of each part of an item of property, plant and equipment. The estimated useful lives are as follows:
Fixtures and fittings 3 – 10 years
Plant and equipment 3 – 5 years
Computer hardware 3 years
Demonstration Equipment 2 years
The residual value and useful lives are reassessed annually.
(iii) Finance lease assets
Leases under which the Group assumes substantially all the risks and rewards of ownership of the leased asset are classified as finance leases. Leased assets acquired by way of finance lease are stated at an amount equal to the lower of their fair value and the present value of the minimum lease payments at inception of the lease, less accumulated depreciation and impairment losses. Lease payments are accounted for as described below.
(g) Intangible assets
(i) Research and development
Expenditure on research activities, undertaken with the prospect of gaining new scientific or technical knowledge and understanding, is recognised in the income statement as an expense as incurred.
An internally generated intangible asset arising from the Group’s product development is recognised only if all of the following conditions are met:
an asset is created that can be identified;
the project from which the asset arises meets the Group’s criteria for assessing technical feasibility;
it is probable that the asset created will generate future economic benefits; and
the development cost of the asset can be measured reliably.
Internally generated intangible assets are amortised on a straight line basis over their useful lives. Where no internally generated intangible asset can be recognised, development expenditure is recognised as an expense in the period in which it is incurred.
(ii) Computer software
Acquired computer software is capitalised on the basis of the costs incurred to acquire and bring into use the specific software. These costs are amortised using the straight line method over the software's estimated useful lives (one to three years). Costs associated with developing or maintaining computer software programmes are recognised as an expense as incurred.
(h) Trade and other receivables
Trade and other receivables are stated at their fair value as reduced by appropriate allowances for specific estimated irrecoverable amounts and a general provision, where necessary, following the adoption of IFRS 9.
(i) Inventories
Inventories are stated at the lower of cost and net realisable value. Net realisable value is the estimated selling price in the ordinary course of business, less the estimated costs of completion and selling expenses.
The cost of inventories is based on the average cost principle and is the expenditure incurred in acquiring the inventories and bringing them to their existing location and condition.
(j) Cash and cash equivalents
Cash and cash equivalents comprise cash balances and call deposits. Bank overdrafts or other short term debt facilities that are repayable on demand and form an integral part of the Group’s cash management are included as a component of cash and cash equivalents for the purpose of the statement of cash flows.
(k) Impairment
The carrying amounts of the Group’s assets, other than inventories (see accounting policy (i)), trade and other receivables (see accounting policy (h)) and deferred tax assets (see accounting policy (s)), are reviewed at each balance sheet date to determine whether there is any indication of impairment. If any such indication exists, the asset’s recoverable amount is estimated (see accounting policy (k(i))).
An impairment loss is recognised whenever the carrying amount of an asset exceeds its recoverable amount. Impairment losses are recognised in the income statement.
(i) Calculation of recoverable amount
The recoverable amount of assets is the greater of their fair value less costs to sell and value in use. In assessing fair value, the estimated future cash flows are discounted to their present value using a pre-tax discount rate that reflects current market assessments of the time value of money and the risks specific to the asset. For an asset that does not generate largely independent cash inflows, the recoverable amount is determined for the cash-generating unit to which the asset belongs.
(ii) Reversal of impairment
An impairment loss is reversed if there has been a positive change in the estimates used to determine the recoverable amount.
An impairment loss is reversed only to the extent that the asset’s carrying amount does not exceed the carrying amount that would have been determined, net of depreciation or amortisation, if no impairment loss had been recognised.
(l) Share capital
Ordinary shares are classified as equity. Incremental costs directly attributable to the issue of ordinary shares are shown in equity as a deduction from equity. Dividends are recognised as a liability in the period in which they are approved by the shareholders.
(m) Employee benefits
(i) Defined contribution pension plans
Obligations for contributions to defined contribution pension plans are recognised as an expense in the income statement as incurred.
(ii) Share-based payment transactions
The Group’s share option programme allows eligible employees to acquire shares in the Company. The fair value of options granted is measured at grant date and recognised as an expense with a corresponding increase in equity spread over the period during which the employees become unconditionally entitled to the options. The fair value is measured using the Black-Scholes option valuation model, taking into account the terms and conditions upon which the options were granted. The amount recognised as an expense is adjusted to reflect the number of share options for which the related service and non-market vesting conditions are expected to be met, such that the amount ultimately recognised as an expense is based on the number of share options that meet the related service and non-market performance conditions at the vesting date, except where forfeiture is only due to share prices not achieving the threshold for vesting.
The proceeds received net of any directly attributable expenses are credited to share capital and share premium when the options are exercised.
Where the Company grants share options to the employees of its subsidiaries, it recognises an increase in the cost of its investment in its subsidiaries equivalent to the equity settled share based payment charge in the consolidated financial statements. The corresponding credit is recognised in equity.
(iii) Long term incentive plans
The Company has established the IndigoVision Group plc 2008 and 2018 Long Term Incentive Plan (the LTIPs). All employees and executive directors of the Group are eligible to be granted awards. The grant date fair value of conditional shares and share option awards (including unitised awards under the 2018 LTIP) is recognised as an employee expense, with a corresponding increase in equity, over the period in which the employees become unconditionally entitled to the shares. The fair values of the awards are measured using a valuation model, taking into account the terms and conditions upon which the LTIPs were granted.
(iv) Share Incentive Plans
The Group has established a number of share incentive plans to enable all employees and sales agents to purchase or notionally purchase shares in the Company, as set out in note 22.
The Company matches each share purchased through the UK employee scheme on a 1:1 basis. The fair value of the free matching share is measured using the Black-Scholes option valuation model, taking into account the terms and conditions upon which the shares were granted. The fair value is spread over the three year vesting period.
(m) Employee benefits
The IndigoVision Inc 2010 Restricted Stock Unit Plan, the International Agents Incentive Plan and the International Employee’s Incentive Plan are cash settled plans. The Company matches each share notionally purchased through these schemes on a 1:1 basis. The Group accounts for the liability for the free notional share by marking to market at each financial period end.
(n) Employee share trusts
The Company has established a share trust, “The IndigoVision Group plc Employee Benefit Trust” which is separately administered and funded by loans from the Company. The Company recognises the assets and liabilities of the Trust in its own accounts.
(o) Provisions
A provision is recognised in the balance sheet when the Group has a present legal or constructive obligation as a result of a past event, and it is probable that an outflow of economic benefits will be required to settle the obligation.
A provision for warranties is recognised when the underlying products are sold. The provision is based on historical warranty data and a weighting of a range of possible outcomes against their associated probabilities.
(p) Trade and other payables
Trade and other payables are not interest bearing and are stated at their fair value.
(q) Revenue
Revenue comprises income from the sale of goods, income from technical support activities, income from the sales of software upgrade contracts for between one and five years in length, royalty income earned during the period, and excludes sales taxes.
(i) Product revenues
Revenue from the sale of goods is recognised in the income statement when the significant risks and rewards of ownership have been transferred to the buyer, in line with individual Incoterms®, which is normally when the goods have been despatched from the warehouse or are available for customer collection.
(ii) Technical support activities
Revenue from technical support activities is recognised on completion of the service.
(iii) Software upgrade contracts
Revenue from the sale of software upgrade contracts for between one and five years in length is deferred on the balance sheet and recognised in the income statement on a straight-line basis over the length of the contract.
(r) Expenses
(i) Operating lease payments
Payments made under operating leases are recognised in the income statement on a straight-line basis over the term of the lease.
(ii) Net financing income
Net financing income comprises interest payable on the bank overdraft facility and interest receivable on cash deposits.
(iii) Finance lease payments
Minimum lease payments are apportioned between the finance expense and the reduction of the outstanding liability. The finance expense is allocated to each period during the lease term so as to produce a constant periodic rate of interest on the remaining balance of the liability.
(s) Income tax
The tax expense represents the sum of the current taxes payable and deferred tax. Tax is recognised in the income statement except to the extent that it relates to items recognised directly in equity, in which case it is recognised in equity.
The current tax payable is based on taxable income for the period using tax rates that have been enacted or substantively enacted by the balance sheet date.
Deferred tax is the tax expected to be payable or recoverable on differences between the carrying amounts of assets and liabilities in the financial statements and the corresponding tax bases used in the computation of
taxable profit, and is accounted for using the balance sheet liability method. Deferred tax liabilities are generally recognised for all taxable temporary differences and deferred tax assets are recognised to the extent that it is probable that taxable profits will be available against which deductible temporary differences can be utilised within a reasonable period of time. The carrying amount of deferred tax assets is reviewed at each balance sheet date and reduced to the extent that it is no longer probable that sufficient taxable profits will be available to allow the asset recognised to be recovered within a reasonable period of time. Deferred tax is calculated using tax rates that are enacted or substantively enacted at the balance sheet date.
(t) Earnings per share
Basic earnings per share is calculated by dividing the profit and loss attributable to ordinary shareholders of the Company by the weighted average number of ordinary shares in issue during the period, excluding shares held by the Employee Benefit Trust and shares held in treasury, which are treated as cancelled. Diluted earnings per share is determined by adjusting the weighted average number of ordinary shares outstanding for the effects of potentially dilutive ordinary shares, which comprise share options granted.
(u) New standards and interpretations not yet adopted
The 2018 financial statements have been prepared in accordance with International Financial Reporting Standards (IFRSs) as adopted by the European Union.
The IASB and the IFRIC have also issued the following standards and interpretations with an effective date after the date of the financial statements:
New standards and Interpretations Endorsed but not yet Effective
1. IFRS 16 Leases (effective date 1 January 2019)
New standards and Interpretations not yet Endorsed and not yet Effective
IFRS 14 Regulatory Deferral Accounts IFRIC 23
Uncertainty over Income Tax Treatments (effective date 1 January 2019)
Amendments to IAS 28
Investments in Associates and Joint Ventures (effective date 1 January 2019)
A full assessment of the impact of the above standards and interpretations has yet to be made.
2. Restatement of comparatives
(a) Adoption of IFRS 9 'Financial Instruments' and IFRS 15 'Revenue from Contracts with Customers'
This note explains the impact of the adoption of IFRS 15 Revenue from Contracts with Customers on the Group’s financial statements.
The Group has adopted IFRS 15 Revenue from Contracts with Customers from 1 January 2018 which resulted in changes in accounting policies and adjustments to the amounts recognised in the financial statements. In accordance with the transition provisions in IFRS 15, the Group has adopted the new rules retrospectively and has restated comparatives for the 2017 financial year.
Consolidated statement of comprehensive income as
originally presented
31 December 2017
$000
IFRS 15
$000
Restated consolidated statement of
comprehensive income
31 December 2017
$000
Revenue 42,331 (231) 42,100
Cost of sales (19,558) 231 (19,327)
Balance sheet carrying amount
31 December 2017
$000
Restatement
$000
IFRS 15 carrying amount
1 January 2018
$000
Trade and other receivables 12,869 231 13,100
Trade and other payables (10,950) (231) (11,181)
The above adjustments were made to the amounts recognised in the consolidated statement of comprehensive income and balance sheet as at the date of initial application (1 January 2018) and are in relation to the deferral of warranty income and the related costs. The adjustments do not impact the 2017 year reported profits or net assets.
Following an assessment of two years of allowances and recovery of bad debts, any additional impairment
allowance relating to the IFRS 9 would be immaterial.
(b) Correction of misstatement relating to the Employee Benefit Trust (Company only)
The 2017 Company balance sheet has been restated to consolidate the assets of the Employee Benefit Trust,
removing loans to the Trust from related party debtors and offsetting the cost of shares held in the Trust
against reserves. This reduces debtors and reserves in 2017 by $708,000 and in 2016 by $647,000.
3. Segment reporting
The Board reviews the Group’s internal reporting in order to assess performance and to allocate resources. The Board assesses the performance of the following geographical sales regions: primarily Europe; Middle East and Africa; North America; Latin America; and Asia Pacific and has therefore determined these as the operating segments.
The Board considers the performance of the operating segments based on regional sales and Group-wide gross margin before warranty costs. The operating segments derive their revenue from the sale of software, hardware products and services. Capital is not allocated to geographical regions and substantially all of the Group’s income and expenditure is incurred by its UK trading subsidiary, IndigoVision Limited. The information currently provided to the Board is measured in a manner which is consistent with the financial statements.
Segment information is also presented in the respect of the Group’s products and services which have different economic characteristics, including the sale of end-to-end video security solutions, consultancy services and multi-year software upgrade plans.
Operating segments
Regional Sales 2018 $'000
Restated* 2017 $'000
Europe, Middle East and Africa 19,419 18,423
North America 13,149 12,174
Latin America 5,513 6,078
Asia Pacific 7,883 5,425
45,964 42,100
All sales are to third parties and all segment results are from continuing activities. The gross margin earned in each region is comparable and the majority of overheads are incurred centrally and are therefore unallocated to each region.
Revenues derived from external customers based in the UK were $6,421,000 (2017: $6,794,000).
Analysis of revenue
2018 $'000
2017 $'000
Revenues from:
Products/solutions 33,599 32,238
Support services 35 113
Software licences 8,989 6,808
Software Upgrade Contracts 3,341 2,941
45,964 42,100
4. Operating loss
2018
$’000 2017 $’000
Operating loss is stated after charging:
Depreciation and amortisation 886 850
Exceptional salary costs1 - 396
Foreign exchange loss/(gain) 206 (281)
(Recovery of)/allowance for doubtful trade receivables (234) 385
Net write down of inventories to realisable value 321 379
Research & development expenditure 3,311 3,090
Share based payment expense 25 36
Fees payable to the Group’s auditor:
Audit of the financial statements (Group and Company)
33 17
Audit of subsidiary companies
20 33
Tax compliance and advisory 35 9 All other services 17 3
1The exceptional salary costs relate to compensation and settlement payments made to the former CEO who
resigned on 23 November 2017.
5. Personnel expenses
Group
2018 $'000
2017 $'000
Wages and salaries 9,725 8,913
Compulsory social security contributions 833 878
Contributions to defined contribution pension plans 593 566
Equity-settled share based payment transactions 25 36
11,176 10,393
The figures above include the Directors’ remuneration, including compensation for loss of office, which is
disclosed separately in the Directors Remuneration Report.
Average number of employees, including Executive Directors and excluding retained agents, by activity
2018
Number
2017
Number
Selling and distribution 63 59
Research & Development 36 32
Administration 25 25
124 116
No personnel expenses are paid directly by the Company.
6. Net financing income
Group
2018 $'000
2017 $'000
Bank interest receivable - 10
Interest charged on accounts receivable 1 2
Net financial income 1 12
7. Income taxes
2018 $'000
2017 $'000
Current tax expense/(credit)
UK tax (336)
(236)
UK tax - prior year adjustment (127)
188
Overseas tax 10
12
Overseas tax – prior year adjustment 2 (9)
(451) (45)
Deferred tax expense/(credit)
Origination and reversal of temporary differences -
(180)
Reduction in tax rates -
21
Adjustments relating to prior year trading losses 114 -
114 (159)
Total income tax expense/(credit) in income statement (337) (204)
Recognised in the income statement
The Group trades principally through its UK subsidiary, IndigoVision Limited. The current tax credit relates to
research and development expenditure at 14.5%
The extent to which a deferred tax asset is recognised is dependent on estimates of future trading over an
extended period of time and the extent to which research and development costs may be eligible for research
and development tax credits in the future. The Group anticipates increasing its investment in research and
development proportional to sales growth.
Based on the Group’s trading assumptions the deferred tax asset is expected to begin being realised from
2020 onwards, when the Group starts to generate taxable profits and will be realised over a period of five
years. As a result, the deferred tax asset has been valued based upon a future UK Corporation tax rate of
17%.
The deferred tax asset is denominated in sterling and as such is subject to exchange rate fluctuations. Such
exchange rate movements are dealt with as part of the deferred tax income or expense for the year.
Reconciliation of effective tax rate 2018
2017
% $'000 % $'000
Loss before tax (639)
(2,804)
Income tax using the UK corporation tax rate 18.97 (121)
19.25 (540)
Other permanent differences (1.57) 10
0.18 (5)
Non-deductible expenses (12.70) 81
(1.18) 33
Fixed asset timing difference (0.78) 5
(0.14) 4
Deduction for R&D expenditure 68.00 (433)
3.99 (112)
Surrender of tax losses for R&D tax credit refund (17.40) 111
(6.38) 179
Deferred tax not recognised (20.69) 132
- -
Tax losses utilised 0.16 (1) - -
Adjustments to brought forward balances (1.88) 12
(0.78) 22
Adjust deferred tax to average rate of 19% (0.31) 2 - -
Prior year adjustment – current tax 19.91 (127)
(6.63) 186
Temporary difference not recognised in computation 2.66 (17) - -
Exchange difference arising on movement between opening and closing spot rates – current tax
- -
0.14 (4)
Overseas taxes credit (1.88) 12
(0.43) 12
Effect of tax rate change on deferred tax asset 0.47 (3) (0.75) 21
Total 52.96 (337) 17.97 (204)
At 31 December 2018 tax losses generated outside the UK available for offset against future profits, amounted
to approximately $1.7m (2017: $1.9m); using an income tax rate of 19.00% (2017: 19.25%) this is equivalent to
an asset of $0.3m (2017: $0.4m). However, due to continuing uncertainty over the timing of suitable profits and
the fact that such losses will eventually time expire, no asset is currently being recognised in the consolidated
financial statements in respect of such losses.
8. Earnings per share
2018 $'000
2017 $'000
Earnings per share
Loss for the year attributable to equity shareholders (basic and diluted)
(302) (2,600)
Exceptional compensation and settlement costs - 396
Adjusted loss for the year attributable to equity shareholders (302)
(2,204)
Cents Cents
Basic earnings per share (4.1) (34.9)
Diluted earnings per share (4.1) (34.9)
Adjusted earnings per share (4.1) (29.6)
The weighted average number of ordinary shares used in the calculation of basic and diluted earnings per
share for each period were calculated as follows:
2018 Number of
shares
2017 Number of
shares
Issued ordinary shares at start of year 7,610,756 7,610,756
Effect of purchase of own shares (229,238) (170,763)
Weighted average number of ordinary shares for the year – for earnings per share
7,381,518 7,439,993
Basic earnings per share
The calculation of basic earnings per share for the year ended 31 December 2018 was based on the loss
attributable to equity shareholders of $302,000 (2017 loss: $2,600,000) and a weighted average number of
ordinary shares during the year ending 31 December 2018 of 7,381,518 (2017: 7,439,993), calculated as
shown above.
Diluted earnings per share
The calculation of diluted earnings per share for the year ended 31 December 2018 was based on the loss
attributable to equity shareholders of $302,000 (2017 loss: $2,600,000) and a weighted average number of
ordinary shares during the year ending 31 December 2018 of 7,381,518 (2017: 7,439,993), calculated as
shown above.
Adjusted earnings per share
The calculation of adjusted earnings per share for the year ended 31 December 2018 was based on the loss
attributable to equity shareholders of $302,000 (2017 loss: $2,600,000), to which the exceptional
compensation/settlement costs of $nil (2017: $396,000) have been added back. A weighted average number
of ordinary shares during the year ending 31 December 2018 of 7,381,518 (2017: 7,439,993), calculated as
shown above. Adjusted earnings per share has been presented to reflect the one-off nature of the exceptional
salary costs incurred in 2017. The Board believes an adjusted earnings per share measure is required to
reflect its view of the underlying performance and to align more closely with management targets and rewards.
9. Property, plant and equipment
Group Plant and
equipment Fixtures and
fittings Computer hardware
Demo equipment Total
$'000 $'000 $'000 $'000 $'000
Cost At 31 December 2016 1,638 1,081 1,387 1,666 5,772
Additions 313 9 220 597 1,139
Disposals (28) - (2) (651) (681)
At 31 December 2017 1,923 1,090 1,605 1,612 6,230
Additions 91 1 86 97 275
Disposals - - - (64) (64)
At 31 December 2018 2,014 1,091 1,691 1,645 6,441
Depreciation At 31 December 2016 1,407 515 1,253 1,361 4,536
Depreciation charge for the period 189 118 103 357 767
Disposals (7) - (3) (567) (577)
At 31 December 2017 1,589 633 1,353 1,151 4,726
Depreciation charge for the year 175 113 110 355 753
Disposals - - - (27) (27)
At 31 December 2018 1,764 746 1,463 1,479 5,452
Net Book Value At 31 December 2016 231 566 134 305 1,236
At 31 December 2017 334 457 252 461 1,504
At 31 December 2018 250 345 228 166 989
Included in the net book value of computer hardware are assets held under finance leases of $17,000 (2017: $34,000) after charging depreciation of $17,000 (2017: $17,000). There was no property, plant and equipment held in the Company at 31 December 2018.
10. Intangible assets
Group
Intangible assets under Computer
Construction software Total
$'000 $'000 $’000
Cost At 31 December 2016 - 564 564
Additions - 414 414
Disposals - (19) (19)
At 31 December 2017 - 959 959
Additions (assets under construction) 133 - 133
Disposals - - -
At 31 December 2018 133 959 1,092
Amortisation and impairment losses
At 31 December 2016 - 542 542
Amortisation for the year - 84 84
Disposals - (19) (19)
At 31 December 2017 - 607 607
Amortisation for the year - 133 133
Disposals - - -
At 31 December 2018 - 740 740
Net book value
At 31 December 2016 - 22 22
At 31 December 2017 - 352 352
At 31 December 2018 133 219 352
There were no intangible assets held in the Company at 31 December 2018.
11. Investments in subsidiaries
Company
2018 $'000
2017 $'000
Cost
At start of period 2,337 2,135
Increase in respect of share based payments 25 36
Difference on translation (145) 166
At end of period 2,217 2,337
All subsidiaries Ownership
interest (direct)
Registered office address
Country of incorporation
2018 & 2017
%
IndigoVision Ltd Charles Darwin House, Edinburgh Technopole, Milton Bridge, Penicuik, Midlothian, EH26 0PY
Scotland 100
IndigoVision Inc 300 Broadacres Drive, 4th Floor, Unit 415, Bloomfield, NJ 07003 -3153, United States of America
IndigoVision Solucoes De Seguranca Eletronica Ltda.
Rua Cerro Cora, Numero 1.306, Vila Romana ,Sao Paulo, Brazil, 05061-200
Brazil
100
IndigoVision UK Ltd Condor House, 10 St Paul's Churchyard, London, EC4M 8AL
England & Wales
100
IndigoVision Australia Pty Ltd
Level 5, Deutsche Bank Place, 126 Phillip Street, Sydney, New South Wales, 2000
Australia
100
Indigo Vision Security System (Shanghai) Co., Ltd
Room 405, No. 553 Mao Tai Road, Chang Ning District, Shanghai, China, 200336 China
100
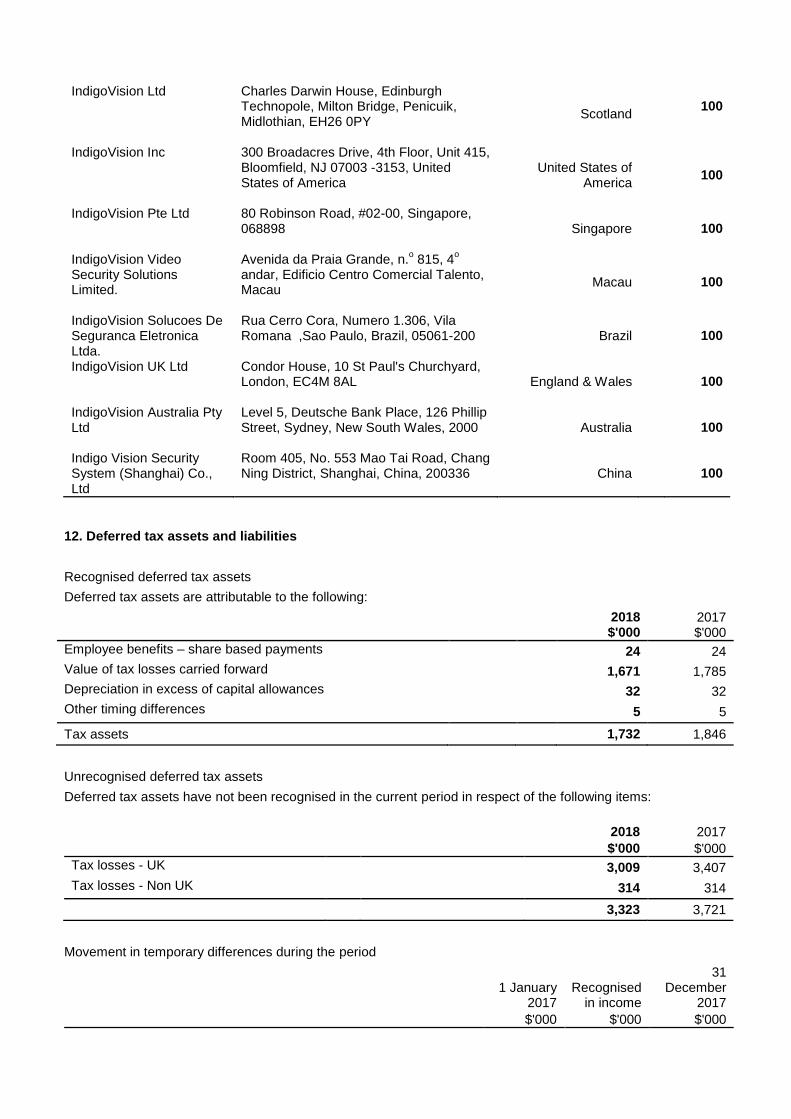
12. Deferred tax assets and liabilities
Recognised deferred tax assets
Deferred tax assets are attributable to the following:
2018 $'000
2017 $'000
Employee benefits – share based payments 24 24
Value of tax losses carried forward 1,671 1,785
Depreciation in excess of capital allowances 32 32
Other timing differences 5 5
Tax assets 1,732 1,846
Unrecognised deferred tax assets
Deferred tax assets have not been recognised in the current period in respect of the following items:
2018 2017
$'000 $'000
Tax losses - UK 3,009 3,407
Tax losses - Non UK 314 314
3,323 3,721
Movement in temporary differences during the period
1 January 2017
Recognised in income
31 December
2017
$'000 $'000 $'000
Employee benefits – share-based payments 24 - 24
Tax value of losses carried forward 1,626 159 1,785
Depreciation in excess of capital allowances 32 - 32
Other timing differences 5 - 5
1,687 159 1,846
1 January 2018
Recognised in
income
31 Decembe
r 2018
$'000 $'000 $'000
Employee benefits – share-based payments 24 - 24
Tax value of losses carried forward 1,785 (114) 1,671
Depreciation in excess of capital allowances 32 - 32
Other timing differences 5 - 5
1,846 (114) 1,732
13. Inventories
2018 2017
$'000 $'000
Raw materials and consumables 234 309
Finished goods 7,777 8,627
8,011 8,936
The write-down of inventories to net realisable value amounted to $321,000 (2017: $379,000). In the 12 month
period, raw material, consumables and changes to finished goods recognised as cost of sales amounted to
$19,423,000 (2017: $19,415,000).
14. Trade and other receivables
Group Company
2018 $'000
2017 $'000
2018 $'000
2017 $'000
Trade receivables 11,907 10,485
- -
Amounts due from subsidiary undertakings - -
1,637 1,478
Other receivables 2,165 1,843
16 -
Prepayments and accrued income 619 772
- -
14,691 13,100
1,653 1,478
The Group’s exposure to credit and currency risks and impairment losses related to trade and other
receivables are disclosed in note 23.
15. Cash and cash equivalents
Group
Company
2018 $'000
2017 $'000
2018 $'000
2017 $'000
Bank balances and cash and cash equivalents in the statement of cash flows
2,024 2,574
22 437
The Group’s exposure to interest rate risk is disclosed in note 23. The overdraft facility is secured by a floating
charge over the assets of the business.
16. Trade and other payables
Group Company
2018 $'000
2017 $'000
2018 $'000
2017 $'000
Trade payables 5,227 6,086
- -
Taxation and social security 235 395
- -
Finance lease assets: due with one year 13 19
- -
Other payables 180 740
39 -
Accruals 1,357 862 - -
Deferred income 2,176 1,979
- -
9,188 10,081
39 -
17. Provisions
Group product warranties 2018
$’000 2017 $’000
Balance at start of period 183 183
Provision made during the period 479 796
Provision used during the period (479) (796)
Balance at the end of the period 183 183
Non-current 45 45
Current 138 138
183 183
The provision relates to possible claims on products sold during the standard warranty period granted at the
point of sale. The provision has been based on analysis of product introductions and instances of actual goods
returned and is expected to be utilised within the next two years.
18. Other non-current liabilities
Group
2018 2017
$'000 $'000
Finance lease assets: due in more than one year - 14
Deferred income 1,600 1,100
Extended Warranty 329 -
International Agents Incentive plan 3 3
1,932 1,117
19. Capital and reserves
Ordinary shares
2018 2017
Number of shares Number of shares
In issue at start of period 7,610,756 7,610,756
Issued for cash on exercise of employee share options - -
In issue at end of period - fully paid 7,610,756 7,610,756
At 31 December 2018, the issued share capital comprised 7,610,756 ordinary shares (2017: 7,610,756) which
have a nominal value of 1 pence per share. All issued shares are fully paid.
The holders of ordinary shares are entitled to one vote per share at meetings of the Company and are entitled
to receive dividends as recommended by the Directors. The holders of ordinary shares also have an unlimited
right to share in the surplus remaining on winding up after all creditors are satisfied.
Share premium
The share premium arose primarily on 2 August 2000 when the Company was listed on the London Alternative
Investment Market.
Translation reserve
The translation reserve comprises all foreign exchange differences from the 1 August 2006, the IFRS transition
date, arising from the translation of the financial statements of the Company and subsidiaries where their
functional currency is different from the Group’s presentation currency.
Other reserve
The other reserve arose on the acquisition of IndigoVision Limited in 2000 prior to listing on the London Stock
Exchange when merger accounting, which was permitted under applicable accounting standards at that time,
was adopted. As this was before the date of transition to IFRS, advantage has been taken of the provisions of
IFRS1 such that the accounting for this business combination has not been restated.
Treasury/own shares reserve
The total number of shares held in Treasury at 31 December 2018 was 97,238 (2017: 97,238).
Employee Benefit Trust
Offset within the profit and loss account is an amount of $848,579 (2017: $848,579) representing the cost of
own shares held within the Employee Benefit Trust. The nominal value of own shares held is £1,320.
20. Finance Leases
Future lease payments are due as follows: 2018
Minimum lease
payments $'000
Interest $'000
Present
value $'000
Not later than one year 13 - 13
Between one year and five years - - -
Later than five years - - -
13 - 13
2017
Minimum lease
payments $'000
Interest $'000
Present
value $'000
Not later than one year 19 - 19
Between one year and five years 14 - 14
Later than five years - - -
33 - 33
21. Contingent Liabilities
HMRC Duty deferment
The Group has provided a bank guarantee of £60,000 in relation to UK duty deferment.
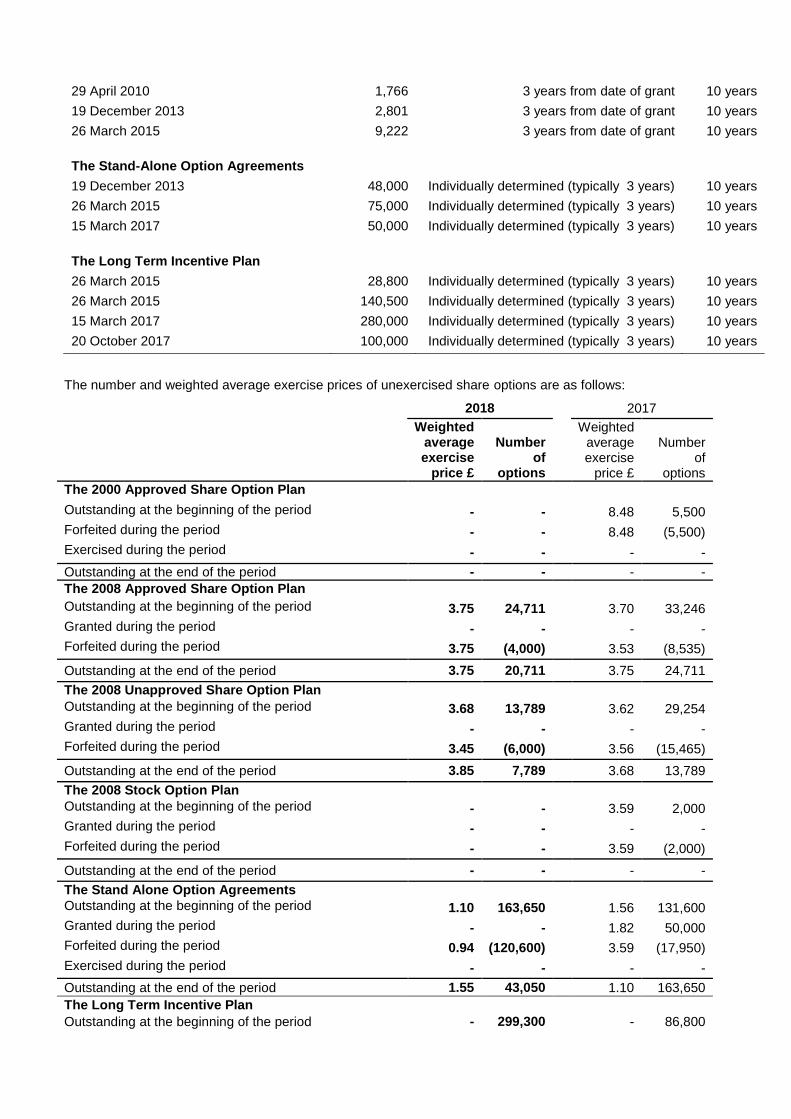
22. Share based payments
Share option schemes
The Company has established a number of share option schemes that entitle Directors, senior management
and other employees to purchase shares in the Company. Grants have been made of share options in the
period from 2000 to date.
The Tax Advantaged Share Option Schemes
The Company currently operates two tax advantaged, discretionary share options schemes: The 2008
Approved Share Option Scheme and the 2018 Company Share Option Scheme, with the latter being
introduced during the year to replace the former, which had reached the end of its ten year life.
During 2017, the Company also operated the now terminated 2000 Approved Share Option Scheme.
Under these plans (which are intended to satisfy certain legislative requirements) the Remuneration
Committee may grant selected eligible employees in the United Kingdom tax advantaged share options up to
certain specified statutory limits.
The Unapproved Share Option Schemes
The Company has two “unapproved” share option schemes (being arrangements that are not intended to
benefit from any particular tax advantages in the UK): The 2008 Unapproved Share Option Scheme and the
2018 Employee Share Option Scheme, with the latter being introduced during the year to replace the former,
which had reached the end of its ten year life.
Under these plans the remuneration committee may grant selected eligible employees options that exceed the
value limit of the HM Revenue and Customs tax advantaged share option plans. Options granted under this
scheme may be exercised between three and ten years from the grant date. The scheme is open to all
employees.
Stand-Alone Option Agreements
The Remuneration Committee has sole discretion to grant share options through stand-alone option
agreements to sales agents or other consultants or advisors to the Group. The Remuneration Committee can
determine the terms and conditions that apply to each agreement.
The Long Term Incentive Plan (LTIP) 2008
On 3 June 2008, the Company established the IndigoVision Group plc 2008 Long Term Incentive Plan. This
plan is intended to award share options and/or conditional share awards to selected employees of the Group.
The Share Incentive Plan 2010 (SIP)
On 10 August 2010, the Company established the IndigoVision Group plc Share Incentive Plan 2010, which is
approved by HM Revenue and Customs and open to all employees in the United Kingdom. Under the HM
Revenue & Customs approved limits, employees may purchase from a minimum of £10 to a maximum of £150
worth of shares per month by means of a deduction made from gross pay. The Company matches each share
purchased by employees on a 1:1 basis. Employees may redeem their shares at anytime; however, if this is
before the third anniversary of the purchase, the Company’s matching shares will be forfeited. The SIP
scheme is administered by the Yorkshire Building Society.
The Employee Benefit Trust
On 3 June 2008, in connection with establishing the Long Term Incentive Plan, the Company established the
IndigoVision Group plc Employee Benefit Trust for the purpose of encouraging and facilitating the acquisition
and holding of shares in the Company for the benefit of employees of the Group. As at 31 December 2018,
132,000 shares in the Company had been acquired by the Employee Benefit Trust.
The Long Term Incentive Plan (LTIP) 2018
On 24 October 2018, the Company established the IndigoVision Group plc 2018 Long Term Incentive Plan.
Under the New LTIP, selected individuals were given the opportunity to share in a proportion of a "pool" of
Ordinary Shares that is equal to 20% of the Company’s entire issued share capital.
The amount of this pool that is actually distributed amongst participants is entirely dependent on the level of
earnings per share ("EPS") that the Company delivers in its 2021 financial year. In particular:
the whole of the pool will be available for distribution to participants if the 2021 EPS figure is equal to or greater than $1.00;
for EPS of $0.20 or less, no part of the pool will be distributed (and all awards will immediately lapse); and
for performance between these two levels, the amount of the pool available to participants will be calculated by reference to a sliding scale (from 0% to 100%) that is more heavily weighted towards superior performance levels.
The shares to which a participant in the 2018 LTIP becomes entitled following the assessment of the above
performance condition will be subject to further holding periods over the financial years ending 31 December
2022, 2023 and 2024. If the EPS in any of these subsequent years falls below the level delivered in 2021, a
portion of the participant’s award will immediately lapse and cease to exist.
On 21 November 2018, the following awards were made under the 2018 LTIP:
Number of units
Pedro Simoes 375
Chris Lea 375
Paul Theasby Chief Operating Officer 250
Share option plans
The terms and conditions of grants are as follows, whereby all options are settled by physical delivery of shares:
Grant date
Number of instruments
originally granted
Vesting conditions
Contractual life of
options
The 2008 Approved Share Option Plan
29 April 2010 3,234 3 years from date of grant 10 years
20 April 2012 3,000 3 years from date of grant 10 years
9 January 2013 3,000 3 years from date of grant 10 years
19 December 2013 7,699 3 years from date of grant 10 years
26 March 2015 6,778 3 years from date of grant 10 years
The 2008 Share Option Plan
29 April 2010 1,766 3 years from date of grant 10 years
19 December 2013 2,801 3 years from date of grant 10 years
26 March 2015 9,222 3 years from date of grant 10 years
The Stand-Alone Option Agreements
19 December 2013 48,000 Individually determined (typically 3 years) 10 years
26 March 2015 75,000 Individually determined (typically 3 years) 10 years
15 March 2017 50,000 Individually determined (typically 3 years) 10 years
The Long Term Incentive Plan
26 March 2015 28,800 Individually determined (typically 3 years) 10 years
26 March 2015 140,500 Individually determined (typically 3 years) 10 years
15 March 2017 280,000 Individually determined (typically 3 years) 10 years
20 October 2017 100,000 Individually determined (typically 3 years) 10 years
The number and weighted average exercise prices of unexercised share options are as follows:
2018
2017
Weighted average exercise
price £
Number of
options
Weighted average exercise
price £
Number of
options
The 2000 Approved Share Option Plan
Outstanding at the beginning of the period - -
8.48 5,500
Forfeited during the period - -
8.48 (5,500)
Exercised during the period - - - -
Outstanding at the end of the period - - - -
The 2008 Approved Share Option Plan
Outstanding at the beginning of the period 3.75 24,711
3.70 33,246
Granted during the period - -
- -
Forfeited during the period 3.75 (4,000) 3.53 (8,535)
Outstanding at the end of the period 3.75 20,711 3.75 24,711
The 2008 Unapproved Share Option Plan
Outstanding at the beginning of the period 3.68 13,789
3.62 29,254
Granted during the period - -
- -
Forfeited during the period 3.45 (6,000) 3.56 (15,465)
Outstanding at the end of the period 3.85 7,789 3.68 13,789
The 2008 Stock Option Plan
Outstanding at the beginning of the period - -
3.59 2,000
Granted during the period - -
- -
Forfeited during the period - - 3.59 (2,000)
Outstanding at the end of the period - - - -
The Stand Alone Option Agreements
Outstanding at the beginning of the period 1.10 163,650
1.56 131,600
Granted during the period - -
1.82 50,000
Forfeited during the period 0.94 (120,600)
3.59 (17,950)
Exercised during the period - - - -
Outstanding at the end of the period 1.55 43,050 1.10 163,650
The Long Term Incentive Plan
Outstanding at the beginning of the period - 299,300 - 86,800
Granted during the period - - - 380,000
Forfeited during the period - (30,000) - (167,500)
Exercised during the period - - - -
Outstanding at the end of the period - 269,300 - 299,300
The weighted average share price at the date of exercise of share options exercised during the 12 month period was £ nil (2017: £nil) as no options were exercised.
The options outstanding at the period-end have an exercise price in the range of £0.01 to £5.00 (2017: £0.01 to £5.00) and a weighted average remaining contractual life of 3.9 years (2017: 6.3 years).
The options outstanding at 31 December 2018 have an exercise price in the ranges summarised below:
Exercise Price Range
Number of options
outstanding at 31 December
2018
Weighted average
remaining contractual life
(years)
£0.01- £3.44 35,000 2.7
£3.45 - £4.49 46,500 5.0
£4.50 - £5.00 5,000 1.3
86,500 3.9
The fair value of services received in return for share options is measured by reference to the fair value of
share options granted. The estimate of fair value of the services received is measured based on the Black-
Scholes model. The model has used an expected life of options of between 3.5 and 4 years, a risk free
discount rate of between 1.19% and 5.75% and historical share price volatility at the date of grant range of
between 33% and 72.2%.
The total charge recognised for the period arising from share based payments was $25,000 (2017: $36,000).
Of this, $25,000 (2017: $36,000) arose from equity-settled share based payments.
Recognised in income statement 2018
$’000 2017 $’000
Share options granted in 2013 - 4
Share options granted in 2014 - 6
Share options granted in 2015 7 10
Share options granted in 2016 8 11
Share options granted in 2017 7 5
Share options granted in 2018 3 -
Total expense recognised as employee costs (note 5) 25 36
23. Financial instruments
The Group’s principal financial instruments as at 31 December 2018 consist of cash and cash equivalents
which are used to finance group operations together with trade receivables and trade payables which arise
directly from the Group’s operations.
During the periods ended 31 December 2018 and 31 December 2017, the Group did not use derivative
financial instruments to hedge its exposure to foreign exchange and interest rate risks arising from operational,
financing and investment activities. The Group does not hold or issue derivative financial instruments for
trading purposes.
The Group is exposed to credit risk, interest rate risk, foreign currency risk and liquidity risk during the normal
course of business.
Credit risk
At the balance sheet date there were no significant concentrations of credit risk. The exposure to credit risk is
mitigated by selling to a wide range of customers and, where necessary, obtaining payments in advance or
letters of credit. Credit evaluations are performed on all customers requiring credit. The Group establishes a
specific allowance for impairment if a loss is estimated in respect of trade and other receivables.
Counterparties for cash and short-term deposits are restricted to financial institutions with high credit ratings.
The maximum exposure to credit risk is represented by the carrying amount of each financial asset in the
balance sheet. As at the reporting date, the maximum exposure to credit risk was:
Group Company
Note 2018 $'000
2017 $'000
2018 $'000
2017 $'000
Trade and other receivables 14 14,072 12,328
1,653 1,478
Cash and cash equivalents 15 2,024 2,574 22 437
16,096 14,902 1,675 1,915
The Company has limited exposure to trade receivables as receivable balances are due from group
companies and related parties.
The exposure to credit risk for trade receivables at the reporting date by geographical region was:
2018 2017
$'000 $'000
Europe, Middle East and Africa 5,354 5,868
North America 3,841 2,726
Latin America 2,284 1,868
Asia Pacific 1,634 1,512
13,113 11,974
Impairment losses
The aged profile of trade receivables at the reporting date was:
Gross Impairment
Gross Impairment
2018 $’000
2018 $’000
2017 $’000
2017 $’000
Not past due 6,529 -
6,817 -
0-30 days overdue 3,946 -
1,705 -
31-60 days overdue 774 -
656 -
More than 61 days overdue 1,864 (1,206) 2,796 (1,489)
13,113 (1,206) 11,974 (1,489)
The allowance in respect of trade receivables is used to record impairment losses unless the Group is satisfied
that no recovery of the outstanding amount is possible. At that point, the amount considered irrecoverable is
written off against the trade receivables directly. Based on past experience, the Group believes no further
impairment allowance is necessary in respect of trade receivables which are past due.
The movement in the allowance for impairment in respect of trade receivables during the period was as
follows:
2018 $'000
2017 $'000
Balance at start of period (1,489) (1,454)
Impairment recognised (109) (681)
Impairment released 300 296
Effect of movements in foreign exchange 92 350
Balance at end of period (1,206) (1,489)
Interest rate risk
The Group earns interest from cash and cash equivalents with high credit rated financial institutions and pays
interest on any bank overdraft balances. These are subject to interest rate movements.
Currency risk
The Group is exposed to foreign currency risk on sales, purchases, staff costs and sales agent costs that are
denominated in a currency other than US dollars. The currencies giving rise to this risk are primarily sterling,
euros and Canadian dollars.
The Group’s revenue is denominated in US dollars (approximately 61% (2017: 55%)), sterling (approximately
14% (2017: 16%)), euro (approximately 18% (2017: 20%)) and Canadian dollars 7% (2017: 9%). The majority
of the Group’s cost of sales is denominated in US dollars. The majority of the Group’s other operating
expenses are in sterling.
For monetary assets and liabilities held in currencies other than US dollars, the Group ensures that the net
exposure is kept to an acceptable level by buying and selling foreign currencies at spot rates where necessary
to address short-term balances.
The Group has investments in foreign operations whose net assets are exposed to currency translation risk.
Financial assets and financial liabilities by currency
Note 2018 2017
$'000 $'000
Sterling trade and other receivables 14 2,314 1,855
Euro trade and other receivables 14 2,009 3,012
Other currency trade and other receivables 14 695 1,527
Sterling cash and cash equivalents 15 305 92
Euro cash and cash equivalents 15 76 377
Other currency cash and cash equivalents 15 105 316
Sterling trade and other payables 16 & 18 (1,702) (2,183)
Other currency trade and other payables 16 & 18 (195) (766)
All of the Company’s financial assets and liabilities are denominated in sterling.
The following significant exchange rates applied during the period
Average rate
Period end rate
12 months ended 31
December 2018
12 months ended 31
December 2017
31
December 2018
31December 2017
US dollar to sterling 0.7489 0.7759 0.7882 0.7394
US dollar to euro 0.8465 0.8861 0.8755 0.8326
Liquidity risk
The Group’s exposure to liquidity risk is managed through the assessment of cash flow forecasts to ensure
that sufficient funds are available to meet liabilities as they fall due. At 31 December 2018, the Group had an
overdraft facility of $4.0m.This facility has recently been withdrawn by the Royal Bank of Scotland plc. As at 31
December 2018 the Group was not utilising the overdraft facility and had cash and cash equivalents of
$2,024,000 (31 December 2017: $2,574,000). The Group does not have any interest bearing liabilities due
after more than one year as the finance lease is interest free.
The Group meets its day to day working capital requirements from operating cash flows and has not utilised
the overdraft within the last two years.
The following are the contractual undiscounted cash flow maturities of financial liabilities.
As at 31 December 2018 Carrying Contractual 6
months 6 – 12 1 – 2 2 – 5
Group amount cash flow or less months years years
$'000 $'000 $'000 $'000 $'000 $'000
Non-derivative financial liabilities
Trade and other payables 5,642 5,642 5,642 - - -
Finance lease assets 13 - 9 4 - -
5,655 5,655 9 4 - -
Capital management
The Board’s policy is to maintain a strong capital base so as to maintain investor, creditor and market
confidence and to sustain future development of the business. The capital structure of the Group consists of
cash and cash equivalents and equity attributable to equity holders of the parent, comprising issued share
capital, reserves and retained earnings as disclosed in the Group statement of changes in equity. The Board
monitors return on capital, which the Group defines as profit before tax divided by total assets less current
liabilities.
Sensitivity analysis
In managing interest rate and currency risks the Group aims to reduce the impact of short-term fluctuations on
the Group’s earnings. Over the longer-term, however, permanent changes in foreign exchange and interest
rates would have an impact on consolidated earnings. Currently there is not considered to be any material risk
to the business on the basis of interest rate movements given the financial position of the Group.
It is estimated that a general increase of five percentage points in the value of sterling against the US dollar
would have decreased the Group’s profit before tax by approximately $0.4m for the year ended 31 December
2018 (2017: decrease of $0.3m) and a general increase of five percentage points in the value of the US dollar
against the euro would have increased the Group’s profit before tax by approximately $0.5m (2017: increase of
$0.4m).
Fair values
The carrying value of cash and cash equivalents, trade and other receivables, and trade and other payables is
deemed to reflect materially the fair value for both the Group and Company.
2018 2017
Group:
Carrying Amount
Fair Value
Carrying Amount Fair Value
$'000 $'000 $'000 $'000
Trade and other receivables 14,072 12,866 12,328 10,839
Cash and cash equivalents 2,024 2,024 2,574 2,574
Trade and other payables (5,642) (5,642) (7,221) (7,221)
10,454 9,248 7,681 6,192
2018 2017 Company:
Carrying Amount
Fair Value
Carrying Amount
Fair Value
$'000 $'000 $'000 $'000
Trade and other receivables 16 16 - -
Amounts due from subsidiary undertakings 1,637 1,637 1,478 1,478
Amounts due from other related parties
Cash and cash equivalents 22 22 437 437
Trade and other payables (39) (39) - -
1,636 1,636 1,915 1,915
24. Operating leases
Non-cancellable operating lease rentals are payable as follows.
2018 $'000
2017 $'000
Lease rentals due within:
Less than one year 599 582
Between one and five years 406 1,002
More than five years - -
1,005 1,584
During the year ended 31 December 2018, $640,000 was recognised as an expense in the income statement
in respect of operating leases (2017: $533,000).
The Group leases premises in the UK, USA, Canada, Brazil, China and Dubai under operating leases. The UK
head office lease expires in February 2021, the US lease expires April 2021 and the leases for all other
premises expire in November 2019 or earlier.
25. Capital commitments
As at 31 December 2018 the Group had no contracts to purchase property, plant and equipment (2017: $nil).
26. Related parties
Identity of related parties
The Group has a related party relationship with its subsidiaries (see note 11) and with its Directors.
Transactions with key management personnel
The board has defined key management personnel as the Directors of the Company.
During the year the Group paid $215,000 to Cooper Software Limited, a company of which George Elliott was
a director.
Directors of the Company and their immediate relatives control 2.34% of the voting shares of the Company.
Information regarding the Directors’ shareholdings and share options is contained in the Directors’ Report.
In addition to their salaries, the Group also contributes to a post-employment defined contribution plan on
behalf of the Executive Directors. The Executive Directors also participate in the Group’s share option
schemes. Details of the Directors’ remuneration are contained in the Directors’ report on page 11.
During the year employer National Insurance contributions of $86,000 were made in relation to Directors’
remuneration.
Transactions with subsidiaries
During the year the Company was charged a management fee of $216,000 (2017: $213,000) by its subsidiary
IndigoVision Limited.
During the year the Company charged interest on cash balances loaned to its subsidiary IndigoVision Limited
of $41,000 (2017: $40,000).
At the year end, IndigoVision Limited owed the Company $1,670,000, repayable on demand (2017:
$1,468,000).
During the year the Company received no dividend from its subsidiary, IndigoVision Limited (2017: $nil).
27. Accounting estimates and judgements
Management discussed with the audit committee the development, selection and disclosure of the Group’s
critical accounting policies and estimates and the application of these policies and estimates.
Warranty provision
The provision for warranties is estimated based on historical warranty data which typically ranges from 1% to
3% per annum and management judgement on estimated future returns given the operational activities during
the two year warranty period preceding the reporting date and the extent to which warranty costs can be
passed back to third party manufacturers. If actual project installations or product failure rates are less
favourable than those estimated by management or the costs associated with repair or replacement cannot be
passed back to the manufacturer, then warranty costs may exceed the provision made at the reporting date.
Deferred tax asset
Deferred tax assets and liabilities require management judgement in determining the amounts to be
recognised. In particular, judgement is used when assessing the extent to which deferred tax assets should be
recognised, with consideration given to the timing and level of future taxable income and the availability or
otherwise of research and development tax credits. As future taxable income is likely to deviate to some
degree from forecasts, the amount of the deferred tax asset carried needs to be reviewed in the light of such
variations.
Inventories
Inventories are stated at the lower of cost and net realisable value. Some items included in inventories are
written down to their net realisable value based on assumptions about future demand and market conditions. If
actual market conditions are less favourable than those projected by management, then inventory may require
to be written down by additional amounts. The assessment of whether an inventory write down is required is
dependent on the circumstances prevailing at the time of the assessment.
Trade receivables
Trade receivables require management judgements in determining the amounts recoverable. Trade
receivables are stated net of any provision for doubtful debts. The assessment of whether a receivable is
doubtful is dependent on the circumstances prevailing at the time of the assessment.
28. Availability of Report and Accounts
The report and accounts for the year ended 31 December 2018 will be posted to shareholders in due course,