REPORT DOCUMENTATION PAGE Form Approved OMBNo. 0704-0188 Public nooning burdw, for ft» collation of information i. ..«mated to avereg. 1 hour per rosponao. including ft. time for reviewing nrtucton mrchmg « M ^^^^^^^^^^S^i^ DÄ.»£ ' reviewing«» coH«tion of inforrmforu Send comwi« regarding ftii bunten orimoto or my oft« aspect of th. collection of information, including suggestion, far rjducing th. ^-* J^Ei^Ä^ ^ Inform.«!« Opera««, and Raport», 1215 Jifhnon Davii Highway, Suita 1204, Arlington, VA 22202-4302, and to fta Office of Management and Budget, Paperwork Reduction Proieet (0704-0188), Wnnngton, DC 20B03. | 1. AGENCY USE ONLY (leave blank/ REPORT DATE 7Jan.99 3. REPORT TYPE AND DATES COVERED DISSERTATION 4. TITLE AND SUBTITLE THE TI:SAPPHIRE RING LASER GYROSCOPE 6. AUTHOR(S) CAPT BOHN MATTHEW J 7. PERFORMING ORGANIZATION NAME(S) AND ADDRESS(ES) UNIVERSITY OF NEW MEXICO 9. SPONSORING/MONITORING AGENCY NAME(S) AND ADDRESS(ES) THE DEPARTMENT OF THE AIR FORCE AFIT/CIA, BLDG 125 2950 P STREET WPAFB OH 45433 11. SUPPLEMENTARY NOTES 5. FUNDING NUMBERS 8. PERFORMING ORGANIZATION REPORT NUMBER 10. SPONSORING/MONITORING AGENCY REPORT NUMBER FY99-7 12a. DISTRIBUTION AVAILABILITY STATEMENT Unlimited distribution In Accordance With AH 35-205/AFIT Sup 1 12b. DISTRIBUTION CODE 13. ABSTRACT (Maximum 200 words! 14. SUBJECT TERMS 17. SECURITY CLASSIFICATION OF REPORT 18. SECURITY CLASSIFICATION OF THIS PAGE 19. SECURITY CLASSIFICATION OF ABSTRACT 15. NUMBER OF PAGES 16. PRICE CODE 20. LIMITATION OF ABSTRACT Standard Form 298 (Rev. 2-89) (EG) Prescribed by ANSI Std.239.1B Designed using Perform Pro, WHS/DIOR, Oct 94
Transcript
REPORT DOCUMENTATION PAGE Form Approved
OMBNo. 0704-0188
Public nooning burdw, for ft» collation of information i. ..«mated to avereg. 1 hour per rosponao. including ft. time for reviewing nrtucton mrchmg «M^^^^^^^^^^S^i^ DÄ.»£ ' reviewing«» coH«tion of inforrmforu Send comwi« regarding ftii bunten orimoto or my oft« aspect of th. collection of information, including suggestion, far rjducing th. ^-* J^Ei^Ä^™ ^ Inform.«!« Opera««, and Raport», 1215 Jifhnon Davii Highway, Suita 1204, Arlington, VA 22202-4302, and to fta Office of Management and Budget, Paperwork Reduction Proieet (0704-0188), Wnnngton, DC 20B03. |
1. AGENCY USE ONLY (leave blank/ REPORT DATE
7Jan.99
3. REPORT TYPE AND DATES COVERED
DISSERTATION 4. TITLE AND SUBTITLE
THE TI:SAPPHIRE RING LASER GYROSCOPE
6. AUTHOR(S)
CAPT BOHN MATTHEW J
7. PERFORMING ORGANIZATION NAME(S) AND ADDRESS(ES)
UNIVERSITY OF NEW MEXICO
9. SPONSORING/MONITORING AGENCY NAME(S) AND ADDRESS(ES)
THE DEPARTMENT OF THE AIR FORCE AFIT/CIA, BLDG 125 2950 P STREET WPAFB OH 45433
11. SUPPLEMENTARY NOTES
5. FUNDING NUMBERS
8. PERFORMING ORGANIZATION REPORT NUMBER
10. SPONSORING/MONITORING AGENCY REPORT NUMBER
FY99-7
12a. DISTRIBUTION AVAILABILITY STATEMENT
Unlimited distribution In Accordance With AH 35-205/AFIT Sup 1
12b. DISTRIBUTION CODE
13. ABSTRACT (Maximum 200 words!
14. SUBJECT TERMS
17. SECURITY CLASSIFICATION OF REPORT
18. SECURITY CLASSIFICATION OF THIS PAGE
19. SECURITY CLASSIFICATION OF ABSTRACT
15. NUMBER OF PAGES
16. PRICE CODE
20. LIMITATION OF ABSTRACT
Standard Form 298 (Rev. 2-89) (EG) Prescribed by ANSI Std.239.1B Designed using Perform Pro, WHS/DIOR, Oct 94
The Tirsapphire Ring Laser Gyroscope
by
Matthew John Bohn
B.S., Physics, United States Air Force Academy, 1988 M.S., Physics, University of New Mexico, 1993
second-harmonic (TSSH) and sum-frequency generation (SFG) 104
3.29 Wave vectors involved in SFG (Sum Frequency Generation). The beams
are mixed in the intracavity ZnS crystal. The larger beams are the strong,
intracavity fundamental beams. The weaker solid beams are the surface
reflection of the fundamental. The dotted lines are the SFG beams 105
3.30 Spectra of CW and CCW surface second-harmonic and the spectrum of sum
frequency generated normal to the ZnS crystal 105
4.1 Tuning curve of signal wavelength as a function of pump wavelength for
noncritical phase matching in KTP 110
4.2 The cavity perimeter is 4 times the length of the pump cavity, which produces
two OPO pulses in the OPO cavity. The ROC of the curved mirrors is 10
cm concave. The curved mirrors are max-R at the signal wavelength and
high-T at the pump and idler wavelength Ill
4.3 The OPO cavity is twice as long as the pump cavity, therefore there will be
two pulses in the OPO cavity. ROC of curved mirrors is 10 cm concave.
The curved mirrors are max-R for the signal and high-T for the pump and
idler Ill
4.4 A 50/50 beamsplitter divides the pump pulse into two beams. The split
off beam is delayed such that the CW and CCW pulses meet only in air.
The radius of curvature of the curved mirrors is 10 cm concave. The curved
mirrors are max-R at the signal wavelength and high-T at the pump and
idler wavelengths 112
xvm
4.5 Similar to the double ring cavity in Figure 4.2. The second pulse is split off
and pumps the KTP crystal from the opposite direction. The advantage is
that the full pump pulse is used in each direction. The disadvantage is that
the cavity perimeter must be 4 times the cavity length of the pump 113
4.6 Bidirectional ring with modulated pump pulse. Every other pump pulse is
selected to pump sample. The OPO pump is split by a 50/50 beam splitter. 114
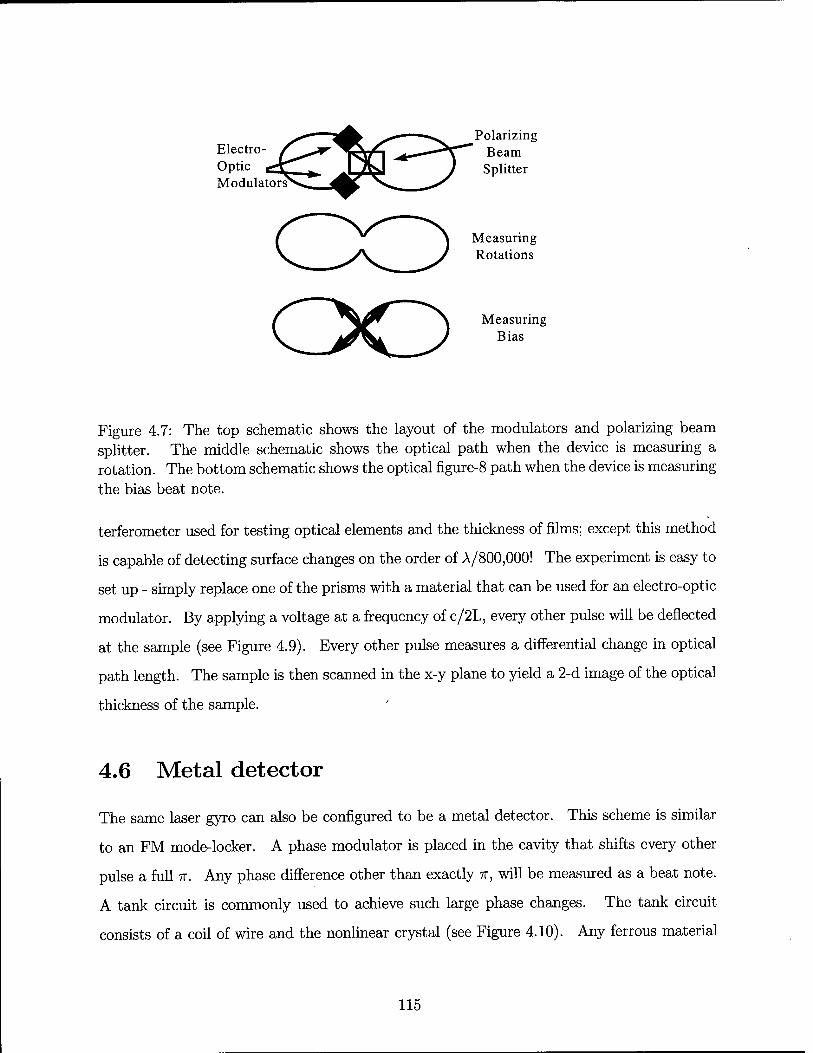
4.7 The top schematic shows the layout of the modulators and polarizing beam
splitter. The middle schematic shows the optical path when the device is
measuring a rotation. The bottom schematic shows the optical figure-8 path
when the device is measuring the bias beat note 115
4.8 End mirror of typical Ti:sapphire cavity is replaced with a concave mirror
which focuses the beam onto the semiconductor end mirror. The beams
must be focused to achieve the maximum modulation. The LÜO3 crystal
generates the second-harmonic. The LiTaC>3 is an electro-optic modulator. 116
4.9 Schematic for testing optical elements. Every other pulse is deflected at the
sample, yielding a differential measurement of its thickness 117
4.10 Schematic of a laser gyro metal detector. Any ferrous material that enters
the field emitted by the coil will be detected as a change in beat note. ... 118
4.11 The polarizing beam splitter separates the s and p polarizations. The s
polarization is injected back into the cavity. The modulator selects every
other pulse to be injected back into the cavity by switching the pulses between
s and p polarization 119
4.12 The intracavity beam is incident on the dove prism such that it is always
totally internally reflected. The modulator selects every other pulse out
of the Ti:sapphire laser. The LÜO3 crystal generates the second-harmonic.
The LiTaC>3 crystal is an electro-optic modulator 121
4.13 A) Linear cavity: no bias beat frequency. B) Saturable aborber mode-
locked ring gyro: measured low beat frequencies. C) Kerr-lens mode-
locked ring gyro: femtosecond pulses. D) Mutual Kerr-lens mode-locked:
all solid-state 122
Chapter 1
Introduction
Laser gyroscopes are a billion dollar [3] industry because of the demand for an accurate
rotation sensor in guided weapons, airplanes, submarines, automobiles, ships and satellites[4].
Other applications include the study of geophysical phenomena such as the wind, rain and
tides that can alter the rotation rate of the earth[5]. Sensitive gyroscopes can also be used
to detect earthquakes and other movements of the earth's surface[6, 7]. In addition to the
applications above, pulsed laser gyros can study nonreciprocal optical effects [8]. Pulsed laser
gyros are an area of research that has been largely unexplored. In the 60s the HeNe laser
was mode-locked to reduce the lock-in band, but was not very successful[9]. In the 70s the
Soviets studied the actively mode-locked Nd:YAG laser as a possible laser gyroscope[10, 11].
In the 90s the mode-locked ring dye laser [12, 13] and the diode laser[14] were studied
for the first time as possible gyro candidates. More recently solid-state lasers such as
Ti:sapphire, Cr:LiSAF and Cr:YAG have entered the arena with excellent stability, high
power and extremely short pulses.
The Tirsapphire laser is less noisy than a ring dye laser, it is easier to operate and is
also capable of producing sub-10 femtosecond (fs) pulses. Ti:sapphire can be pumped by
an Argon ion laser, which makes it simple and cheap to replace the gain medium in a CPM
ring dye laser with a Ti:sapphire crystal. The lifetime of Ti:sapphire differs from dyes by
about 3 orders of magnitude, and this difference has created many problems in building a
bidirectional femtosecond Ti:sapphire laser. These problems have resulted in new cavity
designs, several new methods of mode-locking and a new design of a pulsed gyro based on an
Optical Parametric Oscillator (OPO). The OPO design is extremely exciting and has the
potential to revolutionize the gyro industry. Because the OPO might be sensitive enough
to be used for gravity wave detection, it could very well pave the road toward a Nobel Prize.
.LiNbO
SF-14 Prisms
c Ti:Al20 Dye Jet
Figure 1.1: A) Linear cavity: no bias beat note. B) Saturable absorber mode-locked: low beat frequencies and low bandwidths. C) Kerr-lens mode-locked: femtosecond pulses. D) Mutual Kerr-lens mode-locked: solid-state.
The rest of Chapter 1 will fill in the background on ring lasers and short-pulsed lasers.
Chapter 2 will present a novel laser design that I like to call "The Linear Gyro" (see Figure
1.1A), and also some new experimental and analytic results on electro-optic dithering of a
laser gyro(see Figure LIB). The world's first Kerr-lens mode-locked femtosecond bidirec-
tional ring laser gyro (see Figure 1.1C) is presented in Chapter 3. Q-switched mode-locked
operation is obtained by using a concentrated dye solution and a two-photon absorber. A
novel method of mode-locking is introduced in Chapter 3 called mutual Kerr-lens mode-
locking, which generates CW and CCW pulses without a saturable absorber and is com-
pletely solid-state (see Figure LID). The Bidirectional Optical Parametric Oscillator(OPO)
Ring Gyro (or BORG) is an exciting design that is presented in Chapter 4. Numerous
applications of sensitive gyros are outlined in Chapter 4 entitled "Future Work." Chapter
4 also includes experiments that would make excellent follow-on projects for graduate-level
research. Chapter 4 concludes with failed experiments and a brief explanation about why
they did not work. This dissertation chronicles the advancement of pulsed ring laser gyros
from the dye laser into an all solid-state system.
1.1 Laser gyros
When a bidirectional ring laser is rotated in the clockwise (CW) direction, the clockwise
traveling wave will see a slightly longer cavity because the mirrors of the cavity are moving
away from the propagation direction. Likewise the counter-clockwise (CCW) wave will see
a slightly shorter cavity because the cavity mirrors are moving opposite to the propagation
vector. The slight change in cavity length (P for perimeter) will result in a slight shift in the
frequency (z/) of the laser. When the CW and CCW beams are combined on a detector, the
frequency difference (called the beat frequency AO) is measured. It is a trivial derivation,
but still worthwhile. The frequency of a laser is defined to be:
" = «£ (1-1)
where q is the number of half-wavelengths that "fit" into the laser cavity. A small change
in P results in a differential change in the frequency:
(1.2)
substituting in the definition of v.
u (1.3)
or:
Ai/ = ^p
Ai/ = -$*>
Au AP V P
(1.4)
Thus a small change in cavity length results in a large change in frequency because the
frequency difference is multiplied by the frequency of light. A small change is defined as
AP < — because a change of P greater than a quarter-wavelength would lead to ambiguous
results for a mode-locked system because the change in frequency would be closer to the
next longitudinal mode. The range AP could be extended to — if the ambiguity of sign
were removed from the beat note. Another way to arrive at this same result is to consider
that the repetition rate of the laser is -p, the Nyquist theorem states that the maximum
frequency that can be resolved is -£p. A beat frequency of ^ would correspond to a AP
of —. Since a quarter-wavelength is much, much smaller than the cavity length, the use of /it
differentials is well justified in the derivation above. The same derivation will also work for
any other interaction that will lead to a difference in optical path length for the CW and
CCW directions.
1.1.1 Bias
A bias beat note is a frequency difference that is caused by something other than a rotation.
If it cannot be properly compensated, it will lead to a source of error. Unlike the mode-
locked laser gyro that will be presented in the next section, there are few effects in the
continuous wave laser gyro that will lead to a bias beat note. This is a result of the light
being of low intensity and continuous and therefore lacking a large nonlinear drive.
Presnel drag is one way to obtain an artificial bias beat note. This was originally
discovered in the HeNe system because the electrical discharge imparts momentum to the
atoms and the unexcited atoms diffuse toward the cathode [15]. The electrical discharge
imparts a uniform distribution while the back-diffusion is parabolic, thus creating a net
velocity difference in the center of the tube. Presnel drag is demonstrated in a laser gyro
by simply using an air hose and blowing it along one of the arms of the laser. This effect is
a result of the velocity addition in special relativity[15, 16, 17, 18]. The phase velocity of
light in a moving medium is:
V=-± Vmedium ( 1 ? ) (1-5) n \ nl)
where the ± depends on whether the light is moving with or against the velocity of the
medium, VmediUm^ which leads to a frequency difference in a ring laser gyro of:
Afi = 2(n2 - l)Vmedium— (1.6)
where d is the length of the medium and P is the perimeter of the laser gyro. The change
in frequency observed in our laser was on the order of a few hundred Hz.
A Faraday rotator will also induce a difference in the optical path length. The setup
consists of a Faraday rotator separated by two quarter wave plates. The Faraday material
has a different refractive index for the left-hand circularly polarized light than for right-
hand circularly polarized light. This leads to a difference in optical path length for the two
beams. Since the two counter-propagating beams have different polarizations, they could be
spatially separated by using polarizing beam splitters. In fact, this bias has been analyzed
using spatially resolved eigenstates[19, 20].
1.1.2 Lock-in
For a laser gyro to work properly, the frequencies of the CW and CCW modes must be
independent of one another. Any coupling between the two will result in frequency pulling
and a reduction in the measured rotation rate. This coupling is similar to injection locking
where a small signal is injected into a free-running oscillator and causes the oscillator's
frequency to tune. If the scattering is severe enough or the frequency difference between
the CW and CCW modes is small enough, then the two modes can actually lock to one
another resulting in no measured beat frequency. This disastrous frequency range is called
the 'dead-band'.
Next we will derive the lock-in equation (Adler's equation) and analyze the beat fre-
quency as initially derived by Aronowitz[15], reworked by Dennis and Diels[21] and analyzed
by Stedman[22, 3]. Consider the two fields E\ and E2 corresponding to the CW and CCW
electric fields. A fraction of E2, r, is scattered into E\. Because of the phase difference
between E\ and E2, the addition must be done vectorally (see Figure 1.2). Since Ex must
meet the round-trip requirements of a laser, its phase must be adjusted by the amount a in
rE2sin((/r)
Figure 1.2: Vector change in Ei as a result of scattering from E2.
order to be self-consistent. Therefore the change in phase per round-trip is:
dtp . c —— = Aw = a— dt P
(1.7)
Where P is the perimeter of the laser and — is the round-trip time. From Figure 1.2 we see
that a — r-—sm(ip) for small values of a. Including a rotation rate, Q, with scale factor,
R yields:
Au = ^ = m - r§ sin(V0 (1.8)
A more complete derivation includes the phase of the scattered light, ß and the scattered
waves from both directions[23, 15, 24] as shown below:
dip dt
= R£l - £liock sm(tp + ß) (1.9)
(p P \ c — + — ) — is the frequency the laser will lock, r is the field scattering Ei E2J P
of one mode into the other, £q and Ei are the electric field amplitudes, 0 is the rotation
rate, R = —- is the scale factor and A is the area enclosed. The solution to the nonlinear Al
differential equation can be solved by integration:
/* = /
dip RQ - üiock sm{ip + ß)
(1.10)
—2 arctan(- ttiock- -ROtan(—-—)
t = ^R2n2 - afc
-) lock
^mw n2 s hock
(1.11)
tan (1>(t)+ß)* Viock + y/iew-autm (l^^-nLb) (1.12)
2 y i?o
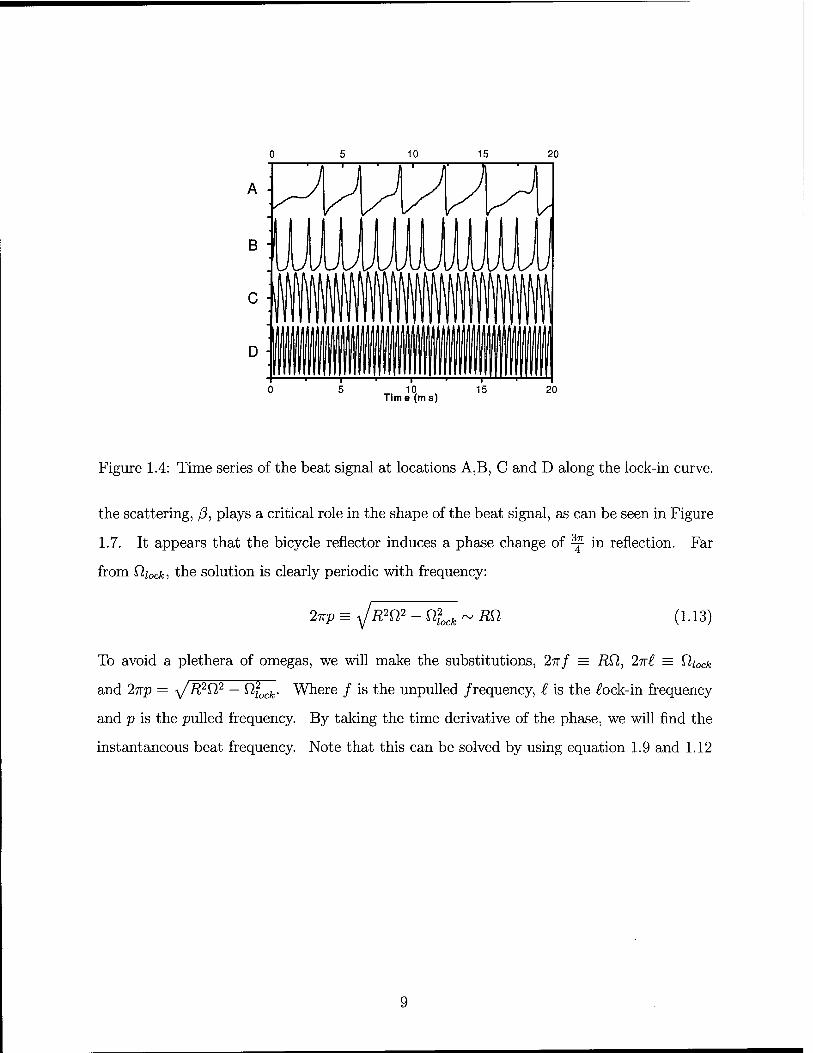
Figure 1.3 is a plot of the cosine of the phase ip (t) for four different rotation rates (A, B,
C and D) as defined in Figure 1.5. Note the good qualitative correspondence between the
theoretical plot in Figure 1.3 and the experimental results in Figure 1.4. Some experimental
A ■
6 8 10 12 14 16 18 20 Time (ms)
Figure 1.3: Theoretical plot of the beat signal as a function of time. The plots A, B, C and D correspond to data points on the experimental lock-in curve plotted in Figure 1.5.
results demonstrating lock-in are shown in Figure 1.5. The points labeled in Figure 1.5
correspond to the beat signals plotted in Figure 1.4. Notice the non-sinusoidal behavior
near lock-in. These data were taken using a Ti:sapphire laser mode-locked with an absorbing
dye jet (see Figure 1.6). A bicycle reflector was used to scatter a small portion of the CCW
beam into the CW and a LiNbC>3 modulator was used to simulate rotation. The phase of
A -
B -
C -
D
-T-
10 Time (ms)
Figure 1.4: Time series of the beat signal at locations A,B, C and D along the lock-in curve.
the scattering, ß, plays a critical role in the shape of the beat signal, as can be seen in Figure
1.7. It appears that the bicycle reflector induces a phase change of ^ in reflection. Far
from fliocki the solution is clearly periodic with frequency:
2np = y/wW - Qfock ~ RSI (1.13)
To avoid a plethera of omegas, we will make the substitutions, 2nf = RSI, 2n£ = fi/ocfc
and 27rp = ^jR2Vl2 — Vtfock. Where / is the unpulled /requency, £ is the ^ock-in frequency
and p is the pulled frequency. By taking the time derivative of the phase, we will find the
instantaneous beat frequency. Note that this can be solved by using equation 1.9 and 1.12
20-
1 i ■ i ■ i ■ i 1 1 1 1 1 1 1 1 1 1 1 1 1
o c CD
O" (D i_
LL
15- wr
01 10- s* Data:19Jan98LOK CD
GO
T3
5-
1 1 ' 1 ' 1
Model: sqrt(co2-co2|ock)
%2 = 0.01039 Ü O
_J
0-
B
A-# 1 i
(0,^ = 2.16 ±0.12 kHz look
i I i I i 1 i I > 1 i I i
0 2 4 6 8 10 12 14 16 18 20 22
Unlocked Beat Frequency (kHz)
Figure 1.5: Average beat frequency of the laser versus the effective rotation rate.
to yield the instantaneous frequency:
fp2 _L^t = f (t) = 2?r dt J0 KJ f2 + £2 cos (2irpt) + +£p sin (2irpt)
Mt) =
fo(t) =
hit) =
p>
f + £ If cos (2npt) + j sin (2npt)}
I f + £{cos (9) cos (2irpt) + sin (0) sin (2irpt)}
r f + £cos{9- 2-npt) f + £cos (2iry/f*=Pt - 9)
where cos (9) = — and sin (9) = —— = —
(1.14)
(1.15)
(1.16)
(1.17)
(1.18)
From equation 1.17, you can see that the frequency is not constant, but drifts from / +£ to
f—£. Near £ the beat frequency is less periodic and falls to zero at the lock-in frequency. To
calculate the mean frequency, we evaluate the first moment of the instantaneous frequency:
10
Ti:AI 2O3 Bicycle Reflector
Figure 1.6: Experimental setup for the lock-in experiments. A reflective tape was used to scatter part of the CW beam into the CCW beam.
</o)
</o>
</o>
</o>
</o>
V
dt
2 j_ r \ 27rJ_irf + £cos(t')
_i_ r p2
2irJ_nf + ecoS(t>)
dt'
dt'
V J-nf(l
1 + tan2 (|)
2TT J_n / (1 + tan2 (f)) + £ (l - tan2 (f)) dt'
Let y = tan (|):
27r7_w
sec 2 ft' (I) -*/ + *+(/-*)tan2(l)
7T^'
</o> = p'
t'=7T 1 27T (/ - £) h=-, [±A+V2
f-e y
dy
11
•vrwm ß =it/4
ß =7t/2
ß = 3JI/4
ß = 5TI/4
ß = 3JI/2
ß = 7K/4
JJDJJA
Figure 1.7: Plot of the beat signal as a function of time for 8 different values of ß, the scattering phase, in increments of 7r/4.
Apply the trigonometric substitution: cos 9 =
^
f+t f-t
y2+ f + t
yields:
</o> = r
*(f-t) f+t f-t
de
</o> - r
*(/-') lf + t
arctanf tan(-)
[T+t = Jp~Tp V
f-t \lf-e
Thus we see that the average frequency is less than the linear response, /. A detection
system that records the number of fringes will measure p and not /. The average beat
frequency, p, is plotted as a function of / in Figure 1.8. In a similar manner, we can
12
60
40
N
.* 20 - >* ü c r> CD U 13 er 0)
-20 4—1
CO
0Q -40
-60
1
1
'
1 ■*
' 1 ' 1 ' 1 ' 1 ' 1 ' y
y'
-'. \
Mean Frequency (p) Ideal Response (f) Upper Bound (f+l) Lower Bound (f-l)
i . i . i . t . i .
-50 -40 -30 -20-10 0 10 20 30 40 50
Rotation Rate (kHz)
Figure 1.8: The solid line is the mean frequency solution to the lock-in equation with Viiock = 10 kHz. The instantaneous frequency varies between the upper and lower bounds.
calculate the second moment:
</!> = 2T f2o{t)dt = fp
The standard deviation can be calculated:
° = }J(fZ) - </2>
VJP- PA
a = £
\ 1 + P = e
f \ i +
a ~ £
\
1
V2
This is the linewidth of the instantaneous frequency and simply demonstrates that the in-
stantaneous frequency varies from / + £ to f — £. This bandwidth does not effect the
bandwidth of the interferogram (the beat signal), which can be seen below, because the beat
13
signal can be written as a geometric series of complex exponentials similar to the solution
for a Fabry-Perot cavity. Regardless of the coupling the first term of the series will have a
Fourier component that is a delta function in frequency at the pulled frequency, p.
A Fourier series analysis of the instantaneous frequency yields Fourier coefficients that
follow a geometric progression[22]. Since the instantaneous frequency is purely even, we only
need to evaluate the cosine integral:
i r p2cosK) 71 " 7T.L/ +JcOB^r
= v r cosK) fr Jo l + }cos(tf)
Equation 3.163 from Gradshteyn and Ryzhik is:
I cos(nx) , 7T /\/l — a2 — 1 , v ' -dx = [a < 1, n > 0] 0 1 + a cos (z) \/l - a2 V a
Fn = ^(^jT-) =2prn (1.19)
i? _ = rn
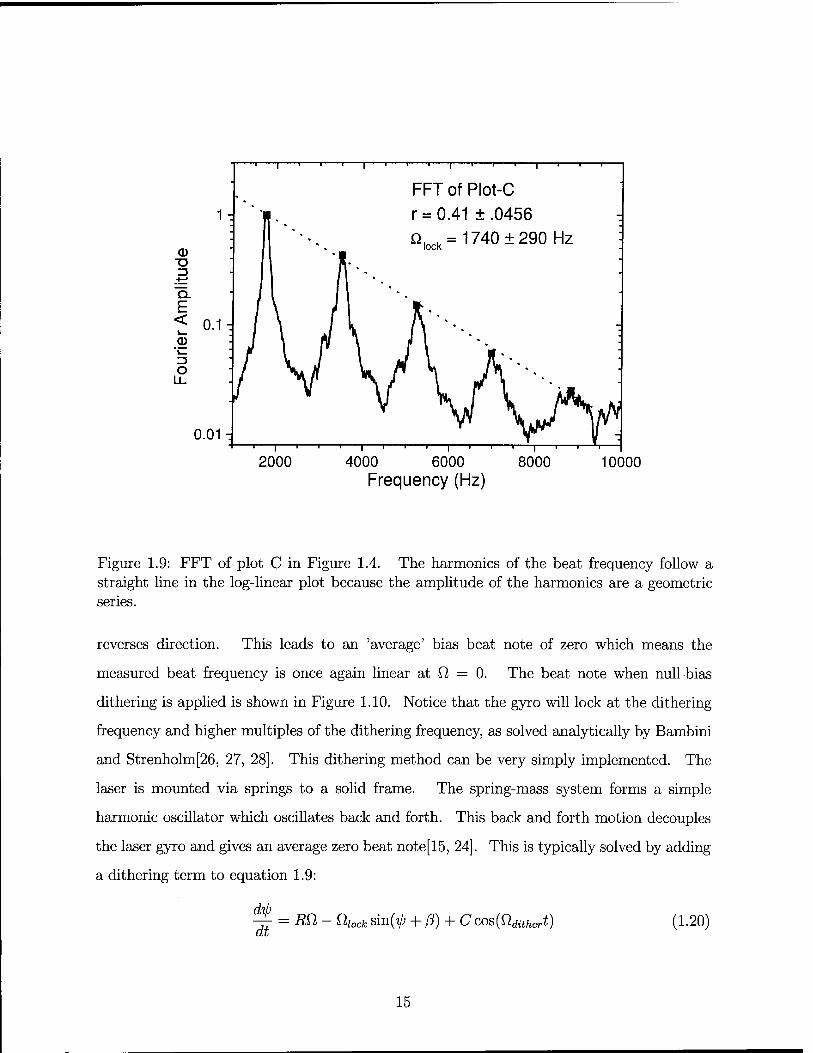
Equation 1.19 shows that the harmonics of the beat frequency will follow a geometric series.
A linear-log plot of the Fourier transform of the beat signal will follow a straight line, as can
be seen in Figure 1.9, a plot of the FFT of plot C of Figure 1.4. From the ratio, r, we can
determine the lock-in frequency, £ — j^s- In this example, r = .41 ± .046, which leads to
a lock-in frequency of £ = 1740 ± 290 Hz. This technique will be used to establish an upper
bound to the lock-in frequency in Chapters 2 and 3.
1.1.3 Dithering
One method to regain linear operation near O = 0 would be to simply apply a bias beat
note to the CW or CCW directions, as was first proposed by Killpatrick[25] in 1967. This
would avoid the AO = 0 region and would lead to a decoupled laser gyro. Although this
is how the decoupling is often described, this is not the most practical method. A more
practical method applies an equal, but opposite bias to each direction that periodically
14
0 ■Q
■i—*
Q. E <
13 O
0.01-
FFT of Plot-C r = 0.41 ± .0456 ß,ock=
1740±290Hz
2000 4000 6000 Frequency (Hz)
8000 10000
Figure 1.9: FFT of plot C in Figure 1.4. The harmonics of the beat frequency follow a straight line in the log-linear plot because the amplitude of the harmonics are a geometric series.
reverses direction. This leads to an 'average' bias beat note of zero which means the
measured beat frequency is once again linear at O = 0. The beat note when null-bias
dithering is applied is shown in Figure 1.10. Notice that the gyro will lock at the dithering
frequency and higher multiples of the dithering frequency, as solved analytically by Bambini
and Strenholm[26, 27, 28]. This dithering method can be very simply implemented. The
laser is mounted via springs to a solid frame. The spring-mass system forms a simple
harmonic oscillator which oscillates back and forth. This back and forth motion decouples
the laser gyro and gives an average zero beat note [15, 24]. This is typically solved by adding
a dithering term to equation 1.9:
— = RO, - Qiock sin(^ + ß) + Ccos(£ldithert) at
(1.20)
15
N X
Ü
<D
CT
CO
GO
100
- i ■ i —> 1— ■ i I
Actual Ideal
50 J *
J9 ■
0 -
-50 J * ~
■
-100 1 1 i . i l
-100 -50 0 50
Rotation Rate (kHz)
100
Figure 1.10: Frequency response of a dithered gyro. Nearly linear response is restored near zero; however, when flotation = mQdither, the laser will lock again.
This equation describes a direct modulation of the phase of the fields. With the substitution[28]
C J ^dither
into equation 1.20, the equation becomes:
Sin (fldithert) (1.21)
j f C1
— = RQ- ttiock sin I y + — sin (Qdithert) at V i Idither
(1.22)
Now the equation describes a phase modulation of the scatterer. A similar dithering of the
phase of the scatterer happens in the absorbing dye jet of a mode-locked ring dye laser and
explains why such a laser does not lock. The difference is that, in the case of an absorber dye
jet, the scattering is a random rather than harmonic modulation. With this substitution,
all of the theoretical calculations for dithering can also be applied to the case of the dye jet
which causes a random dithering of the phase of the scatterer.
Honeywell Corporation, in a private communication, uses a mechanical random dither
in their commercial laser gyros. The average value of the dither is designed to be zero,
similar to the null-bias dithering, in order to prevent a bias beat note. The randomness of
16
the dithering frequency restores linearity of the laser gyro at all frequencies. The design of a
ring laser gyro that is mechanically driven by random amounts is extremely difficult because
there will always be mechanical resonances. In addition, it is difficult to prevent a broad
spectrum of mechanical motion from exciting resonator modes. The random dither [29] and
quantum noise[30, 31] have both been solved analytically by the methods of the Cayley
matrix formulation, the Langevin equation, and infinite matrices; respectively.
A less reliable method to dither a ring laser gyro is to use the Faraday effect, also called
the magnetic mirror [32]. This method is less reliable because it is difficult to accurately
control the magnetic fields in the rotator.
The lock-in beat frequency is independent of the scale factor. Therefore, for a large
enough gyro, the rotation rate of the earth is in the 100 Hz range. If the internal scattering
can be reduced to |r|2 < 10~16, the earth's rotation can unlock the gyro. Of course it
is not possible to eliminate the gain medium, but the laser mirrors can be manufactured
to have low scattering. Super-mirrors with \r\2 < 10~18 were used at the University of
Canterbury in New Zealand in a large area (A~lm2) with excellent results[3]. Stedman
et al.[6, 33, 22, 34, 7] have reduced the coupling to the point that the rotation rate of the
earth is enough to decouple the CW and CCW modes. They have measured the earth's
rotation rate to within a bandwidth of 100 nHz. They have also been able to measure the
effect of tides on the earth's rotation rate and have measured earthquakes on the other side
of the world [5].
1.1.4 Optimizing the modulation frequency in a dithered laser
gyro
Because HeNe laser gyros depend on a mechanical method of dithering, there are mechanical
limitations to the modulation frequency. Because a pulsed laser gyro can be easily dithered
using an electro-optic modulator, it is simple to explore a large bandwidth of dithering
frequencies. In Chapter 2 the dithering of a pulsed laser gyro will be explored both experi-
mentally and theoretically. The results of these experiments have lead to some interesting
theoretical discoveries by using Fourier transforms. These results will be discussed in more
17
detail in Chapter 2.
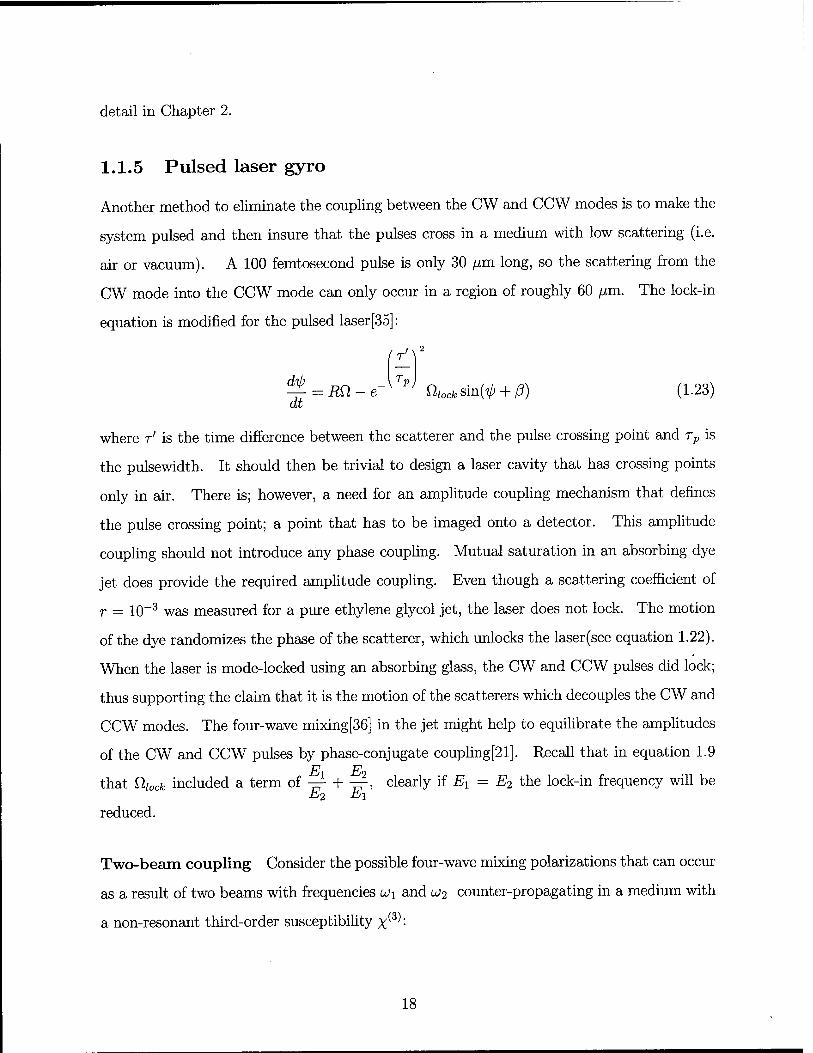
1.1.5 Pulsed laser gyro
Another method to eliminate the coupling between the CW and CCW modes is to make the
system pulsed and then insure that the pulses cross in a medium with low scattering (i.e.
air or vacuum). A 100 femtosecond pulse is only 30 /mi long, so the scattering from the
CW mode into the CCW mode can only occur in a region of roughly 60 /an. The lock-in
equation is modified for the pulsed laser [35]:
(r'Y ^ = i?ft-e-™ ülocksm(^ + ß) (1.23) at
where r' is the time difference between the scatterer and the pulse crossing point and rp is
the pulsewidth. It should then be trivial to design a laser cavity that has crossing points
only in air. There is; however, a need for an amplitude coupling mechanism that defines
the pulse crossing point; a point that has to be imaged onto a detector. This amplitude
coupling should not introduce any phase coupling. Mutual saturation in an absorbing dye
jet does provide the required amplitude coupling. Even though a scattering coefficient of
r = 10-3 was measured for a pure ethylene glycol jet, the laser does not lock. The motion
of the dye randomizes the phase of the scatterer, which unlocks the laser(see equation 1.22).
When the laser is mode-locked using an absorbing glass, the CW and CCW pulses did lock;
thus supporting the claim that it is the motion of the scatterers which decouples the CW and
CCW modes. The four-wave mixing[36] in the jet might help to equilibrate the amplitudes
of the CW and CCW pulses by phase-conjugate coupling[21]. Recall that in equation 1.9 TP JP
that Q,iock included a term of —- + -=r, clearly if Ex = E2 the lock-in frequency will be h/2 ti\
reduced.
Two-beam coupling Consider the possible four-wave mixing polarizations that can occur
as a result of two beams with frequencies u\ and u2 counter-propagating in a medium with
a non-resonant third-order susceptibility x^'-
18
P(Wl) = XW(3E1E*1+6E2E*2)E1 (1.24)
P(W2) = x(3> (6^1^ + 3^^) ^2 (1-25)
P(2a;1-a;2=a;1 + A) = 3x(3)^2* (L26)
P(2a;2-a;1=a;2-A) = 3X(3)^2
2^ (1-27)
A = u>i — a>2 (1.28)
P(3wi) = X(3)E? (1-29)
P(3wi) = x(3)S? (1-30)
Equations 1.29 and 1.30 are third-harmonic generation. Equations 1.24 and 1.25 are in-
tensity dependent changes in the index of refraction. And equations 1.26 and 1.27 are the
phase-conjugate scattering terms. Notice that the frequency is shifted and that the field is
conjugated. It can be shown that the two beams only couple power into one another if x(3)
is imaginary[37] and the only terms that contribute are 1.26 and 1.27. An imaginary x(3) is
a result of a finite response time of the medium. The finite response time will cause a slight
phase shift in the moving index grating with respect to the fields, Ex and E2. Equations
1.24 and 1.25 will be used in Chapter 3 in the discussion of mutual Kerr-lens mode-locking.
Although the pulsed laser gyro offers a unique solution to the lock-in problem, it also
creates additional problems such as an arbitrary bias beat note. This arbitrary bias is a
result of nonlinearities in the laser cavity. A simple example is to consider the cavity shown
in Figure 1.11. Note that the CW pulse is incident in the saturable absorber with intensity
al0 while the CCW pulse has intensity J0 at the saturable absorber. Since the saturable
absorber is an intensity dependent element, there will be a nonreciprocal effect because of
the different intensities. This is a simple example that could perhaps be corrected by a
judicious use of output coupling to compensate the different intensities. Perhaps a more
relevant example is the Kerr effect. Because of the Kerr effect, any difference in intensities
between the CW and CCW pulses will result in a bias beat note because the intensity
dependent index of refraction will result in a change in cavity length.
Although the randomizing of the phase of the scattering in the dye jet prevents lock-
in, the amplitude fluctuations in the laser is significantly worse than a solid-state laser. The
19
Figure 1.11: Schematic of ring laser with nonreciprocal intensities at the saturable absorber.
noise characteristics of a solid-state laser in comparison to an Argon ion-dye laser has been
well documented[38, 39, 40, 41]. The reason the solid-state laser is less noisy is because the
lifetime of the dye is about 1 ns and the lifetime of Ti:sapphire is 3 fj,s. The longer lifetime
integrates any fluctuations of the pump, in addition a solid-state pump laser is less noisy
than an Argon ion laser.
Because our group is interested in studying nonlinear intracavity effects using pump/probe
experiments, high output powers are required. Typically a dye laser is capable of only a few
milliwatts. For these reasons, the Ti:sapphire laser is the next logical step in the evolution
of the pulsed laser gyro. Before going on to discuss the Ti:sapphire laser in more detail, we
need to mention that there are at least two other solid-state laser gyros...
1.1.6 Other solid-state laser gyros
The competing technologies in the race for a practical solid-state ring laser gyro are diode
lasers and fiber lasers. The diode laser had problems with noise from the power supply[14].
Because diode lasers use gain switching to actively mode-lock the device, they required a very
good, fast power supply (see Figure 1.12). Christian and Rosker also report a nonreciprocal
response in the device, which is to be expected because of the direct relationship between
gain and index in semiconductors through the alpha parameter [42]. The smallest beat note
20
they were able to measure was 20 kHz. What was most disturbing about this ring laser
gyro was that the scale factor varied with alignment. They report that the scale factor
could vary from 20 kHz to 500 kHz depending on the alignment of the etalons. It would
be impossible to use such a device for a ring laser gyro unless they were able to fix the scale
factor.
To Spectrum
, i Analyzer
To fast photodiode
Delay Line Q
Figure 1.12: Laser diode ring gyroscope. The diodes are actively modelocked by gain switching. The R, S and P were used to induce coupling in the device.
The fiber laser shown in Figure 1.13 is a continuous wave laser that is decoupled
by frequency shifting the CW beam by 0.1 MHz to 12.5 MHz from the CCW beam[43].
What is remarkable about this ring laser gyro is the 100 Hz bandwidth. Their study was
inconclusive about how much dither needs to be applied to prevent lock-in. Nor did they
discuss the linearity of the device to rotation.
1.2 Soliton-like pulse shaping
In order to build a pulsed Ti:sapphire ring laser gyro, we also need to have a solid foundation
in short pulsed lasers. The soliton model is a good place to start, although for sub-10 fs
pulses its validity is currently in dispute[44, 45]. In the Ti:sapphire laser the most important
parameter to consider when making a femtosecond laser is the group velocity dispersion
(GVD). However, if you wish to build a sub-10 fs laser then you must also consider the
21
RRF PC-1 ra PC-2
50/50 coupler
WDM-1 Er-doped fiber r \S0/50 coupler
s WDM-2 i
LD r
•«-
\ u PC-3
-W-
01
PD W
Figure 1.13: The continuous wave fiber ring laser. The Faraday rotator in between the polarizers generates a bias beat note to prevent lock-in.
third and fourth order dispersion (TOD and FOD). The explanation for this is found in
the soliton model of a laser pulse. Because this model is paramount to understanding the
Ti:sapphire laser, a brief discussion is included.
1.2.1 Historical
In 1834, Scott-Russell recorded the first soliton wave:
"I was observing the motion of a boat which was rapidly drawn along a narrow
channel by a pair of horses, when the boat suddenly stopped—not so the mass
of water in the channel which it had put in motion; it accumulated round the
prow of the vessel in a state of violent agitation, then suddenly leaving it behind,
rolled forward with great velocity, assuming the form of a large solitary elevation,
a rounded, smooth and well-defined heap of water, which continued its course
along the channel apparently without change of form or diminution of speed. I
followed it on horseback, and overtook it still rolling on at a rate of some eight
or nine miles an hour, preserving its original figure some thirty feet long and a
foot to a foot and a half in height. Its height gradually diminished, and after a
chase of one or two miles I lost it in the windings of the channel. Such, in the
22
month of August 1834, was my first chance interview with that singular beautiful
phenomenon... ."
This colorful definition of a soliton is still accurate. A soliton is only loosely defined
by its two properties 1) a localized wave that does not change in shape or velocity, and 2)
the collision of two solitons will not change their shape or velocity [46]. Because the elements
of GVD and SPM are separated in the Ti:sapphire laser, the pulse shape varies throughout
the laser. Often the pulses in the Ti:sapphire laser are called 'soliton-like' because many of
their properties are determined by the soliton model even though they are not true solitons.
Optical fibers and ultra-short pulse lasers are two applications of soliton theory in
the optics and laser community. It was not until 1980 that Mollenauer et al.[47] discovered
solitons in optical fibers. Researchers are still designing the final components of the fiber
optic soliton communication system which includes: soliton routing switches[48], and digital
logic gates [49]. The application of the soliton model to ultra-short pulse Ti:sapphire lasers
will be the focus of the remainder of this discussion.
Several breakthroughs in the mid-1980s set the stage for ~10 femtosecond soliton
pulses: 1) Dye lasers solidified the soliton theory and how self-phase modulation and group
velocity dispersion must work together in the formation of ultra-short pulses [50, 51] 2) The
discovery of Ti:sapphire as a laser material with a gain bandwidth of 100 THz [52] and 3)
the discovery of negative group dispersion velocity in prism pairs [53]. By 1992 many groups
around the world have been producing femtosecond laser pulses and 'solitons' are becoming
a vernacular of the laser community[54, 55, 56, 57, 58, 59]. Today the Ti:sapphire laser is at
the limit of the soliton model that includes only group velocity dispersion (GVD) and self-
phase modulation (SPM). Higher order effects (i.e. third order dispersion (TOD) and fourth
order dispersion (FOD)) are becoming the limiting factor for ultra-short pulses in most lasers
[58, 60, 61, 62]. Although the current soliton model does not include these terms, it is my
opinion that theories will be developed to include these higher order effects[63, 61, 62, 64].
Since GVD and SPM are so crucial to soliton formation, let's take a look at GVD and SPM
before discussing the soliton model.
23
1.2.2 Theory: wave equation and group velocity dispersion
The wave equation can be developed from Maxwell's equations:
V^-I** = J-*? (1.31) c2 dt2 eQc
2 dt2 K '
Then the Classical Electronic Oscillator (CEO) model can be used to find the material
polarization (P). The polarization is related to material properties by: P = e0 (n2(uj) - 1) E
. The CEO model predicts Lorentzian-shaped absorption lines and roughly the derivative of
a Lorentzian for the index of refraction n(u). Figure 1.14 is a plot of the index of refraction
as a function of frequency near a resonance.
c o o CO
CD rr
X
c
Ultraviolet absorption
Frequency
Figure 1.14: Typical Lorentzian dispersion curve near a resonance. Most glasses have positive GVD in the visible-infrared region because of an ultraviolet absorption edge.
From the graph above we can see that dispersion is a function of frequency, which
means that the velocity (because v = ^ ) in this material is a function of frequency. If
a pulse of light is sent through a medium with negative dispersion, the lower frequency
components will travel slower than the high frequency components; thus causing the pulse
to spread. This effect is called Group Velocity Dispersion (GVD). Figure 1.15 demonstrates
pulse spreading in a medium with GVD [65].
Let's define GVD mathematically. Milonni and Eberly define the wavevector as 'k' but LÜ2
many publications (Siegman) also use '/?': k2 = n2(u)— = ß2. At any single frequency, 'k'
24
z=0 Dispersive medium
Figure 1.15: Broadening of a pulse in a dispersive medium.
will determine how the field propagates. If we are considering a distribution of frequencies
(a pulse by definition of the Fourier transform must contain many frequencies), then the
propagation of the fields will be a complicated function of frequency. To simplify the analysis,
we can Taylor expand the wavevector about the carrier frequency u0 :
Where, I, is the intensity I = %\A(z,t)\2. Finally we make the change in variables
A = (w - w0), substitute equation 1.47 into 1.46 and take the inverse Fourier transform,
T~ Mif^l _ in2I^Ä(z, A) - ik'AÄ(z, A) - i^-A2Ä(z, A) = 0 dz c £
(1.48)
The inverse Fourier transforms are:
T-1
A(z,A)
AÄ(z,A)
A2Ä(z,A)
= %-
A{z,t)
.8A(z,t) dt
d2A(z,t) dt2
(1.49)
(1.50)
(1.51)
Substitution of these inverse Fourier transforms yield:
U" P2 ^M _ in2I^A(z,t) + k'^AM+i^A^t) = 0
Next we make a Galilean Boost transformation and recall that I = %% \A(z,t)\
(1.52)
Boost
T = t-j-
ii Q2 8A(Z,T) .k" 8 .nn2wo
dz +iYöT2Ä{z>r) = i 2, \A(z,r)\2 A(z,r) (1.53)
Equation 1.53 is known as the nonlinear Schrödinger equation. This form is typically
found in the optics community, but it is not truly in the form of the nonlinear Schrödinger
equation. If the change in variables is done slightly differently, we can obtain the NLSE with
appropriately scaled wavefunctions:
29
r =
z
. V9
TO
£=|fc"L (L54) Tn
Where r0 is the pulse width and ip(£,, r) is the wave function.
.ÖV^r) + 1|^)T) + \^,r)\2^,r) = 0 (1.55)
The NLSE was originally solved by Zakharov and Shabat[68] in 1972. The solutions are
solitons in terms of the field envelope:
A--\ A(z,t) = Ao sech
V9
v T0 / k"
—i KZ
e 2ro (1.56)
2 -2nk" The coefficients are defined as: TQ = pulse width, |Ao| = , = amplitude of
envelope of electric field, vg = group velocity, and k" = group velocity dispersion. Note
for AQ to be real and positive, k" and n-i must be of opposite sign. Since n2 is positive for
Ti:sapphire, we require that k" be negative. The boost transformation simply puts us in the
reference frame of the pulse. You can imagine yourself riding on top of the soliton wave like
a surfer riding a tsunami. Thus we see that when SPM and GVD act together and their
coefficients obey n2 > 0 and k" < 0 ; there is a stable solution that does not spread in time
or frequency. Notice that the measurable quantity, intensity, goes as sech2(). This function
is often used in the literature to characterize ultra-short pulses. The coefficient n2 is positive
for Ti:sapphire, but k" is also positive! How do we achieve a negative value for GVD?
A revolutionary optical technique was developed by several groups [50, 53]. They
proposed and verified that by sequencing two prisms with positive GVD a net negative GVD
could be engineered, see Figure 1.18. This basic method for obtaining negative GVD is
used in almost all ultra-short pulse Ti:sapphire lasers. The experimental setup shown in
30
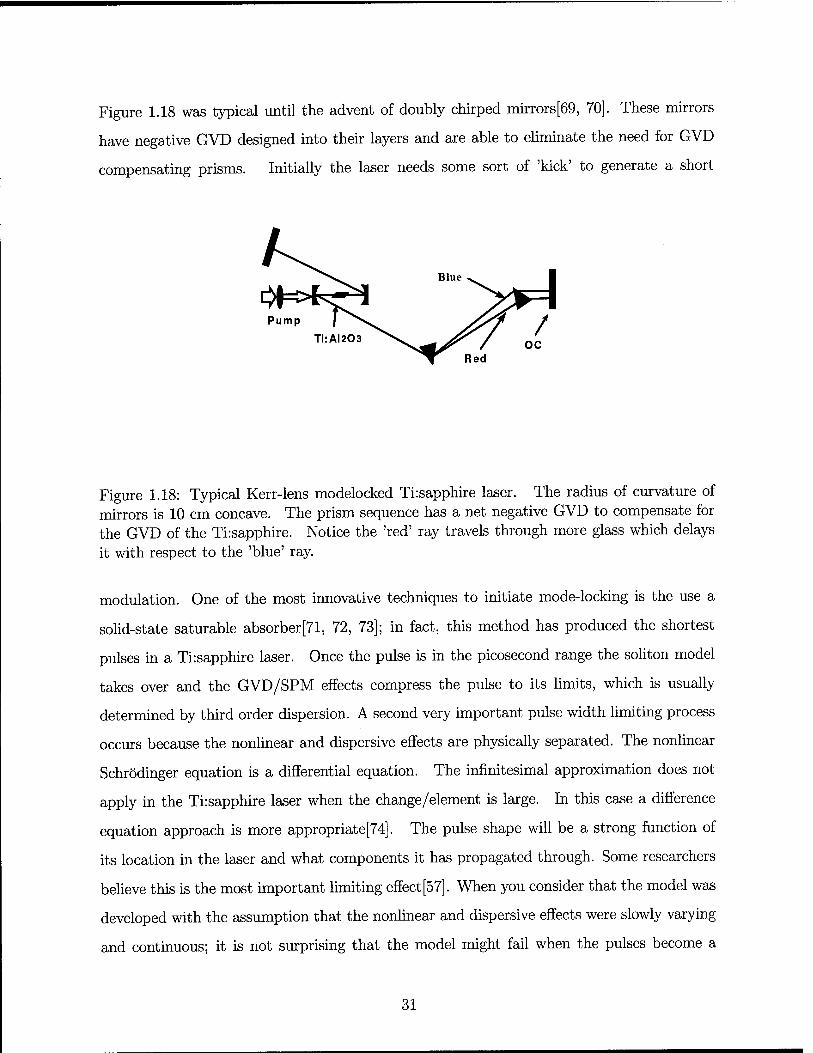
Figure 1.18 was typical until the advent of doubly chirped mirrors[69, 70]. These mirrors
have negative GVD designed into their layers and are able to eliminate the need for GVD
compensating prisms. Initially the laser needs some sort of 'kick' to generate a short
Pump Ti:Al203
Figure 1.18: Typical Kerr-lens modelocked Ti:sapphire laser. The radius of curvature of mirrors is 10 cm concave. The prism sequence has a net negative GVD to compensate for the GVD of the Ti:sapphire. Notice the 'red' ray travels through more glass which delays it with respect to the 'blue' ray.
modulation. One of the most innovative techniques to initiate mode-locking is the use a
solid-state saturable absorber[71, 72, 73]; in fact, this method has produced the shortest
pulses in a Ti:sapphire laser. Once the pulse is in the picosecond range the soliton model
takes over and the GVD/SPM effects compress the pulse to its limits, which is usually
determined by third order dispersion. A second very important pulse width limiting process
occurs because the nonlinear and dispersive effects are physically separated. The nonlinear
Schrödinger equation is a differential equation. The infinitesimal approximation does not
apply in the Ti:sapphire laser when the change/element is large. In this case a difference
equation approach is more appropriate [74]. The pulse shape will be a strong function of
its location in the laser and what components it has propagated through. Some researchers
believe this is the most important limiting effect [57]. When you consider that the model was
developed with the assumption that the nonlinear and dispersive effects were slowly varying
and continuous; it is not surprising that the model might fail when the pulses become a
31
few tens of femtoseconds in width. There have been some interesting experiments done to
demonstrate how the pulse changes as it propagates through the different components in
the laser[59, 60]. To conclude; we have seen how group velocity dispersion can compress
chirped pulses and how pulses can become chirped by a nonlinear medium. Finally we have
combined the two effects, and discovered the nonlinear Schrödinger equation. The nonlinear
Schrödinger equation was seen to have soliton solutions that do not decay or expand as they
propagate.
Kerr-lens mode-locking
Soliton-like pulse-shaping stabilizes a short pulse in a laser cavity, but what causes the
pulse-shortening? Typically a fast saturable absorber is needed for pulse shortening. In the
sub-picosecond region the possibilities are: Kerr-Lens mode-locking(KLM), Semiconductor
Pulse mode-locking(CPM). Of these only the first three can be used in Ti:sapphire. APM
is not stable because it requires an interferometer. SESAM requires specially made semi-
conductor materials that we are exploring, but as of yet these are unavailable. This leaves
KLM, which is by far the cheapest way to mode-lock a laser because it requires no additional
components. The Kerr-lens is the result of a nonlinear refractive index (x3) effect. It is
the same physical mechanism that was used to generate SPM. KLM is a spatial effect that
is a result of the intensity being a function of the beam radius; whereas SPM is a result
of the pulse intensity being a function of time. To first order, the nonlinear index can be
approximated with a thin lens of focal length, /„/.
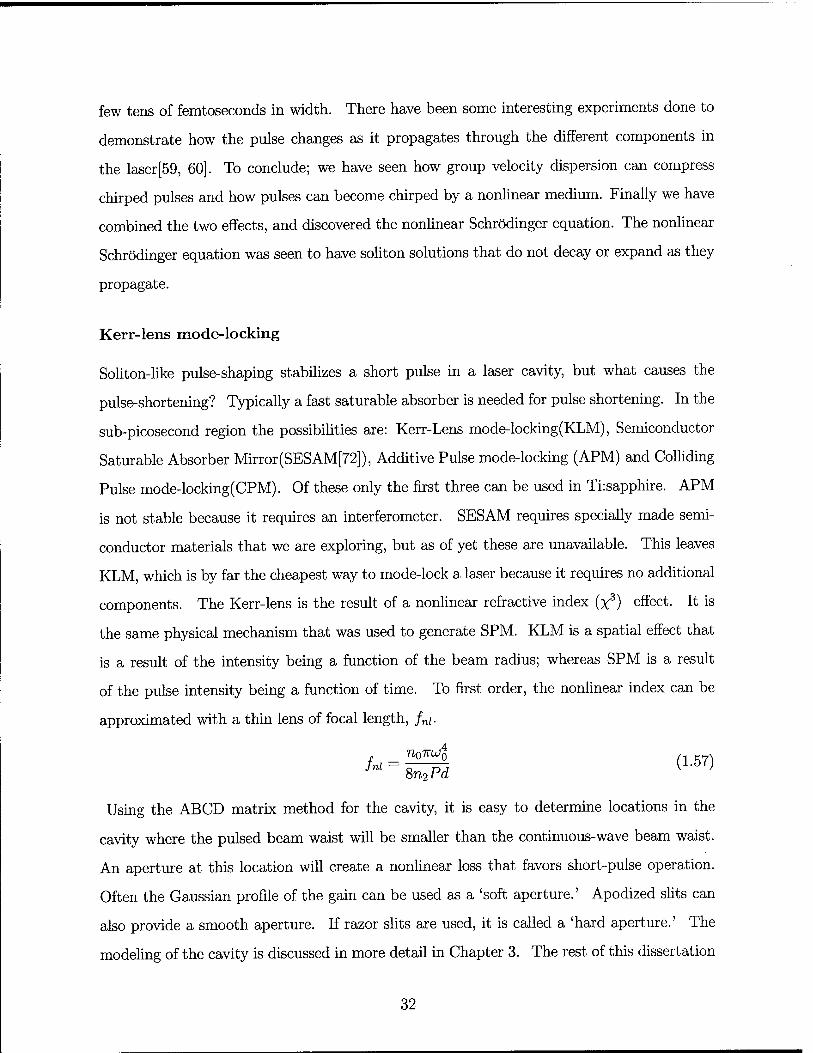
fnl = ^ (1-57) Jnl 8n2Pd y '
Using the ABCD matrix method for the cavity, it is easy to determine locations in the
cavity where the pulsed beam waist will be smaller than the continuous-wave beam waist.
An aperture at this location will create a nonlinear loss that favors short-pulse operation.
Often the Gaussian profile of the gain can be used as a 'soft aperture.' Apodized slits can
also provide a smooth aperture. If razor slits are used, it is called a 'hard aperture.' The
modeling of the cavity is discussed in more detail in Chapter 3. The rest of this dissertation
32
deals with the daunting task of merging a ring laser and a short pulsed solid-state laser.
33
Chapter 2
Saturable Absorber Mode-locked
Ti: sapphire Laser
Although the saturable absorber is used in the femtosecond dye laser, this is the first time,
to our knowledge, where it is used to mode-lock a solid-state ring laser gyro. This chapter is
divided into four sections: 1) intracavity measurements of electro-optic coefficients using a
linear cavity, 2) an experimental study on null-bias dithering, 3) a derivation that supports
the experimental results of null-bias dithering and 4) solid-state saturable absorber mode-
locked laser. A novel double-pulsed laser using a linear cavity makes its debut in this chapter.
The linear cavity has advantages over the ring laser gyro when it is used to measure electro-
optic effects because the linear cavity can only measure changes in index that occur on every
round-trip.
A big advantage of a pulsed laser gyro is the ease in which the cavity can be dithered
using electro-optic modulators. The frequency response to external modulation is explored
for the first time, to our knowledge, in the second half of the chapter. This experiment
would be almost impossible using a body-dithered continuous-wave HeNe laser. Also a new
method of extracting the average beat note is demonstrated. This method doesn't require
sophisticated counting electronics to keep track of the dithered phase. Finally some results
using a solid-state saturable absorber are presented.
2.1 Linear cavity
Laser gyroscopes have been measuring rotational velocities since the advent of continuous
wave ring lasers [75]. More recently, femtosecond mode-locked lasers have demonstrated a
gyroscopic response for homogeneously broadened lasers, with no measurable deadband[12,
13, 76]. It is not as well known that femtosecond laser gyroscopes can also make sensitive
phase measurements on a stationary optical bench[76]. The phase difference per round-trip
between the clockwise (CW) and counter-clockwise (CCW) pulses is measured by combining
the CW and CCW pulses on a detector. The detector will measure a beat frequency, which
includes the gyroscopic response.
The phase difference can be the result of a rotation, a change in index, a mechanical
vibration, or even a perturbation in a multilayer dielectric coating (for more examples of
experiments see Chapter 4). Some applications of this method are measurements of the
electro-optic effect [76, 77] and nonlinear spectroscopy[8]. We report the ability to make sen-
sitive phase measurements in a linear cavity geometry, the limit of an extremely elongated
ring cavity. It is possible to have two pulses circulating simultaneously in a linear cavity,
which serve the same purpose as the CW and CCW pulses in a ring cavity. Without any
rotation or modulation a mode-locked ring laser normally has a beat frequency bias of at
least 100 Hz and as high as 100 kHz[12]. The bias frequency is a result of nonlinear effects
combined with asymmetry between CW and CCW pulses. Because of the nonlinear intra-
cavity elements, the order in which the pulse encounters the optical elements will affect the
pulsewidth and pulse amplitude[57, 63, 74]. Any variation in pulse amplitude or pulsewidth
will be translated into a phase-shift per round-trip in the various nonlinear intracavity el-
ements, hence a beat signal. Since the pulses in a linear cavity travel through the same
optical elements in the same order, the phase shift is the same for both pulses, and therefore
no 'bias' beat note. Any of the typical T-violating asymmetries (such as the Faraday effect,
rotation, and Fresnel drag) that are measured in a ring gyro cannot be measured in a linear
cavity. Therefore one advantage of a linear cavity versus a ring geometry is the improvement
in the frequency bias.
There is; however, competition between the two pulses for the same gain, which can
35
result in a difference in amplitude between the two pulse trains, hence a different phase
shift due to the Kerr effect resulting in a non-zero bias. This effect was not observed and
was indistinguishable from the bandwidth of the beat note. This is not surprising because
the four-wave mixing in the absorber dye jet[36] should help to equilibrate any differences in
amplitude. A mirror vibration of 1 /an amplitude at a mechanical resonance frequency of 100
Hz will result in random beat frequencies in the range of 0 — 275 Hz. We routinely observed
a beat frequency bias of about 100 Hz which could be a result of these random fluctuations.
The beat frequency lower limit of 100 Hz is more than likely a result of mechanical vibration
of the optical components, especially since we are not actively stabilizing the laser cavity [78].
In general if the cavity length L (L = 210 cm in our case) is perturbed by the amount, AL,
in intervals corresponding to the cavity round trip time, then the measured beat frequency,
Av, will be given by:
*L = ^ (2.1) v L
where v is the optical frequency of the laser. In our case, we can measure a Av of 100
Hz, which means a AL of only 1.1 xlO-13 meters or about 0.1 picometers! In the following
experimental results, we changed the index of refraction, n, of a 0.5 mm sample of LiNb03.
In this case AL ^ An x 0.5mm, which implies a minimum detectable change of index of
io-9.
2.1.1 Experimental setup
The laser cavity is similar to the typical linear cavity mode-locked Ti:sapphire laser with a
saturable absorber (a jet of HITCI or IR140 dye dissolved in ethylene glycol) placed in the
center of the cavity, see Figure 2.1. The laser is not Kerr-lens mode-locked and the pulses
are between 1.5 ps to 3.1 ps in width. There are two pulses in the cavity, because the dye
jet is located in the center of the cavity. Mutual saturation of the absorber favors the pulses
colliding in the dye jet. Double pulse operation can not be obtained when the laser is Kerr-
lens mode-locked because of gain depletion coupled with the nonlinear loss associated with
Kerr-lens mode-locking. The competition of one versus two intracavity pulses is analyzed in
Chapter 3. The dye jet can be accurately centered in the cavity through translation of one
36
LiNbO
Pump f
Ti:Al203
SF-14 Prisms
Beat Note
Figure 2.1: Experimental setup: The dye jet is in the center of the cavity. The curved mirrors have a 5 cm focus. The output coupler (OC) is 1.3% transmitting, and the other flat mirror is a maximum reflector (R= 99.9%). The Ti:sapphire is 8 mm long. The SF-14 prisms are separated by 37 cm.
of the end mirrors. The distance that the end mirror can be translated while maintaining
double pulses is about 2 cm. The 2 cm distance corresponds to a 120 ps delay which is close
to the excited state lifetime of the dye. The dye concentration is not a critical parameter
and can be varied over a broad range without affecting the performance of the laser. The
output from one end of the laser goes through a variable delay and then is detected on a p-i-n
photodiode. This signal is amplified by a bandwidth limited amplifier resulting in a 140 MHz
sinusoidal output. The signal frequency is divided by two by converting the sinusoidal wave
into ECL logic and then sending it through a flip-flop to cut the frequency in half. After the
logic circuit the signal is amplified by a bandwidth limited circuit, which yields a 70 MHz
sinusoidal signal. Finally the signal is amplified again and applied to the LiNb03 sample in
parallel with a 50 ohm terminator. The flat mirrors consist of a 99.9% reflectivity back mirror
and a 98.7% reflectivity output coupler. The mirrors in the cavity are not specially made
37
for short pulses and their dispersion and reflectivities were not measured. The pump laser is
a Coherent Innova 200 Ar+ running at about 10 W all lines. The SF-14 prism pair are used
for pulse compression, by giving the cavity a net negative GVD[53]. The small reflections off
of one of the prisms are combined, after a variable delay, onto a slow photodiode (RC time
constant integrates over many pulses) to observe the beat frequency. A typical example of
the beat note as observed on a digital oscilloscope, without averaging, is displayed in Figure
3.14.
40 60
Time (|is) 100
Figure 2.2: Beat note as detected on a digital oscilloscope without averaging or smoothing.
2.1.2 Electro-optic measurements
The first experiment consists in recording the beat note versus the delay of the signal applied
to the LiNb03. The optimum timing occurs when each of the interwoven pulse trains sees
equal and opposite voltage (±V0) at the sample. Figure 2.3 is a scatter plot of the beat
frequency versus delay. The line plotted in Figure 2.3 is the function V0 |sin(|^r - 0O)|,
where the fixed phase, </>0, has been fit to the data. Notice the excellent correlation between
theory and experiment. With the delay set for the maximum signal, the voltage is varied
in order to determine the electro-optic coefficients for LiNb03. Since the voltage is applied
38
50
N40
X XL
-30 o c CD zj 20 cr CD
10-
0
-i r" i '"T 1 1 "T-
□ Frequency Volts
"I" I 'T
0
Voltage Difference = 16|Sin(.44*Delay-.67)|
-i—i—i—i—i—r l— i r- -i 1 1 r-
15 < o 0)
CO 10 CD
CD —\ 5 13
o CD
2 4 Delay (ns)
8
Figure 2.3: Beat frequency versus optical delay (squares) and the plot of the voltage difference applied to the sample (curve).
along the z-axis of the crystal, only two different coefficients (ri3 and r33) can be observed.
n"
0
0
0
0
»"24
-r22 n3
T22 »"13
\
0
0
\ -»"22 0
% = 1,2,3 => x,y,z
»"33
0
0
0
0
\5y
(2.2)
/
Where V refers to the plane of polarization of the optical field. Note that for light polarized
in the x-y plane, the electro-optic coefficient is simply the rx3 component and for light
polarized in the z plane, the r33 component. The electrodes are simply two thin strips of
vapor deposited gold, see Figure 2.4. Since the electric field in the LiNb03 is a fringing
field, it is difficult to extract exact results for the coefficients. However, we are able to
accurately determine the ratio of the coefficients because the unknown quantities cancel in
39
Applied Vo
Fringing E-Field
GND
Figure 2.4: LiNb03 modulator processed in-house. The optical axis is coming up out of the page.
the equations:
An, n3er33 Avz 3.2 (2.3)
Anx-y nlr13 Avx_y
Where ne and n0 are the extraordinary and ordinary refractive indexes and Au{ is the slope
of the beat frequency versus applied voltage for light polarized in the ith direction. The beat
frequency versus applied voltage for the two polarizations is plotted in Figure 2.5 along with
a linear fit. Notice that the curves fit a straight line which means there is no measurable T33
lock-in or dead band. The slopes from the linear fits are used to arrive at the ratio — of 3.57
± 0.1, which is close to the expected[79] value of 3.62 (the value of 3.62 is an interpolation
between values measured at A =.63 \im and 1.06 /im). The calculation is not quite as simple
as described in equation 2.3 because the LiNb03 is at Brewster's angle in the cavity, but
the actual calculation differs by only a simple geometric relation when it is oriented in the
When the LiNb03 is at Brewster's angle in the x-y plane, there isn't a problem because
Anx = Any. The error bars are a result of power fluctuations in the RF amplifier and the
40
N X
300
250
200
5* 150
I 100 ü- ,s- 50 LL
0
-i—i—i—i—i—i—r i i i
• xy-data ■ z-data xy-linearfit — z-linearfit
0 10 20 30 40
Applied Peak-Peak Voltage (Volts)
Figure 2.5: Beat frequency versus applied voltage for two different polarizations.
error in measuring the RF amplitude. It is not indicative of the ultimate resolution of the
measurement technique.
2.2 Ring gyro
The picosecond ring gyro is very similar to the linear cavity without the prisms. Without the
prisms, the net GVD of the cavity is at least 600 fs2. Because a stable soliton solution does
not exist for positive GVD in the nonlinear Schrodinger equation, the concept of soliton-like
pulse-shaping does not apply for this laser. Pulse durations are in the 20 ps range as can
be seen by the autocorrelation in Figure 2.6. It is extremely difficult to obtain an autocor-
relation of this length because the delay must be scanned over a range of 1.5 cm. We use a
type-II, background-free autocorrelator (there is a schematic in Chapter 3). Because this
autocorrelator uses a polarizing beam splitter/combiner, the retro-reflectors in the Michelson
interferometer are simply silver mirrors. It is very simple to translate mirrors and maintain
41
0 20
Delay (ps)
Figure 2.6: Background-free second-order intensity autocorrelation of a Ti:sapphire ring laser mode-locked with an absorbing dye jet without prisms for GVD compensation. Tpuise = 17.3 ps.
42
alignment whereas a retro-reflecting corner cube typically misaligns after translating (unless
great care is taken in its alignment).
The peak powers in this geometry are reduced by a factor of ten, which should min-
imize the nonlinear, nonreciprocal processes that generate the bias beat note. In fact, the
lowest beat note was measured using a ring cavity without prisms. It is difficult to measure
a low beat note because of various nonreciprocal effects in the laser like the motion of the
dye jet, air currents (Presnel drag) and mechanical noise. The experimental schematic is
shown in Figure 2.7. Notice that there is an additional fused silica plate inserted near the
Crossing Point
Pump
Ti:Al203
Figure 2.7: Experimental arrangement for ring gyro. Fused silica plate is used to minimize the size of the beat note interferometer.
crossing point. The plate is used to pick off beams for the beat note detection. It is very
important that the beat note interferometer be kept as small as possible to minimize noise
from vibrating mirrors and air currents. The beat signal with the narrowest bandwidth
and its Fourier transform is shown in Figure 2.8. The bandwidth is limited by the time
interval. The log plot of Figure 2.8 is shown in Figure 2.9. Notice the j noise and the spike
43
corresponding to the beat signal, obviously there is no background subtraction in this data.
Recall from Chapter 1 that the lock-in frequency is given by: £ = nz^zy, where r is the ratio
of the amplitude of the second-harmonic to the fundamental. Based on the amplitude of
the second and third-harmonic, we estimate the upper bound of the lock-in frequency to be
35 Hz for the data in Figure 2.9. Figure 2.10 is a longer trace (10 seconds) and the beat
note is centered at 10 Hz, an amazingly low beat note. For this data, the harmonic analysis
yields an upper bound of the lock-in frequency of 4.64 Hz. Figure 2.10 demonstrates the
dynamic nature of the beat note. It appears that the beat note has good spectral quality
for short time periods, but the frequency varies perhaps due to motion of the table, the dye
jet or air currents. The beat note is typically lower after 7 PM when the local traffic has
decreased, so perhaps the major factor contributing to the beat note is motion of the table.
cö c O)
CO
to
m
0.60 0.62 0.64 0.66 0.68 0.70 0.72 0.74 Tim e (s)
220 230 240 Frequency (Hz)
250 260
Figure 2.8: Smallest bandwidth ever recorded using a Ti:sapphire ring laser gyro. The time series shows only a small portion of the data. The data was taken for 0.74 seconds.
The advantage of the linear cavity is that it cannot measure a beat note from air
currents and table rotations. For the ring laser, these effects become interesting demonstra-
tions. By simply blowing air along one of the arms of the ring gyro, a beat note is detected.
44
400 600 Frequency (Hz)
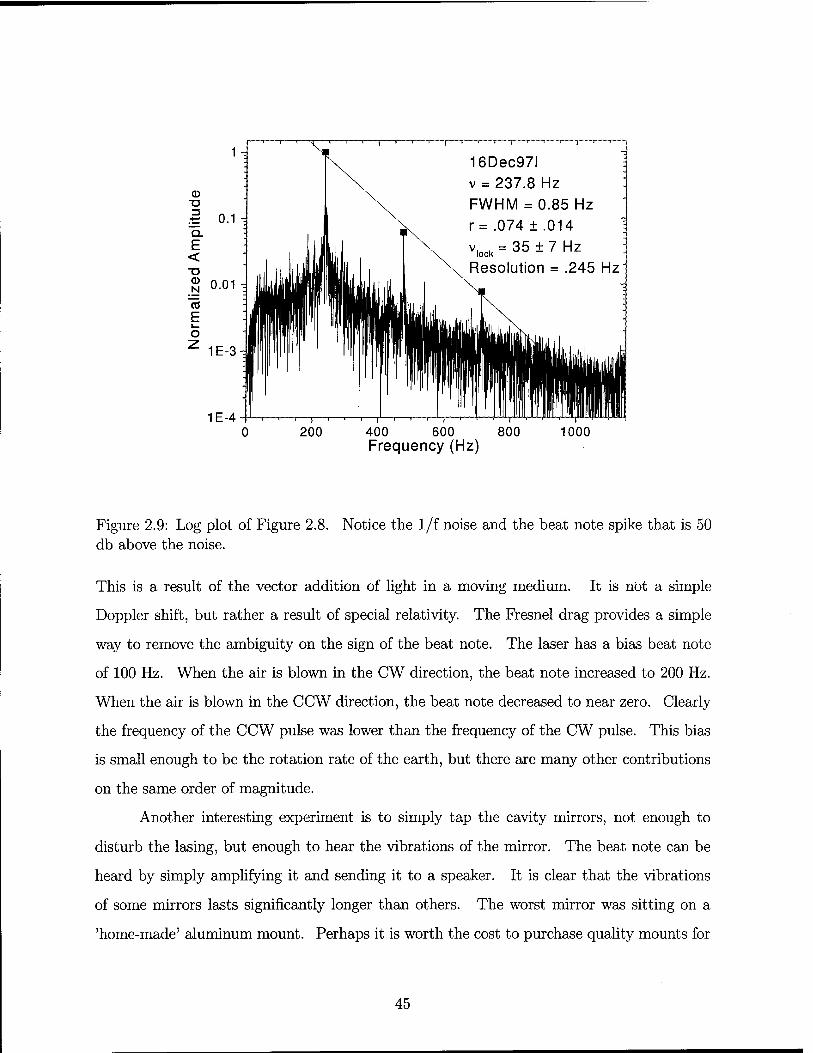
Figure 2.9: Log plot of Figure 2.8. Notice the 1/f noise and the beat note spike that is 50 db above the noise.
This is a result of the vector addition of light in a moving medium. It is not a simple
Doppler shift, but rather a result of special relativity. The Fresnel drag provides a simple
way to remove the ambiguity on the sign of the beat note. The laser has a bias beat note
of 100 Hz. When the air is blown in the CW direction, the beat note increased to 200 Hz.
When the air is blown in the CCW direction, the beat note decreased to near zero. Clearly
the frequency of the CCW pulse was lower than the frequency of the CW pulse. This bias
is small enough to be the rotation rate of the earth, but there are many other contributions
on the same order of magnitude.
Another interesting experiment is to simply tap the cavity mirrors, not enough to
disturb the lasing, but enough to hear the vibrations of the mirror. The beat note can be
heard by simply amplifying it and sending it to a speaker. It is clear that the vibrations
of some mirrors lasts significantly longer than others. The worst mirror was sitting on a
'home-made' aluminum mount. Perhaps it is worth the cost to purchase quality mounts for
Figure 2.10: Lowest beat note recorded using a Ti:sapphire laser. The data was taken for 10 seconds, which implies a resolution of 0.1 Hz. Comparison with Figure 2.8 indicates that the broader bandwidth here is to be attributed to random frequency drifts on a time scale of seconds.
a laser cavity.
By inserting a nonlinear crystal, CdS, into the laser at a waist, we are able to detect
the complex nonlinear refractive index of the crystal. Because CdS is also a two-photon
absorber, the extraction of the nonlinearity is nontrivial. Current experiments are attempt-
ing to measure the nonlinear index, n2, of fused silica. By translating the sample along
the propagation direction, the amount of nonlinear refraction varies as a function of beam
waist. The nonlinear refractive index is nonreciprocal because there is a 5% output coupler
on one side of the crystal, so the powers are nonreciprocal by 5%. The derivation of the
beat frequency resulting from a nonlinearity is derived in Chapter 3. A plot of the beat
frequency versus location in the cavity is shown in Figure 2.11.
Table vibrations could also be measured in a similar method. A small tap to the
table generates a high pitched, chirping squeal from the speaker. The minimum beat note
46
N I >> Ü C o
CD
CO 0 CO
3000
2500-
2000-
1500-
1000-
500-
0-
—.—i—i—i—i—i—i—r
Data: 9Dec97 Model: Lorentz ChiA2 = 14541 yO = -300 ± 48 Hz xc = 5.33 ±0.017 mm w = 2.9 ±0.095 mm A = 14400 ±590 Hz ,
-i—|—i—r- ->—■—r
-i—i—i—|—i—i—i—\—i—i—i—i—i—>—i—i—i—i i i
2 4 6 8 10
Intra-Cavity Position (mm)
Figure 2.11: Plot of the beat frequency versus the location of CdS inside the cavity.
47
also depends on the time of day. Data taken after 7:00 PM has a significantly lower beat
note. The diurnal variations are likely due to local traffic patterns.
2.2.1 Large ring
It is important to demonstrate scalability of a laser gyro, if it is to be used to measure
sensitive rotations like the earth's rotation rate. As the perimeter of laser gyros increases it
will become increasingly more difficult for HeNe laser gyros to prevent mult-mode operation
because the separation of the longitudinal modes becomes extremely small. The pump
power must be carefully controlled in a HeNe laser gyro, such that only one mode reaches
threshold[3j. In a mode-locked laser, it should be trivial to scale to longer perimeters as
long as the round-trip time is much shorter than the excited-state lifetime. To demonstrate
the scalability of the Ti:sapphire laser gyro, we constructed a laser with a perimeter of 10 m.
This is 2.5 times the size of the most sensitive laser gyro constructed to this date[3]. For
this to be an fair test of this laser, the air-floatation of the table was turned off. The beat
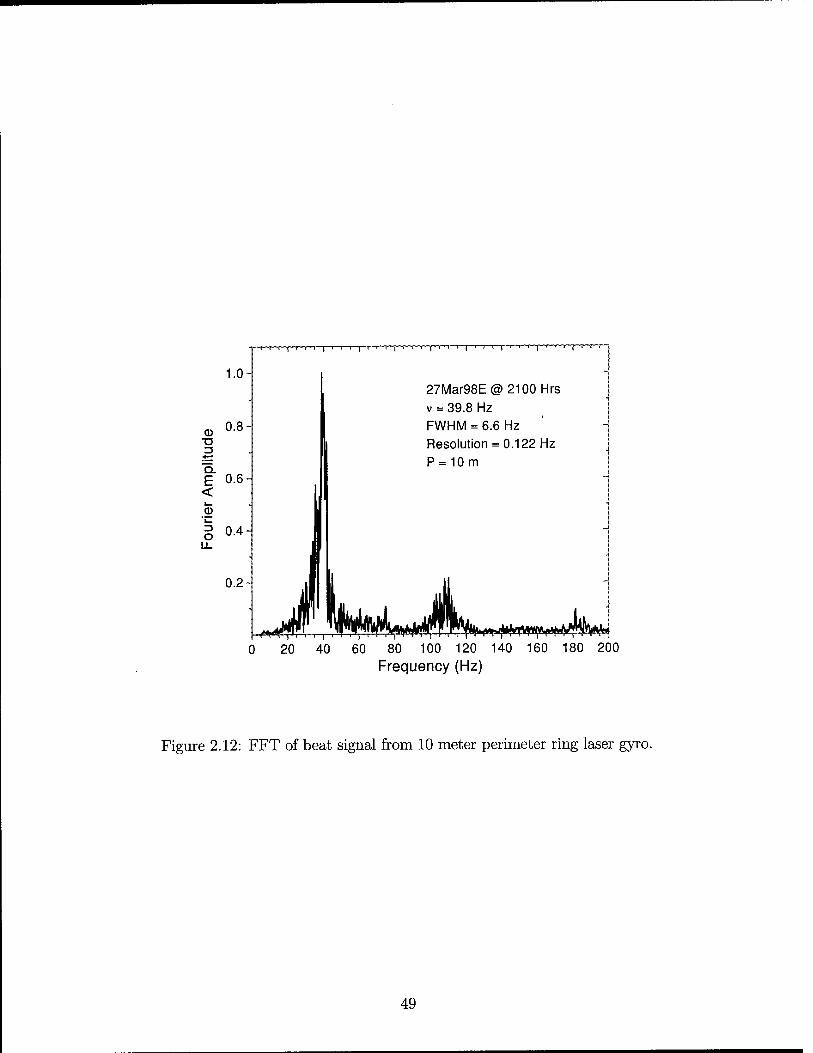
signal is shown in Figure 2.12. The noise at 110 Hz is believed to be a result of the water
pumps above the lab. Even with a perimeter of 10 meters, the laser is capable of producing
a beat frequency of 40 Hz. The earth's rotation would cause a beat frequency of 120 Hz, if
this laser had a square perimeter.
2.3 Electro-optic dither (theory and experiment)
2.3.1 Introduction
Since 1967[25] it was recognized that one method to avoid the lock-in of counter-propagating
beams was to add an artificial rotation rate. This artificial rotation avoids the dead-band
region of a laser gyro and restores linear operation. In a continuous-wave HeNe laser this is
accomplished by mounting the laser on springs and driving the spring-mass system with a
piezo-electric transducer. Because the frequency of modulation is determined by the spring-
mass system, it is not easy to explore the parameter space using a HeNe laser gyro. A big
advantage in a pulsed laser gyro is that the modulation rate and amplitude can be changed
48
1.0-
t 1 1 f t 1 » \ ' "1 t \ \ i"T j' 1-T-l r * ' ' I * ! ' ! * ' ' 1 l"* » | ' < '
Figure 2.12: FFT of beat signal from 10 meter perimeter ring laser gyro.
49
very easily and quickly by the use of an electro-optic modulator. The E-0 modulator creates
the same optical effect as if the gyro was first rotated in the CW direction and then rotated
in the CCW direction. In this section, there are three frequencies that will be explored. The
modulation frequency determines how often the artificial frequency is switched from CW to
CCW. The other two frequencies are associated with the effective CW and CCW rotations.
We will determine the optimum modulation frequency dependent on the maximum rotation
rate. The experimental results are supported with analytic calculations.
2.3.2 Null-bias dithering: experimental
The experimental setup is shown in Figure 2.13. Notice the output of the function generator
modulates the RF applied to the LiNbOs which changes the cavity length. The quartz
LiNbOs
Pre- Amplifier
Figure 2.13: Experimental setup for null-bias dithering. A small quartz plate is inserted near the crossing point at Brewster's angle to output couple two beams for the beat note detection.
plate splits off two beams for beat note detection. It is located near the pulse crossing
point to minimize the physical size of the interferometer used to detect the beat note. If
the output coupled pulses are used for the beat note detection, the interferometer would
have to be several meters long which would result in more noise. The output from the
function generator is mixed with the RF before the final RF amplification. The RF is at
50
100-
50
0
-50
100
50
-50
-i—i—i—i—r—i—i—■—i—■—i—■—i—'—r-
i I i I I I ' I ' I ' I ' ' I I
0:l/"N
-i—i—i—>—i—■—i—i—i—'—i—'—i—'—i—'—i
0 2 4 6 8 10 12 14 16 18 20
Time (ms)
Figure 2.14: Upper plot is the square wave modulation that is applied to the RF signal via an RF mixer. The lower plot is the corresponding beat signal.
the cavity frequency and is used to create a frequency difference between the CW and CCW
pulses. The modulation frequency is varied using the function generator. For square wave
modulation, the laser will generate two beat frequencies of equal magnitude but opposite
in sign. The oscilloscope trace shown in Figure 2.14 should help clarify the modulation
and the corresponding beat note. When the modulation is in the low state, there is no
RF applied to the E-0 modulator and therefore the beat signal is close to zero. When the
modulation is in the high state, the RF power is at a maximum and the beat note is at a
maximum. As the modulation frequency is increased, eventually the cavity will not respond
to the modulation. If the cavity is not responding to the modulation, it should "average"
out the modulation. Assuming a perfect square wave modulation, this means the beat note
should eventually disappear because the average would be zero. If the modulation is not a
perfect square wave (i.e. the beat notes are not equal, but are opposite in sign), then the
beat note will roll off to a constant frequency at the average of the two beat frequencies.
For example if the beat note for a positive modulation is u\ and the negative modulation is
u2 then the beat note when the cavity is no longer responding will be .
By putting the beat note into a spectrum analyzer, it is easy to monitor the amplitude
of one of the beat frequencies, u>i, as a function of the modulation frequency. The plot of
51
the amplitude at ux as a function of the modulation frequency is shown in Figure 2.15. Note
that it is roughly exponential, but there is a faint sinusoidal modulation.
ü c
cr a)
re
Q ■♦—• re Q.
E <
50- 1 r
\
1 1 ' 1 i
11Apr97 40-
\ A1*Exp(-(t-t0)/t1)
30-
20-
\ \ tO = .1 MHz A1 = 48.77 ±1.2 "
t1 = 0.3297 ± .013 MHz .
10-
0- 1 r
~* • —
—■——i . 1 1 1
0.0 0.5 1.0 1.5 2.0 Change in Modulation Frequency (MHz)
Figure 2.15: Amplitude of Ui beat note as a function of the modulation frequency. The data is fit to an exponential decay.
While varying the modulation frequency near the roll-off point, the beat note goes
through some strange resonances. Eventually the beat note rolls-off to the average frequency.
In between the roll-off and the slow modulation, the beat signal would appear to contain
structure at the average frequency. Figure 2.16 is a time trace demonstrating the modulation
of the beat note. The average frequency is just beginning to appear in this oscilloscope trace.
Figure 2.17 shows the beat signal when the frequencies u\ and Oü2 have almost disappeared
and all that is left is uave. Instead of monitoring the decay of the beat frequency uu we
monitored the average frequency (uave = 2). This produced the smoothly varying
curve shown in Figure 2.18. Figure 2.18 illustrates the fit to an inverse sinc(x) function.
This function is the sinc(x), but the argument is inverted (i.e. fmodPlsm(^); where PI
and P2 are constants). If the amplitude was plotted versus the modulation period, T, the
graph would have been immediately recognized as the sinc(x) function.
By varying the beat frequencies, ui and cu2, the functional dependence of the width
of the inverse sinc(x) constant P2 are determined. Not only was the amplitude of the beat
notes varied, but also the sum and difference. Only when the width is plotted versus the
52
CO c g>
CO 4—«
CO CD
00
27Mar97a 1.Ü i.I.,! i— J 1.1 ■ 11■ iii i1
0.5
0.0
0.5
1.0 LII II "_ |l l| |l ft II nip|llnH|4|||l*fl|l|ll|l |l | ll li i| M ,i.
0.0 0.1 0.2 0.3 Time(ms)
0.4
L=JL~A A- 300 400 500
Frequency (kHz)
Figure 2.16: Upper: Beat signal as seen on the oscilloscope. The low frequency modulation is highlighted by the curve. Below: FFT of the beat signal.
difference in beat frequencies, did a linear dependence appear (see Figure 2.19). All other
plots showed no correlation.
2.3.3 Derivation of modulation spectrum
Great care has to be taken when analyzing the phase difference of the modulated laser.
When the modulation changes state, the slope of the phase is discontinuous while the phase
must be continuous. By writing down the analytic description of the phase and taking the
Fourier transform, we obtained an equation which fit the experimental data extremely well.
It turns out that the continuity of phase was the crucial parameter.
There is a very simple explanation of the averaging phenomena at work in this system.
If you take 100 steps forward and then take 99 steps backward; you have moved forward one
step. If you take the steps fast enough, it will appear as if you are simply moving forward
53
i i r- -T™ I "T r——i r-
-80 ■ 0.25
16Jan98c
Modulated
Beat Signal
-i 1 1 1 1 1 r
0.50
Time (ms)
I i i i [—■" i 1 r-
0.75 1.00 1.25
Figure 2.17: Beat signal demonstrating the roll-off to u>c
signals at uj\ and u)i are barely visible. Notice in this plot that the beat
54
250
N 1200
CO
^ 150 "co -glOO
|- 50 <
0-
21 Mar 97 Beat Frequency = 136 KHz Average = 4.3 KHz ± Modulation
Figure 2.18: Amplitude of average frequency as a function of modulation frequency. The model is fmod*Pl*sin(P2/fmod).
one step at a time. Notice that it is the one step difference at the end of the iteration that
makes all the difference in your forward progress. You might also be wondering why is it a
sinc(x) function? Why does the forward progress periodically go to zero? This is also very
easy to explain. If the 'step' that is left over is equal to n, then you are actually back where
you started. You can think of it like this: if you are taking your steps on a circle, then the
value of 7T puts you on the other side of the circle and if your ruler is measuring only the
absolute distance in the x-direction, then you are back where you started. Remember that
in the experimental setup, the measured beat note has an ambiguity of sign.
The analytic solution is derived below in the following steps: 1) write out the phase
as a function of time. 2) Setup the Fourier transform and evaluate it at uave = .
3) Ratio the Fourier transform by the maximum possible signal. 4) Take limit as time goes
to infinity.
55
250
N
i 200
150- CD
CD
E cd co £ 100 LL CM Q_
P2 = A + B*(co1 - co A = -1.7 +/- 2.4 B = .80 +/- .01 R = .99933
50 100 150 200 250 300 350
Max Difference in Beat Frequency (KHz)
Figure 2.19: Plot of P2 fit parameter versus the beat frequency difference. The slope of the straight line is predicted by theory to be §.
Step 1: Finding the phase as a function of time.
This is not as easy as it sounds. The assumptions are that the phase is continuous, but
discontinuous in slope at intervals of T. Figure 2.20 below should help visualize the time
dependence of the phase.
Starting from t = 0, the phase is:
<j>x = uit for 0 < t < T
02 = u2t +T (wi - w2) for T < t < 2T
0! = uxt +T (u2 - wi) for 2T < t < 3T
02 = u2t + 2T (wi - ui2) for 3T < t < 4T
^(n,*) = (Jtt +(n- 1)T{LO2 - Wl) for 2 (n - 1)T < t < (2n - 1)T
02 (n, t) = u2t + nT fa - u2) for (2n - 1) T < t < 2nT
56
0 CO cö
6 -
2 -
0
Total Phase Average Phase
to = (co.+co„)/2 ave v 1 2'
20 40 60 Time
80 100
Figure 2.20: Plot of the phase as a function of time. The phase is continuous, but dis- continuous in slope. The dotted line is the average phase. The modulation period is 2T.
m = ]T 71=1
<t>x{n, t)6(2 (n-l)T<t<{2n-l)T) +
(2.4)
02(n, t)6 ({2n -l)T<t< 2nT)
The last expression may look complicated, but it is setup for piecewise integration.
The Kronecker-Delta function will form the limits of the piecewise integration. Notice that
the phase term is always changing in order to maintain continuity of total phase, even when
the slope changes from u\ to u>2. Figure 2.20 was plotted using the equation above to
ensure that the total phase is continuous. Next the sin (0 (t)) was plotted to see if the beat
note would look similar to the experimental data. Figure 2.21 and Figure 2.22 are two
generated beat signals. Figure 2.22 is modulated ten times faster than Figure 2.21. Notice
the transition to uave as the modulation frequency is increased. Compare these plots with
57
CO
O) \n
"Jo CD
CO
T3 CD
_CÖ
ZJ
E CO
CD ■o *—« Q.
E <
0 50 T- 109 X Time (ms) 150 20
0.8- i ■> "I ■"" i —f———r— 1
-
0.6- -
0.4- -
0.2-
0.0- V
i -i— ■p— ,—i '"~ - i i
_
0.0 0.1 0.2 0.3 0.4
Frequency (kHz) 0.5
Figure 2.22: Generated beat signal. The modulation frequency is 10, u\ is 5.2 and u>2 is -4.7. Here we see the rolloff towave is almost complete, there is only a small modulation at the original beat frequencies. The time scale is different from the graph above.
we take the limit as m —> oo.
Denominator
denom = /*,'( 2 f(ui +U)2)f
dt (2.5)
denom = 2_. n=l
2nT
I 2(n-l)T
. 2 f(üJi+U2)t\ sm —— dt (2.6)
2nT
denom = ^ < / - [cos(0) - cos ((ui + üJ2) t)\ dt
2(n-l)T
(2.7)
59
oo 1
denom = Y^ - n=l
T- sin((cji +a;2)i)
(Ui + 0>2) J 2(n-l)T
2nT
(2.8)
denom = lim < > m V sin (2 (n - *) (m + ^) r) - sin (2n (cu! +1^2) T)'
,n=l 2 (wi + UJ2)
The finite sum to the arbitrary number m was accomplished on Mathematica.
(2.9)
/ sm(2m{ui+uj2}T) denom = lim < ml —, r
m->oo [ 2 (Wi + 0Ü2) (2.10)
Wi sine-integral
uipart
00
/sin( ̂ t^sinfa (*))<** (2.11)
Uipart = y j
n=\
(2n-l)T
/ sin( sm 1 ("i + "a)A sin (wi< + („ _ 1) T (W2 - Wl)) *
2(n-l)T
(2.12)
1 00
n=l
(2n-l)T
/ 2(n-l)T
/ cos((n-l)(o;2-a;1)T+^^j -
cos ((n - 1) (w2 - wi) T + (3"1+"2)t) di
(2.13)
uipart = J] 71=1
sin((n-l)(a;2-^i)r+("172)t)
sin((n-l)(^2-u)1)T+(3'Jl+"2)t)
3o;i+o;2
(2n-l)T
J 2(n-l)T
(2.14)
60
E n=l
sin(^i-^)T) +
uipart = lim < m
E[ ra=l
sin(2(n-l)((x;i+a'2)r) (3wi+a;2) +
E ^ n=l
sin(("1+^2)r-2rtT(o;1+a;2))
(3CJI+W2)
(2.15)
The finite sum to the arbitrary number m was accomplished on Mathematica.
But wi and o>2 are not in units of Hertz. To yield a result which will be useful in the
lab, we define 2-jrfi = a;iand 27r/2 = o»2-
soln = sine '7T(/l-/2)'
4/, mod (2.28)
7T where all frequencies are in Hertz. The value of - ~ 0.79 is within the margin of error of
the experimental result of 0.80 ± 0.01, which is extracted from the slope of Figure 2.19.
2.4 Solid-state saturable absorber
The solid-state saturable absorber is a simple extension of the picosecond ring laser gyro
presented above. The dye jet is simply replaced with a solid-state saturable absorber such
as Schott Glass RG-830. The schematic of the system is shown in Figure 2.23.
The choice of a solid-state saturable absorber is based on the characteristics of the
ring dye laser discussed earlier in this chapter: the sample must absorb about 2% at the
lasing wavelength and the sample must be saturable. Since most of the Schott glasses have
lifetimes in the picosecond region[80, 81], they should be capable of producing picosecond
pulses. A potential problem with this system is two photon absorption. Most of these glass
filters are simply an amalgam of semiconductors. The Red Glass series, RG, is a mixture
of CdTe, CdS and CdSe. Because the glass consists of small spheres (radius = 5.3 nm at
a volume fraction of .0016 for RG-830) [82] of these semiconductors, the glasses will have
64
Ti:Al203
Figure 2.23: Setup of solid-state absorber experiments. Several absorber were tried, includ- ing the RG-830 that is displayed.
similar absorption features as the semiconductors. Most of these II-VI semiconductors have
indirect gaps with parabolic bands and a long absorption tail, so the energy of 2 photons
would be strongly absorbed by the solid-state glass. The long absorption tail should enable
us to engineer a device with minimal absorption at the lasing wavelength.
Sarakura etal[83] used a piece of HOYA IR 76 to initiate Kerr-lens mode-locking in
a Ti:sapphire laser. They ground the glass down to 90 ßm to simulate the thickness and
absorption of a dye. They were successful in the implementation, but discovered that
thermal effects in the glass led to instabilities in the laser output. To verify that it was
in fact a thermal problem, they noted that blowing dry nitrogen on the glass increased the
output of the laser. Our setup is similar to Sarakura's but sans prisms because we are
not particularly interested in short pulses in this preliminary demonstration. We initially
chose a 1-mm thick piece of RG-780 because it gives an absorption of 3% at 800 nm. This
glass did not result in mode-locked operation. After checking the wavelength of the laser, we
discovered that the wavelength had simply shifted to longer wavelengths where the absorption
of the glass was lower. Since we have no way of controlling the wavelength of the laser, we
selected a 1-mm thick piece of RG-830. With the laser operating at about 850 nm, this
setup produces bidirectional, mode-locked pulses. If both the CW and CCW pulses are
about as long as the glass, the mutual saturation should be optimized while minimizing the
65
2-photon loss. However, the pulses were much longer than the thickness of the glass; greater
than 20 ps. Unfortunately the CW and the CCW directions were locked to one another
therefore the beat note was zero and would not respond to mild rotations of the table. This
is actually not surprising considering the theoretical work by Wax, Chodorow, Buholz and
Chesnoy[35, 84, 85, 9] on lock-in in pulsed laser gyros.
Only when the table is rocked violently does the laser produce a beat note and then
only for a short time before the laser locks once again. We also noticed the thermal problems
that Sarakura mentioned. Because of these disadvantages, this system was not pursued.
2.4.1 Lock-in
There has been a lot of discussion about why the femtosecond dye laser does not lock. The
three theories with widest acceptance are Doppler shifting, randomizing the scattering centers
and four-wave mixing. The Doppler shift theory claims that scattered light is frequency
shifted because of the longitudinal motion of scattering objects in the dye. The four-wave
mixing theory states that the light scattered by the nonlinear grating is 90° out of phase with
the opposing pulse and therefore will not interact with the opposing pulse (although this is
true, it doesn't prevent the linear scattering from locking the laser). The random-scattering
theory states that the phase of the scatters is randomized by the motion of the dye, which
is identical to random, null-bias dithering (see Chapter 1).
Unfortunately in previous laser systems it has been impossible to separate the phe-
nomena because they all occur in the dye jet. The solid-state system offers the unique
ability to separate the phenomena because the Doppler shift can be set to zero by having
a stationary sample. Also four-wave mixing occurs in an absorbing glass similar to the
dye jet. In the preliminary experiments, the sample was stationary and the system locked.
This indicates that it is the motion of the dye jet that causes the pulses to be independent.
These results are preliminary and require a more systematic study to be conclusive. In an
attempt to elucidate the problem, we mounted the glass on a moving audio speaker. This
resulted in a beat note, which would seem to indicate that the CW and CCW pulses are
decoupled; however, the motion of the speaker was not purely transverse to the optical path
and contained a significant amount of wobble in the longitudinal direction. As discussed
66
earlier, a longitudinal motion will result in a false beat note. Because the beat note was
exceedingly erratic with a bandwidth equal to the beat note of about 25 kHz, no positive
conclusions can be drawn. Perhaps in future experiments the glass can be moved using a
smoother piezo driven system (see Chapter 4) and finally clear up the question about why a
mode-locked dye laser gyro doesn't lock.
2.5 Conclusion
In conclusion, this chapter introduced the world's first solid-state ring laser (albeit with a
dye-jet absorber) that is not locked and requires no bias. Also a novel linear cavity design
was unveiled and its use as a tool to measure optical nonlinearities was demonstrated. A
new method of measuring the average beat note in a null-bias system was derived analytically
and demonstrated experimentally. The flexibility of dithering a pulsed ring laser gyro was
demonstrated, opening the doors to a plethora of experiments concerning the dithering of
ring laser gyros. Finally, an all solid-state laser gyro was attempted. Modelocked pulses
were achieved in the all solid-state laser gyro, unfortunately the counter-propagating modes
were locked.
In the next chapter, Kerr-lens modelocking is explored as a method to achieve a pulsed
laser gyro. The first setup also uses a saturable absorbing dye-jet, but in this case the dye-
jet is used to initiate pulses and to define a crossing point. The mechanism that leads to
femtosecond pulses is shown to be the Kerr-lens effect.
67
Chapter 3
Kerr-lens Mode-locked Ti:sapphire
Laser
This chapter reports the first Kerr-lens mode-locked ring laser gyro. The chapter is divided
into two different methods for defining the pulse crossing point: saturable absorber and
mutual Kerr-lens. In the saturable absorber section, a novel method uses the Kerr-lens in
the Ti:sapphire for both positive and negative feedback. In the second section, the use of
mutual Kerr-lensing is demonstrated to define the pulse crossing point in a pulsed ring laser
gyro.
3.1 Introduction
Since the advent of Ti:sapphire and Cr:LiSAF lasers there has been a move to eliminate
the dye laser by replacing it with these new solid state materials. Perhaps the chief factor
motivating this migration is the messiness of dealing with dye lasers, but there are other
reasons including longer upper level lifetime and broader bandwidth, which result in higher
power and shorter pulses. One motivation for this work is to demonstrate a solid-state
femtosecond (fs) laser gyro, similar to the fs ring dye laser [13]. However, operation of a
solid state ring laser with two uncoupled beams circulating in opposite directions is more
challenging then it may appear, for the reasons outlined below.
In a continuous wave ring laser, bidirectional operation is only possible with inho-
mogeneously broadened gain media such as HeNe and C02. In most lasers that have ho-
mogeneously broadened gain media such as dyes and solid-state lasers, the larger mutual
gain saturation (as compared to self saturation) prevents bidirectional operation. Another
problem with condensed matter lasers is that the "lock-in""or "dead band" problem plagu-
ing most laser gyros tends to be exacerbated (larger scattering from condensed matter than
from a gas). In most commercial laser gyros, operation within the dead band is prevented
by giving the laser a constant motion (dithering).
Throughout this chapter we will use the following terms, which are defined here for
clarity. Feedback refers to a coupling between a parameter of the laser pulse and the cavity
losses. "Positive feedback" is a mechanism that causes the peak intensity of the laser to
increase. "Negative feedback" is a mechanism that causes the peak intensity of the laser to
decrease. The word "passive" refers to a device that is not actively driven by an external
source. "Kerr-lens mode-locking" is an example of positive feedback. The Kerr-lens is a
result of intensity dependent index of refraction. The Kerr-lens is positive for most crystals,
which results in a positive lens. If an aperture is placed at the maximum decrease in beam
waist due to the Kerr-lens, a positive feedback mechanism will result. This is the typical
situation for Kerr-lens mode-locked lasers (i.e. Ti:sapphire, Nd:YAG and CrrLiSaF). If an
aperture is placed at the maximum increase in beam waist due to the Kerr-lens, a negative
feedback mechanism will result. For the Ti:sapphire laser, the pulse energy remains roughly
constant for different pulsewidths. Therefore a positive feedback mechanism that increases
the peak pulse intensity will also decrease the pulsewidth. Likewise, for the Tksapphire laser,
negative feedback will result in longer pulses.
3.2 Preventing phase coupling between counter-propagating
beams
The problem of injection locking between the two counter-propagating beams has been solved
in the case of the dye laser by replacing continuous wave operation by ultrashort pulse
69
operation. There is no scattering of the clockwise circulating pulse into the counter-clockwise,
if these pulses do not meet near a scattering medium. The pulses collide in the absorbing
jet and opposite the jet in air. The same solution applies to a mode-locked Tksapphire
laser, provided the following conditions can be satisfied: (i) bidirectional operation with two
counter propagating pulse trains of the same intensity, and (ii) amplitude coupling without
phase coupling away from any scattering surface to accurately define the pulse crossing
points. A saturable absorber, similar to dye lasers, provides the required coupling: the pulse
trains originate from standing wave noise spikes saturating the dye.
3.3 Preventing unidirectionality
A first approach to passively mode-locking the Ti:sapphire ring laser is through the use of
saturable absorbers. Stable bidirectional operation was obtained using the dye IR-140. The
pulse duration was approximately 1 ps. This is nearly a direct extension of the dye laser
technology, with two quantitative differences. First, the Ti:sapphire and the dye absorber
saturate at intensities that differ by three orders of magnitude. Therefore, the gain medium
stores more energy than the absorber can saturate (typical dyes have a saturation energy
density: ws = — = 1 mJ/cm2, as opposed to 1.2 ± 0.15 J/cm2 for Ti:sapphire[86]). Second,
the amplitude modulation resulting in mode-locking is only applied to the leading edge of
the pulse. Saturable absorbers are often referred to as a slow nonlinearity (the recovery time
of the bleached dye is longer than the pulse duration), as opposed to the fast nonlinearity
introduced by Kerr-lens mode-locking.
In the case of the dye laser, the dynamics of the gain and absorber in the mode-locked
dye laser are carefully tuned such that the absorber eats away at the leading edge of the
pulse and the gain eats away at the trailing edge by gain saturation. The lifetime of most
dyes are on the order of nanoseconds (ns) while Ti:sapphire has a lifetime of 3.2 //s. The
lifetime is crucial because it determines the recovery time of the gain medium.
In the case of Kerr-lens mode-locking, the factor of 1000 ratio in lifetimes would
appear to be an insurmountable problem since the system will want to operate such that
the energy extracted is the greatest. A more intense single pulse will have more Self-
70
Phase Modulation (SPM) inside the Ti:sapphire, which will result in shorter pulses when
there is negative Group Velocity Dispersion (GVD) inside the cavity (a result of the prism
pairs). With an aperture in the cavity promoting Kerr-lens mode-locking; a shorter and
more intense single pulse will experience less loss and therefore dominate over bidirectional
pulses. A solution to this problem is to limit the intensity of the pulse. In the following
sections we describe two successful implementations of passive negative feedback: (i) optical
limiting using negative feedback through Kerr-lensing in Ti:sapphire (resulting in continuous
bidirectional pulse trains) and (ii) optical limiting using an intracavity two-photon absorber,
resulting in Q-switched mode-locked bidirectional operation.
3.4 Experimental setup
Figure 3.1 is a sketch of the experimental arrangement. The flat mirrors are either 0.1% or
Al
Ti:Al,0
SF-14 Prisms
2^3 Dye Jet
Figure 3.1: Experimental setup. Al and A2 are apertures. Curved mirrors have radii of 10 cm. Flat mirrors have reflectivities 0.999 (left) and 0.987 (right). Brewster-cut 8 mm Ti:sapphire rod.
71
1.3% output coupling at 800 - 900 nm at zero degrees incidence. The curved mirrors have
10 cm radius of curvature. An angle of incidence of 10.5 degrees is chosen at the mirrors
surrounding the gain medium to compensate for the astigmatism of the Brewster angled
Ti:sapphire crystal. Since no astigmatism compensation can be obtained for the 40 pm
thick saturable absorber jet, the angle of incidence on the corresponding focusing mirrors is
minimized. Four SF-14 prisms with 37 cm spacing between prism pairs are used to achieve
an adjustable positive to negative GVD [87, 53]. The total perimeter of the ring is 253 cm
resulting in pulses every 8.4 ns. The pump is a Coherent Innova 200 Ar+ running on all
lines and pumping at about 10 Watts. The high pump power is used to overcome the loss
through a two photon absorber (i.e. 2 mm of CdS). Apertures Al and A2 are vertical razor
blades and are not used in all experiments. Al is used for Kerr-lens mode-locking and A2 is
used for passive negative feedback. A small amount of IR-140 dye was dissolved in ethylene
glycol for the saturable absorber. Other dyes (i.e. HITCI and NDI) have also been used and
do not seem to affect the pulse duration in the case of Kerr-lens mode-locked operation.
3.5 Unidirectional mode-locked pulses
The procedure for attaining mode-locked pulses is very simple. First close down the Al
aperture until it begins to affect the continuous wave output, and then realign for maximum
power. Repeating this process will eventually lead to mode-locked pulses. This procedure
was developed by theoretically analyzing the linear and nonlinear waists inside the cavity.
The theoretical model is discussed later in this chapter. Using this procedure we are able
to achieve between 125 - 140 fs pulses (autocorrelation width 220 fs). We did not optimize
for the shortest pulses, since this is not a crucial aspect of this experiment. The outputs
(CW and CCW) from the max-R reflector are detected on p-i-n photodiodes and are plotted
in Figure 3.2. Based on the discussion above, it is not too surprising that the laser is
unidirectional. What is surprising; however, is that the laser randomly switches direction.
The characteristic switching time can be varied from hundreds of microseconds to seconds,
depending on alignment, absorber dye concentration, and the number of bubbles in the dye
jet. Notice that the CW and CCW beams are never on at the same time and therefore there
Figure 3.2: CCW (upper) and CW (lower) outputs of laser demonstrating switching of laser output. Note the laser is unidirectional at all times. Detectors are p-i-n photodiodes with a bandwidth of 1 GHz, although the digitizing oscilloscope's bandwidth is 1 MHz.
73
is never a standing wave saturation in the dye. The average output power is approximately
the same in the CW and CCW directions at about 175 ± 10 mW.
3.6 Q-switched mode-locked pulses
Increasing the dye concentration results in an increase of the ratio of saturable to linear
losses. Therefore, one might expect to achieve bidirectional operation by increasing the
concentration of the absorber solution. Over an extremely large range, adding dye had no
qualitative effect to the output of the laser, which has been reported previously[56, 88, 89].
Eventually the continuous wave power began to decrease and finally shut off completely when
the losses exceeded the gain. At this level of dye concentration, the laser begins pulsating
rather erratically. By adjusting aperture Al the output becomes more periodic, but the
output on the photodiode was a factor of ten larger! In fact the output is Q-switched mode-
locked as can be seen in Figure 3.3. The inset of Figure 3.3 shows the mode-locked pulse train
underneath one of the Q-switched pulses. Notice that the Q-switched train is alternating
in each direction (one train clockwise, followed by a counterclockwise train, etc.). The
alternating output does not have a gyro response because the laser is unidirectional at any
given period of time. The autocorrelation width is 3.3 ps, corresponding to a pulse duration
of 2.3 ps (assuming Gaussian shaped pulses). The envelope of the Q-switched mode-locked
trains is 0.6 fjs and they are separated by about 4 fis. Since the lifetime of Ti:sapphire is 3.2
jits, the Q-switching is most likely a result of relaxation oscillations. Krausz[57] analyzed the
typical Ti:sapphire laser and came to the conclusion that it should not Q-switch. Our cavity
has increased linear and nonlinear losses which is significantly different than the theoretical
cavity analyzed by Krausz. Xing[90] has reported Q-switched mode-locked operation in a
Ti:sapphire laser that has a Q-switch period that is dependent on the translation of a curved
focusing mirror. Xing believes that the translation of this mirror affects the losses in the
cavity and therefore changes the cavity lifetime.
74
1.0-
% 0.5 o o fUUUU
n I ' i r
■190 -ISS .100 -71 -so
10 15 20 Time (us)
Figure 3.3: CCW (upper) and CW (lower) pulses demonstrating Q-switch pulses. The period of pulses varied from 4 to 7 /xs. The inset shows a subset of the mode-locked pulse train within the Q-switch envelope.
75
3.6.1 Passive negative feedback
One standard technique to stretch the Q-switched mode-locked train, while compressing the
individual pulses, is passive negative feedback [91]. As an alternative to the GaAs used as
a two-photon absorber in the Nd:YAG laser [91] we placed a 2-mm thick sample of CdS in
the cavity (see Figure 3.4) for an energy limiter. The 2-photon fluorescence of the CdS is
CdS
Ti:Al,0
SF-14 Prisms
Concentrated Dye-Jet
Figure 3.4: Experimental arrangement for bidirectional Q-switched mode-locked pulses.
clearly visible to the naked eye in a well lit room. With the highest dye concentration and
the energy limiter (CdS), the two pulse trains from each direction are in phase, see Figure
3.5. The photodiode measurement cannot resolve the crossing point of each pulse train. One
method to determine if the pulses are crossing in the dye is to combine the CW and CCW
outputs onto a detector and look for a beat signal. Initially a beat note of 2 kHz with a 2
kHz bandwidth was observed; after a significant amount of work and a clean dye solution a
beat note of 100 Hz was obtained, see Figure 3.6. This mode of operation has synchronized
pulse trains in opposite directions, and a gyro response. It may be of interest in experiments
requiring probing of samples with high intracavity peak powers. It is rather surprising that
the laser is able to 'remember' the phase between the CW and CCW pulse trains in between
Q-switched pulses. Recent theoretical results[92] predict that the laser is still mode-locked in
between the Q-switched pulse, albeit at a very small amplitude. These mode-locked pulses
in between the Q-switched pulses has also been confirmed experimentally[93]. Another
mode of operation, with continuous mode-locked trains, is described in the next section.
76
10 20 30 Time (^s)
40
Figure 3.5: CW and CCW outputs in Q-switched operation are temporally overlapped.
Kerr-lensing itself can be used to achieve negative as well as positive feedback. We use a
simple ABCD method to model the laser and include the nonlinearity of the sapphire by
inserting a lens matrix of the appropriate focal length [74]:
1 noirwQ /, nl (3.1)
a 8ri2Pd
where w0 is the waist in the sapphire, n2 is the nonlinear index of refraction, P is the peak
power, d is the length of the crystal and a is a constant on the order of 1 to 4. The constant,
a, is a result of approximating the Gaussian beam profile to a parabolic lens equation. If a
one-to-one correspondance is made in the Taylor series expansion, then the a-factor is 1. A
recent empirical fit found the value of a to be 1.723 [1, 2]. Figure 3.7 is a plot of the waist
in the 8 mm Ti:sapphire crystal. Clearly using the waist, w0, is not a good approximation
over the length of the crystal. We want to keep the analysis as simple as possible for rapid
calculations, so we would like to use only one thin lens to approximate the nonlinearity.
Equation 3.1 is a good approximation for small nonlinearities (P < Pa- (critical power)) and
77
to c D)
W 0) o
CO
CG
3.5
3.0
2.5
2.0
1.5
1.0
0.5
0.0
-0.5 0.000 0.005 0.010 0.015
Time (s)
0.020
Figure 3.6: Beat note of Q-switched pulses. Coupling is DC because the signal is pulsed. Notice the contrast is 60%. There are more than 3000 pulses in this plot and only 2048 data points. This undersampling explains the aperiodic nature of Q-switched pulses.
thin (d < z0 (Rayleigh range)) samples. For an infinitesimal slab, dz, the nonlinear lens is
given by:
no7cwA (z) 1 fnl —
1 fnt n0irw4 (z)
a8n2P dz a8n2P .
dz
(3.2)
(3.3)
The ABCD matrix method calculates the i beam parameter. From the beam parameter,
we extract the radius of curvature of the beam, i?x, and the beam waist, wx. The rest of
the beam characteristics can be calculated:
z\
w0
ZQ
+ 1 IÜ1
i+te£*y V Aßi
n0 7^
w(z) = w0\l + ^o,
78
Figure 3.7: Plot of the beam waist in the Ti:sapphire crystal. The length of the crystal is about 10 times longer than the confocal parameter.
Integration over the length of the crystal, d, from z\ to z2 yields:
Jnltotal
1
Jnltotal
1
a8n2P n07r
rz2
J Z\
dz 8n2P
Zl ^(z) noTTWQ jei
rz-2
J z-\
dz
a8n2P ZQ
UOTTUIQ 2
a8n2P Jdeff
ZQZ2 Z2
—^ ~ + arctan — A + zi \z0
ZQZI
4 + zl arctan £i
zo,
jnltotal n0TTWQ
Where deff is the effective length of the crystal. It is instructive to plot deff as a function of
crystal length. Figure 3.8 assumes w0 = .001 cm and z\ = 0, which means that the waist is
at the left edge of the crystal. For lengths longer than the Rayleigh range, the nonlinearity
approaches a constant. Typically the beam waist is near one edge of the crystal, such that
small changes in the beam parameters can translate into large changes in the nonlinear lens.
So far only the strength of the nonlinear lens has been discussed. As with any lens,
the location of the lens will also play an important role in determining the beam waist. The
location, f, of the nonlinear lens in the crystal is deteremined by calculating the centroid of
79
■g- 0.030-
.£> 0.025-
cö CD c 0.020- c
Z 0.015- o £ 0.010- O) c CD -J 0.005-
1 1 1 1 1 1 1 r™"i i i i | i i
a(*/4)z0'
- a = 1.723
w0 = .001 cm
z0 = .0223 cm
z, = 0.0
Waist is at left edge of crystal
> T> 0.000-
E 0. DO 0.04 0.08 0.12 0.16 O.i
Length of Crystal (cm)
Figure 3.8: Plot of effective crystal length versus actual crystal length. Note for lengths longer than the Rayleigh range, the effective length is approximately a constant, a is an empirically determined constant [1, 2].
the nonlinear lens:
z = I w(zy
■dz
I
/ Zl
w{zy -dz
1 + (i)' Z2
I Zl
dz
-Az
1 + (i):
2 {zl + z\) 2 {zl + zl)
So 2
zpzi (-¥B? + arctan (?) - -f^ arctan ( a *0
- s 2 {zl + zl) 2 {zl + zl)
deff
Figure 3.9 is a plot of (I - z), the location of the nonlinear lens with respect to the center
of the crystal, as a function of the location of the crystal with respect to the beam waist.
80
T~ r-i i i | i i i i [ i i ■ i | i i i ■ | ' ' ■ ■ 1 i i i i |
Figure 3.11: Theoretical graph of linear and nonlinear cavity waists plotted versus distance in the cavity. The distance is measured from the center of the Ti:sapphire rod in the CCW direction. Al is the location of the Kerr-lens aperture. A2 is the location of the aperture for passive negative feedback. The plot begins and ends in the Ti:sapphire crystal.
83
pulses. It should be pointed out that the location of Al is chosen very carefully, such that
the continuous-wave waist and the mode-locked waist occur in the same location in the cavity.
This procedure will only work for the setup specified in Figure 3.11. As the aperture at A2
is closed the autocorrelation decreases in height and increases in width, just as predicted.
Suddenly the autocorrelation will drop to fixed lower level and become more stable. The
laser is now operating bidirectionally. The autocorrelation traces shown in Figure 3.12 were
obtained immediately after one another with the only change in the experiment being the
closing of aperture at A2 by about 0.05 cm, which results in bidirectional operation. Notice
Figure 3.12: Background free intensity autocorrelation. Traces obtained immediately after one another, only slit A2 was closed by 0.05 cm for bidirectional operation. The dashed lines are a Gaussian fit to the autocorrelation. The Gaussian pulsewidths are 220 fs for unidirectional and 420 fs for bidirectional.
that the pulsewidth has increased a factor of 2 (measured to be 420 fs) and the pulse height
has decreased by a factor of 9. The autocorrelator was a type-II KDP crystal configured
for background free intensity autocorrelations. The output of the photodiodes is shown
in Figure 3.13 in stark contrast to the unidirectional output in Figure 3.2. There are still
about a dozen dropouts in 5 seconds, but this is acceptable for many applications. The
dropouts are a result of the laser switching to unidirectional operation, which may be a
result of intensity fluctuations. Replacing the hard apertures (razor blades) with apodized
84
0.3
0.2-1
° 01 ü
0.0 0.3
0.2-
Ü 0.1
0.0
-i—i—i—i—i—i—i—i—r-
»'"'*■ HuUfJl»*' ■*'"J
M L^
-■—i—■-
-i—i—r-
tr ■h~r lylft^^i
T .U-T-
-i—i—|—i—i—i r |—i—i—i—i—i—i—i—
1 2 3 Time (seconds)
—|—i—i—i—r-
4
Figure 3.13: CCW (upper) and CW (lower) output demonstrating the lack of switching as compared with Figure 3.2. The detectors and time base are the same as Figure 3.2. The dropouts are a result of unidirectional operation, which explains why the spikes are negatively correlated.
apertures may result in more stable operation. We also verified that A2 could be located
at two other locations in the cavity: at 70 cm and at 120 cm (see Figure 3.11).
Our application is to use the ring laser for sensitive intracavity phase measurements [94,
76]. So we once again measured the beat note by combining the CW and CCW pulses on a
slow detector. The beat note demonstrated good sinusoidal character (see Figure 3.14) for
short periods of time (milliseconds); however, a 15 minute average collected on a frequency
spectrum analyzer showed a bandwidth of 10 kHz. To our surprise the beat frequency was
about 70.8 kHz in Figure 3.14 and could be varied from about 20 kHz to 150 kHz depending
on alignment. The high beat note is surprising because we had earlier measured a beat note
of 100 Hz in a Ti:sapphire linear cavity[94, 95] and 10 Hz in a Ti:sapphire ring dye laser (see
Chapter 2).
We again returned to the numerical model and assumed that the energy in each
pulse increased by 10-20% as it passed through the gain medium. The figure of 10-20% is
estimated by measuring the power reflected off of all Brewster surfaces inside the cavity and
85
■1 .0 100 200 300
Time (|i s ) -"—>—>—i—~<~—>—'—r -i—■—r"
v = 70.8 kHz FWHM = 7.3 kHz
200 400 600 800
Frequency (kHz)
4 0 0
10 0 0
Figure 3.14: Difference frequency of the combined CW and CCW pulses. The Brewster reflections from two prisms are recombined after an appropriate delay onto a slow detector.
86
assuming 5-10% scattering loss from the mirrors, absorber jet, prisms and apertures. For
Kerr-lens mode-locking, the waist has to be located asymmetrically within the gain medium
to optimize the nonlinear lens. Because both the power and the waist vary as the pulse
travels through the gain, the change in the index of refraction will be different for the CW
and the CCW pulse. Figure 3.15 will help clarify the difference in the nonlinear phase
Wr
P0+AP
'max
P0+AP
Figure 3.15: Beam waist in Ti:sapphire crystal. The upper equations apply for the CW pulse, and the lower equations are for the CCW pulse. Because of the asymmetry, the peak intensity will be less for the CW pulse.
shifts. The equations in Figure 3.15 that are above the beam waist are for the CW pulse
and the equations below the waist are for the CCW pulse. Notice that the peak intensity
is greater for the CCW pulse than for the CW pulse, which translates into a greater change
in index for the CCW pulse. This slight difference in the index of refraction will result in a
slight difference in the optical path length of the cavity, which shifts the longitudinal mode
spacings. The beat frequency, Av, resulting from a change in the perimeter, AP, of a ring
laser is given by:
Av _ AP ~v~~^P~
v Av = —n2AIvead
87
_ un2APpeak£ P-KWQ
. vn2APpeak2.7zo Av — 9
Av
A
ZVTl2^-t^ave Tround—trip
JLA I puls
2vn2APave P Av —
se
Av =
XrC Tpui
2n2APa
A TpuXs
2 (3 x 10"16^) (0.22W) Av = —^ 5—^ ~ 70 kHz
(8 x 10"5cm)2 (.4 x 10"12s)
where v is the optical frequency and P is the perimeter of the ring cavity. The
numerical model predicts a beat frequency of 50 - 150 kHz for the cavity described above,
which agrees well with the beat note observed in the laboratory. The beat frequency in the
numerical model was strongly dependent on the cavity parameters, as was the laser in the
laboratory
The fact that a first-order cross-correlation produces a beat note, implies that the
pulses are crossing in the dye jet. The first-order cross-correlation does not give much
information about the jitter in the crossing point. To determine the jitter in the crossing
point we used a second-order non-interferometric cross-correlation. It is convenient to use
the pulses from the first-order cross-correlator (the beat note detector) for the second-order
auto and cross-correlations, see Figure 3.16 for the experimental arrangement. When the
A/2 waveplate is in position A, the CW (CCW) autocorrelations can be recorded by blocking
the CCW (CW) beam in the first-order autocorrelator. To record the second-order cross-
correlation, the A/2 waveplate is moved to position B. The second-order cross-correlation
is shown in Figure 3.17 as the solid line. Also plotted in Figure 3.17 are the CCW and CW
autocorrelations. Although this graph doesn't resolve the differences in the pulsewidths, an
average of many pulsewidths showed the CW pulse to be slightly shorter than the CCW
pulse and the cross correlation was on average in between the CW and the CCW pulses.
This implies that there is very little jitter in the crossing point of the CW and CCW pulses.
88
cw Cavitv Mirror 1/
CCW
t Delay
-1 Wm A A,,
I h\ V r< ^t
>v B /
A
* »
4
Second-Order Auto/Cross T
KI
yp
w e-II
Correlations v_w ™i
Figure 3.16: Setup for beat note detection, auto and cross correlations. The A/2 waveplate at locations A and B control the auto and cross correlations, respectively. The beam combiner for the beat note detection is a 50/50 beam splitter, while the beam splitter/combiner for the auto/cross correlator is a polarizing beam splitter.
89
—i—i—i—i—i—i—i—i—i—i—i—i—i—i—i—i—■—i—'■■ [—I—1—1—1—1—1—1—1" I 1
orm
aliz
ed;
bo
b
/ \
Cross CCW • CW
-
i, ü.ö /•* ;\ ü
o 0.4 E i_
X 0.2 ■
8 o-o CD . 1 . . 1 1 _.1_1—1—1—1—1—1—1—1—1—1—1—1—1—1—1—1—1—1_
Figure 3.17: Auto and cross correlations of CW and CCW pulses. The cross correlation lies between the autocorrelations of the CW and CCW pulses, which implies no timing jitter between the pulses with a margin of error of 30 fs.
90
The maximum amount of jitter is 30 fs, which is a statistical error from the fluctuations in
the individual pulsewidths. If we assume Gaussian pulses with durations rx and r2, the
cross-correlation is given by:
J — c
-21—1 -2 [ -] -2 e
T*J e V r2 7 cfö = e ri+T2
Notice that if ri = T2, we recover the autocorrelation and the y/2 factor in the pulsewidth.
For our experiment, we define:
CW Autocorrelation width = Vz rc
CCW Autocorrelation width = v2 rc
CU>
Cross-correlation width = \JT\W + r CCW
If TCW < TCCW then the order of correlation widths will be CW-autocorrelation < cross-
correlation < CCW-autocorrelation.
This concludes the study of the first Kerr-lens mode-locked femtosecond ring laser
gyro. In the next section, we will remove the absorbing dye jet and replace it with a
nonlinear crystal. This new method of establishing a crossing point in a Kerr-lens mode-
locked ring laser is called the mutual Kerr-lens effect.
3.8 Mutual Kerr-lens mode-locked
3.8.1 Introduction
The absorbing dye jets discussed in the previous chapters and sections have a few disadvan-
tages compared to an all solid-state system. It is not practical to put a dye jet into a remote
object (like a satellite) for rotation sensing because of the high maintenance of the dye. The
dye jet is a thin (< 100 pm) ribbon that is free to move. A moving dye jet can result in
increased noise in the beat note, and can limit the ultimate sensitivity of the device.
Another disadvantage to the dye jet is called pulse dropout, which is a result of bubbles
in the dye jet which cause the laser to shut off for a moment. Pulse dropouts will also limit
the sensitivity of the device. The laser may turn off for /xs to ms. When the laser reaches
91
threshold again, there is no memory of the phase of the previous beat note. Therefore, at
every pulse dropout there will be an arbitrary phase jump in the beat note. These arbitrary
phase jumps will limit the device's sensitivity by adding bandwidth to the beat note.
For these reasons it would be advantageous to move to a solid-state laser system.
Since all of the experiments in this dissertation involve an Ar+ laser, none of these systems
are 'all solid-state.' However, most of the experiments presented here could be moved to
an all solid-state system by replacing the Ar+ with a solid state system such as: a diode
pumped, frequency doubled, continuous wave, Nd:YAG laser; a diode pumped, mode-locked,
Nd:YAG laser; a diode pumped Cr:LiSAF laser; or perhaps simply a diode system. One solid-
state system has already been presented in Chapter 2, the solid-state saturable absorber.
Next we will discuss the solid-state system that uses and mutual Kerr-lens mode-locking to
stabilize the pulse crossing point. The OPO is also an all solid-state design, but because no
experimental data was recorded for the OPO during this dissertation work, the OPO design
will be discussed in Chapter 4.
3.8.2 Theory
The formation of multiple pulses in the Ti:sapphire laser is well documented[96, 97] and was
observed in our lab[97]. Multiple pulses are difficult to control experimentally, but seem to
depend on having low output coupling, because the soliton model predicts a quantization of
the soliton amplitude. The multiple pulses have previously been reported as higher order
solitons[96], which also supports our experimental findings that multiple pulse operation
requires low output coupling. Jeff Nicholson recently modeled some experimental work done
by Ming Lai concerning multiple pulses inside the laser cavity [97]. His simulations showed
that it is possible to have an enhanced Kerr-lens if the pulses collide in the Ti:sapphire.
Another group has also verified this same theoretical result [98]. This is a surprising result
because the mutual Kerr-lens should be much smaller than the self Kerr-lens. In air a 100
fs pulse is 30 /xm long, which will be stretched to 53 /zm inside the sapphire. The colliding
pulses will only have an interaction length of 100 fjm. When you compare this to the 8
mm length of the crystal, the colliding term should only be approximately 2.5% of the single
The factor of 2 is a result of averaging the electric fields interfering in the crystal (the
intensity periodically varies from 4xIntensity to zero). Since the Kerr-lens has only a small
effect on the cavity parameters, it is hard to believe that an additional 2.5% would have any
noticeable effect.
A complete analysis will require the ABCD matrix calculation and a little more care
than the estimation above. For bidirectional operation to be stable, we require bidirectional
pulses to experience less loss than: 1) single-pulses, 2) continuous-wave operation, 3) double-
pulses in the same direction. Because the lifetime of Ti:sapphire is much longer than the
round-trip time, it is assumed that the total energy extracted from the cavity in one round-
trip is constant regardless of the mode of operation. For a 'best-case' scenario, let us
further assume that the pulsewidths are equal (from the previous work this is not such a good
assumption). Together these assumptions require that the peak power in the bidirectional
case be less than half the power in the single-pulse case. The nonlinear index is also modified
by the colliding pulses:
L^TICCU) = n<i ylccw ~T ^-icw)
£±ncw = 7T-2 \J-cw i ^i-ocw)
The factor of 2 in front of the counter-propagating beam is a result of the pulses being
distinguishable[99, 100]. By assuming: 1) equal intensity in the counter-propagating fields,
2) similar waists and 3) the pulsewidth is approximately the width of the crystal yields:
Therefore there is ample room in the nonlinearity to distinguish between single-pulse opera-
tion and bidirectional operation. For a laser gyro, we require that the pulses cross outside of
the gain medium to prevent lock-in from scattering off a gain grating in the Ti:sapphire. To
enhance the mutual Kerr-effect, we chose a high n2 crystal, ZnS, which has a nonlinear index
93
0.
0.
0.
_ 0.
I o. .«! 0. as £ 0.
0.
0.
-0,
16-
14-
12-
10-
08-
06-
04-
02-
00-
02-
' I ~■"
■continuous-wave single-pulse double-pulse
100 150 200
Position (cm)
300
Figure 3.18: Beam waist as a function of position in the cavity. The calculation begins and ends in the Ti:sapphire crystal, TiS. Three different cases are plotted: continuous-wave, single-pulse and bidirectional pulses.
about 50 times that of Tksapphire. We return to the ABCD matrix method to determine
where the slits should be located for bidirectional operation. We expect the simulation to
only yield qualitative results because of the numerous approximations. Figure 3.18 is a plot
of the beam waist as a function of position in the cavity. Notice that a slit at position B will
increase the losses for continuous-wave operation (positive feedback) and slits at position A
will limit single-pulse operation (negative feedback). Judicious use of these two slits should
yield bidirectional pulses.
There are differences in the linear laser analyzed theoretically[98, 97] and a bidirec-
tional laser. Often when the output coupling is low, pulse splitting can be observed in a
Kerr-lens mode-locked laser. The satellite pulse separates from the main pulse because its
effective group velocity is lower [97]. Eventually, the satellite pulse will meet the main pulse
in the Ti:sapphire crystal. The mutual Kerr-lens effect will stabilize the satellite pulse, such
that it collides with the main pulse in the Ti:sapphire crystal. This situation is very different
94
from a bidirectional laser with the pulses colliding in the Kerr medium. We do not expect
the system to evolve from a single pulse regime to a bidirectional regime. The bidirectional
laser must be initiated in the bidirectional operation. For this reason, we tested the mutual
Kerr-lens mode-locking in the linear cavity first.
3.8.3 Experimental results
In the linear cavity discussed in Chapter 2, we replace the dye jet with a 3 mm crystal
of ZnS. From earlier experiments with Z-scan in optics lab, it was determined that ZnS
has the highest nonlinearity with the lowest 2-photon absorption at A = 800 nm. The
nonlinear loss is low because the bandgap is at 3.6 eV which is beyond the 2-photon energy
of the Ti:sapphire pulses (3 eV). The close proximity of the two-photon energy to the
bandgap enhances the effective %3, although the interaction remains parametric (no energy
is transfered to the crystal) [101]. We expect the laser to mode-lock easily, since Radwiecz at
Oklahoma State University[102] showed that ZnS is an excellent crystal to use for Kerr-lens
mode-locking. Because the ZnS is used to mode-lock the laser, the Tksapphire crystal is
allowed to be tuned independently for maximum power. Also the x3 nonlinearity in ZnS is
roughly 50 times the nonlinearity for sapphire, which means the mode-locking threshold will
be much lower. After establishing mode-locking, we search for double pulses by scanning
the end mirror, which is mounted on a translation stage (see Figure 3.19).
Double pulses were observed over a broad range of end cavity placements (up to 0.5
cm). Although it is easier to achieve double pulses in this experimental setup (in comparison
to the dye jet), they were less stable and the pulse train typically had approximately a 10%-
20% ripple. With careful alignment and the use of slits to control the spectrum, a very quiet
mode of operation is attained. Although the noise was not measured, it appears to be a
result of the fluctuations of the Ar+ laser. Unfortunately this mode of operation is close to
lock-in, so the observed beat note varies from zero (locked) to several kHz (strongly pulled)
depending on alignment. Only when the table is violently rocked (creating a frequency
difference of several kHz), does a beat note appear for a short period of time. There is
a significant amount of blue second-harmonic generated by the ZnS, some of these beams
were at odd angles to the ZnS. In particular, a blue beam emanates from the ZnS at normal
95
-Translation Stage SF-14 Prisms
\
Figure 3.19: Experimental setup for mutual Kerr-lens mode-locking in ZnS. The ZnS crystal is 3 mm long and at Brewster's angle. The cavity fold mirrors all have a radius of curvature of 10 cm.
incidence only when the pulses are colliding in the ZnS. This unexpected blue beam aids in
the alignment for bidirectional operation.
The bidirectional ring laser (see Figure 3.20) is more difficult to align and typically
ZnS SFG RSSH
Figure 3.20: Experimental arrangement for mutual Kerr-lens mode-locking. The bidirec- tional pulses meet in the ZnS crystal.
requires a 'kick' to start the laser in the bidirectional mode, although self-starting operation
was also observed. Operation with and without prisms was demonstrated in two different
lasers. The laser is aligned by maximizing the blue light normal to the ZnS crystal. When
96
the laser is not mode-locked the blue beams are barely visible, but when it mode-locks bidi-
rectionally, the blue beams can be see even with the room lights on. Once the bidirectional
operation is achieved, slit A in Figure 3.18 is closed slightly to stabilize the bidirectional
pulses.
The beat note is difficult to locate and initially consisted of what sounded like 'white
noise.' Further alignment and closing of slit B resulted in a more stable pulse train and
a discernible beat note as shown in Figure 3.21. In Figure 3.22 the top plot is the CCW
intensity and the bottom is the beat signal. Notice that the beat frequency appears in the
CCW intensity. This modulation of the intensity is predicted in the lock-in equation when
the beat frequency is close to the lock-in frequency.
1.0-
-i—i—i—i—i—i—i—i—i—i—r
19Feb98b CW-CCW pulses ZnS No Prisms
-■—i— 0.005
1 1 1 1 1 1 1 r-
0.010 0.015 0.020
Time (s)
Figure 3.21: Beat signal versus time demonstrates the evolution of the interferogram from locked to a frequency of about 8 kHz.
Figure 3.23 is a plot of the normalized FFT of the beat signal shown in Figure 3.22.
Even though the quality of the beat signal looks poor, the FWHM of the beat frequency is
only 85 Hz. The second harmonic of the beat signal is easily identified, yielding a geometric
ratio,
Amplitude of 2nd Harmonic Amplitude of Fundamental
= 0.032
97
0.026 0.027 0.028
Time (s)
9Feb98D ZnS No Prisms
0.030
Figure 3.22: CCW signal (top) and beat note (bottom). Notice that the beat frequency appears as an amplitude modulation on the CCW pulse train.
The lock-in frequency is calculated to be:
2pr = 500 Hz
(1 - r2)
Recall from Chapter 1 that p is the pulled frequency. The calculated lock-in frequency
appears too low, because the intensity is modulated (see Figure 3.22) at the beat frequency
(8 kHz) which normally only occurs near the lock-in frequency. The modulation could be a
result of nonlinear dynamics other than lock-in; perhaps a result of the large Kerr nonlinearity
in the ZnS. Perhaps another explanation might be the large self-phase modulation, SPM,
in the ZnS, which can generate new frequencies at both the upper and lower end of the
pulse's spectrum. To check the stability of the pulse crossing point, auto/cross correlations
were preformed on the laser. The geometry used for the correlations is the same as Figure
3.16. The pulsewidths of the CCW and CW pulses trains are 18.6 and 22.6 ps ± 0.13 ps,
respectively. These are, to the best of our knowledge, the longest Kerr-lens mode-locked
pulses ever reported. Based on the autocorrelations, the minimum cross-correlation is 29
ps, which is slightly larger than the actual cross-correlation of 28.1 ps ± 0.1 ps. Systematic
errors on the order of 0.5 ps can explain why the cross-correlation is less than the minimum
predicted by the autocorrelations. A possible source of these errors is the fact that the laser
98
1 -i
T3 •*± "5. E <
0.1
0.01
1E-3
1E-4
f = 8247 Hz FWHM = 85 Hz
19Feb98d FFT of Beat Signal ZnS No Prisms
f2nd = 16,495 Hz Amplitude = 0.032
5000 10000 15000
Frequency (Hz)
20000
Figure 3.23: Normalized FFT of the beat signal in Figure 3.22. The second harmonic of the beat signal is easily identified and yields a geometric series ratio, r = .032.
turned off and had to be restarted at least twice while the data was recorded. Because of the
strange dynamics, we also recorded the spectra of the CW and CCW pulses, see Figure 3.27.
The spectra are a little surprising because the average wavelengths differ by almost 2 nm.
Because the beat note detection compares only the same longitudinal modes, the shift in the
spectra will not prevent the device from measuring a gyro response. The wavelength offset is;
in fact, rather serendipitous because it will allow us to determine the origin of the mysterious
blue light. The frequency difference can only be the result of a nonreciprocal optical element
in the laser. Since the ZnS is the only new element, the nonreciprocal frequency shift must
originate in the ZnS crystal. Perhaps the four-wave mixing (discussed in Chapter 1), which
is frequency shifted by the frequency difference is the culprit. If this laser is deemed a viable
laser gyro, then the frequency shift will need to be investigated further. The widths of the
spectra are: 2.65 and 2.5 nm ± .04 nm for the CCW and CW pulse trains; however, the
resolution of the monochromator was only 0.4 nm. The deconvolution of the spectra with
the monochromator resolution yields a frequency bandwidth of: 1.24 and 1.17 THz for the
CCW and CW pulses. The time-bandwidth products are: 23.0 and 26.4 ± .2 for the CCW
and CW pulses, these time-bandwidth products are an amazing 55 times the transform limit
for Gaussian pulses. Again a possible explanation is the large amount of SPM in the ZnS
99
-50 -40 -30 -20 -10 0 10 20 30 40 50 Delay (ps)
Figure 3.24: Autocorrelation of the CCW pulse train. The pulse width is calculated to be 18.6 ± .08 ps.
which would push the frequency away from line center. We are currently working on an
experiment to mount the ZnS on a piezo-electric transducer, in order to randomize the phase
of the scattering elements. This motion is perpendicular to the beam, similar to the motion
of the dye jet. Theory [29] predicts that randomizing the phase of the scatters is identical
to a random, null-bias dither (see Chapter 1).
3.8.4 The mysterious blue light
A total of 8 beams of blue light was seen by the naked eye to emanate from the ZnS. ZnS
has cubic symmetry, so the index of refraction in the crystalline planes is nearly identical
and therefore birefringent phase matching is not possible. We used two crystals for these
experiments, the first is a 3 mm polycrystal and the second a 1 mm X-cut single crystal.
For the picosecond laser without prisms, the 3 mm crystal works much better because of
the greater nonlinearity. Figure 3.28 is a sketch of the geometry of the blue beams. The
ZnS crystal is at Brewster's angle inside the Tksapphire cavity The beams labeled RSSH
and TSSH correspond to reflected and transmitted surface second-harmonic [103]. Collinear,
non-phased matched second-harmonic is beyond the critical angle for total internal reflection
and is trapped inside the crystal. The beams labeled SFG are much brighter (about a factor
100
1.0
0.8
0.6
S 0.4 CO
E o 0.2
0.0
■ i i i ■ i ■ ■ i i ■ ■ i i ■ i i i i i i i ' ■ ' i ■ CW Autocorrelation
Figure 3.25: Autocorrelation of the CW pulse train. The pulsewidth is calculated to be 22.6 ± .13 ps.
of 100) when lasing bidirectional compared to continuous-wave lasing. The SFG beams
completely disappear when the laser is running unidirectional. The SFG beams provide
a convenient means to monitor the bidirectionality of the laser. For the 3 mm crystal,
there are actually two beams at the SFG that are separated by about 6.4°, the secondary
beam is a result of a small wedge in the crystal. To within a few degrees, the SFG signal
emanated normal to the surface of the ZnS. The SFG beams are a result of the mixing
of the fundamental in one direction with the Brewster's reflection from the other direction.
This explanation resolves all of the mysteries associated with the SFG beams: 1) they only
appear when bidirectional, 2) they emanate normal to the crystal, 3) the SFG beams from
the fs laser were significantly weaker than the picosecond laser (the pulses are not colliding
at the surface). Figure 3.29 is a schematic of the beams generating the SFG beams. To
confirm that the mechanism is sum frequency generation, we compared the spectra of the
surface-second harmonic to the SFG. Figure 3.30 is a plot of the spectra of the SSHG from
the CW and CCW beams and the spectrum of the SFG beam. Notice the SFG lies in
between the SSHG signals. This plot verifies that the beams are indeed a result of SFG.
As a precautionary measure, all possible four-wave mixing geometries were also considered.
A total of 12 different possible (not probable) wavevectors were compared for energy and
101
1.0- ' " ' C'röss-dör'refätiorl ■■■<■■■<■■■.
Sig
nal
o
o
CD
CO
f\ T3 <» .£! 0.4-
J Data: 21FEB98X \
O 0.2- Ji Model: Gauss ^L z jf ChiA2 = 0.00031 ^t
0.0- ^^T w = 28.09 ± 0.085 ps ^^fc^* A = 33.6 ±0.13
1 ■ ■ i ■ ■ ■ i ■ ■ ■ i ■ ■ ■ i ■ ■ ■ i ■ ■ ■ i ■ ' ■ i ' ' ■ i ■ ■ ' i ' ' ' -50 -40 -30 -20-10 0 10 20 30 40 50
Delay (ps)
Figure 3.26: Cross-correlation between the CW and CCW pulses. The minimum width predicted from the autocorrelations is 29 ps.
momentum conservation.
k 4 = k i+ k 2+ k 3
The closest match had a wavevector mismatch of |^| ~ 0.2, which is a bit too large to be
probable.
3.9 Conclusions
We demonstrated the first Kerr-lens, optically limited femtosecond ring laser, where the Kerr-
lens is used both for Kerr-lens mode-locking and for optical limiting. A simple numerical
model correctly predicts the proper location for the Kerr-lens aperture and the aperture for
optical limiting. The model also correctly describes the observed beat frequency and the
location of the third waist in the cavity. We also report the first beat note from a Q-switched
mode-locked laser, which was attained by using a saturable absorbing dye jet in conjunction
with a solid-state 2-photon absorber. We also note that the Q-switched operation may be
an efficient way to obtain higher peak energies from a Ti:sapphire laser[104].
A novel method, called mutual Kerr-lens mode-locking, is demonstrated for the first
time. Mutual Kerr-lens mode-locking defines the crossing point of the counter-propagating
102
1.0-
>,0.8H
B 0.6
I 0.4 CO
E o 0.2
0.0-
23Feb98 ZnS No Prisms
788 790 792 794 796 798 800 802 804
Wavelength (nm)
Figure 3.27: Spectra of CW and CCW pulse trains. The FWHMs are 2.5 and 2.65 ± .04 nm for the CW and CCW pulses. The resolution of monochromator is 0.4 nm.
waves in a ring laser gyro without the use of a saturable absorber. We have also discovered
that SFG can be used to monitor the bidirectionality of the mutual Kerr-lens mode-locked
ring laser.
103
SFG RSSH
TSSH-« ► TSSH
RSSH SFG
Figure 3.28: Schematic of blue beams eminating from ZnS crystal. The beams are identified as: reflected surface second-harmonic (RSSH), transmitted surface second-harmonic (TSSH) and sum-frequency generation (SFG).
104
Figure 3.29: Wave vectors involved in SFG (Sum Frequency Generation). The beams are mixed in the intracavity ZnS crystal. The larger beams are the strong, intracavity fundamental beams. The weaker solid beams are the surface reflection of the fundamental. The dotted lines are the SFG beams.
Figure 3.30: Spectra of CW and CCW surface second-harmonic and the spectrum of sum frequency generated normal to the ZnS crystal.
105
Chapter 4
Future Work
The previous chapters highlighted many of the difficulties in developing a solid-state laser
gyro. Our efforts in building a pulsed solid-state laser gyro paved the way for modern
solutions to some of the problems facing the solid-state laser gyro. The principle problems
are interaction of the counter-propagating pulses in the gain medium and removal of the
arbitrary bias. The gain problem is solved by an OPO, which has a lifetime equal to the
pump pulse duration, and therefore no interaction between pulses. The bias problem is
resolved by a novel method of removing the bias using a switchable figure-8 laser. This
chapter also contains other experiments that could be explored with a pulsed ring laser gyro.
Many would make excellent Master's Degree thesis and others could be (or are being) used
for Ph.D. dissertations. Some, like the Ti:sapphire initiator and the Bidirectional OPO Ring
Gyro (BORG), have been researched quite extensively and have been submitted for patents.
Because the OPO has the potential to exceed the limits of the current HeNe lasers, most of
this chapter is devoted to the design of the BORG. The chapter ends with a postmortem
of experiments that didn't turn out like we had planned.
4.1 OPO
4.1.1 Introduction
The seemingly insurmountable problem with bidirectional pulsed ring lasers is gain compe-
tition. If the lifetime of the gain medium is greater than the cavity round-trip time, then
there will be an interaction between the two pulses. The pulses will be competing for the
same gain. Since most solid-state lasers have a long lifetime, it would seem that the phrase,
bidirectional solid-state, must be an oxymoron. Only when extreme measures of control-
ling the pulse energy are put in place (see Chapter 3), can there be any hope of achieving
a bidirectional solid-state laser. Does a solid-state system exist that has a lifetime much
shorter than the cavity round-trip time? Yes, Optical Parametric Oscillators (OPO) have
the unique characteristic of almost no lifetime. The gain in an OPO is present only when
the pump pulse is present. Although an OPO is technically not a laser, because the gain is
not a result of stimulated emission, but rather a result of frequency down-conversion, it still
behaves like a laser. The frequency of the signal and idler pulses in an OPO are determined
by the phase matching condition AND by the cavity modes of the OPO. This is similar to a
laser where the overall gain bandwidth is defined by the atomic or molecular transitions and
the actual lasing frequency is matched to the cavity mode. OPOs have also demonstrated
less noise than the Ti:sapphire laser pump[105], squeezed states[106] and simple stabilization
schemes[107]. All of these could be beneficial to a sensitive gyroscope.
There are several different ways to implement bidirectional pulses in an OPO. The
simplest is to split the pump beam using a 50/50 beam splitter and pump the nonlinear
crystal from both directions. One of the pump pulses can be delayed with respect to the
other such that the pulses in the OPO meet ONLY in air. This is in sharp contrast to all
other methods presented in this dissertation. The methods mentioned earlier all required
that the pulses collide in either a saturable absorber or in a Kerr medium. Because there is
no gain competition and crossing points only in air, the OPO system will work reliably with
no coupling between the CW and CCW modes.
Although any synch-pumped[108] OPO would work, there are some special consider-
ations for short pulse operation. We will concentrate our efforts on a noncritically phase-
107
matched[105] system because these are easier to align. Possible crystals include KTP[109]
and its isomorphs (CTA[110] and RTA[111]), LiB305 [112, 113], KNb03 [114] and more
recently PPLN[115, 116].
4.1.2 Spatial walk-off
Spatial walk-off occurs when the Poynting vector is not parallel to the k-vector [117]. Perhaps
a better way to say the same thing is that the energy of the pulse travels in a different
direction than the phase front. Or there is a tilted phase front. All of these statements say
the same thing. Spatial walk-off reduces the gain in an OPO because the spatial overlap
between the three interacting waves becomes smaller as one or more of the pulses moves
laterally away from the other pulses. Spatial walk-off is particularly detrimental when the
beams are tightly focused. One way to completely avoid spatial walk-off is to use noncritical
phase matching. Noncritical phase matching occurs when all of the polarizations line up on
principal axes. For example in a negative uniaxial crystal the pump's polarization might
be along the fast axis and travel as ne while the signal and the idler would be along the
optical axis and travel as n0. Note that the pump is traveling as ne not as ne(6), because
6 = 90° and the wave travels purely as an extraordinary ray. In a biaxial crystal, such as
KTP, noncritical phase matching can occur by having the pump and signal's polarization
along the ny principal axis and the idler along the nz principal axis.
4.1.3 Temporal walk-off
Temporal walk-off occurs in a short pulse OPO when the group velocities of the pump, signal
and idler are different[118]. Because one pulse is traveling faster than the other two, the
overlap integral of the pulses will diminish as the pulses propagate through the material. It
is possible to delay or advance the resonant signal pulse such that its overlap with the pump
will create pulse shortening. The effective length of the crystal is reduced by the temporal
walk-off. To calculate the effective length of the interaction, simply calculate how far the
pulses travel for the temporal separation to be equal to the pump pulse width. Note that
this is an approximation and it tends to calculate an interaction length that is 30% too small.
108
One explanation is that the pulsewidth of the signal is often square shaped and significantly
longer than the pump pulse. A longer signal pulse would lead to a longer interaction length.
Tpuise = pump pulse width
Vgi = group velocity of the pump, signal or idler
V12 = inverse group velocity difference between waves 1 and 2
Vl2 = JL _ -i- Vgl vg2
Leff ~ ~^-
In the case of noncritically phased matched KTP:
Leff = .051 cm between the pump and signal
Leff = .055 cm between the pump and idler
Leff = .035 cm between the idler and signal
4.1.4 Spectral bandwidth
A short pump pulse will have a wide spectrum. It is important to consider the phase
matching bandwidth. A 100 fs Ti:sapphire pulse will have a bandwidth of about 10 nm.
Since we are considering noncritical phase matching, spectral bandwidth is not a problem
as can be seen in the tuning curve, Figure 4.1.
4.1.5 Tuning
The major disadvantage to noncritical phase matching is that the tuning is difficult and is
typically accomplished by tuning the pump wavelength. Figure 4.1 is a plot of the signal
wavelength as a function of the pump wavelength for noncritical phase matching.
4.1.6 Alignment
Alignment is easy for a noncritically phase matched OPO because the pump, signal, idler
and non-phase matched second harmonic are all collinear. The non-phase matched second
harmonic is visible to the naked eye and can be threaded through the OPO cavity. The
difficult part is to match the cavity length of the OPO to the cavity length of the pump for
synchronous operation. This is accomplished by careful measurement of the cavity lengths
109
g>
1.22 ' ! '
1.20
1.18
■/*■■■ -
1.16
1.14
1.12
1.10
1.08
■
• • ■
. 0.76 0.78 0.80 0.82 0.84
Pump Wavelength urn 0.86
Figure 4.1: Tuning curve of signal wavelength as a function of pump wavelength for noncrit- ical phase matching in KTP
and then translating one of the mirrors to achieve threshold. It is possible to see fringes in
the generated blue second-harmonic when the cavity length of the OPO matches the cavity
length of the Ti:sapphire laser, although this region is only as long as the pulsewidth.
4.1.7 Double pulse operation
For experiments that are measuring a change in the index of refraction of a medium, such
as those discussed in Chapter 2, it is not necessary to have bidirectional operation. In fact
there are some advantages to using a double pulsed cavity, see Chapter 2. For the OPO,
double pulses are trivial to attain - simply make the OPO cavity twice as long as the pump
cavity. This can be implemented in either a ring (see Figure 4.2) or in a linear cavity (see
Figure 4.3). One disadvantage to the linear cavity is that the internal loss is twice the loss
of the ring because the signal passes through the nonlinear crystal without the pump on the
way back. Other pump schemes could be employed which could use a pump pulse to pump
a nonlinear sample (see experiments below).
4.1.8 Bidirectional operation
The simplest way to obtain bidirectional operation is to split the pump beam using a 50/50
beamsplitter and pump the nonlinear crystal from both directions (see Figure 4.4). If the
110
KTP
Laser
Figure 4.2: The cavity perimeter is 4 times the length' of the pump cavity, which produces two OPO pulses in the OPO cavity. The ROC of the curved mirrors is 10 cm concave. The curved mirrors are max-R at the signal wavelength and high-T at the pump and idler wavelength.
Beat Note
Detection
Figure 4.3: The OPO cavity is twice as long as the pump cavity, therefore there will be two pulses in the OPO cavity. ROC of curved mirrors is 10 cm concave. The curved mirrors are max-R for the signal and high-T for the pump and idler.
Ill
threshold of the OPO is higher than half the output power of the pump, then a modulator
can be employed to use the full pump power in each direction (see Figure 4.5).
Figure 4.4: A 50/50 beamsplitter divides the pump pulse into two beams. The split off beam is delayed such that the CW and CCW pulses meet only in air. The radius of curvature of the curved mirrors is 10 cm concave. The curved mirrors are max-R at the signal wavelength and high-T at the pump and idler wavelengths.
4.2 OPO pump-probe experiments
These are very similar to the experiments with the Ti:sapphire laser, with two exceptions.
The ring gyro is now an OPO and the pump is the direct output of the Ti:sapphire laser.
Using the amplitude modulator, we can select every other Ti:sapphire pulse to pump the
OPO and then the sample. This has the huge advantage of being able to use all of the
pump pulse instead of having to frequency double the output. Also the Ti:sapphire laser
has less amplitude noise and two orders of magnitude more peak power available to pump
experiments. Basically all experiments mentioned in this chapter that deal with a pump-
probe laser gyro could be accomplished using an OPO with 100 times the peak power. The
schematic for this general class of experiments is shown in Figure 4.6.
112
Quarter- Wave Plate
-Hp
X JJl
(1/ Half- Wave Plate
\ Polarizing Beam Splitter KTP
Modulator
OC
Figure 4.5: Similar to the double ring cavity in Figure 4.2. The second pulse is split off and pumps the KTP crystal from the opposite direction. The advantage is that the full pump pulse is used in each direction. The disadvantage is that the cavity perimeter must be 4 times the cavity length of the pump.
4.3 Stopping the earth
The second problem with pulsed ring laser gyros is the arbitrary bias beat note. This bias
beat note can vary and result in an unreliable measuring device. What is needed is a way
to calibrate the gyro periodically to check if the beat note is a result of nonlinearities in the
cavity or if it is a result of a rotation. Of course one way to do this is to periodically stop all
rotations - including the earth, and measure the bias beat note. Although it is impossible
to stop the rotations, it is possible to not measure the rotations. This is done by a clever
switching between a figure-8 laser geometry which doesn't measure rotations and an oval
laser geometry which does measure rotations. The difference in beat frequency between the
two is a result of pure rotation. Since this method can be employed in any pulsed system,
only a schematic of the layout is drawn in Figure 4.7.
4.4 Bragg reflector vibrations
Laser induced acoustics is a large field of study[119, 120]. In the typical experiment a bicell
is used to detect the angular deflection caused by a physical deformation of the surface[121].
113
Polarizing
Quarter Beam
Wave SPiitt(* . , \ Optical 1 Diode
Plate
Modulator
IS
Figure 4.6: Bidirectional ring with modulated pump pulse. Every other pump pulse is selected to pump sample. The OPO pump is split by a 50/50 beam splitter.
The deformation is generated by an acoustic wave that is launched in the material by a laser.
The bump can be as large as 10-20 pm[122]. This amount of deflection should be barely
detectable using the Ti:sapphire laser. One of the end mirrors in the Ti:sapphire laser is
replaced with a AlAs/AlGaAs multilayer stack (or Bragg mirror). The output of the laser
is frequency doubled and modulated as discussed earlier. Every other blue pulse excites
an acoustic wave in the Bragg mirror[123]. See Figure 4.8 below. The deflection is then
detected by the intracavity pulse. The bandgap of the semiconductor material is slightly
higher in energy than the intracavity pulse, so linear absorption of the intracavity pulse is
minimal while the absorption of the second-harmonic pulse is very strong.
4.5 Differential optical path meter
This experiment also uses the phase difference between two pulses inside a laser gyro to mea-
sure a change in the difference in optical path length. Instead of measuring the longitudinal
change in optical path, this experiment measures the spatial change in optical thickness of a
sample. The application is similar to the Twyman-Green interferometer and the Fizeau in-
114
Electro Optic Modulators'
Polarizing Beam Splitter
Measuring Rotations
Measuring Bias
Figure 4.7: The top schematic shows the layout of the modulators and polarizing beam splitter. The middle schematic shows the optical path when the device is measuring a rotation. The bottom schematic shows the optical figure-8 path when the device is measuring the bias beat note.
terferometer used for testing optical elements and the thickness of films; except this method
is capable of detecting surface changes on the order of A/800,000! The experiment is easy to
set up - simply replace one of the prisms with a material that can be used for an electro-optic
modulator. By applying a voltage at a frequency of c/2L, every other pulse will be deflected
at the sample (see Figure 4.9). Every other pulse measures a differential change in optical
path length. The sample is then scanned in the x-y plane to yield a 2-d image of the optical
thickness of the sample.
4.6 Metal detector
The same laser gyro can also be configured to be a metal detector. This scheme is similar
to an FM mode-locker. A phase modulator is placed in the cavity that shifts every other
pulse a full re. Any phase difference other than exactly n, will be measured as a beat note.
A tank circuit is commonly used to achieve such large phase changes. The tank circuit
consists of a coil of wire and the nonlinear crystal (see Figure 4.10). Any ferrous material
115
s Polarizer "£
LiTa03
Modulator
AlGaAs/AlAs Mirror
Ar Pump |
Ti:Al203
LilO,
Figure 4.8: End mirror of typical Ti:sapphire cavity is replaced with a concave mirror which focuses the beam onto the semiconductor end mirror. The beams must be focused to achieve the maximum modulation. The LiI03 crystal generates the second-harmonic. The LiTa03
is an electro-optic modulator.
that enters the field pattern emitted by the coil, will change the Q of the tank circuit. It will
also shift the resonance of the circuit, which can result in an even larger change in voltage
applied to the nonlinear crystal. The change in voltage applied to the nonlinear crystal will
result a change in the beat note. The static phase difference was chosen to be TV, but in
principle any multiple of it will also work; every multiple of it multiplies the sensitivity of
the device. Another method is called the emitter-detector method. In this scheme an RF
wave is propagated into the ground and the reflected RF energy is detected.
4.7 Decoupling of mutual Kerr-lens mode-locking
The schematic of mutual Kerr-lens mode-locking was discussed in Chapter 3. This method
produces mode-locked pulses, but the pulses are coupled to one another by scattering in the
ZnS. If the Kerr medium is put in constant motion, then the phase of the scattered light
will be randomized and prevent lock-in, as was discussed in Chapter 1. Two piezos can be
116
Figure 4.9: Schematic for testing optical elements. Every other pulse is deflected at the sample, yielding a differential measurement of its thickness.
connected such that a sine wave applied to one and a cosine wave to the other will produce
circular motion, similar to a Lissajous pattern. This experiment is important not only for
the possible applications, but also because it could answer the fundamental question of why
the femtosecond ring dye laser does not lock.
4.8 Saturable Bragg reflector
Similar to the Schott glass idea discussed in Chapter 2, this method of mode-locking is
reported to produce 20 fs pulses. For this reason, it would be interesting to build a ring
laser gyro using a saturable Bragg reflector, or one of the other semiconductor mode-lockers
developed by Professor Ursula Keller[61, 62, 72]. These devices will probably lock the
CW and CCW pulses and therefore also require some method to unlock the two pulses like
randomizing the phase of the scattered light.
4.9 Ti:sapphire initiator
Mode-locked lasers are a very important tool for a variety of applications; however, most
suffer from a self-starting problem. The Kerr-lens mode-locking employed by the laser
117
Figure 4.10: Schematic of a laser gyro metal detector. Any ferrous material that enters the field emitted by the coil will be detected as a change in beat note.
requires a kick or a noise spike for the mode-locking to start. There are many methods to
initiate mode-locking, but they all have disadvantages. Most require an extra element to
be added to the cavity, or a physical knocker added to one of the mirrors. By sending an
acoustic wave through the Ti:sapphire crystal at the repetition rate of the laser, the intensity
of the light in the laser will be modulated and result in initiating Kerr-lens mode-locking.
The method of using an acoustic optic modulator for mode-locking is not new and is called
regenerative feedback. Because the acoustic modulator would be the gain medium, there
are no additional parts required.
4.10 Mapping the stability region of a Kerr-lens mode-
locked ring laser
Many excellent papers have been written on the stability curves for the linear Kerr-lens
mode-locked Ti:sapphire laser. The linear cavity is easy to analyze because the curvature
of the Gaussian beam must match the curvature of the end mirrors. There is no such
requirement in the ring cavity. This is an extremely difficult system to model because there
is an extra degree of freedom in the system, which of course implies an extra dimension in
118
the parameter space to explore. The linear cavity was solved with only 2 degrees of freedom
by simply stepping through all possible values. A similar method for the ring laser would
be very time consuming. A combination of mapping the global parameter space coupled
with a routine to find minimums will yield an accurate mapping of the stability region for
the Kerr-lens mode-locked Ti:sapphire laser.
4.11 Postmortem examination of failed experiments
Most experimental results are typically preceded by numerous failures. Just because an
experiment does not produce reproducible data does not mean that it is a failure, often
valuable lessons can be learned.
4.11.1 Cross phase modulation in Tirsapphire
The enhanced Kerr-effect due to colliding pulses was discussed in Chapter 3. Instead of col-
liding pulses, this experiment uses orthogonally polarized, collinear pulses. This experiment
involves taking the output of the Ti:sapphire laser, putting it through a quarter-wave plate,
an electro-optic modulator and finally a polarizing beamsplitter (see Figure 4.11). The
Ar Pump
Ti:Al203
LiTa03 Quarter Modulator Wave
Plate
Figure 4.11: The polarizing beam splitter separates the s and p polarizations. The s polarization is injected back into the cavity. The modulator selects every other pulse to be injected back into the cavity by switching the pulses between s and p polarization.
119
s-polarization output from the beamsplitter is injected into the Tksapphire crystal. The
experiment can also be accomplished using a ring cavity and a half-wave plate. The delay
of this injected pulse can be varied while monitoring the beat note of the laser. The injected
pulse should not couple to the cavity because its polarization is at 90° to the light that is
resonating. The injected pulse will create a moving index in the sapphire. The intracavity
pulse will 'surf on this index wave and result in a phase shift.
This experiment was attempted using a polarizing beam splitter and a half-wave plate
in a ring cavity. The injected pulse invariably locked the laser. The half-wave plate was of
pretty good quality (manufacturer was Casix), so we do not believe that it was the source of
the problem. The polarizing beam splitter was an air-gap calcite borrowed from a Nd:YAG
laser. We believe the polarizer did not have a high enough of a rejection ratio and thus a
small amount of the horizontal polarization is coupled back into the laser.
4.11.2 Phase multiplier
Many organic optical materials have a yellow tinge[124]. This means that the material
is absorbing light in the blue part of the spectrum. The frequency doubled output of a
Ti:sapphire laser at 400 nm would be an ideal pump of these materials. The experimental
setup is shown below in Figure 4.12. The output of the Ti:sapphire is frequency doubled and
amplitude modulated as described above. Every other pulse strikes the organic sample at
the same time that an intracavity pulse is in the dove prism. The excitation of the organic
material will change its refractive index. The change in refractive index at the location
where the intracavity pulse is totally internally reflected will result in a large phase change.
This phase change will then be detected by the beat frequency.
This experiment was attempted with a ring cavity. There are several problems
plaguing this experiment. First it requires the generation of the second-harmonic with
high efficiencies. Because of the problems associated with short-pulse ring lasers mentioned
in Chapters 2 and 3, we were not able to generate more than a few milliwatts of second-
harmonic because the pulses in the stable geometry are typically in the picosecond region.
The second problem was that the organic samples were optically thin, having only a few
percent absorption. Several samples were attempted including Iodine dyes, Coumarin 500
120
Ar Pump J
Ti:Al203
Figure 4.12: The intracavity beam is incident on the dove prism such that it is always totally internally reflected. The modulator selects every other pulse out of the Tksapphire laser. The LiI03 crystal generates the second-harmonic. The LiTa03 crystal is an electro-optic modulator.
and Re(CO)3(bpy)Br from New Mexico Highlands University.
4.11.3 Pump/probe experiments with Schott glass
These experiments were very similar to the organic experiments discussed above. Again
this experiment required the generation of copious amounts of blue second-harmonic, which
we were not able to produce because of the long pulsewidths. Another problem with
this experiment is the thermal instabilities associated with the glass, which was reported in
Chapter 2. The success of the experiment required that the glass be placed at a tightly
focused beam waist in the cavity. Since glass is a poor conductor of heat, the smallest
amount of absorption at the fundamental results in instabilities in the laser output.
4.12 Conclusions
This dissertation studied the Ti:sapphire laser as a pulsed ring laser gyroscope. Numerous
new discoveries were made, which will be listed in the order that they appeared in this dis-
sertation. A novel linear cavity with two pulses in the cavity was used for the first time
121
. LiNbO
Figure 4.13: A) Linear cavity: no bias beat frequency. B) Saturable aborber mode- locked ring gyro: measured low beat frequencies. C) Kerr-lens mode-locked ring gyro: femtosecond pulses. D) Mutual Kerr-lens mode-locked: all solid-state.
122
to measure electro-optic coefficients (see Figure 4.13A). This laser can be analyzed in the
same manner as a ring laser, with the difference being that the pulses are indistinguishable
whereas in the ring the CW and CCW pulses are easily separable. Next a solid-state ring
laser gyroscope using a dye-jet saturable absorber was studied(see Figure 4.13B). This laser
produced the lowest beat frequencies recorded in a pulsed laser (10 Hz with a 10 Hz band-
width) and also the narrowest beat note bandwidth at 0.85 Hz. Null-bias dithering was
demonstrated for the first time using an electro-optic modulator. A new method of extract-
ing the average beat frequency from a dithered laser was discovered and the experimental
result was verified with an analytic solution. In Chapter 3, Kerr-lens mode-locking was used
for the first time in a ring laser gyro(see Figure 4.13C). This laser employed both passive
negative and positive feedback in the same Kerr element. A novel method of stabilizing the
crossing point in ring laser was demonstrated by using mutual Kerr-lens mode-locking(see
Figure 4.13D). Finally the design of a Bidirectional OPO Ring Gyro (BORG) was discussed
in Chapter 4. The BORG has the potential to exceed the quantum limit of HeNe laser
gyros because it solves the problem of gain competition. Also presented is a novel method
of removing the bias in a laser gyro. These designs forecast an exciting future for research
in pulsed laser gyroscopes.
123
Bibliography
[1] M. Sheik-Bahae and M. Ebrahimzadeh. Measurements of nonlinear refraction in the
second-order chi(2) materials KTiOP04, KNb03, beta-BaB204, and L1B305. Optics
Communications, 142:294-298, October 1997.
[2] E.W. Van Stryland and M. Sheik-Bahae. Z-scan measurements of optical nonlinearites.
In CRC Handbook of Nonlinear Optics. CRC Press, Boca Raton, 1998.
[3] G. E. Stedman. Ring-laser tests of fundamental physics and geophysics.
Rep. Prog. Phys., 60:615-688, 1997.
[4] A. D. Kersey, A. Dandridge, and W. K. Burns. Fiber optic gyroscope technology.
Optics News, (11):12-19, November 1989.
[5] V. Rautenberg, H.-P. Plag, M. Bums, G. E. Stedman, and H.-U. Juttner. Tidally
induced Sagnac signal in a ring laser. Geophys. Res. Lett., 24:893-896, 1997.
[6] G. E. Stedman, H. R. Bilger, Z. Li, M. P. Poulton, C. H. Rowe, I. Vetharaniam,
and P. V. Wells. Canterbury ring laser and tests for nonreciprocal phenomena.
Aust. J. Phys. , 46:87-101, 1993.
[7] H. R. Bilger, G. E. Stedman, U. Schreiber, and M. Schneider. Ring laser for geodesy.
IEEE Transactions on Intrumentation and Measurement, 44(2):468-470, April 1995.
[8] Scott Diddams. Phase Measurements inside Mode-locked ring lasers. PhD thesis,
University of New Mexico, December 1996.
[9] N. Buholz and M. Chodorow. Acoustic wave amplitude modulation of a multimode
ring laser. IEEE J. of Quantum Electronics, 3(ll):454-459, November 1967.
[10] A. V. Dotsenko and E.G.Lariontsev. Conditions for cw stimulated emission from a
solid-state ring laser with a nonlinear absorber. Sov. J. Quantum Electron., 9(5):576-
579, May 1979.
[11] E. L. Klochan, L. S. Kornienko, N. V. Kravtsov, E. G. Lariontsev, and A. N. Shelaev.
Oscillation regimes in a rotating solid-state ring laser. Sov. Phys.-JETP, 38(4):669-674,
April 1974.
[12] D. Gnass, N. P. Ernsting, and F. P. Schäfer. Sagnac effect in the colliding-pulse-mode-
locked dye ring laser. Appl. Phys. B, 53:119-120, 1991.
[13] M. L. Dennis, J.-C. Diels, and M. Lai. The femtosecond ring dye laser: a potential
new laser gyro. Optics Letters, 17:529 - 531, 1991.
[14] W. R. Christian and M. J. Rosker. Picosecond pulsed diode ring-laser gyroscope.
Optics Letters, 16(20): 1587-1589, October 1991.
[15] F. Aronowitz. Laser Applications. Academic, New York, 1971.
[16] W. F. Parks and J. T. Dowell. Fresnel drag in uniformly moving media. Physical
Review A, 9(l):565-567, January 1974.
[17] R. T. De Carvalho and J. Blake. Slow-flow measurements and fluid dynamics analysis
using the Fresnel drag effect. Applied Optics, 33(25):6073-6077, 1 September 1994.
[18] G. A. Sanders and S. Ezekiel. Measurement of Fresnel drag in moving media using a
ring-resonator technique. J. Opt. Soc. Am. B. , 5(3):674-678, March 1988.
[19] M. Vallet, N. H. Tran, P. Tanguy, A. L. Floch, and F. Bretenaker. Ring-laser gyro
with spatially resolved eigenstates. Optics Letters, 19(16):1219-1221, August 15 1994.
[20] M. Vallet, F. Bretenaker, N. H. Tran, P. Tanguy, and A. L. Floch. Spatially resolved
eigenstates for traveling and standing waves in ring lasers. J. Opt. Soc. Am. B.,
12(1):146-154, January 1995.
[21] M. L. Dennis and J.-C. Diels. Analysis of a ring-laser gyroscope with intracavity
phase-conjugate coupling. Applied Optics, 33(4): 1659-1672, 20 March 1994.
125
[22] G. E. Stedman, Z. Li, C. H. Rowe, A. D. McGregor, and H. R. Bilger. Harmonic
analysis in a large ring laser with backscatter-induced pulling. Physical Review A,
51(6):4944-4958, June 1995.
[23] F. Aronowitz and R J. Collins. Appl. Phys. Lett, 9:55, 1966.
[24] J. R. Wilkinson. Ring lasers. Prog. Quant. Elect, 11:1-103, 1987.
[25] J. Killpatrick. The laser gyro. IEEE Spectrum, 4:44, October 1967.
[26] A. Bambini and S. Strenholm. Analysis of nonlinear response in a body dithered ring
laser gyro. Optics Communications, 49(4):269-274, 15 March 1984.
[27] A. Bambini and S. Strenholm. Theory of a dithered-ring-laser gyroscope: A Floquet-
theory treatment. Physical Review A, 31(l):329-337, January 1985.
[28] A. Bambini and S. Strenholm. Theory of a dithered-ring-laser gyroscope. II Cayley
transformations and square-wave dithering. Physical Review A, 31(6):3741-3749, June
1985.
[29] A. Bambini and S. Strenholm. Random dither modulation of a ring-laser gyroscope.
J. Opt Soc. Am. B., 4(2): 148-163, February 1987.
[30] W. T. Coffey, Y. P. Kalymkov, and E. S. Massawe. Effective-eigenvalue approach to
the nonlinear Langevin equation for the Brownian motion in a tilted periodic potential.
II. Application to the ring-laser gyroscope. Physical Review E, 48(2):699-704, August
1993.
[31] W. Schleich and P. Dobiasch. Noise analysis of ring-laser gyroscope with arbitrary
dither. Optics Communications, 52(l):66-69, 1 November 19.
[32] D. A. Andrews and T. A. King. Sources of error and noise in a magnetic mirror gyro.
IEEE J. Quantum Electronics, 32(3):543-548, March 1996.
[33] G. E. Stedman, M. T. Johnsson, Z. Li, C. H. Rowe, and H. R. Bilger. T violation and
microhertz resolution in a ring laser. Optics Letters, 20(3):324-326, February 1 1995.
126
[34] H. R. Bilger, G. E. Stedman, M. P. Poulton, C. H. Rowe, Z. Li, and P. V. Wells. Ring
laser for precision measurement of nonreciprocal phenomena. IEEE Transactions on
Intrumentation and Measurement, 42(2):407-411, April 1993.
[35] J. Chesnoy. Picosecond gyrolaser. Optics Letters, 14(18):990-992, September 15 1989.
[36] J.-C. Diels and I. C. McMichael. Degenerate four-wave mixing of femtosecond pulses
in an absorbing dye jet. J. Opt. Soc. Am. B, 3(4):535-543, April 1986.
[37] R. W. Boyd. Nonlinear Optics. Academic Press, Boston, MA, 1992.
[38] M. Aoyama and K. Yamakawa. Noise characterization of and all-solid-state mirror-