108
Providing in-depth insight, data, and analysis of everything digital. BI Intelligence 7 PREDICTIONS ABOUT THE FUTURE OF MEDIA
| Date post: | 14-Feb-2017 |
| Category: |
Business |
| Upload: | ezhilarasan-natarajan |
| View: | 648 times |
| Download: | 1 times |

Providing in-depth insight, data, and analysis of everything digital. BI Intelligence
7 PREDICTIONS ABOUT THE FUTURE OF MEDIA

1. DIGITAL WILL INHERIT THE EARTH
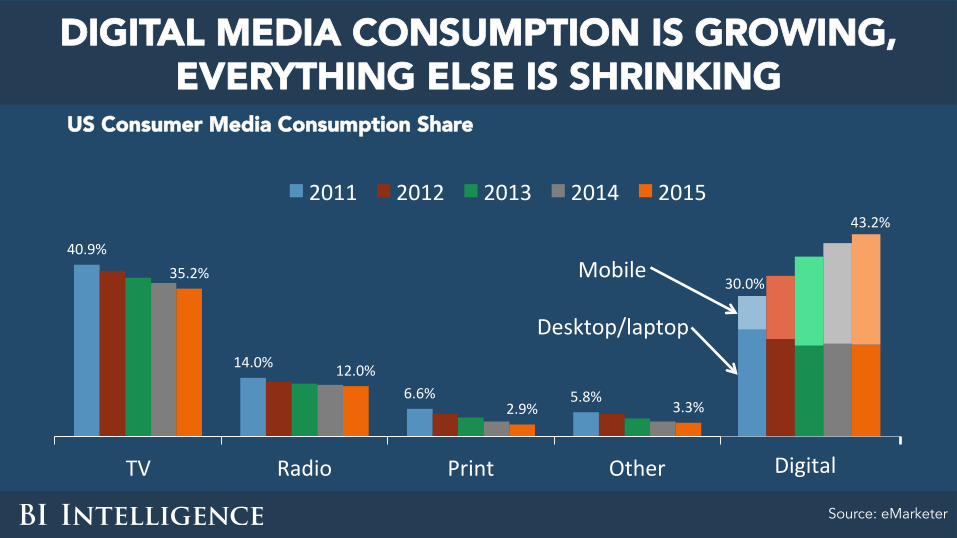
DIGITAL MEDIA CONSUMPTION IS GROWING, EVERYTHING ELSE IS SHRINKING
US Consumer Media Consumption Share
Source: eMarketer
43.2%
40.9%
14.0%
6.6% 5.8%
35.2%
12.0%
2.9% 3.3%
TV Radio Print Other
2011 2012 2013 2014 2015
Desktop/laptop
Digital
30.0%Mobile

And averages do not tell the whole story…

THE SHIFT IS GENERATIONAL Top 5 Media Mentions Among All Adults, 2013
Source: Ofcom
0 20 40 60 80 100
TotalAged16-24Aged25-34Aged35-44Aged45-54Aged55-64Aged65-74Aged75+ WatchTV
Readnewspapers/magazines
Listentotheradio
Goonlineonacomputer/laptop/netbook/tablet
Useasmartphone

GENERATIONS HAVE A PREDICTABLE LIFE CYCLE…
Source: Goldman Sachs
• First digital native generation(s)
• Already 45% of population and largest share of earners
• Profoundly different media habits
MILLENNIALS AND GEN Z
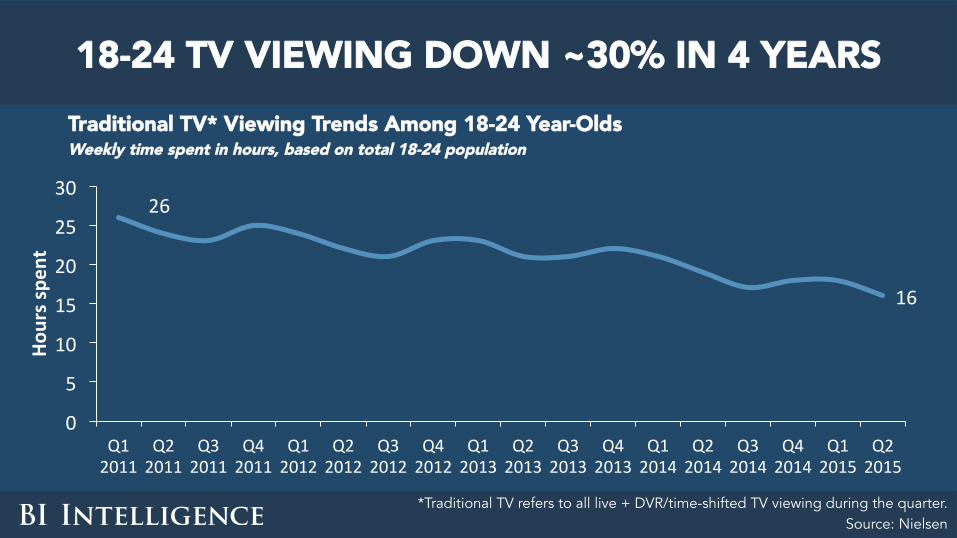
26
16
0
5
10
15
20
25
30
Q12011
Q22011
Q32011
Q42011
Q12012
Q22012
Q32012
Q42012
Q12013
Q22013
Q32013
Q42013
Q12014
Q22014
Q32014
Q42014
Q12015
Q22015
Hourss
pent
18-24 TV VIEWING DOWN ~30% IN 4 YEARS Traditional TV* Viewing Trends Among 18-24 Year-Olds Weekly time spent in hours, based on total 18-24 population
*Traditional TV refers to all live + DVR/time-shifted TV viewing during the quarter. Source: Nielsen

Meanwhile…
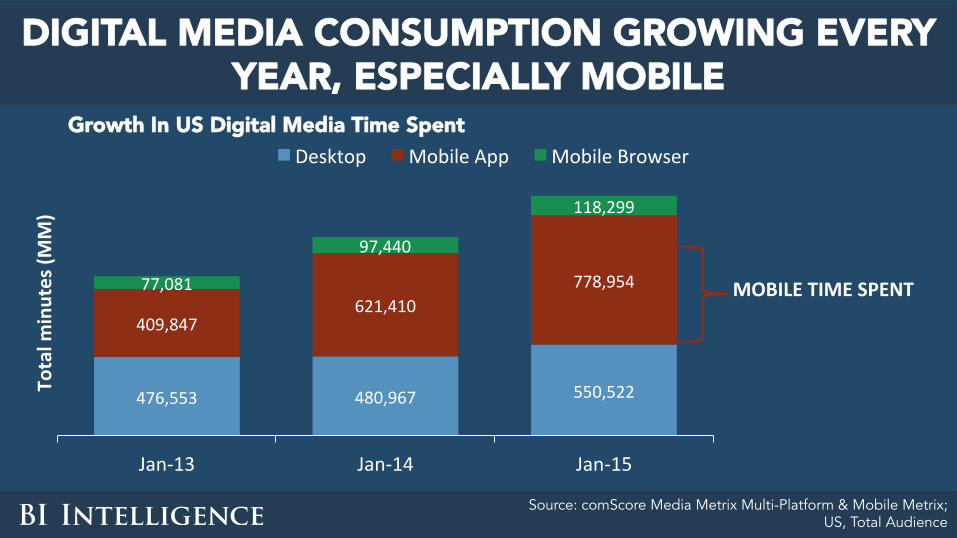
DIGITAL MEDIA CONSUMPTION GROWING EVERY YEAR, ESPECIALLY MOBILE
Source: comScore Media Metrix Multi-Platform & Mobile Metrix; US, Total Audience
476,553 480,967 550,522
409,847621,410
778,95477,081
97,440
118,299
Jan-13 Jan-14 Jan-15
Totalm
inutes(M
M)
Desktop MobileApp MobileBrowser
MOBILETIMESPENT
Growth In US Digital Media Time Spent
MILLENNIALS CHECK THEIR PHONES EVERY 10 MINUTES
Source: Kana Software

Source: Zogby Analytics, cited by KPCB (Mary Meeker – LinkedIn slideshare)
THEY KEEP THEM IN REACH 24 HOURS A DAY
My smartphone never leaves my side, night or day
87.0%
12.0%2.0%
Agree Disagree Notsure
Source: Zogby Analytics, cited by KPCB (Mary Meeker – LinkedIn slideshare)
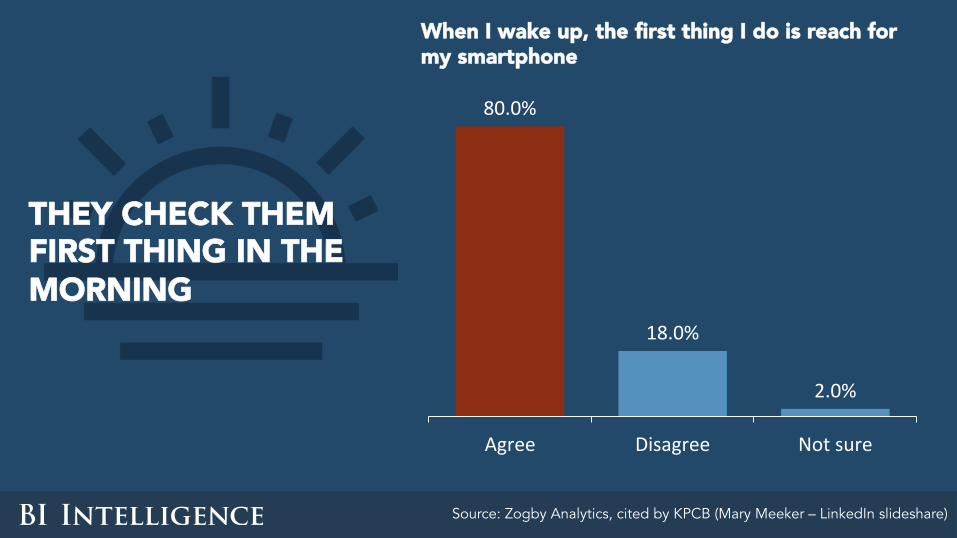
THEY CHECK THEM FIRST THING IN THE MORNING
When I wake up, the first thing I do is reach for my smartphone
80.0%
18.0%
2.0%
Agree Disagree Notsure

So here’s a glimpse at the past, present, and future of media…

THE PAST (~2000): 3% DIGITAL
Source: Ofcom
0%10%20%30%40%50%60%70%80%90%
100%
Smartphone
Computer/laptop/tablet
Radio
TV
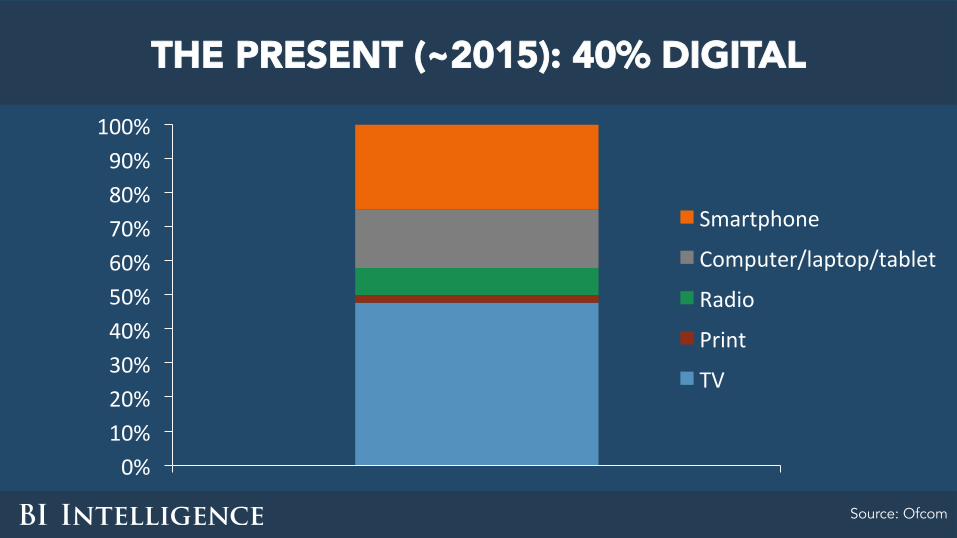
THE PRESENT (~2015): 40% DIGITAL
Source: Ofcom
0%10%20%30%40%50%60%70%80%90%100%
Smartphone
Computer/laptop/tablet
Radio
TV
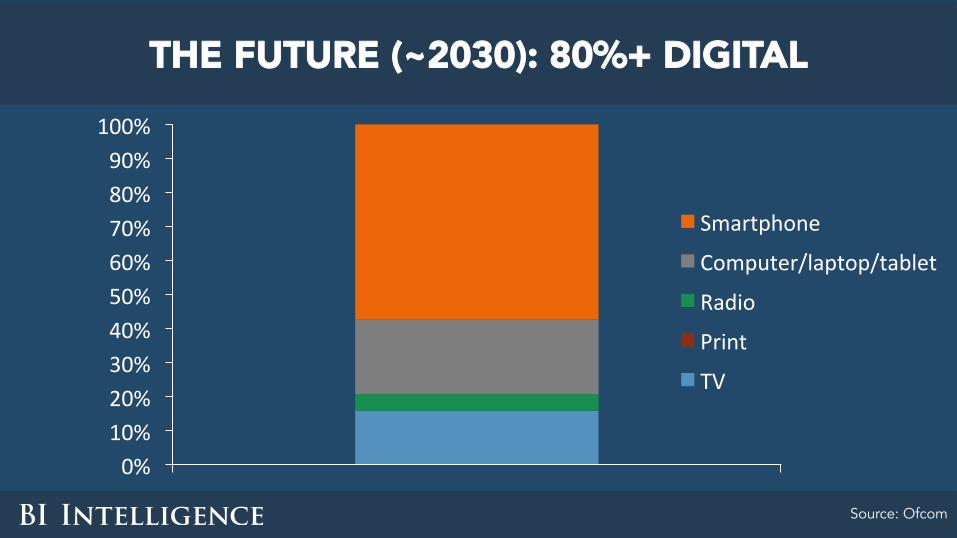
THE FUTURE (~2030): 80%+ DIGITAL
Source: Ofcom
0%10%20%30%40%50%60%70%80%90%
100%
Smartphone
Computer/laptop/tablet
Radio
TV

2. SUBSCRIPTIONS FOR THE WIN!
Remember when pundits said digital content had to be free
because no one would ever pay?

Oops.
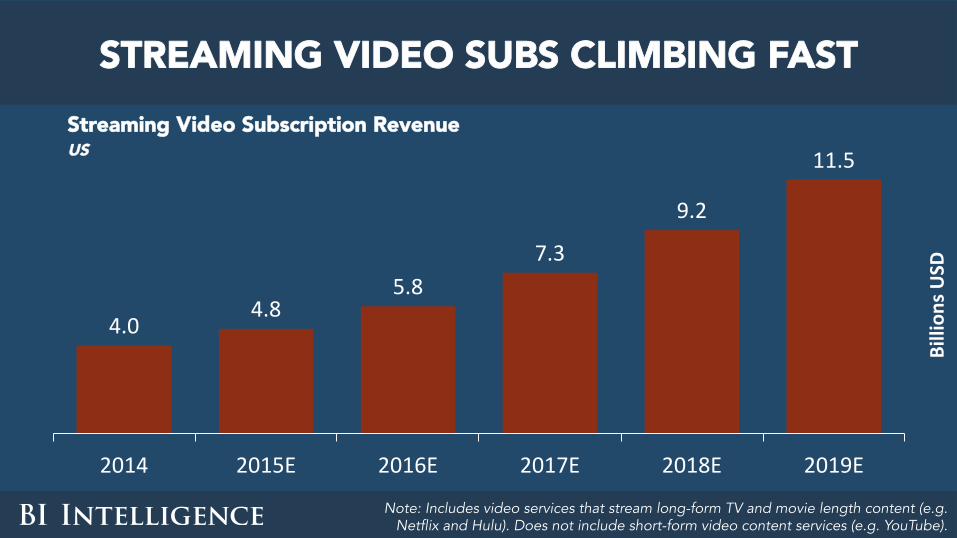
4.04.8
5.87.3
9.2
11.5
2014 2015E 2016E 2017E 2018E 2019E
Billion
sUSD
STREAMING VIDEO SUBS CLIMBING FAST Streaming Video Subscription Revenue US
Note: Includes video services that stream long-form TV and movie length content (e.g. Netflix and Hulu). Does not include short-form video content services (e.g. YouTube).
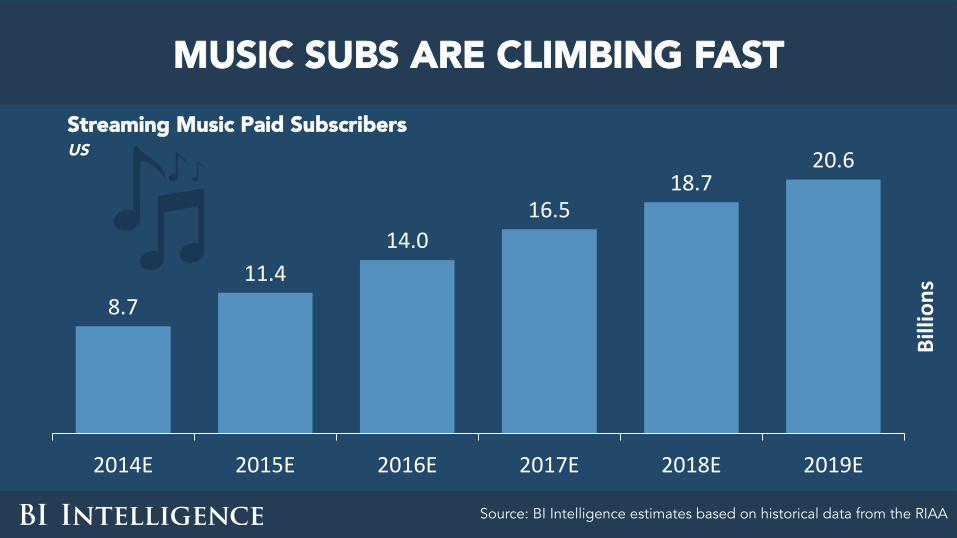
8.711.4
14.016.5
18.720.6
2014E 2015E 2016E 2017E 2018E 2019E
Billion
s
MUSIC SUBS ARE CLIMBING FAST Streaming Music Paid Subscribers US
Source: BI Intelligence estimates based on historical data from the RIAA

AdverZsing
SubscripZons
$-
$20
$40
$60
$80
$100
$120
Q113 Q213 Q313 Q413 Q114 Q214 Q314 Q414
Millions
EVEN “PRINT” SUBS ARE CLIMBING FAST New York Times Digital Revenue Global
Source: The New York Times

The new pundit story is that there’s one right model — subs or ads

The truth is that both work, as do a la carte sales.
Most media companies have dual revenue streams.
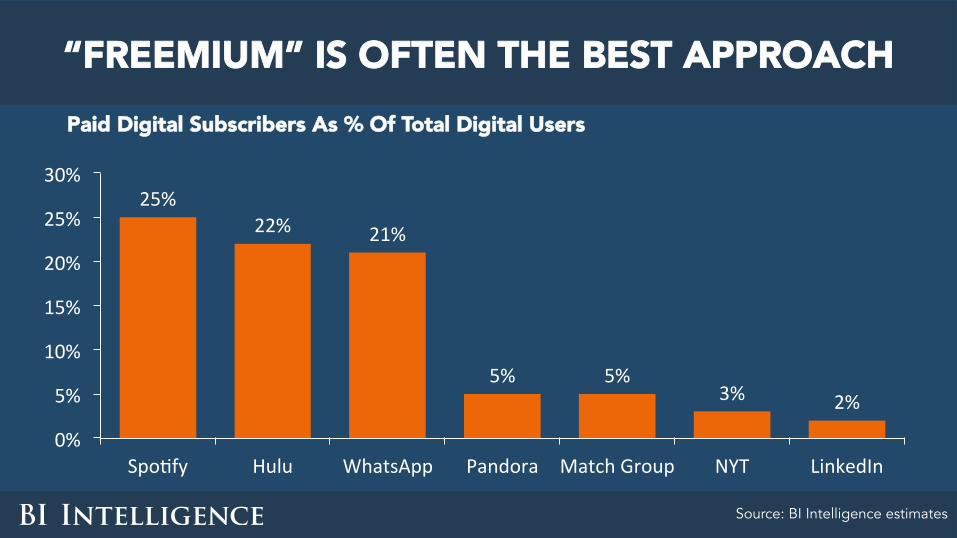
“FREEMIUM” IS OFTEN THE BEST APPROACH Paid Digital Subscribers As % Of Total Digital Users
Source: BI Intelligence estimates
25%22% 21%
5% 5%3% 2%
0%
5%
10%
15%
20%
25%
30%
SpoZfy Hulu WhatsApp Pandora MatchGroup NYT LinkedIn

3. (NATIVE) DIGITAL ADVERTISING WILL CONTINUE TO THRIVE

The best definition of “native ads”…

Ads that fit the way content and stories in the medium are consumed.
“NATIVE ADS”
In digital, “search” and “scroll” are the dominant ways content is consumed.

BEHOLD THE POWER OF NATIVE DIGITAL ADS
Note: Based on GAAP revenue. Source: Company Filings, BI Intelligence estimates
FacebookYahoo
AOLTwiber
$0
$5
$10
$15
$20
$25
Billion
s
Digital Advertising Revenues Global
“Read, watch, and listen” are also digital formats.
But the experience is different than in legacy media.
Native digital brand ads will increasingly take advantage of the digital difference.

4. THE EXISTENTIAL CRISIS OF AD BLOCKING WILL RESOLVE ITSELF —
BUT CAREFUL WHAT YOU WISH FOR
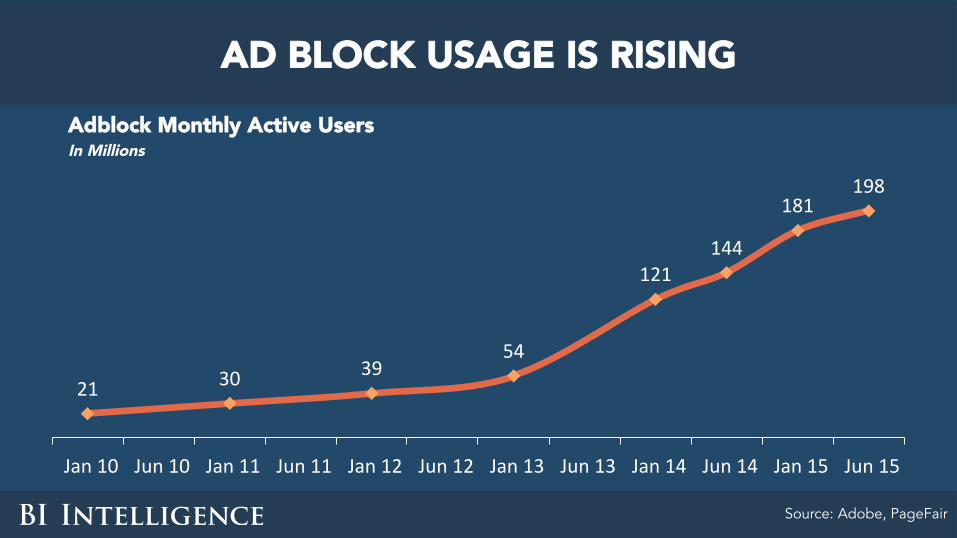
AD BLOCK USAGE IS RISING
Source: Adobe, PageFair
21 30 3954
121144
181198
Jan10 Jun10 Jan11 Jun11 Jan12 Jun12 Jan13 Jun13 Jan14 Jun14 Jan15 Jun15
Adblock Monthly Active Users In Millions
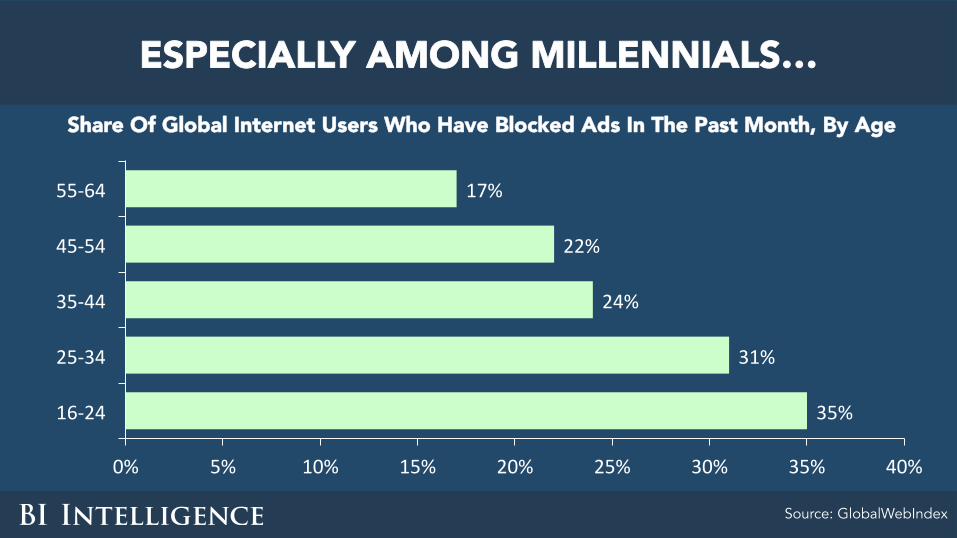
ESPECIALLY AMONG MILLENNIALS… Share Of Global Internet Users Who Have Blocked Ads In The Past Month, By Age
Source: GlobalWebIndex
35%
31%
24%
22%
17%
0% 5% 10% 15% 20% 25% 30% 35% 40%
16-24
25-34
35-44
45-54
55-64
Source:GlobalWebIndex

AND TECHIES
Note: Estimated to nearest 5% increment Source: PageFair
30%25%25%
20%20%20%
15%15%
10%10%10%
5%
GamesTechnology
ComicsAdult
EntertainmentSportsNews
BusinessLifestyle
LocalFinanceTravel
Ad-Block Usage Rates, By Vertical Global

There is a lot of self-interested finger-pointing, moralizing,
and rationalizing going on — from all parties.

If all ads are blocked, most free content will cease to exist.
ONE THING IS CLEAR…

So what will happen?

Quality will improve!
Publishers, platforms, and advertisers will focus more on user experience and choice.

People will choose to view ads from, and/or subscribe to,
publishers and platforms they like.

These decisions will not all be voluntary.

5. THE NEXT BIG PLATFORM IS…
As smartphones get boring, everyone is hunting
for the next big platform.

Many candidates have been suggested — glasses, watches, cars, virtual reality…

None of these will be the next big platform.

Smart glasses flopped.
Smartwatches haven’t entirely flopped, but no one will be reading, watching,
or listening to media on them anytime soon.
Cars won’t become media and communications platforms —
other platforms will be used inside them.

VR is promising, but it’s still too early.

VR INSTALLED BASE STILL SMALL Estimated Global Virtual Reality Headset Shipments
Source: BI Intelligence estimates, 2015
-
5
10
15
20
25
30
2015E 2016E 2017E 2018E 2019E 2020E
Shipmen
ts(M
illions)

• Complicated to use
• Screen resolution low
• Display often nausea-inducing
• Prices steep
AND EXPERIENCE STILL LEAVES MUCH TO BE DESIRED

Messaging apps!
SO THE NEXT BIG PLATFORM WILL BE…
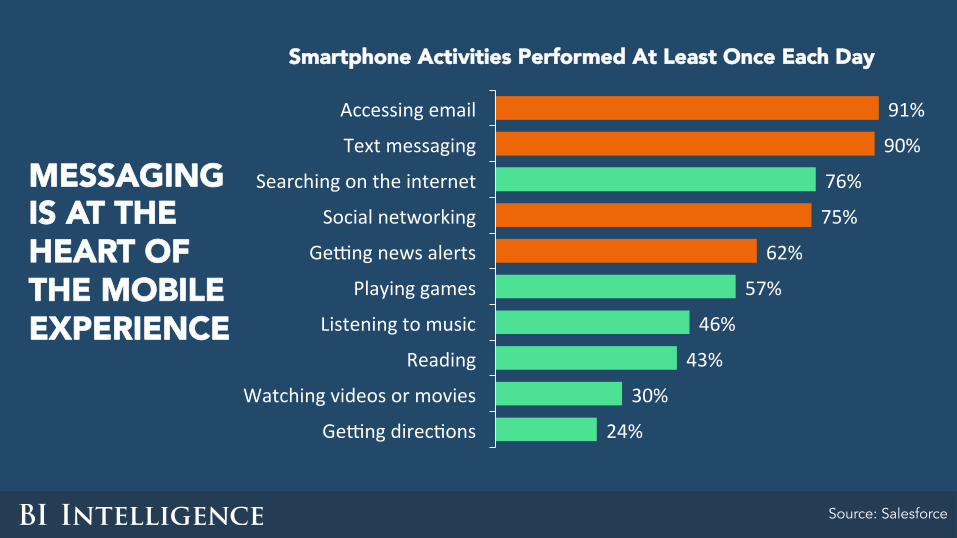
Source: Salesforce
MESSAGING IS AT THE HEART OF THE MOBILE EXPERIENCE
Smartphone Activities Performed At Least Once Each Day
24%
30%
43%
46%
57%
62%
75%
76%
90%
91%
GecngdirecZons
Watchingvideosormovies
Reading
Listeningtomusic
Playinggames
Gecngnewsalerts
Socialnetworking
Searchingontheinternet
Textmessaging
Accessingemail
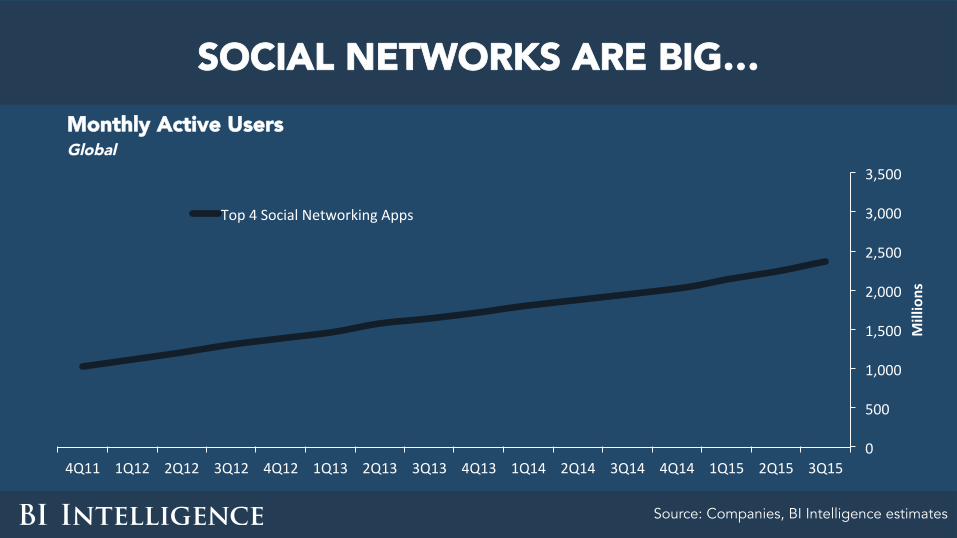
SOCIAL NETWORKS ARE BIG…
Source: Companies, BI Intelligence estimates
Monthly Active Users Global
0
500
1,000
1,500
2,000
2,500
3,000
3,500
4Q11 1Q12 2Q12 3Q12 4Q12 1Q13 2Q13 3Q13 4Q13 1Q14 2Q14 3Q14 4Q14 1Q15 2Q15 3Q15
Millions
Top4SocialNetworkingApps

BUT MESSAGING APPS ARE ALREADY BIGGER
Source: Companies, BI Intelligence estimates
0
500
1,000
1,500
2,000
2,500
3,000
3,500
4Q11 1Q12 2Q12 3Q12 4Q12 1Q13 2Q13 3Q13 4Q13 1Q14 2Q14 3Q14 4Q14 1Q15 2Q15 3Q15
Millions
Top4SocialNetworkingApps
Top4MessagingApps
Monthly Active Users Global
0
100
200
300
400
500
600
700
800
900
1000
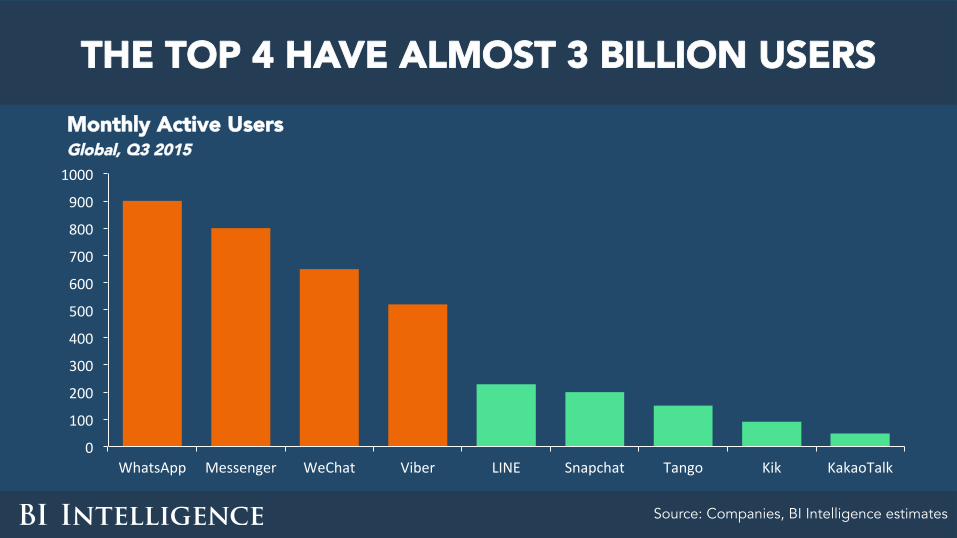
WhatsApp Messenger WeChat Viber LINE Snapchat Tango Kik KakaoTalk
Monthly Active Users Global, Q3 2015
THE TOP 4 HAVE ALMOST 3 BILLION USERS
Source: Companies, BI Intelligence estimates
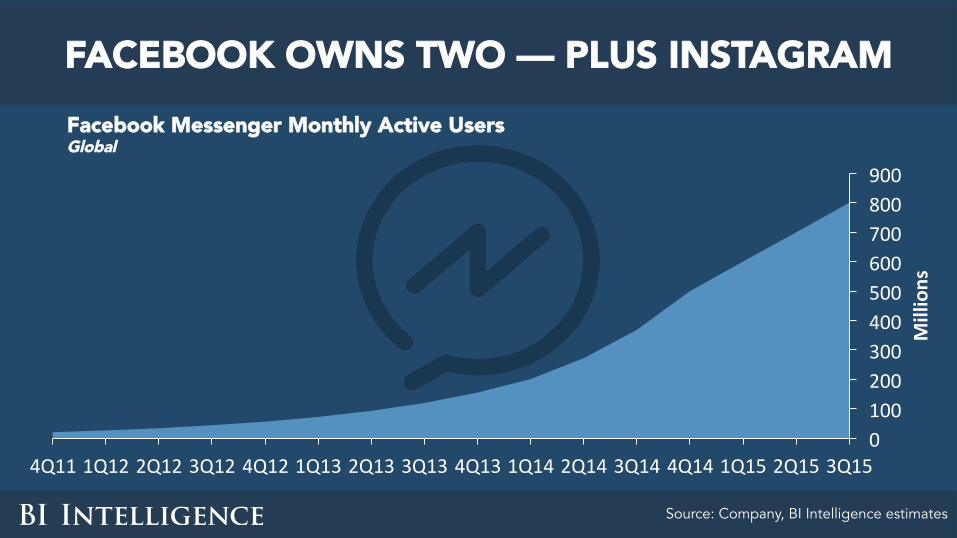
FACEBOOK OWNS TWO — PLUS INSTAGRAM Facebook Messenger Monthly Active Users Global
Source: Company, BI Intelligence estimates
0100200300400500600700800900
4Q111Q122Q123Q124Q121Q132Q133Q134Q131Q142Q143Q144Q141Q152Q153Q15
Millions
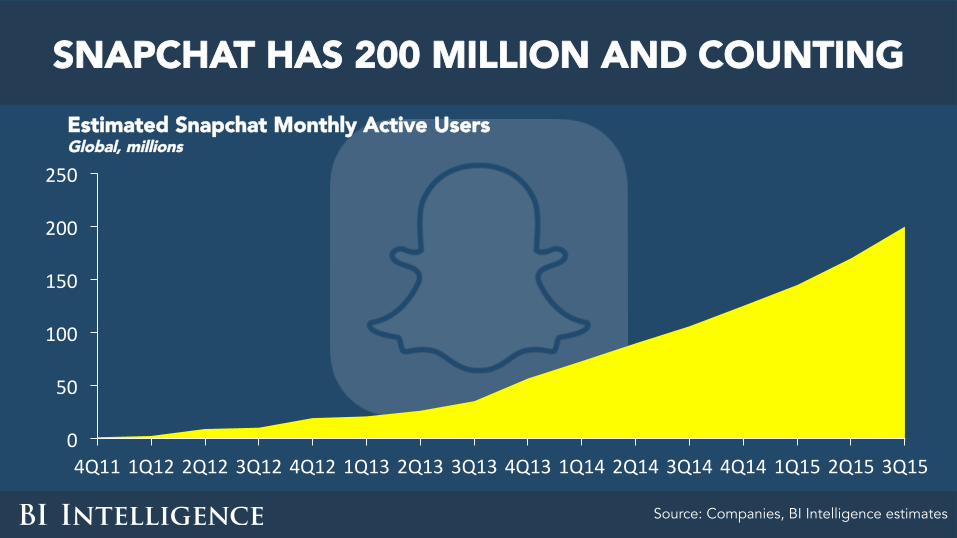
SNAPCHAT HAS 200 MILLION AND COUNTING
0
50
100
150
200
250
4Q111Q122Q123Q124Q121Q132Q133Q134Q131Q142Q143Q144Q141Q152Q153Q15
Estimated Snapchat Monthly Active Users Global, millions
Source: Companies, BI Intelligence estimates
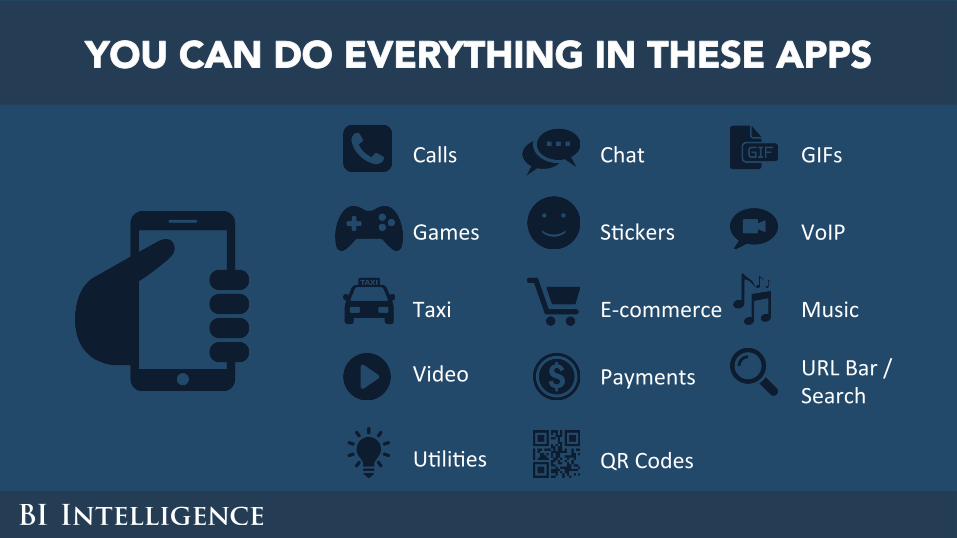
YOU CAN DO EVERYTHING IN THESE APPS
Calls Chat GIFs
Games SZckers VoIP
Taxi E-commerce Music
Video Payments URLBar/Search
UZliZes QRCodes
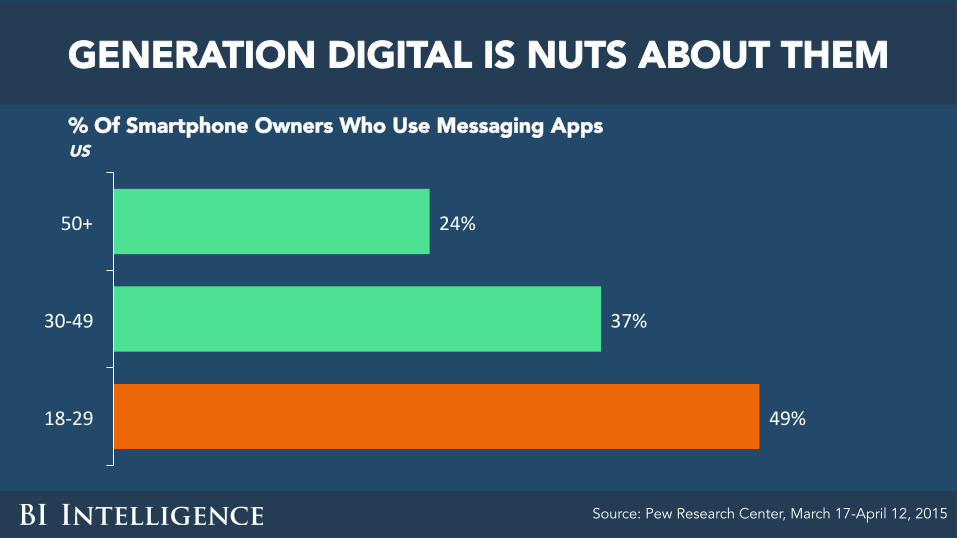
GENERATION DIGITAL IS NUTS ABOUT THEM % Of Smartphone Owners Who Use Messaging Apps US
Source: Pew Research Center, March 17-April 12, 2015
49%
37%
24%
18-29
30-49
50+

6. TV NETWORKS WILL SOON FEEL NEWSPAPERS’ PAIN

TRADITIONAL TV HAS PASSED ITS PEAK Households With Pay TV Vs. Subscription OTT, U.S., 2010-2015E, Millions
Leichman Research Group, US Census Bureau, Activate analysis
99 100.9 100.8 99.3 9897.1
23 28 33 38 4350.3
0
20
40
60
80
100
120
2010 2011 2012 2013 2014 2015E
PayTVHouseholds DigitalSubscripZon(OTT)Households
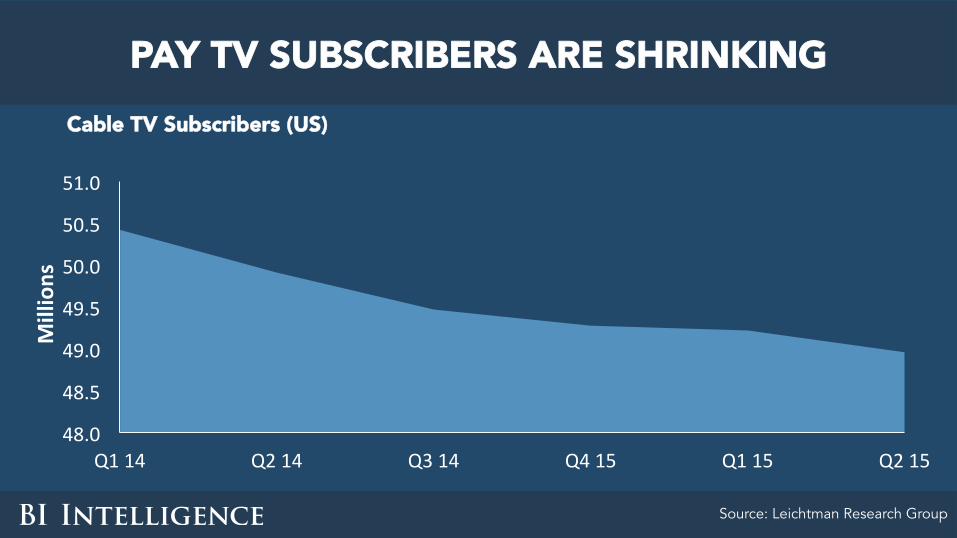
PAY TV SUBSCRIBERS ARE SHRINKING Cable TV Subscribers (US)
Source: Leichtman Research Group
48.0
48.5
49.0
49.5
50.0
50.5
51.0
Q114 Q214 Q314 Q415 Q115 Q215
Millions
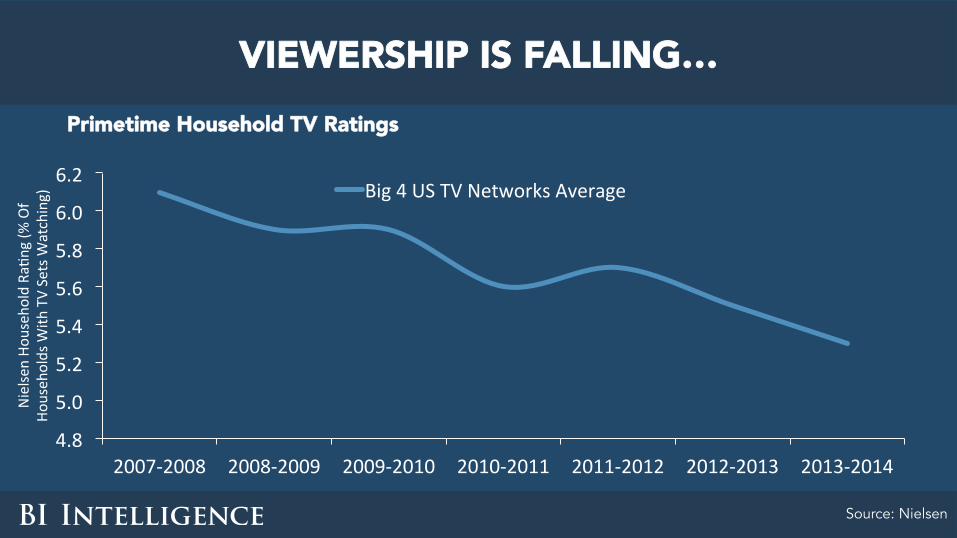
VIEWERSHIP IS FALLING… Primetime Household TV Ratings
Source: Nielsen
4.8
5.0
5.2
5.4
5.6
5.8
6.0
6.2
2007-2008 2008-2009 2009-2010 2010-2011 2011-2012 2012-2013 2013-2014
Nielse
nHo
useh
oldRa
Zng(%
Of
Househ
oldsW
ithTVSetsW
atching) Big4USTVNetworksAverage

Meanwhile…
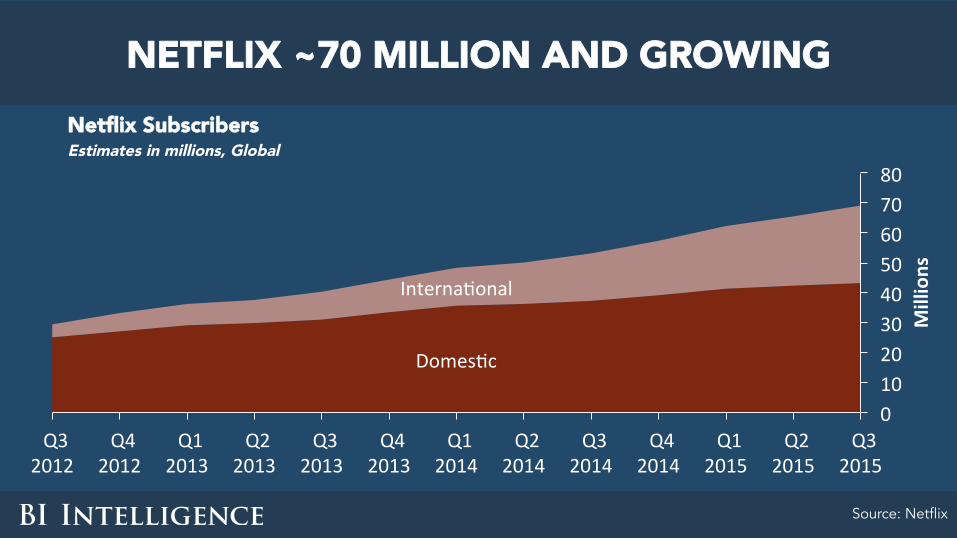
NETFLIX ~70 MILLION AND GROWING Netflix Subscribers Estimates in millions, Global
Source: Netflix
DomesZc
InternaZonal
01020304050607080
Q32012
Q42012
Q12013
Q22013
Q32013
Q42013
Q12014
Q22014
Q32014
Q42014
Q12015
Q22015
Q32015
Millions

012345678910
2011 2012 2013 2014 2015E
Millions
HULU ~10 MILLION AND GROWING Hulu Subscribers Estimates in millions, Global
Source: Hulu, BI Intelligence estimates
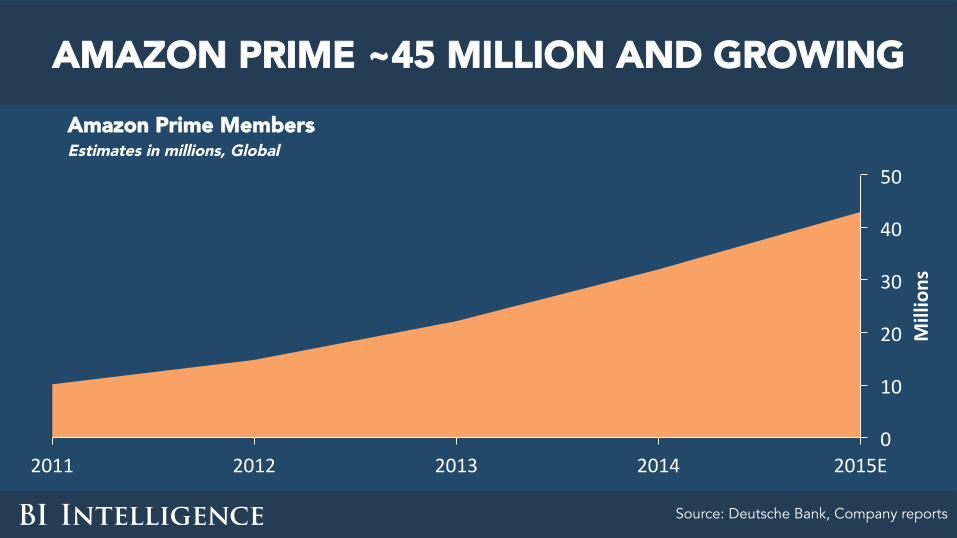
AMAZON PRIME ~45 MILLION AND GROWING Amazon Prime Members Estimates in millions, Global
Source: Deutsche Bank, Company reports
0
10
20
30
40
50
2011 2012 2013 2014 2015E
Millions

-510152025303540
2007 2008 2009 2010 2011 2012 2013 2014 2015 2016 2017 2018
Millions
Global US
APPLE TV 35 MILLION+ AND GROWING Apple TV Installed Base
Source: BI Intelligence estimates
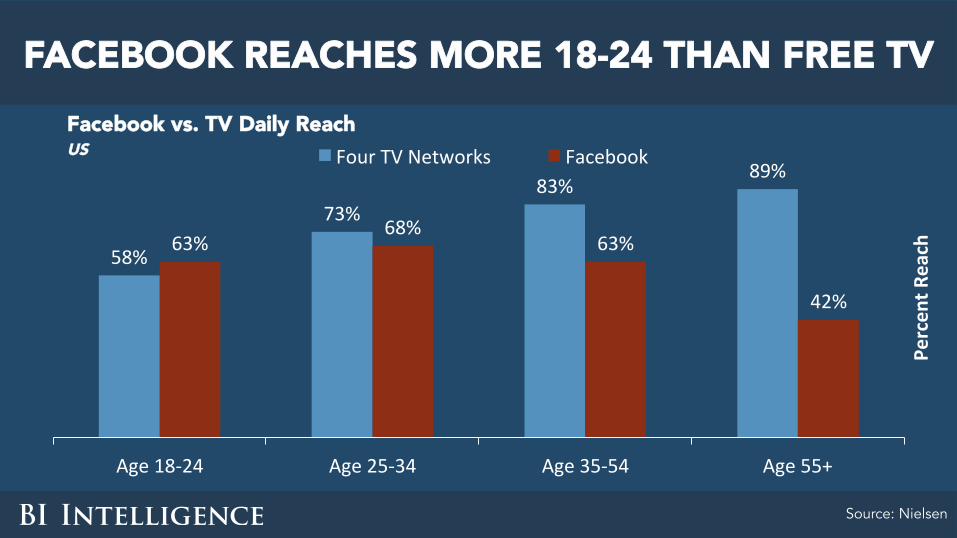
58%
73%83%
89%
63%68%
63%
42%
Age18-24 Age25-34 Age35-54 Age55+
Percen
tReach
FourTVNetworks Facebook
FACEBOOK REACHES MORE 18-24 THAN FREE TV
Source: Nielsen
Facebook vs. TV Daily Reach US
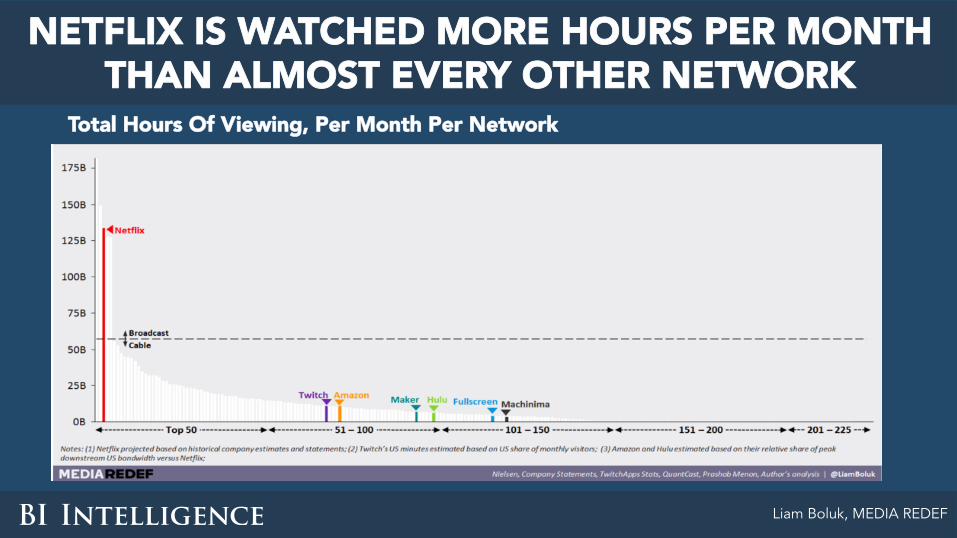
NETFLIX IS WATCHED MORE HOURS PER MONTH THAN ALMOST EVERY OTHER NETWORK
Total Hours Of Viewing, Per Month Per Network
Liam Boluk, MEDIA REDEF
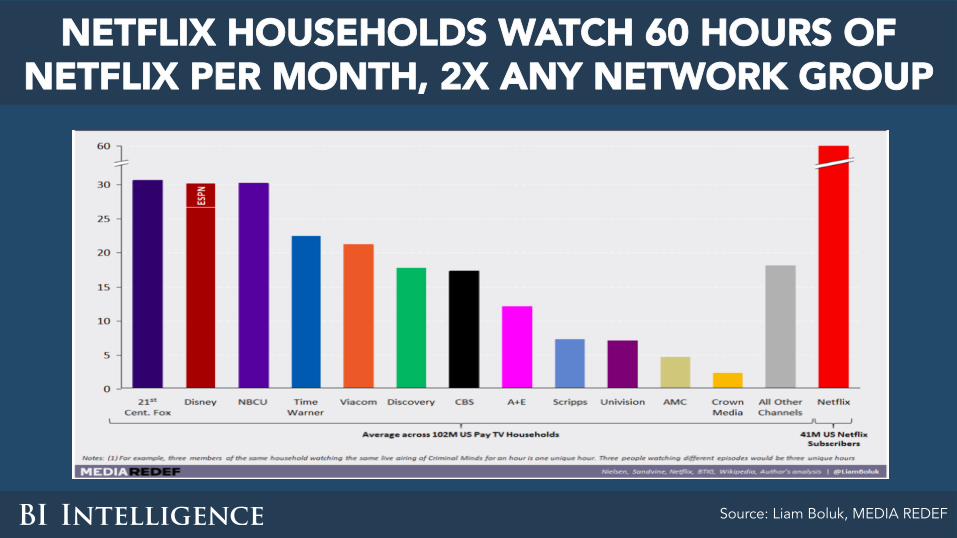
NETFLIX HOUSEHOLDS WATCH 60 HOURS OF NETFLIX PER MONTH, 2X ANY NETWORK GROUP
Source: Liam Boluk, MEDIA REDEF

YES, TV STILL DOMINATES VIEWING TIME US Consumer Time Spent On Video Per Month, 2015E, Hours
Source: Digitalsmiths, eMarketer, GfK, Sandvine, Nielsen, TDG, Activate analysis
TradiZonalTV72%
SubscripZonTV14%
Ad-Supported9%
PaidDownloads5% Total:177hours
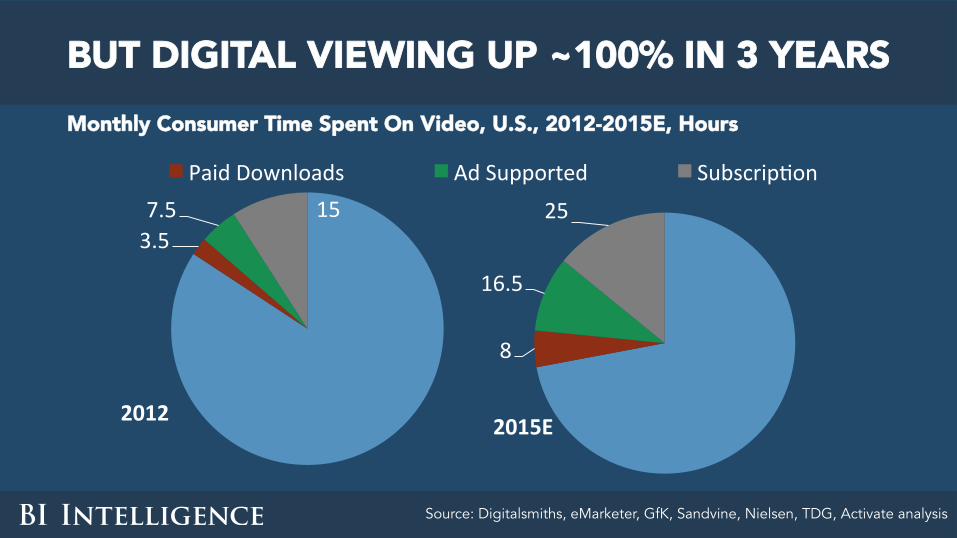
BUT DIGITAL VIEWING UP ~100% IN 3 YEARS
Source: Digitalsmiths, eMarketer, GfK, Sandvine, Nielsen, TDG, Activate analysis
3.57.5 15
PaidDownloads AdSupported SubscripZon
2012
8
16.5
25
2015E
Monthly Consumer Time Spent On Video, U.S., 2012-2015E, Hours

And the TV audience is increasingly a specific demographic…
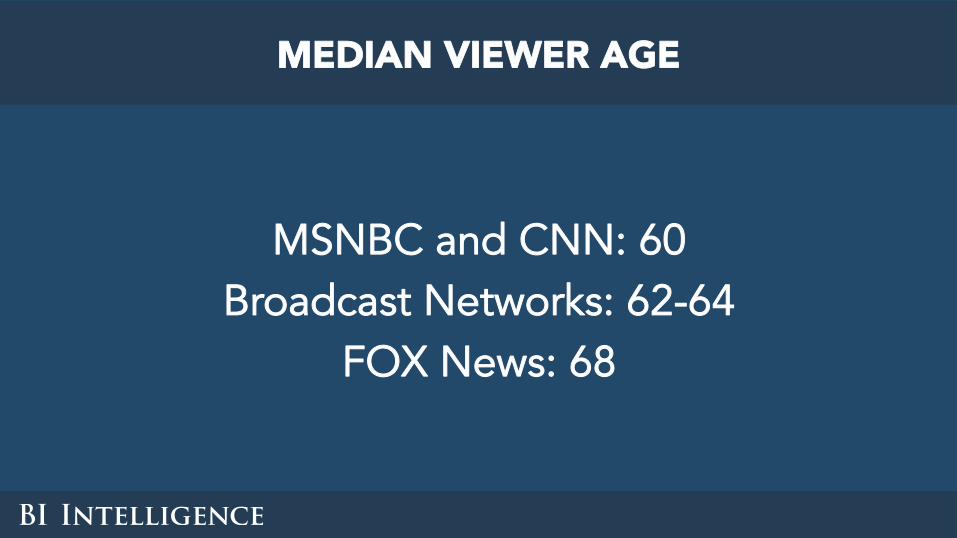
MSNBC and CNN: 60 Broadcast Networks: 62-64
FOX News: 68
MEDIAN VIEWER AGE
Convenience.
WHY IS DIGITAL TV GROWING?

We can watch what we want to watch when we want to watch it
— on any screen.
WHY IS DIGITAL GROWING?

So what’s going to happen?

First, ignore people who say “TV will die.”

Old media don’t die. They just find their niche(s). See radio and print.
There are three key parts of “TV” — and two of them are thriving.
1. Digital TV networks will continue to thrive
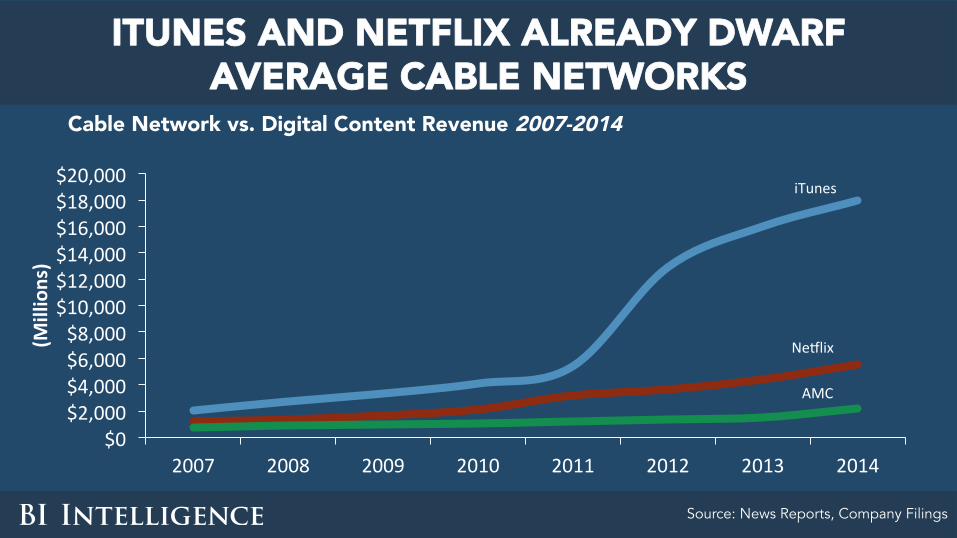
iTunes
Neilix
AMC
$0$2,000$4,000$6,000$8,000$10,000$12,000$14,000$16,000$18,000$20,000
2007 2008 2009 2010 2011 2012 2013 2014
(Millions)
ITUNES AND NETFLIX ALREADY DWARF AVERAGE CABLE NETWORKS
Source: News Reports, Company Filings
Cable Network vs. Digital Content Revenue 2007-2014

$-
$2,000
$4,000
$6,000
$8,000
$10,000
$12,000
2007 2008 2009 2010 2011 2012 2013 2014
(Millions) CBSAd
YouTubeAdRevenue
AMCNetworksRevenue
CBSAdRevenue
YOUTUBE REVENUE CLOSING IN ON BROADCAST NETWORKS
YouTube Ad Revenue Vs. CBS Ad Revenue And AMC Networks Revenue
Source: News Reports, Company Filings, BI Intelligence estimates, BofA Merrill Lynch Global Research
2. Access providers will continue to thrive — unless (until?)
real price competition

CABLE’S FUTURE IS BROADBAND Cable Subscribers Millions By Service (US)
Note: Select major cable providers Source: Leichtman Research Group
50 50 50 50 49 49 49 49 4949 49 50 51 51 52 53 53 54
Q313 Q413 Q114 Q214 Q314 Q414 Q115 Q215 Q315
TV Broadband
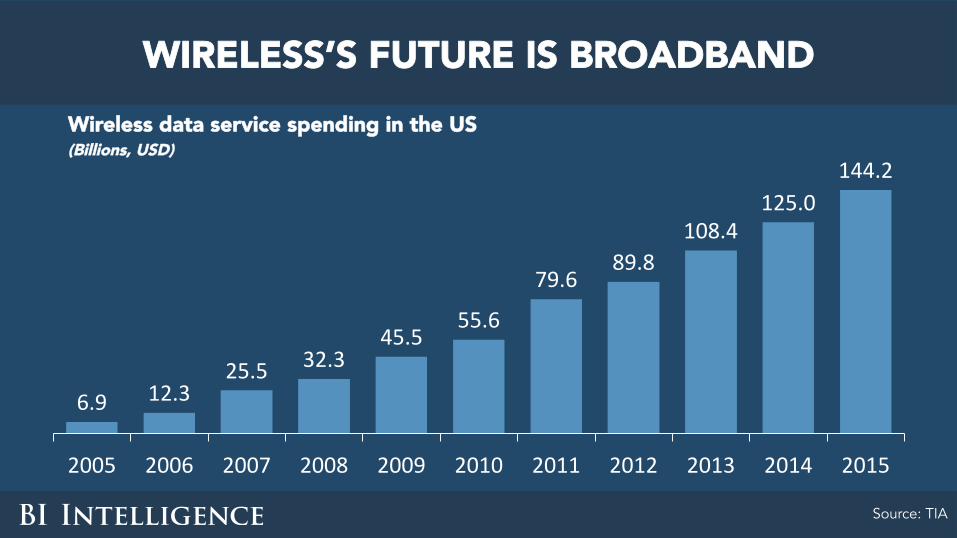
6.9 12.325.5 32.3
45.555.6
79.689.8
108.4125.0
144.2
2005 2006 2007 2008 2009 2010 2011 2012 2013 2014 2015
WIRELESS’S FUTURE IS BROADBAND Wireless data service spending in the US (Billions, USD)
Source: TIA
3. Traditional TV networks will go through ~decades of pain

Why?

Money follows eyeballs.
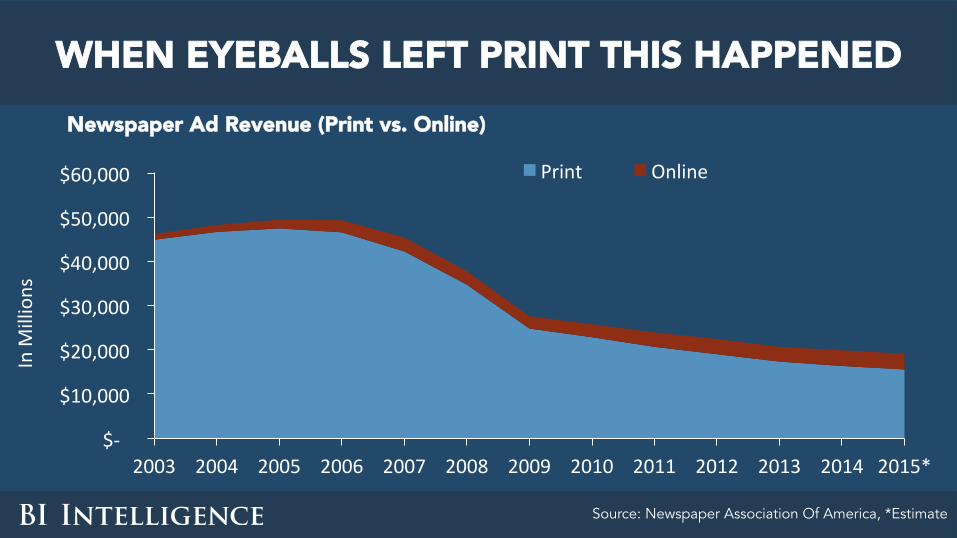
$-
$10,000
$20,000
$30,000
$40,000
$50,000
$60,000
2003 2004 2005 2006 2007 2008 2009 2010 2011 2012 2013 2014 2015*
InM
illions
Print Online
WHEN EYEBALLS LEFT PRINT THIS HAPPENED Newspaper Ad Revenue (Print vs. Online)
Source: Newspaper Association Of America, *Estimate

THERE ARE TOO MANY NETWORKS Channels Receivable And Watched Per TV Household US
Source: Nielsen
129.3 136.4151.4
168.5 179.1 189.1
17.3 17.7 17.8 17.5 17.8 17.5
2008 2009 2010 2011 2012 2013
AverageTVChannelsReceived AverageTVChannelsWatched
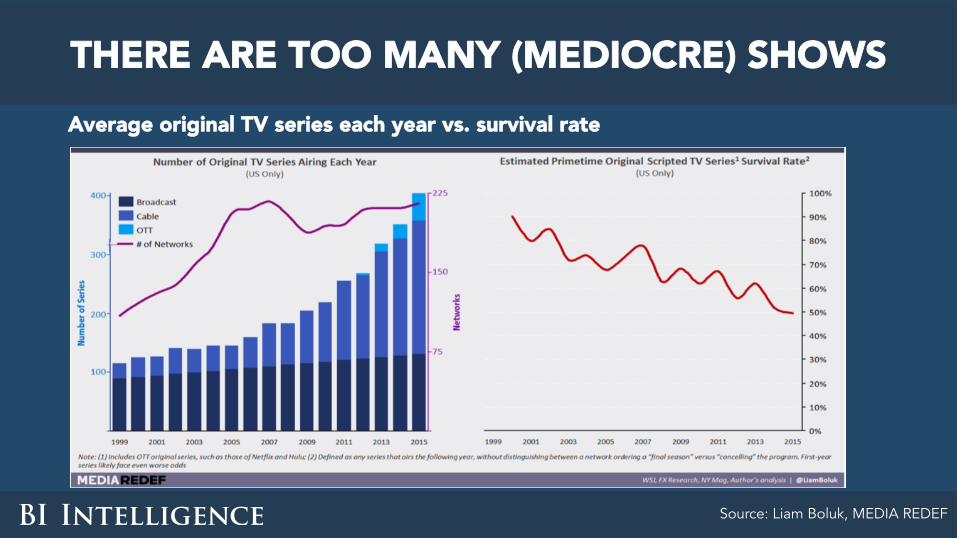
THERE ARE TOO MANY (MEDIOCRE) SHOWS Average original TV series each year vs. survival rate
Source: Liam Boluk, MEDIA REDEF

So get ready for years of consolidation and pain.
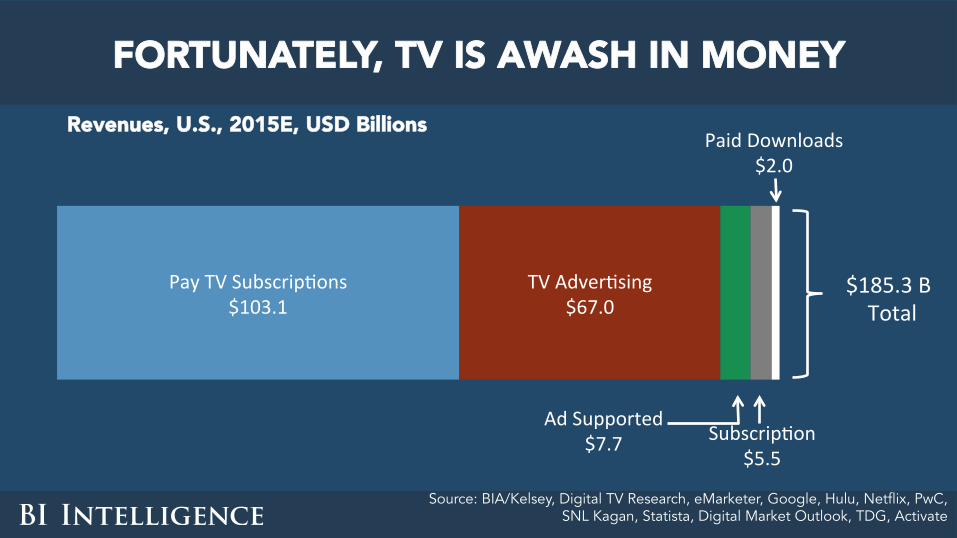
PayTVSubscripZons$103.1
TVAdverZsing$67.0
AdSupported$7.7 SubscripZon
$5.5
PaidDownloads$2.0
$185.3BTotal
FORTUNATELY, TV IS AWASH IN MONEY Revenues, U.S., 2015E, USD Billions
Source: BIA/Kelsey, Digital TV Research, eMarketer, Google, Hulu, Netflix, PwC, SNL Kagan, Statista, Digital Market Outlook, TDG, Activate

So they’ll suffer in style.

7. POWER AND WEALTH WILL BE MORE CONCENTRATED THAN EVER

$66.0
$48.8
$27.4
$13.8 $13.3 $12.5$5.5 $4.6 $3.2 $2.5 $1.6
Google Disney TimeWarner
CBS Viacom Facebook Neilix Yahoo Ganneb AOL NewYorkTimes
(Billions) -8.2%YoY
-9.7%YoY
-4.6%YoY
8.7%YoY
58.4%YoY
0.8%YoY
-3.7%YoY
10.3%YoY
8.4%YoY
25.8%YoY
-1.3%YoY
DIGITAL MEDIA IS THE NEW “BIG MEDIA” 2014 Revenue Select Media Companies
Source: Company Filings, BI Intelligence estimates

And “big media” companies are now distinctly medium-sized.

$233.7
$132.4 $127.1
$68.8 $66.0
Apple AT&T Verizon Comcast Google
Billion
s
27.9%YoY
2.9%YoY
5.4%YoY
6.4%YoY
10.3%YoY
THIS IS THE NEW “BIG” 2014 Revenue Select Media Companies
Source: Company Filings, BI Intelligence estimates

THANK YOU!

Sign up for BI Intelligence to get more content like this...
Subscribe to Business Insider’s research service to get rich analysis and key insights on today’s most relevant topics in the digital landscape:
http://read.bi/intelligence


