Paintsville Utilities, Kentucky SECTION 7 – Forecasts of Flows and Waste Loads Combined Regional Wastewater Facility Plan ____________________________________________________________________________________________________________ 61 7.01 Current Flows and Waste Loads - Paintsville Wastewater Treatment Plant: As discussed in prior chapters of this report, the Paintsville WWTP located within the Paintsville City Limits currently receives and treats all of the wastewater from the City of Paintsville and some areas just outside the city limits. The plant’s design capacity is 0.99 MGD (million gallons per day). From data recorded on the plants 2010 Discharge Monitoring Reports (DMR), the following is the average flows observed at this facility: Average Daily Flow – 2010: 0.92 MGD From data recorded on the plants 2015 DMR’s, the following is the average flows observed at the facility for the first 11 months: Average Daily Flow – 2015: 0.99 MGD The excessive daily flow recorded is mostly due to excessive infiltration and inflow in the downtown collection system. In addition due to the layout of the plant, some plant recirculation flow (RAS from polishing clarifier and supernatant flow from sludge thickener) is measured as influent flow. As shown in Table 7.01, the maximum recorded daily flows are a result of infiltration and inflow and can exceed one million gallons per day during rainfall events. As of the writing of this facility plan, Paintsville Utilities has a project ready to bid to reduce infiltration and inflow in the downtown area by eliminating several known cross connections with the storm water collection system. Upon the completion of this project, the wet weather flow to the plant from I & I should be greatly reduced.
Transcript
Paintsville Utilities, Kentucky SECTION 7 – Forecasts of Flows and Waste Loads Combined Regional Wastewater Facility Plan ____________________________________________________________________________________________________________
61
7.01 Current Flows and Waste Loads - Paintsville Wastewater Treatment Plant:
As discussed in prior chapters of this report, the Paintsville WWTP located within the
Paintsville City Limits currently receives and treats all of the wastewater from the City of
Paintsville and some areas just outside the city limits. The plant’s design capacity is
0.99 MGD (million gallons per day). From data recorded on the plants 2010 Discharge
Monitoring Reports (DMR), the following is the average flows observed at this facility:
Average Daily Flow – 2010: 0.92 MGD
From data recorded on the plants 2015 DMR’s, the following is the average flows
observed at the facility for the first 11 months:
Average Daily Flow – 2015: 0.99 MGD
The excessive daily flow recorded is mostly due to excessive infiltration and inflow in the
downtown collection system. In addition due to the layout of the plant, some plant
recirculation flow (RAS from polishing clarifier and supernatant flow from sludge
thickener) is measured as influent flow. As shown in Table 7.01, the maximum
recorded daily flows are a result of infiltration and inflow and can exceed one million
gallons per day during rainfall events. As of the writing of this facility plan, Paintsville
Utilities has a project ready to bid to reduce infiltration and inflow in the downtown area
by eliminating several known cross connections with the storm water collection system.
Upon the completion of this project, the wet weather flow to the plant from I & I should
be greatly reduced.
Paintsville Utilities, Kentucky SECTION 7 – Forecasts of Flows and Waste Loads Combined Regional Wastewater Facility Plan ____________________________________________________________________________________________________________
62
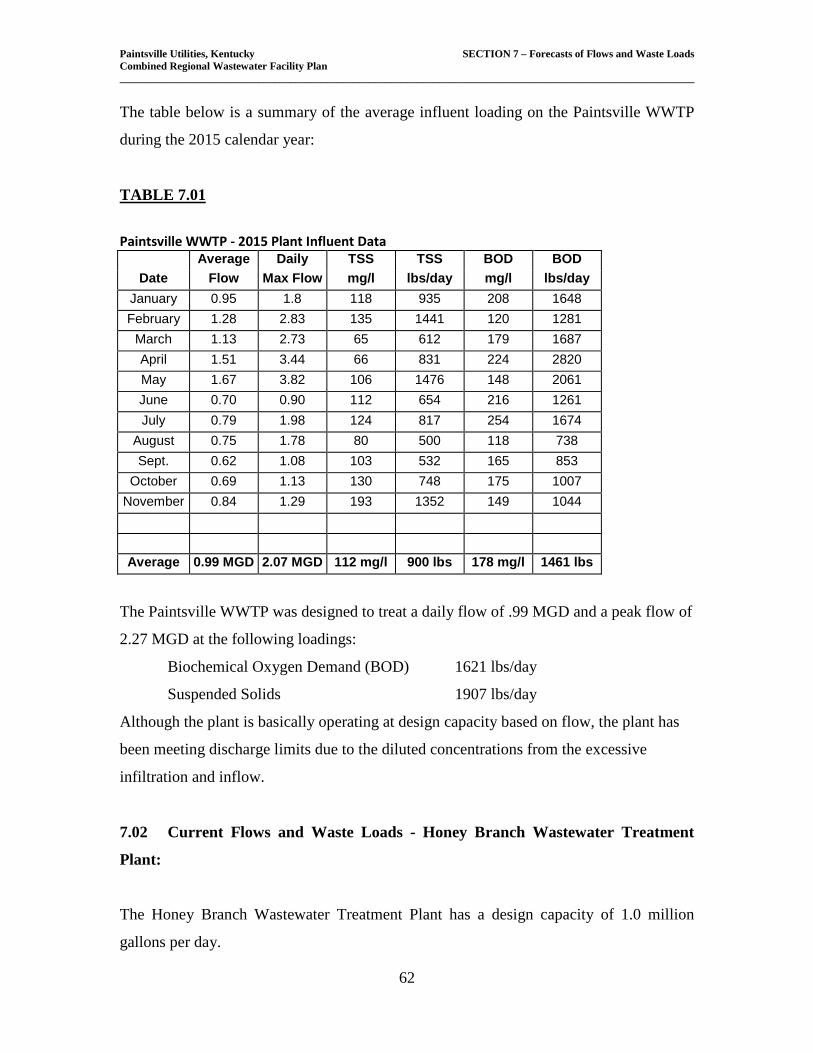
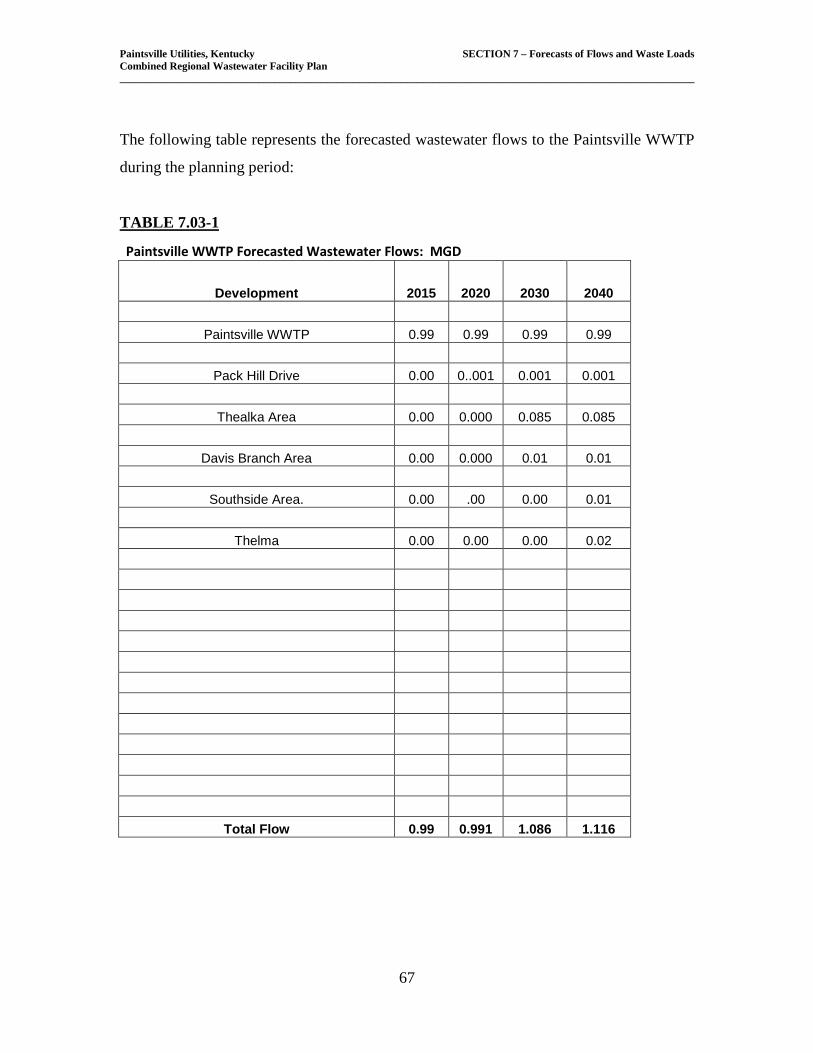
The table below is a summary of the average influent loading on the Paintsville WWTP
during the 2015 calendar year:
TABLE 7.01
Paintsville WWTP - 2015 Plant Influent Data
Average Daily TSS TSS BOD BOD Date Flow Max Flow mg/l lbs/day mg/l lbs/day
January 0.95 1.8 118 935 208 1648 February 1.28 2.83 135 1441 120 1281
March 1.13 2.73 65 612 179 1687 April 1.51 3.44 66 831 224 2820 May 1.67 3.82 106 1476 148 2061 June 0.70 0.90 112 654 216 1261 July 0.79 1.98 124 817 254 1674
Paintsville Utilities, Kentucky SECTION 7 – Forecasts of Flows and Waste Loads Combined Regional Wastewater Facility Plan ____________________________________________________________________________________________________________
74
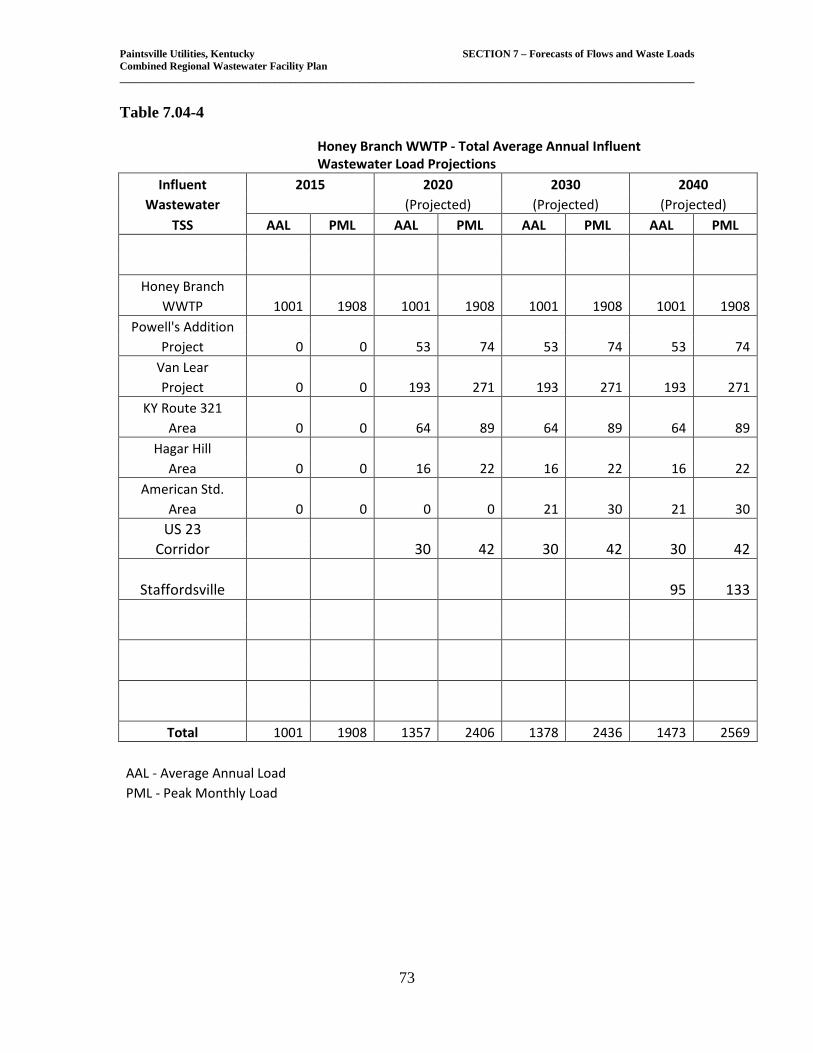
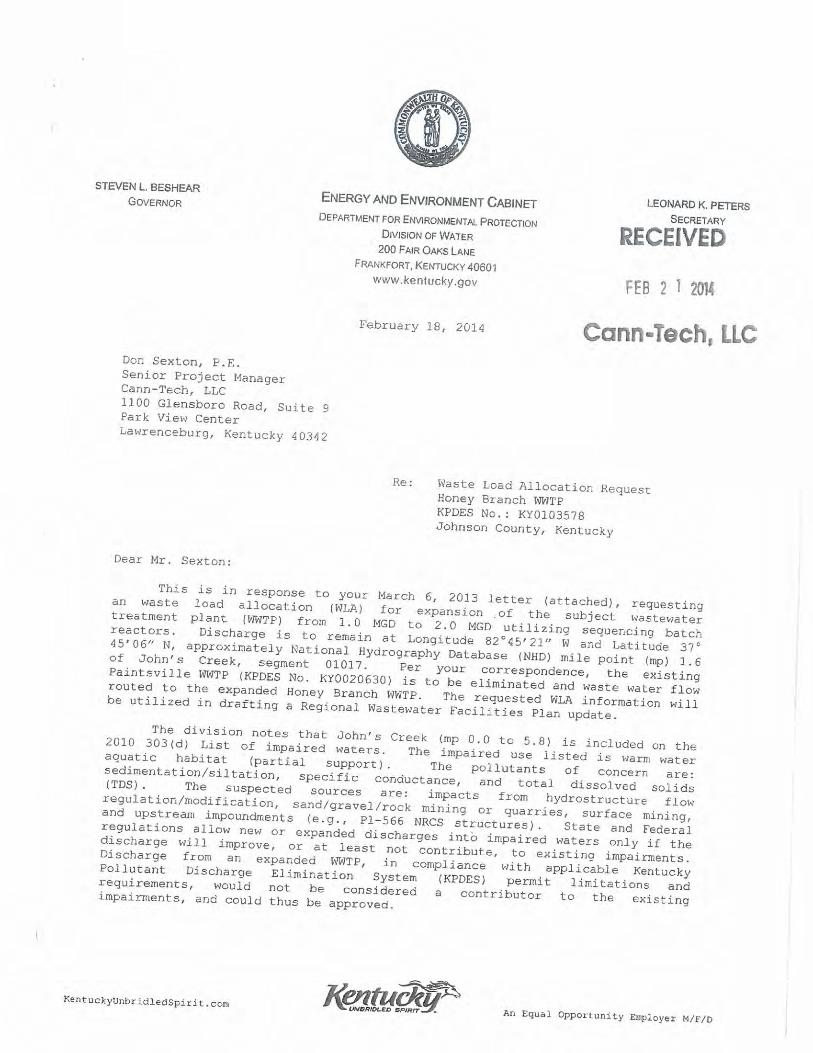
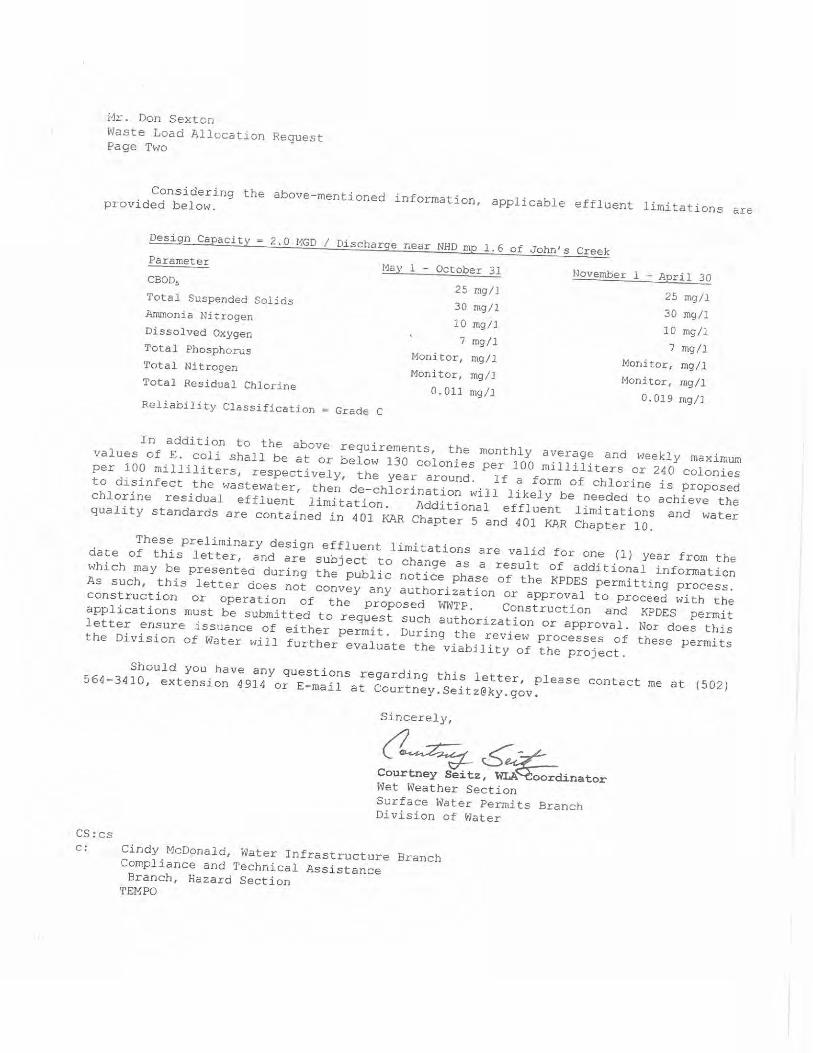
7.05 Projected Permit Limits and Wasteload Allocation
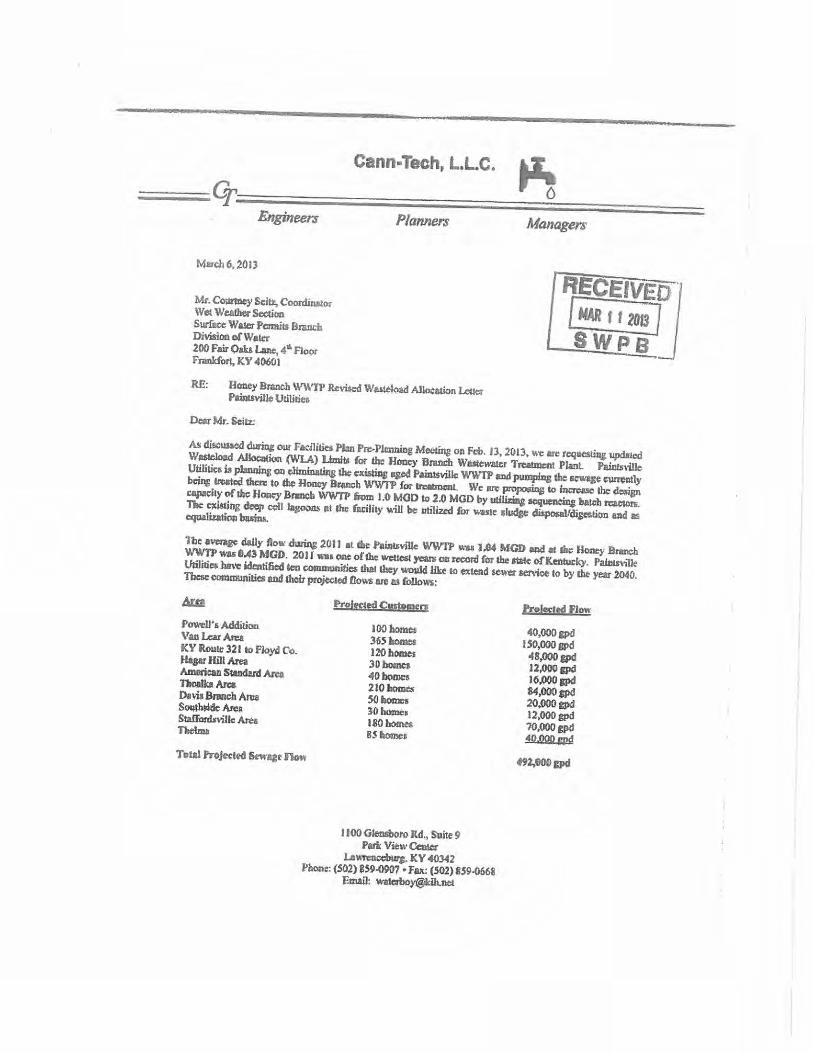
The Kentucky Division of Water was contacted in a letter dated March 6, 2013 regarding
a future discharge from the Honey Branch WWTP at mile point 1.7 into John’s Creek for
a treatment plant having a design capacity of 2.0 mgd. A response from KDOW was
received on Feb. 18, 2014. A copy of these letters is included in this section of this
document.
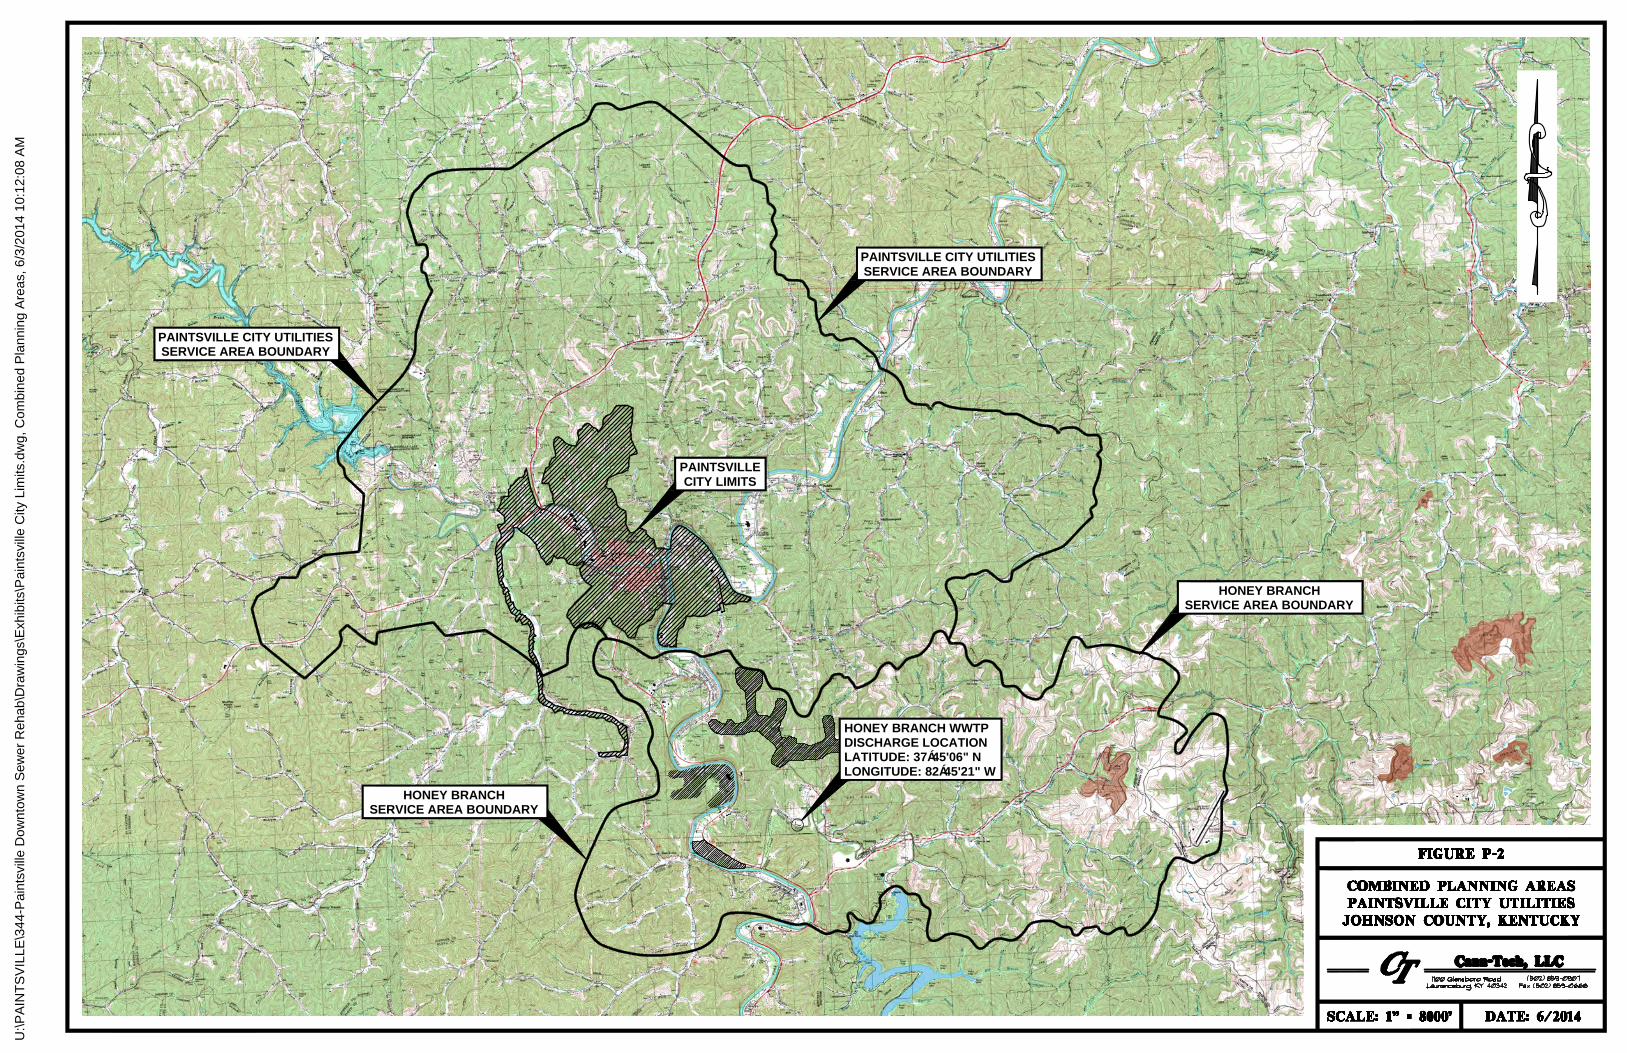
PAINTSVILLE CITY UTILITIESSERVICE AREA BOUNDARY
HONEY BRANCHSERVICE AREA BOUNDARY
PAINTSVILLE CITY UTILITIESSERVICE AREA BOUNDARY
HONEY BRANCHSERVICE AREA BOUNDARY
PAINTSVILLECITY LIMITS
HONEY BRANCH WWTPDISCHARGE LOCATIONLATITUDE: 37Á45'06" NLONGITUDE: 82Á45'21" W
U:\P
AIN
TS
VILLE
\344-P
aintsville D
ow
ntow
n S
ew
er R
ehab\D
raw
ings\E
xhibits\P
aintsville C
ity Lim
its.dw
g, C
om
bined P
lanning A
reas, 6/3/2014 10:12:08 A
M
Paintsville Utilities, Kentucky SECTION 8 – Evaluation of Alternates Combined Regional Wastewater Facilities Plan
81
8.0 General The primary purpose of this Facilities Plan is to determine the most cost-effective and
environmentally sound means of meeting the wastewater needs for the City of Paintsville.
The first step in this evaluation is to consider all applicable alternatives for Paintsville
with its two wastewater treatment plants. The first consideration would be whether to
remain a decentralized system or to combine into a regional facility. Options for these
will be evaluated including doing nothing.
8.10 No Action Alternative Due to Agreed Order set by the KDOW and EPA and the fact that the Paintsville WWTP
is operating near or at its rated capacity, the “No-Action” alternative will not be
considered as a part of this planning document.
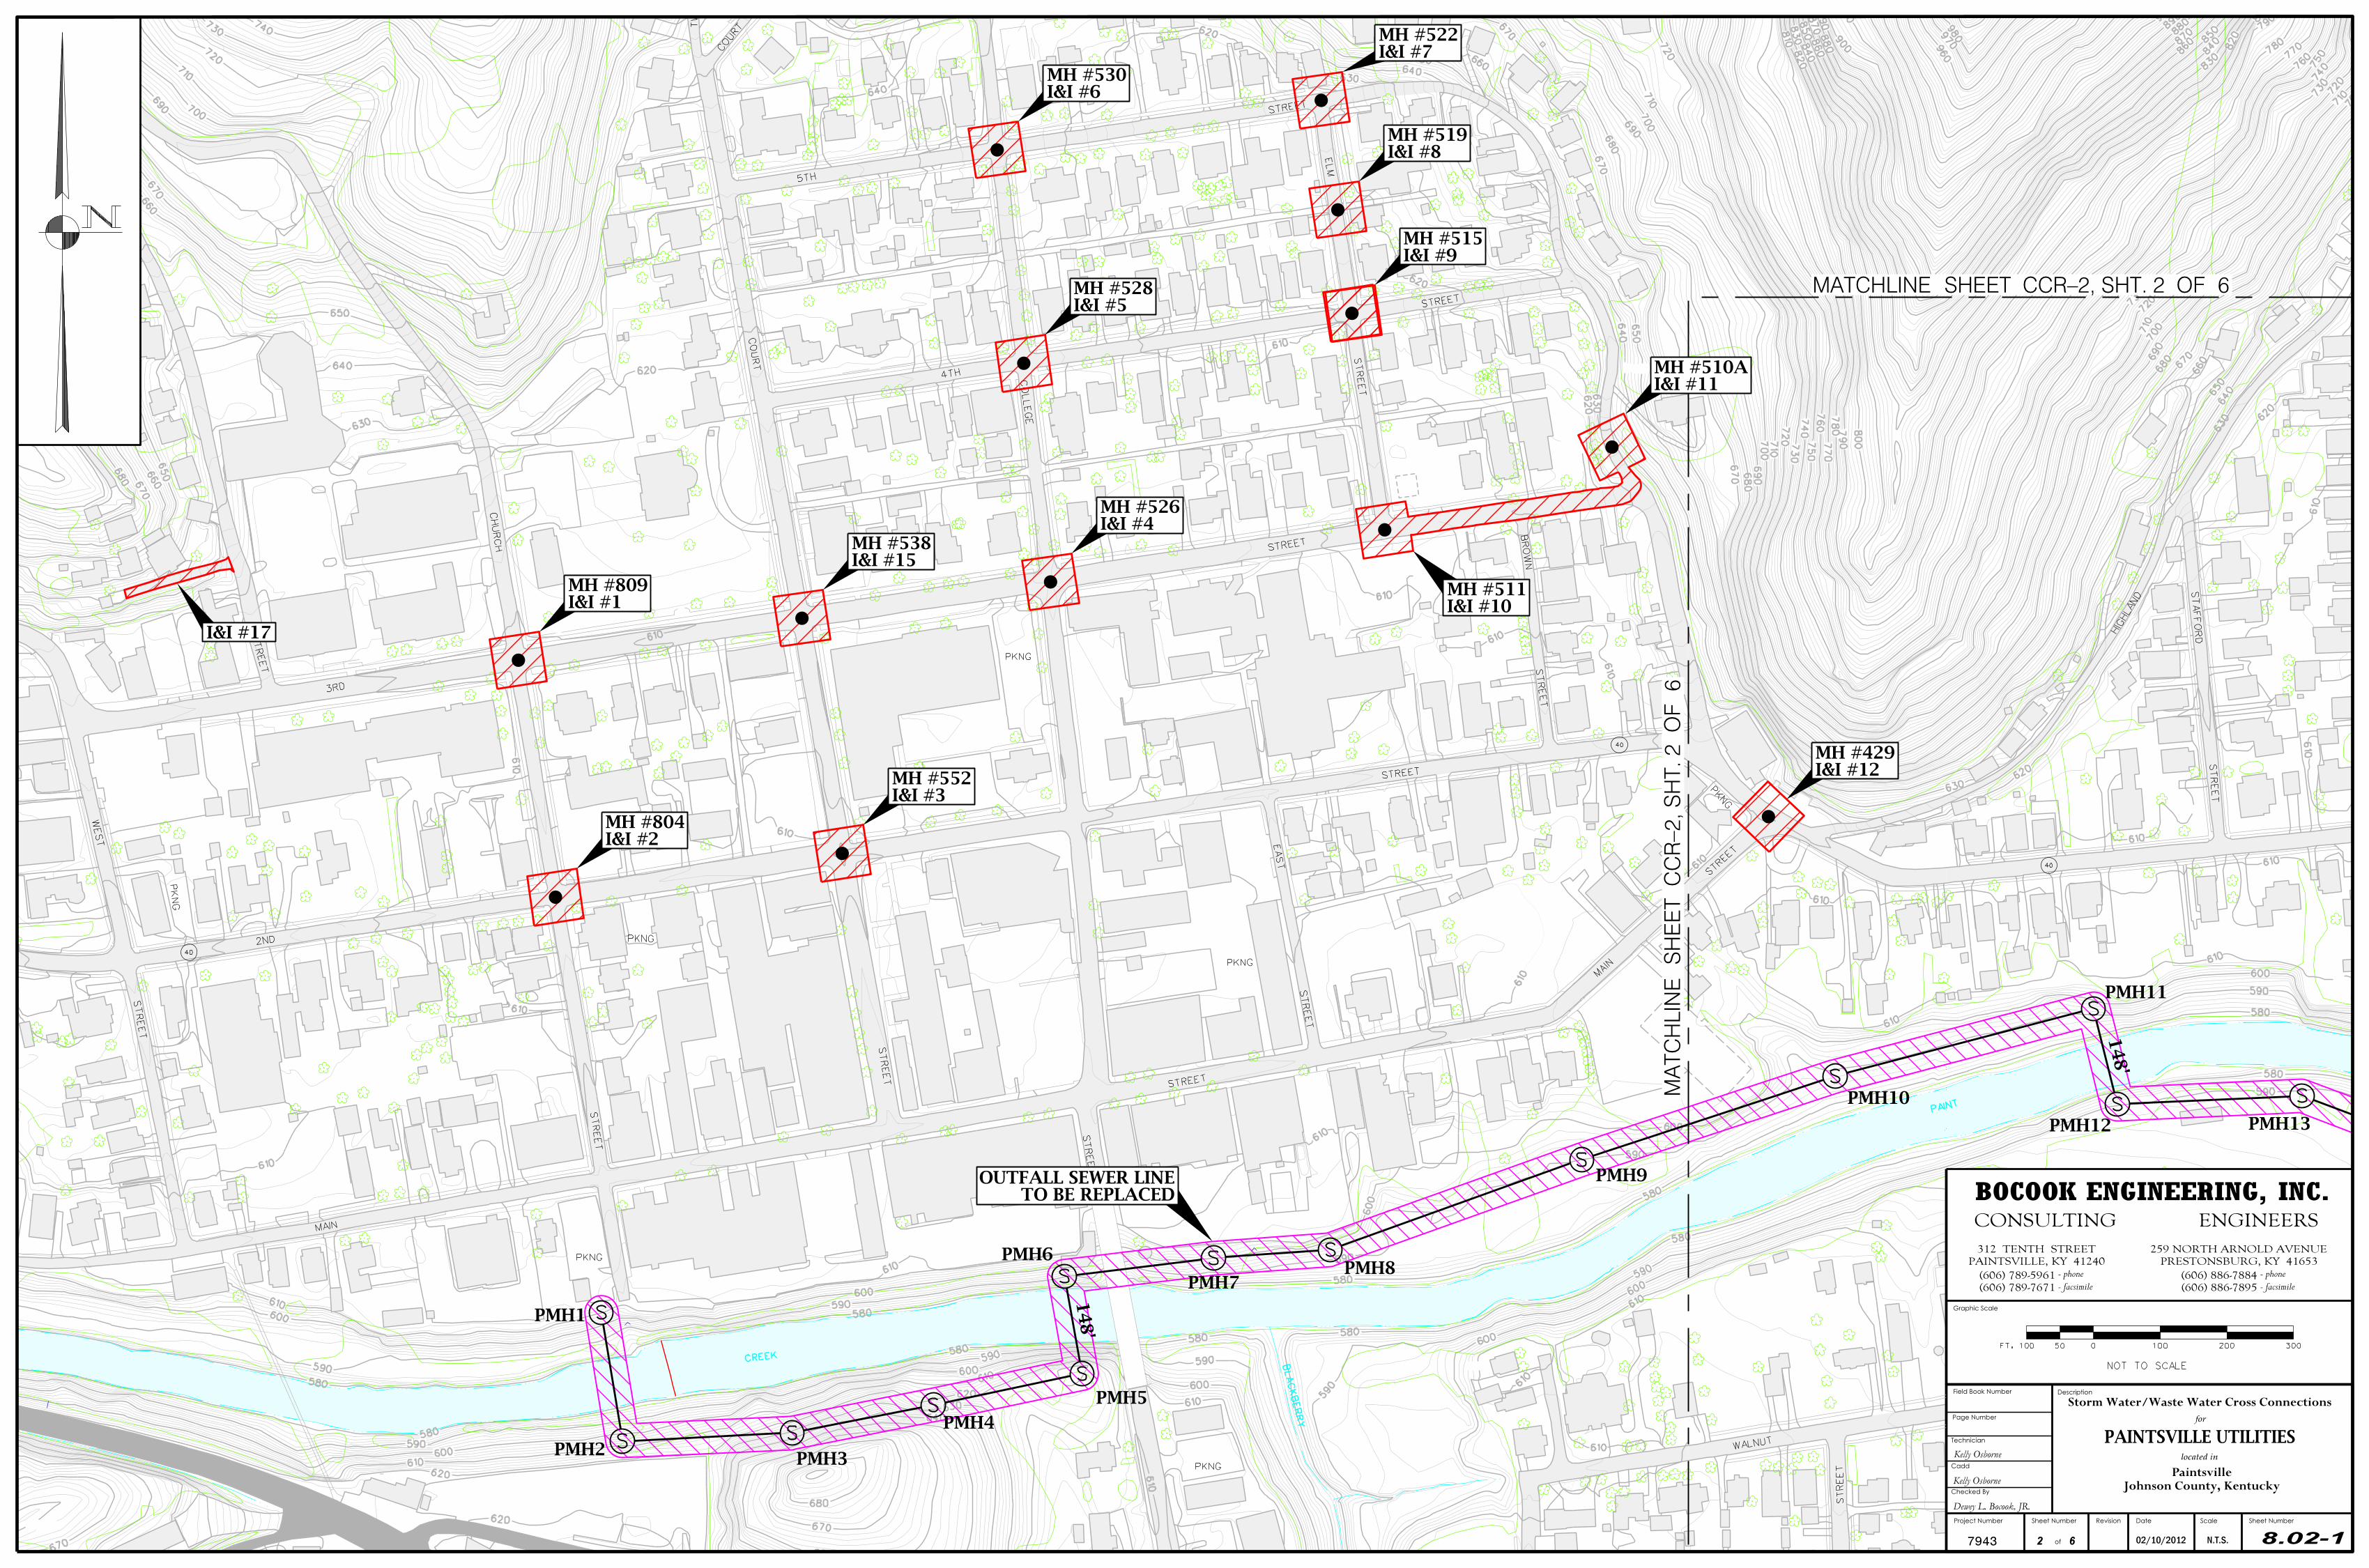
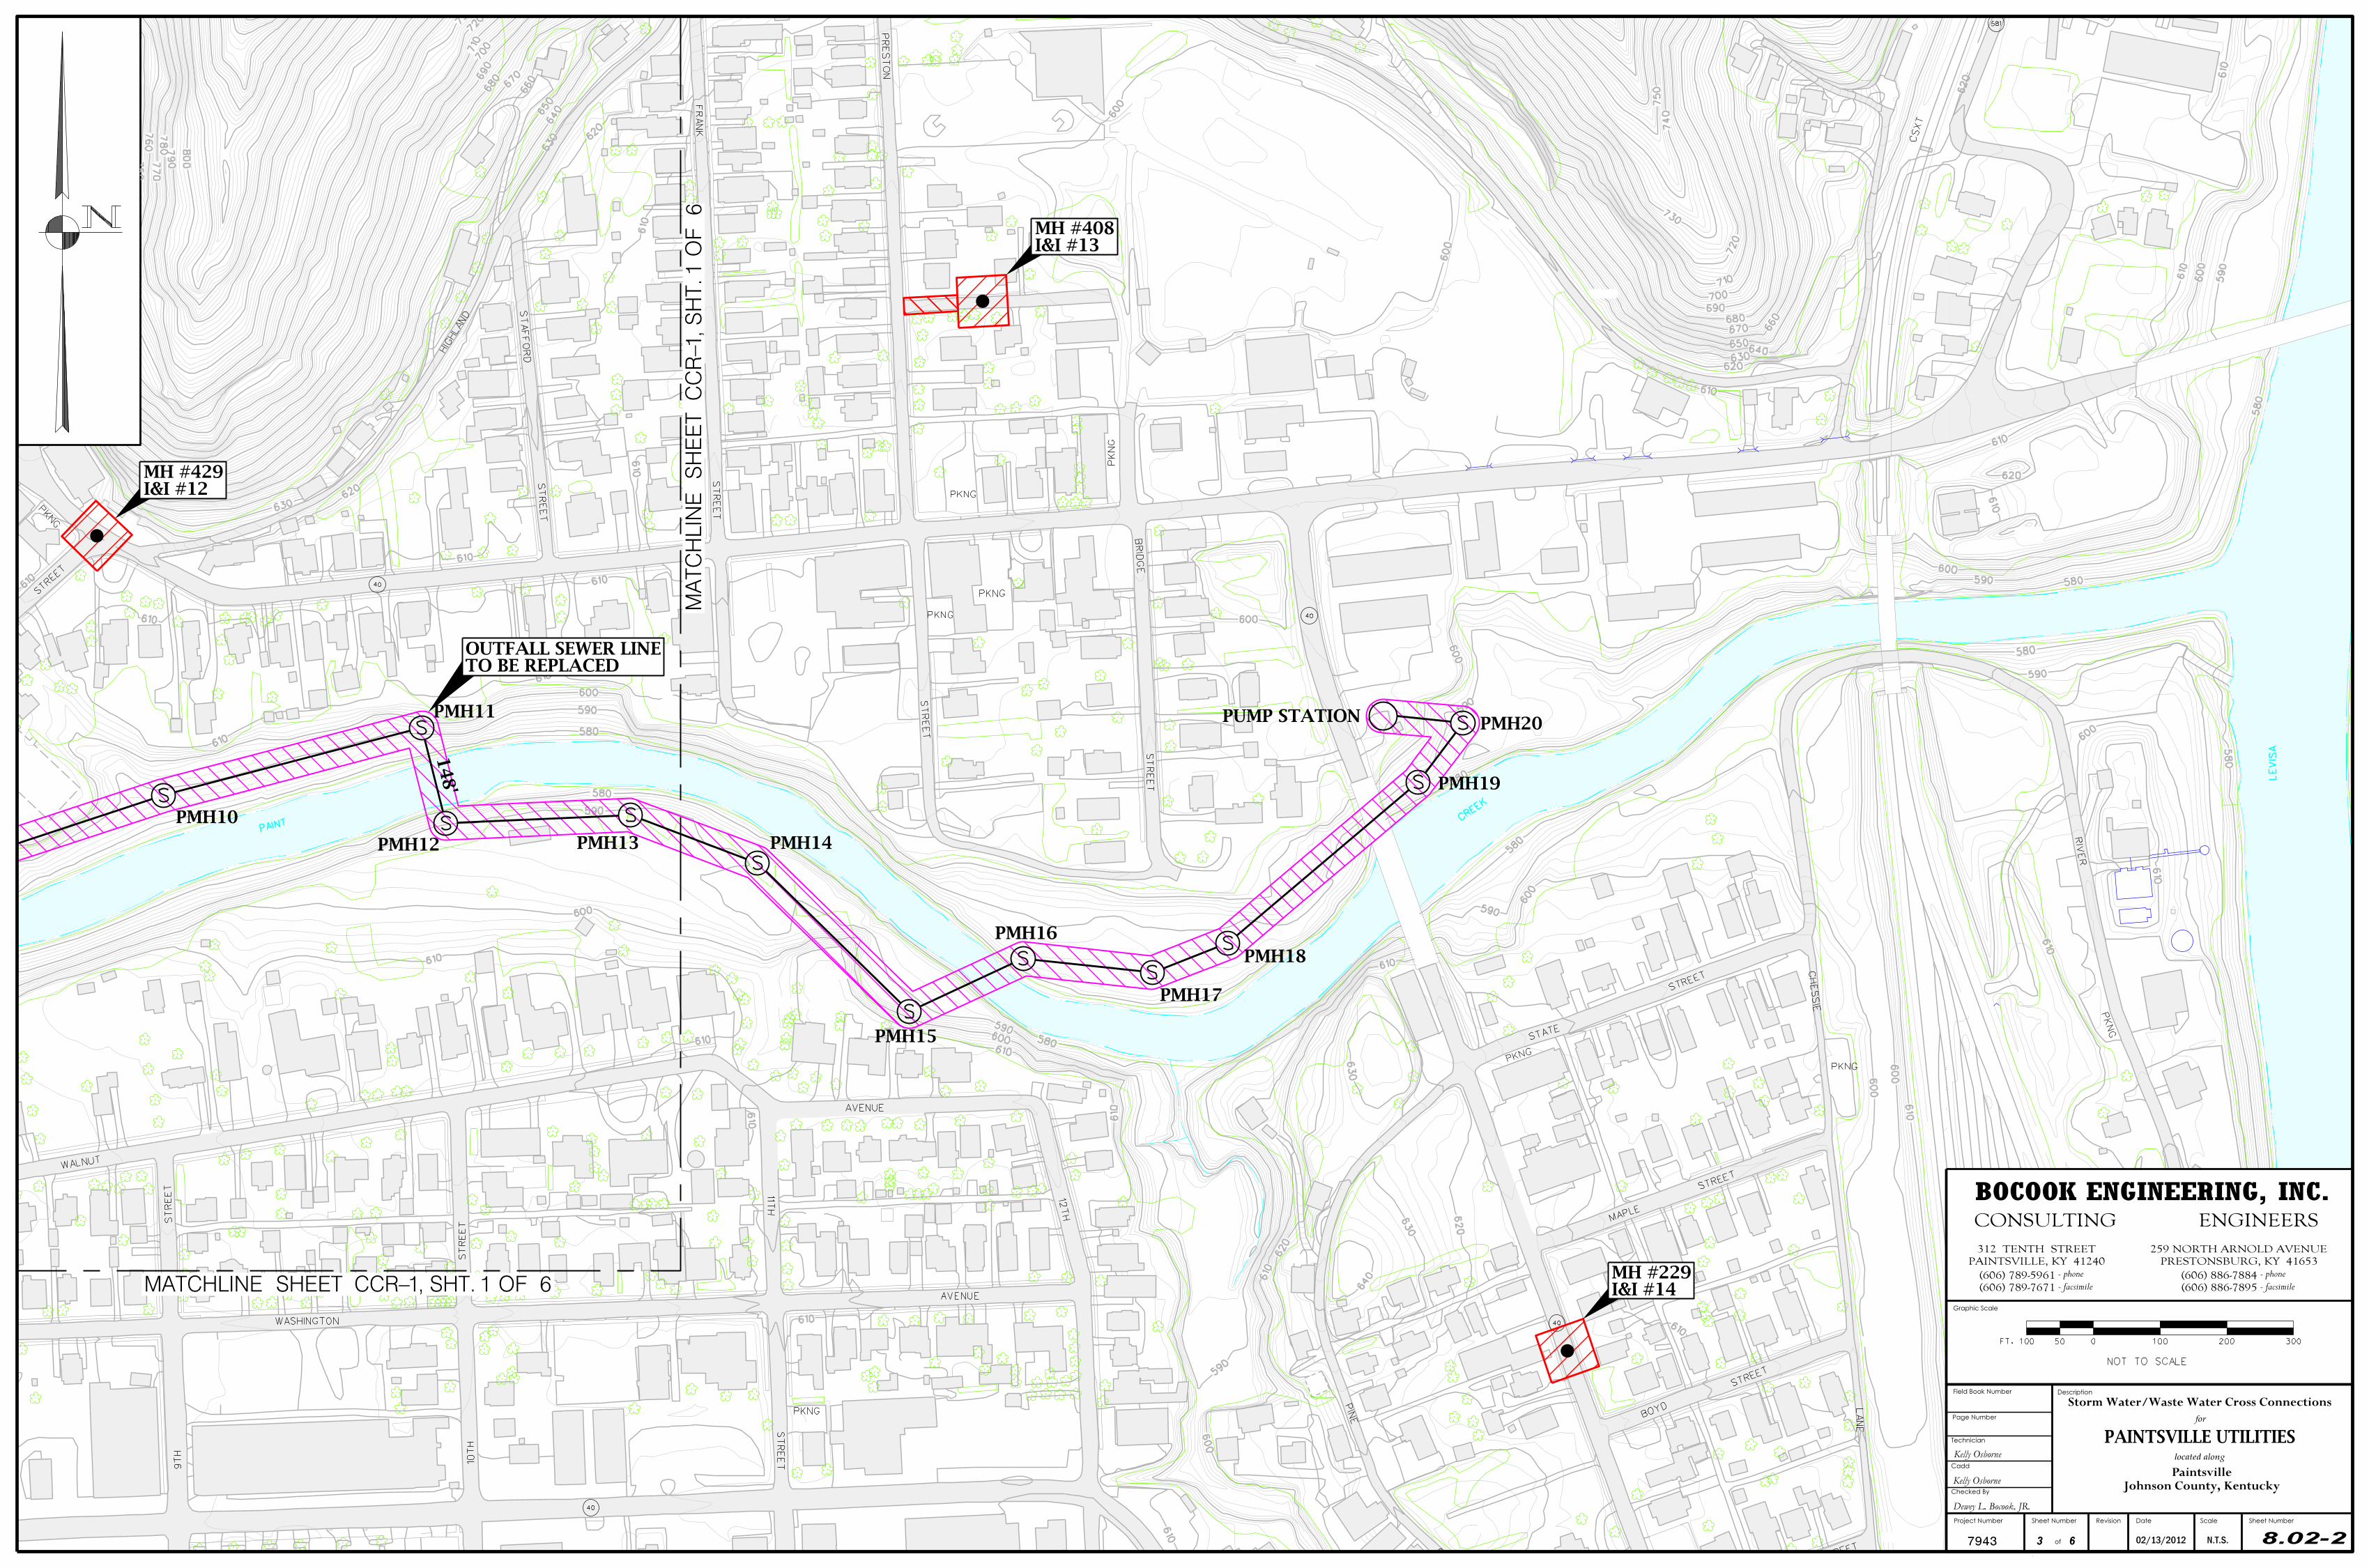
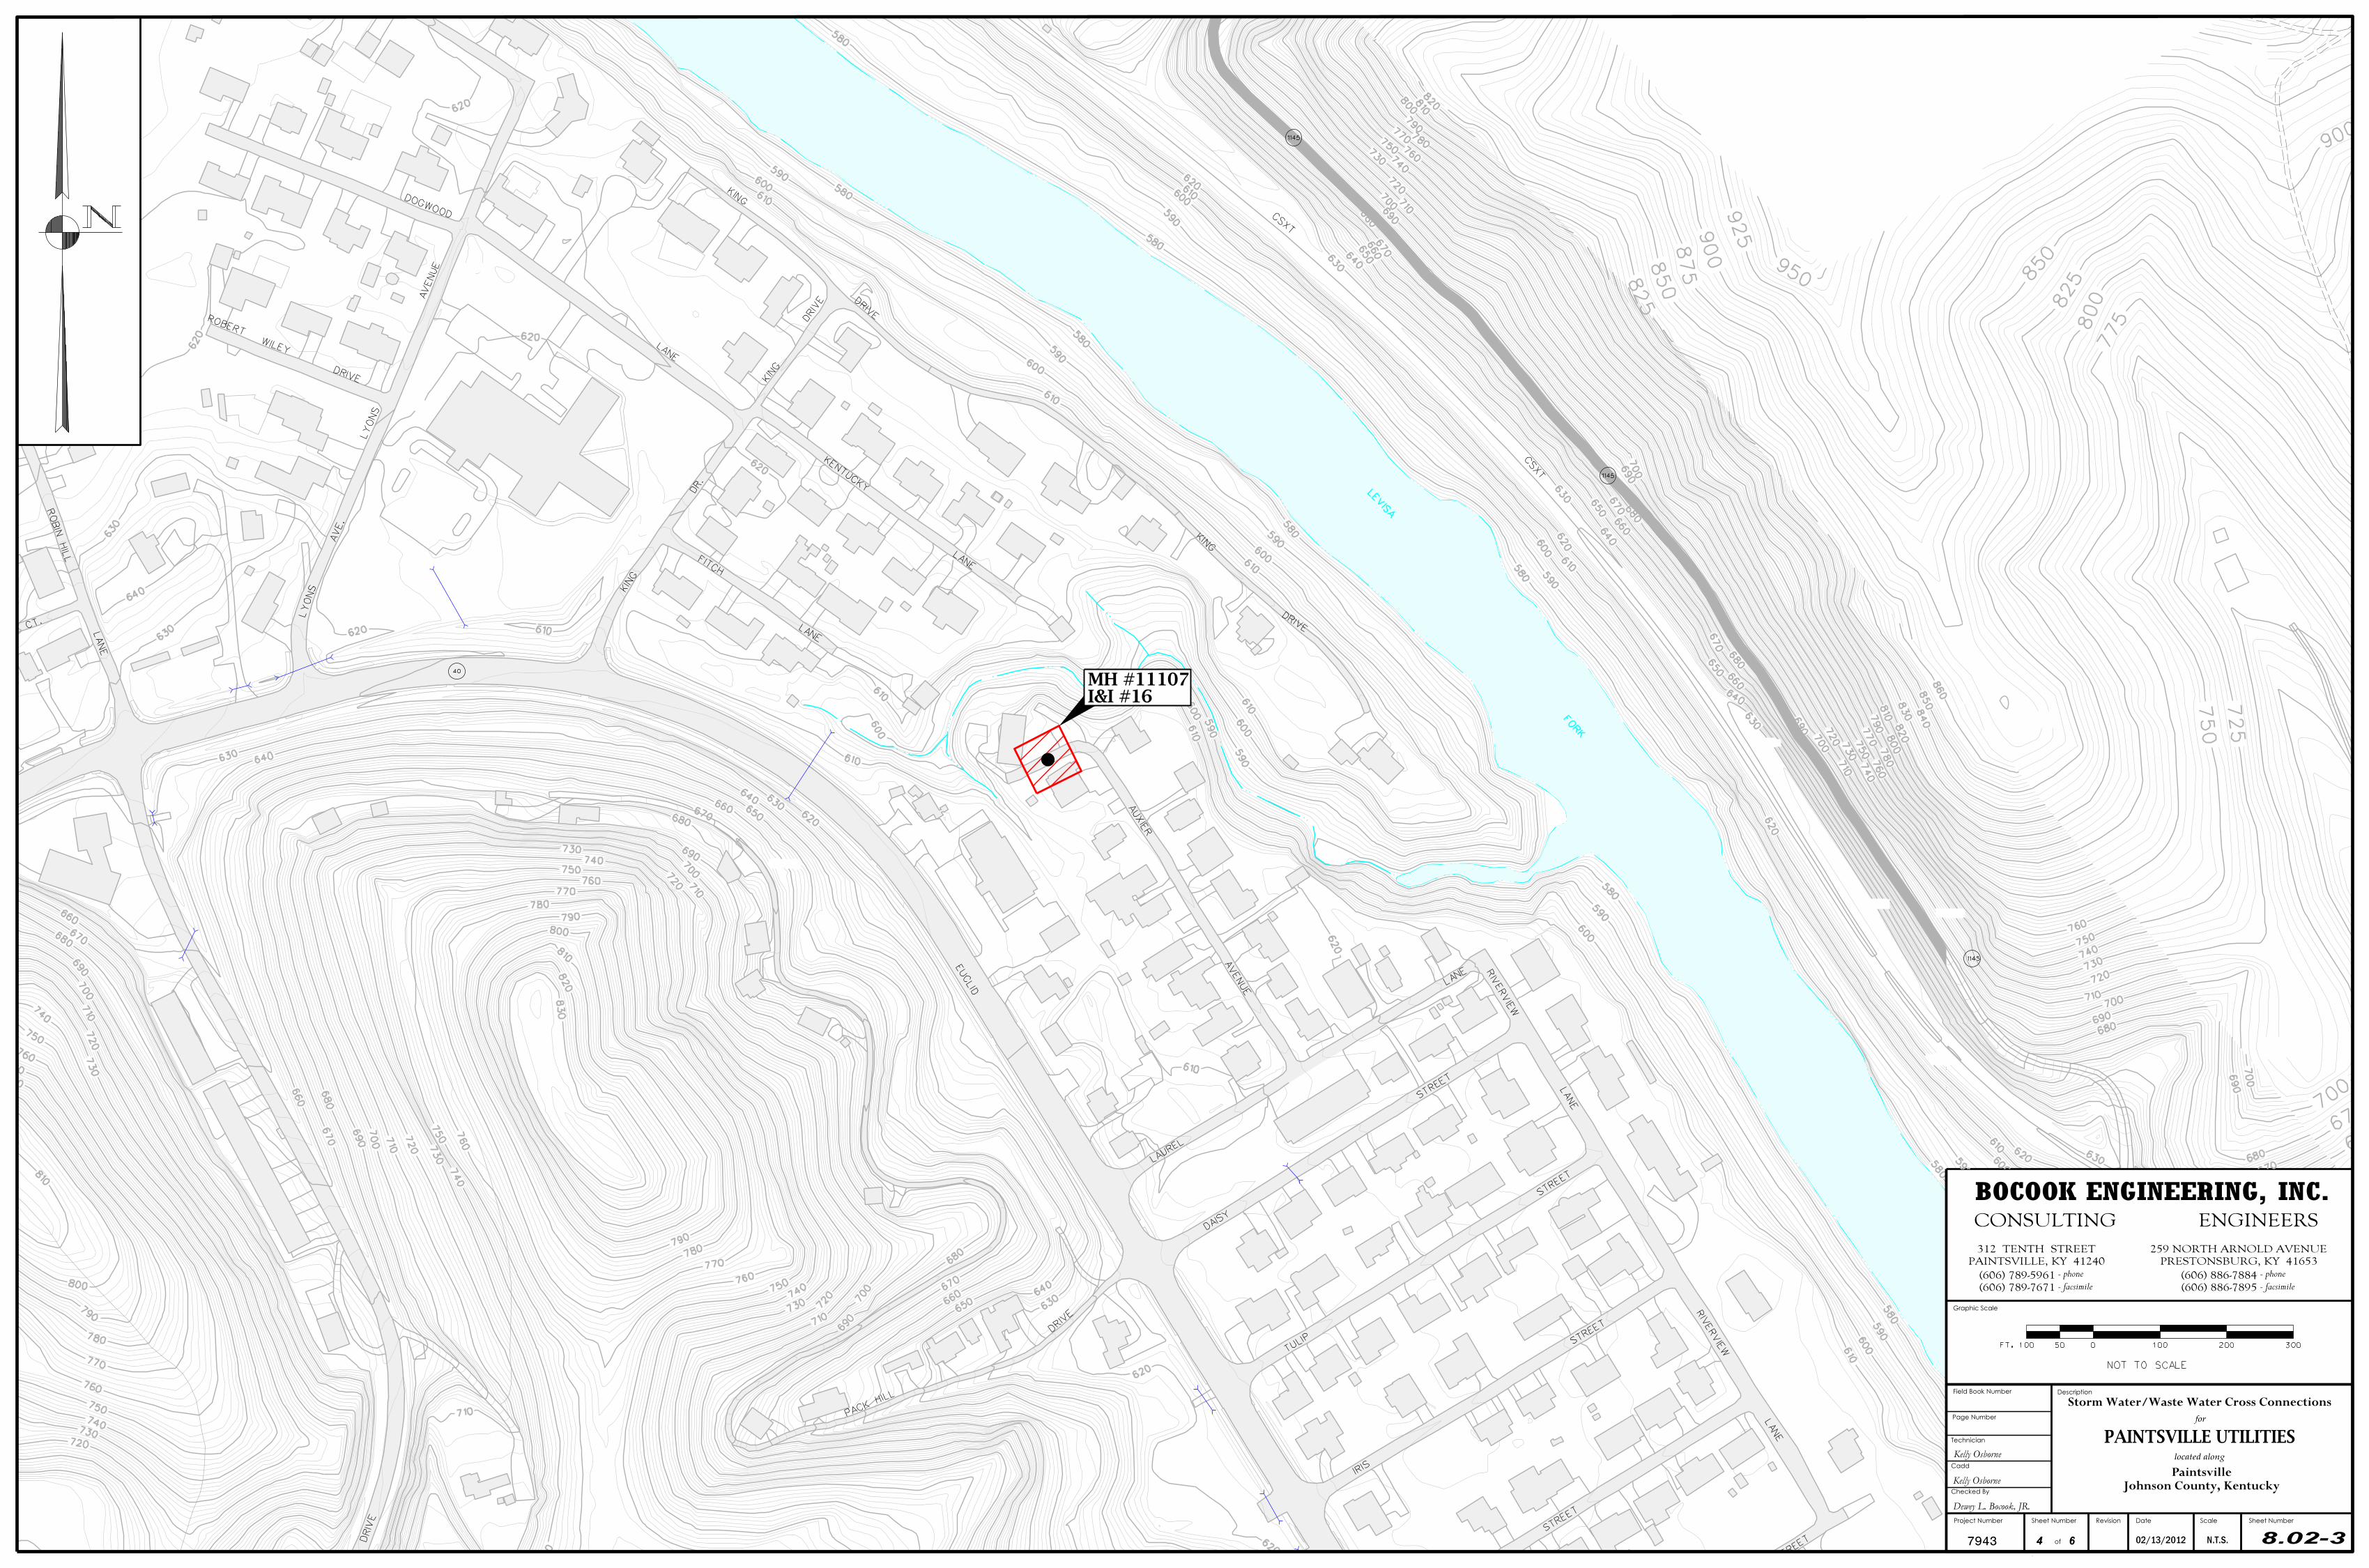
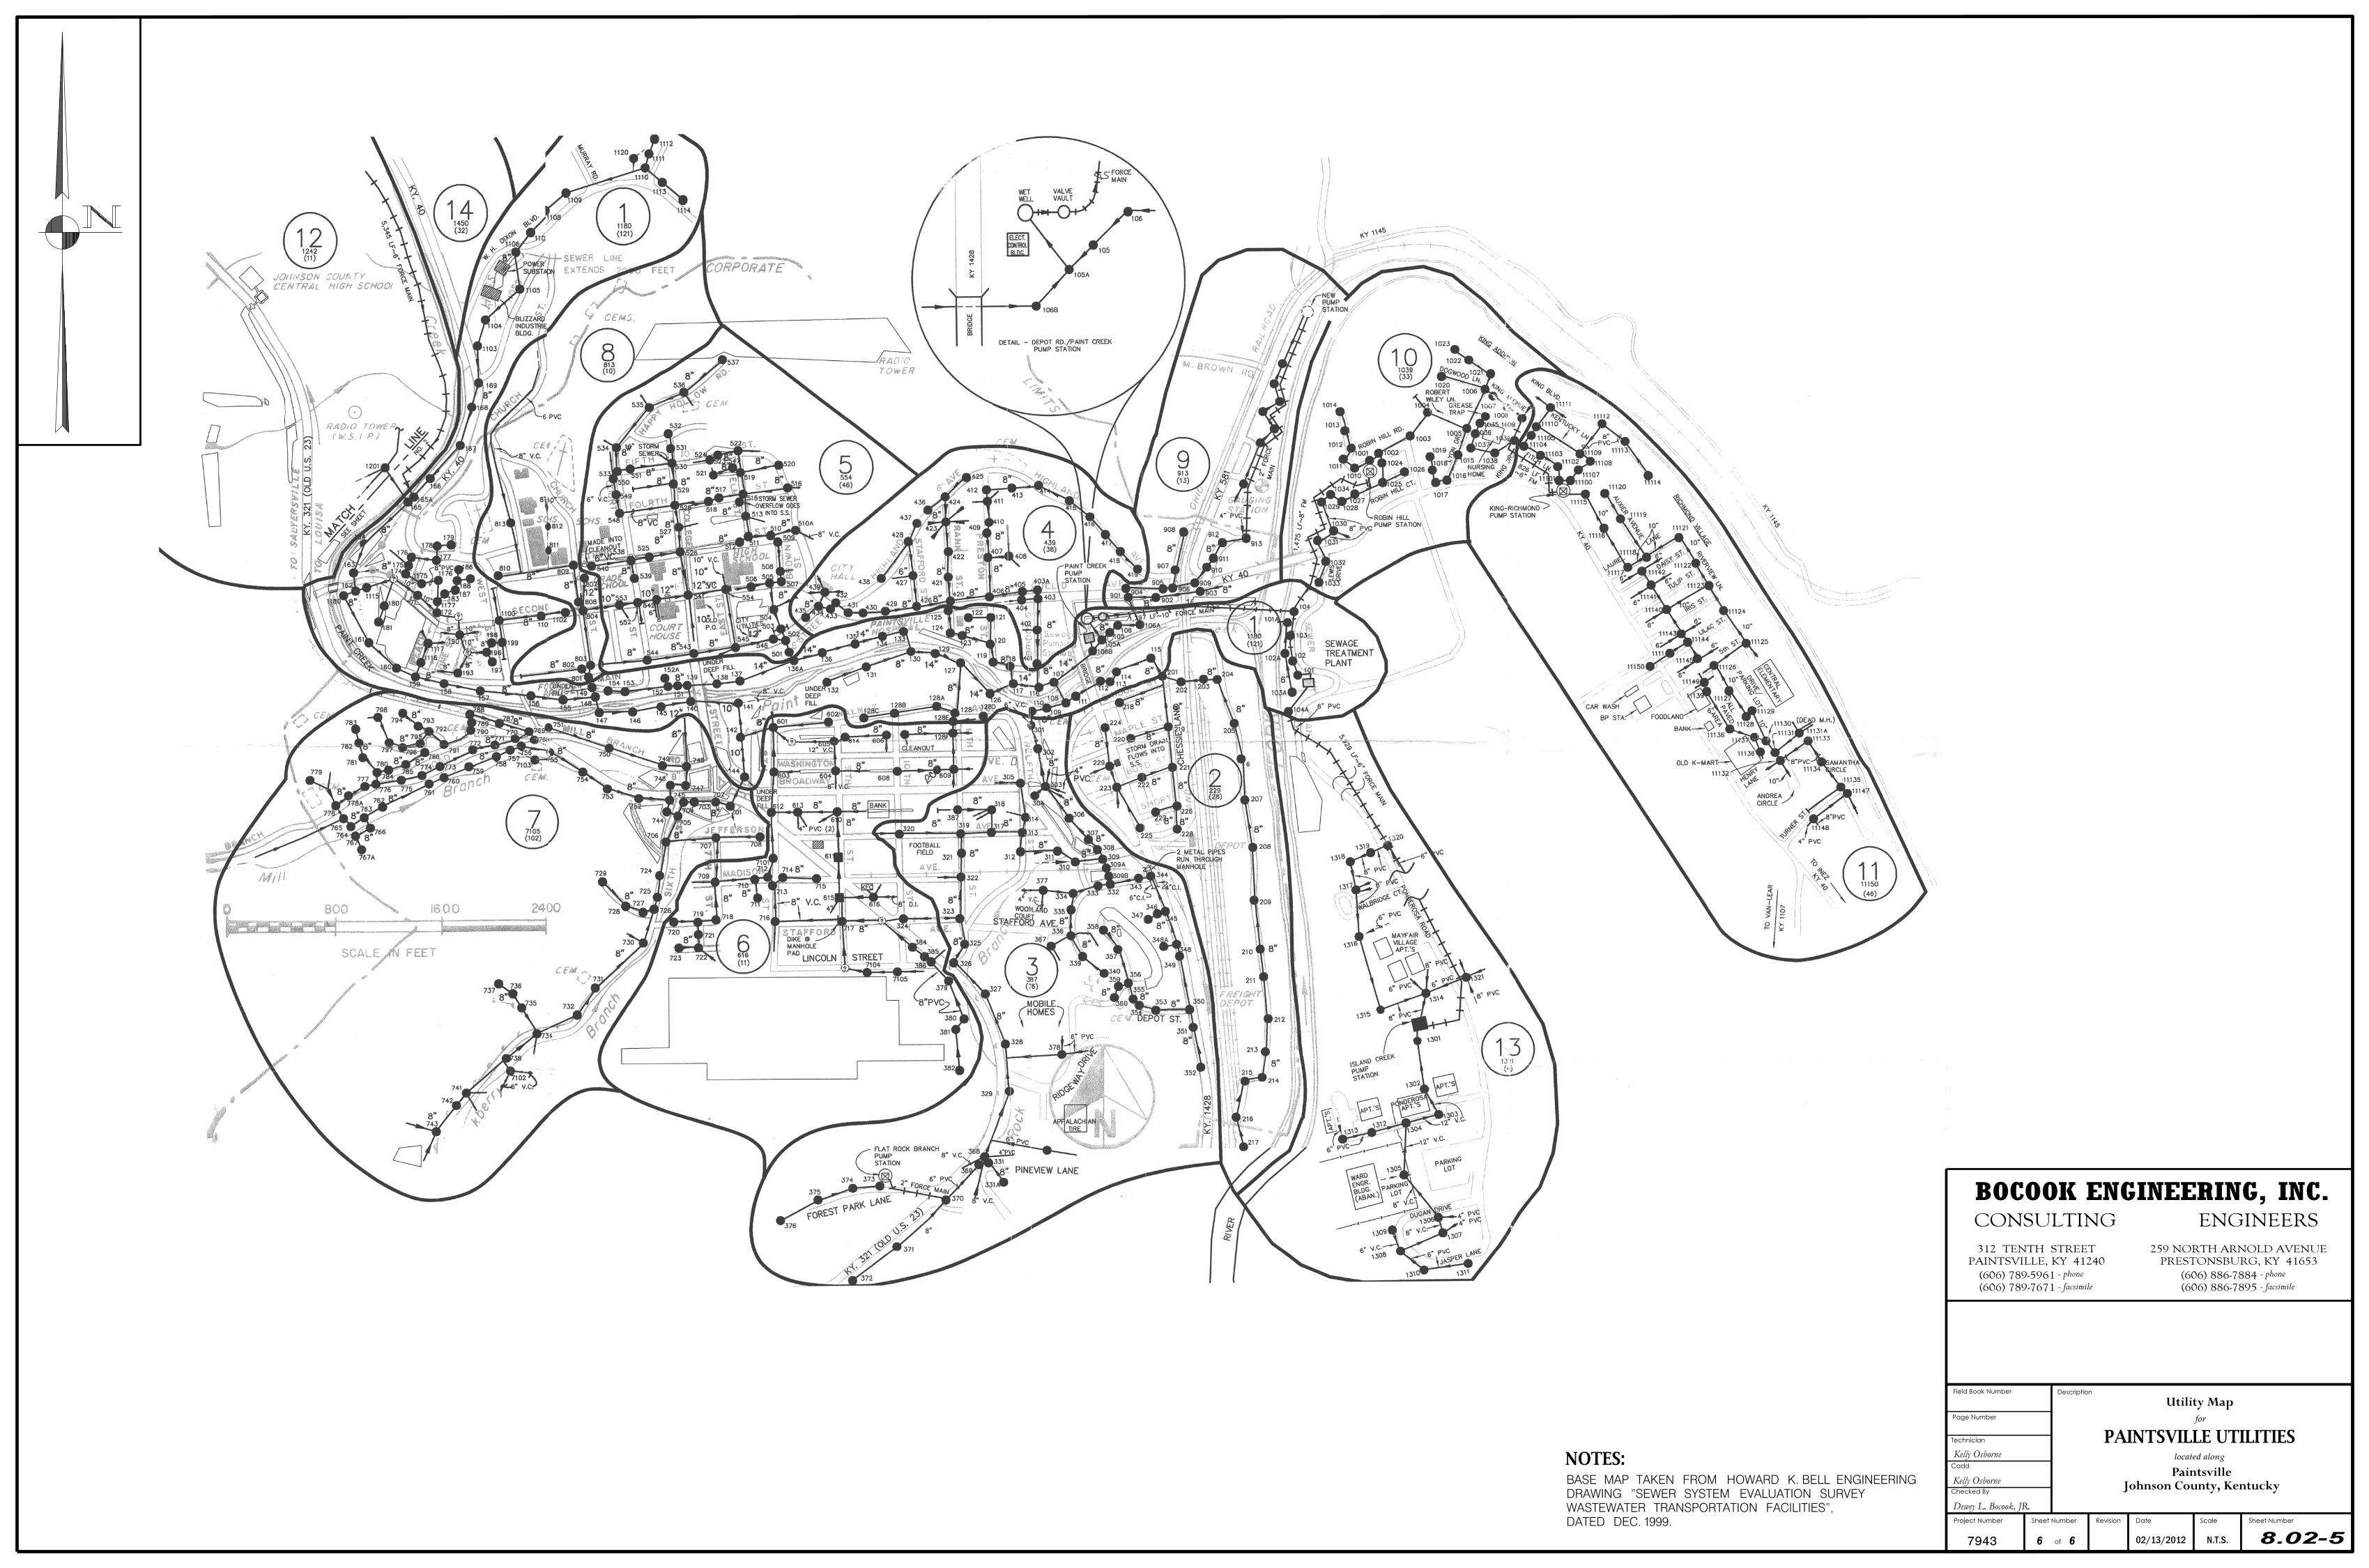
COLLECTION SYSTEM: 8.202 Collection System Improvements
As discussed in Section 6 of this facilities plan, the downtown gravity collection system
currently has excessive inflow and infiltration that has resulted in excessive flows to the
Paintsville WWTP. Prior studies and smoke testing has identified 17 locations where
there are cross connections or know issues with the existing storm water collection
system and the existing sanitary sewer collection system. During heavy rains, these
cross connections cause much of the excessive flow to the wastewater outfall system and
to the existing waste water treatment plant. This excessive inflow results in sanitary
sewage overflows along the outfall sewer and causes operation issues at the wastewater
treatment plant. The locations of these cross connections are shown on Figure 8.02-1
through 8.02-3. Figure 8.02-6 is a key map showing general locations of proposed
improvements to the collection system. In order to correct these cross connections it will
be necessary to basically re-construct the sanitary and storm systems at these
intersections. A detailed cost estimate for each location is included in the Appendix of
this report.
Paintsville Utilities, Kentucky SECTION 8 – Evaluation of Alternates Combined Regional Wastewater Facilities Plan
82
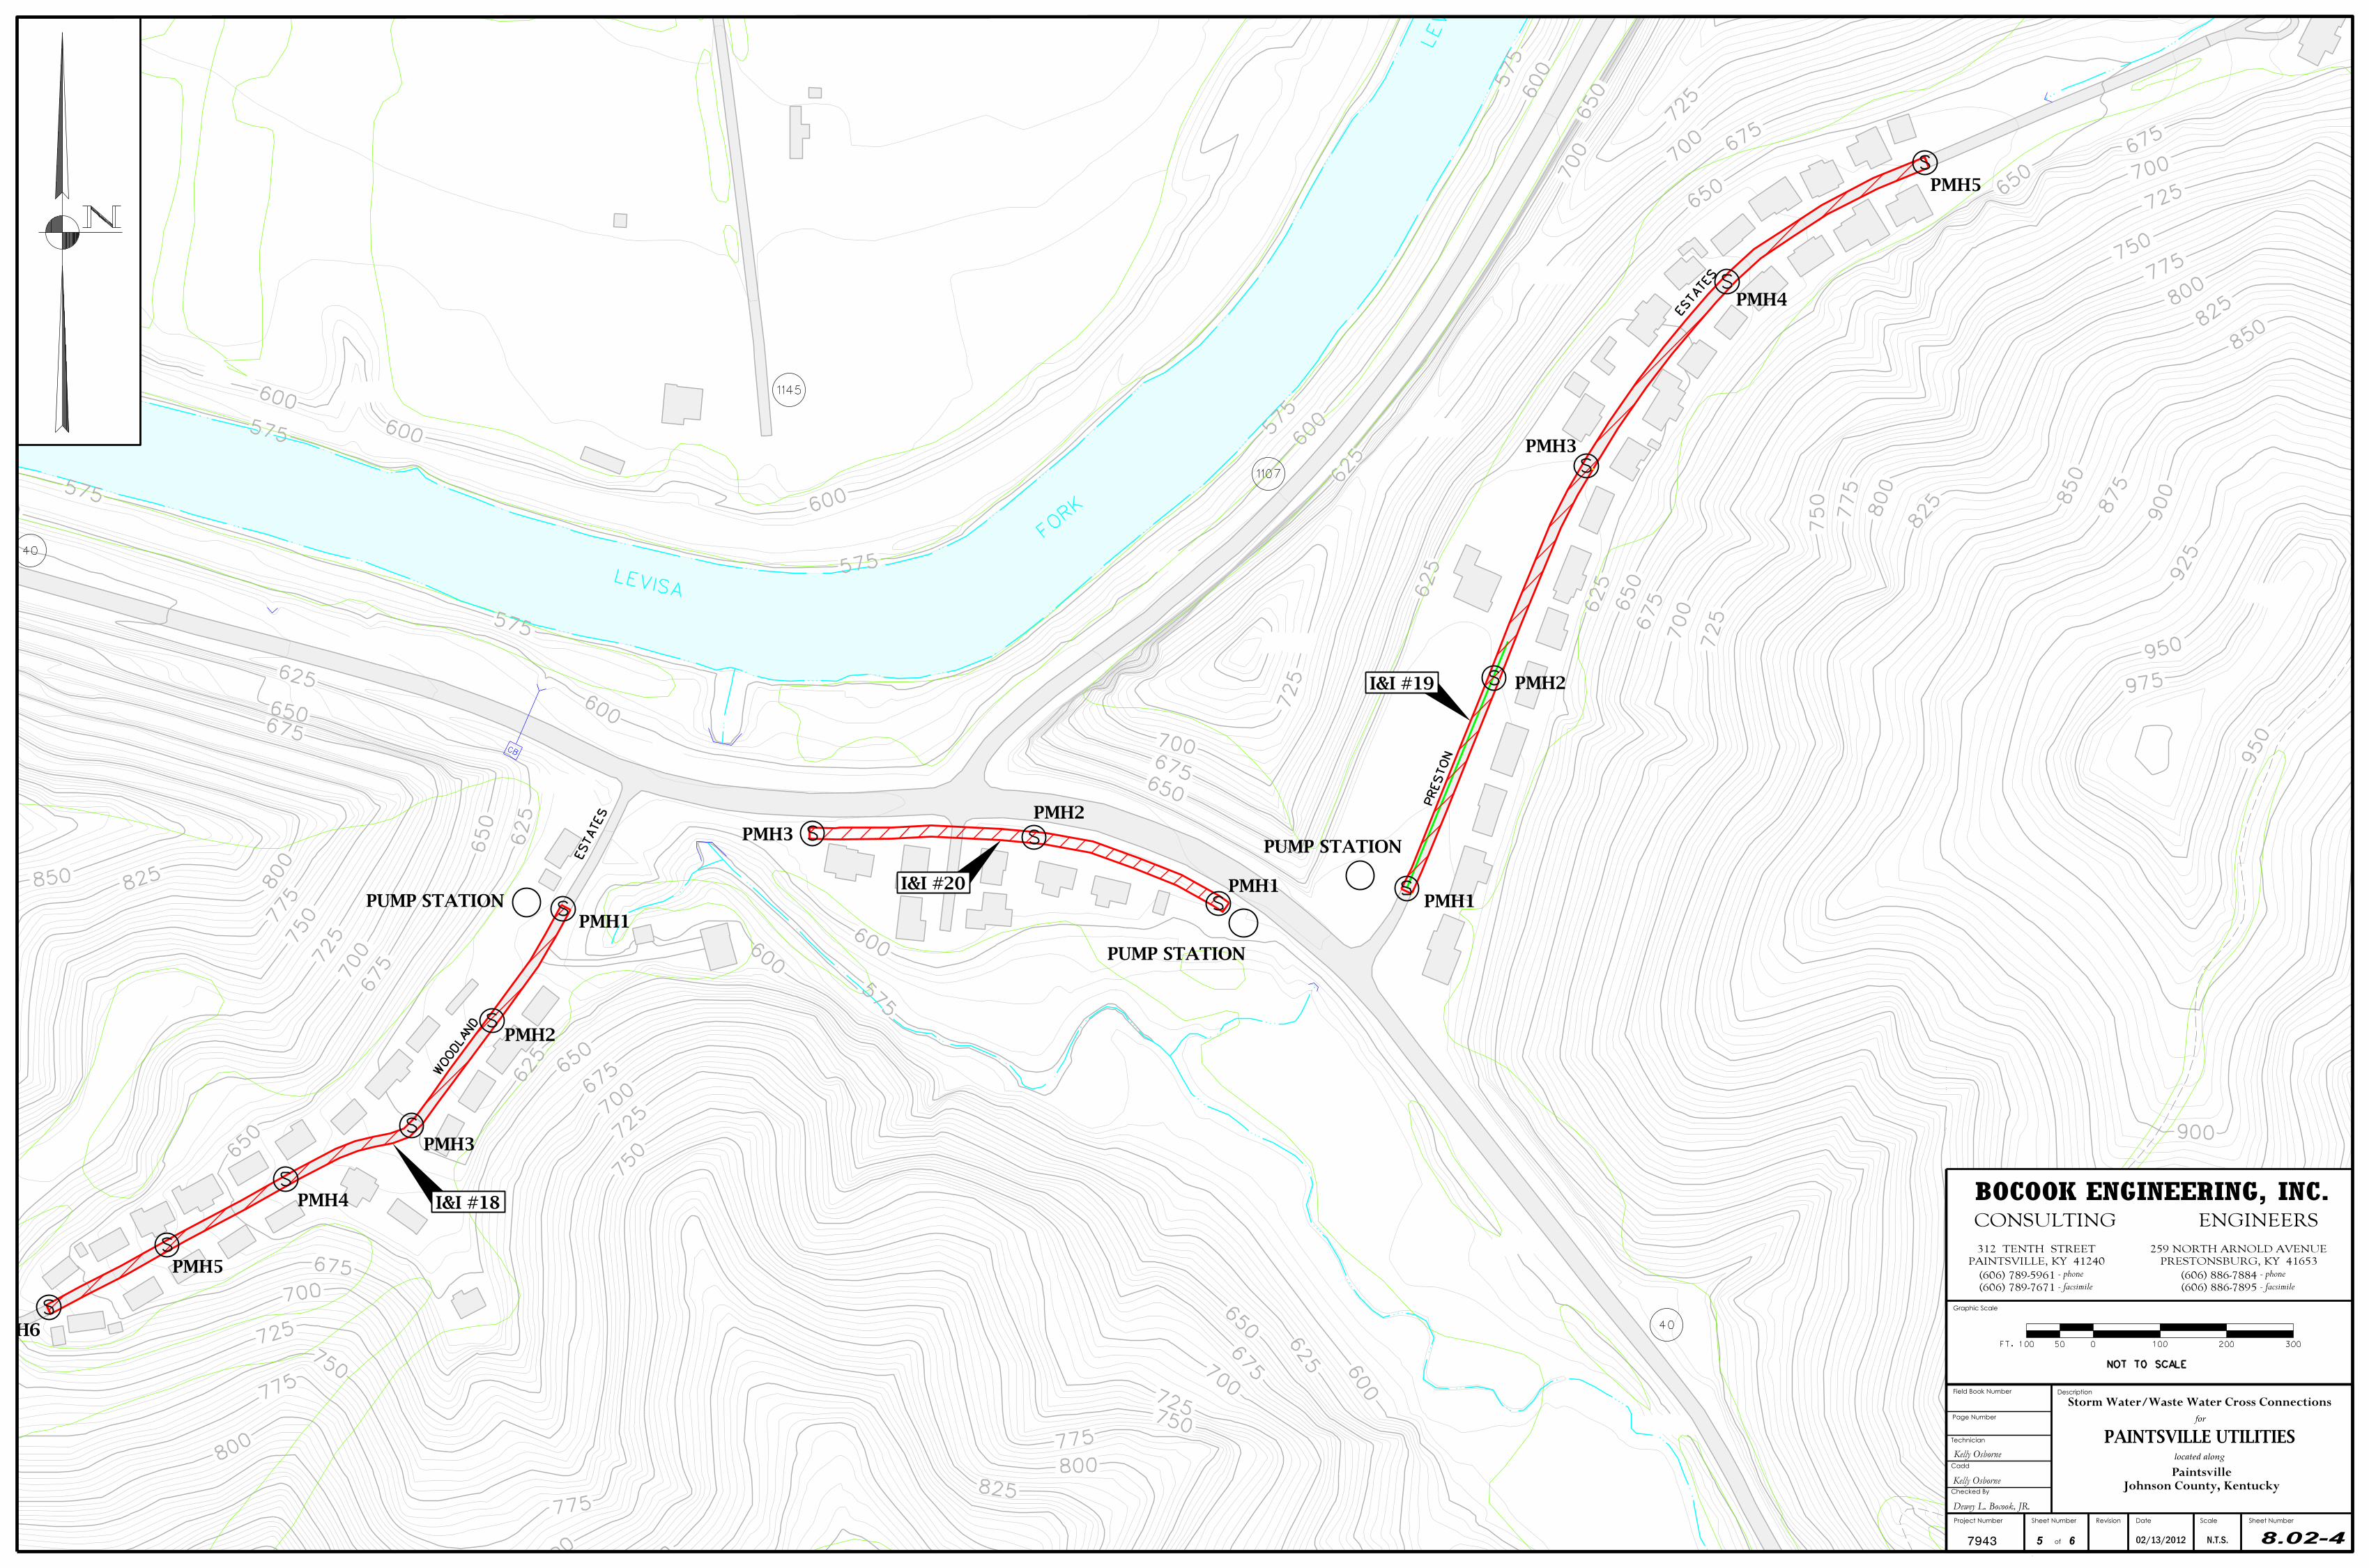
Paintsville Utilities have also determined that they are receiving excessive infiltration and
inflow from newly acquired collection sewers in the areas of Preston Estates and Concord
Development. Included in phase 1 improvements is replacement of the collection
systems for these areas. These areas are shown on Figure 8.02-4.
Paintsville Utilities, Kentucky SECTION 8 – Evaluation of Alternates Combined Regional Wastewater Facilities Plan
83
The other issue that needs to be addressed with the collection system is to replace the
existing outfall sewer with a larger diameter sewer with more capacity. The proposed
new manholes on this outfall sewer system will include locked lids to limit sanitary sewer
overflows. The section of outfall sewer to be replaced is shown on Figure 8.02-1 and
8.02-2.
Because of the known issues and limited construction options, only one alternative was
considered in the corrections to the Paintsville Collection System issues. The following
Is a summary of the projected project costs for Phase 1 correcting I & I issues and
replacing the outfall sewer:
Paintsville Utilities, Kentucky SECTION 8 – Evaluation of Alternates Combined Regional Wastewater Facilities Plan
84
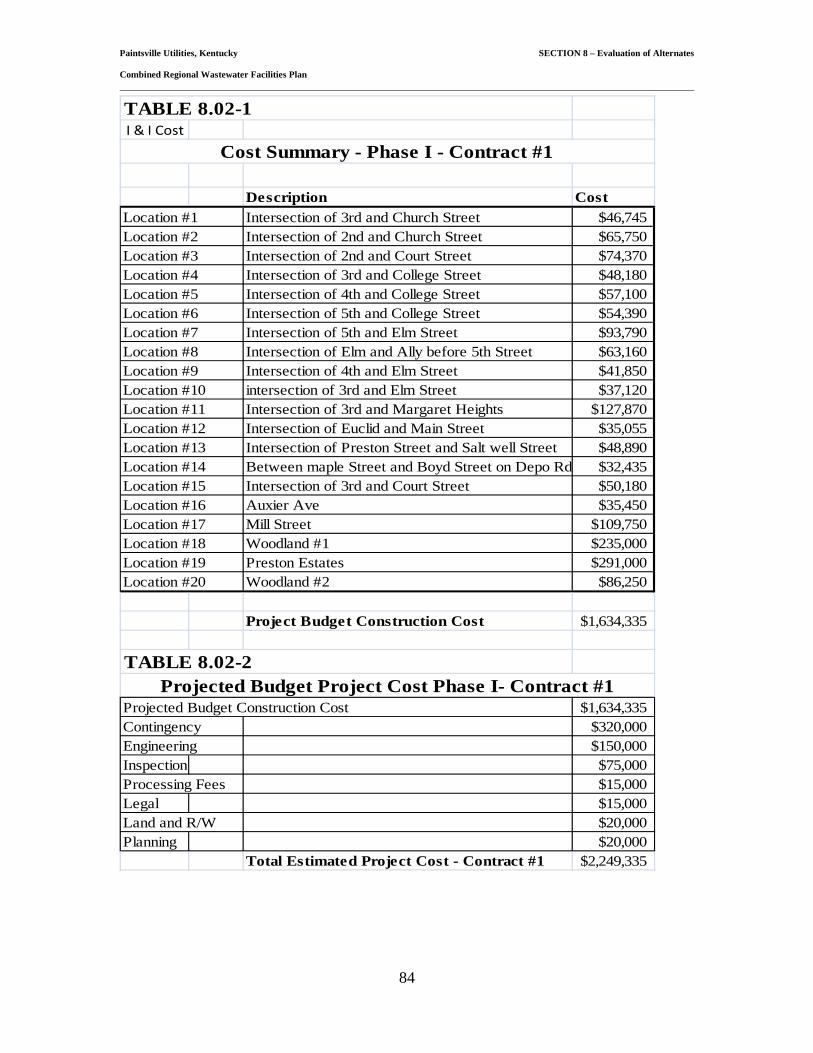
TABLE 8.02-1I & I Cost
Description Cost Location #1 Intersection of 3rd and Church Street $46,745Location #2 Intersection of 2nd and Church Street $65,750Location #3 Intersection of 2nd and Court Street $74,370Location #4 Intersection of 3rd and College Street $48,180Location #5 Intersection of 4th and College Street $57,100Location #6 Intersection of 5th and College Street $54,390Location #7 Intersection of 5th and Elm Street $93,790Location #8 Intersection of Elm and Ally before 5th Street $63,160Location #9 Intersection of 4th and Elm Street $41,850Location #10 intersection of 3rd and Elm Street $37,120Location #11 Intersection of 3rd and Margaret Heights $127,870Location #12 Intersection of Euclid and Main Street $35,055Location #13 Intersection of Preston Street and Salt well Street $48,890Location #14 Between maple Street and Boyd Street on Depo Rd $32,435Location #15 Intersection of 3rd and Court Street $50,180Location #16 Auxier Ave $35,450Location #17 Mill Street $109,750Location #18 Woodland #1 $235,000Location #19 Preston Estates $291,000Location #20 Woodland #2 $86,250
Project Budget Construction Cost $1,634,335
TABLE 8.02-2
Projected Budget Construction Cost $1,634,335Contingency $320,000Engineering $150,000Inspection $75,000Processing Fees $15,000Legal $15,000Land and R/W $20,000Planning $20,000
Total Estimated Project Cost - Contract #1 $2,249,335
Paintsville Utilities, Kentucky SECTION 8 – Evaluation of Alternates Combined Regional Wastewater Facilities Plan
85
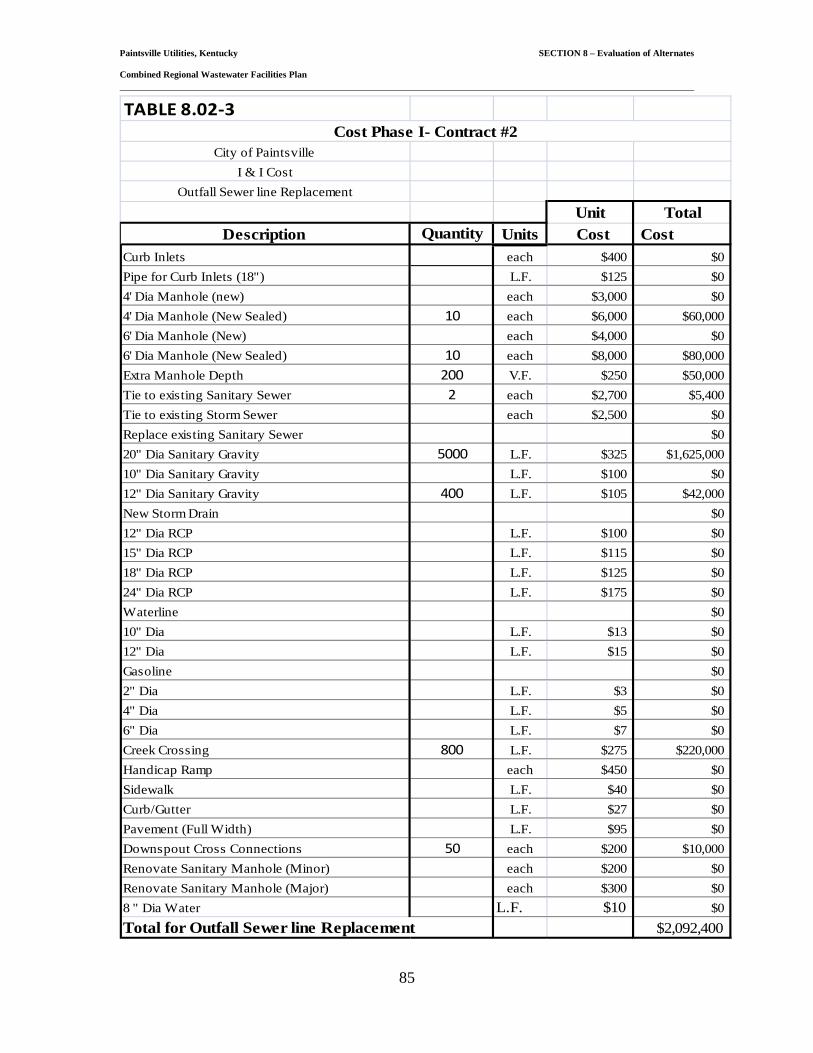
TABLE 8.02-3
City of Paintsville I & I Cost
Outfall Sewer line Replacement
Unit TotalDescription Quantity Units Cost Cost
Curb Inlets each $400 $0Pipe for Curb Inlets (18") L.F. $125 $04' Dia Manhole (new) each $3,000 $04' Dia Manhole (New Sealed) 10 each $6,000 $60,0006' Dia Manhole (New) each $4,000 $06' Dia Manhole (New Sealed) 10 each $8,000 $80,000Extra Manhole Depth 200 V.F. $250 $50,000Tie to existing Sanitary Sewer 2 each $2,700 $5,400Tie to existing Storm Sewer each $2,500 $0Replace existing Sanitary Sewer $020" Dia Sanitary Gravity 5000 L.F. $325 $1,625,00010" Dia Sanitary Gravity L.F. $100 $012" Dia Sanitary Gravity 400 L.F. $105 $42,000New Storm Drain $012" Dia RCP L.F. $100 $015" Dia RCP L.F. $115 $018" Dia RCP L.F. $125 $024" Dia RCP L.F. $175 $0Waterline $010" Dia L.F. $13 $012" Dia L.F. $15 $0Gasoline $02" Dia L.F. $3 $04" Dia L.F. $5 $06" Dia L.F. $7 $0Creek Crossing 800 L.F. $275 $220,000Handicap Ramp each $450 $0Sidewalk L.F. $40 $0Curb/Gutter L.F. $27 $0Pavement (Full Width) L.F. $95 $0Downspout Cross Connections 50 each $200 $10,000Renovate Sanitary Manhole (Minor) each $200 $0Renovate Sanitary Manhole (Major) each $300 $08 " Dia Water L.F. $10 $0Total for Outfall Sewer line Replacement $2,092,400
Cost Phase I- Contract #2
Paintsville Utilities, Kentucky SECTION 8 – Evaluation of Alternates Combined Regional Wastewater Facilities Plan
86
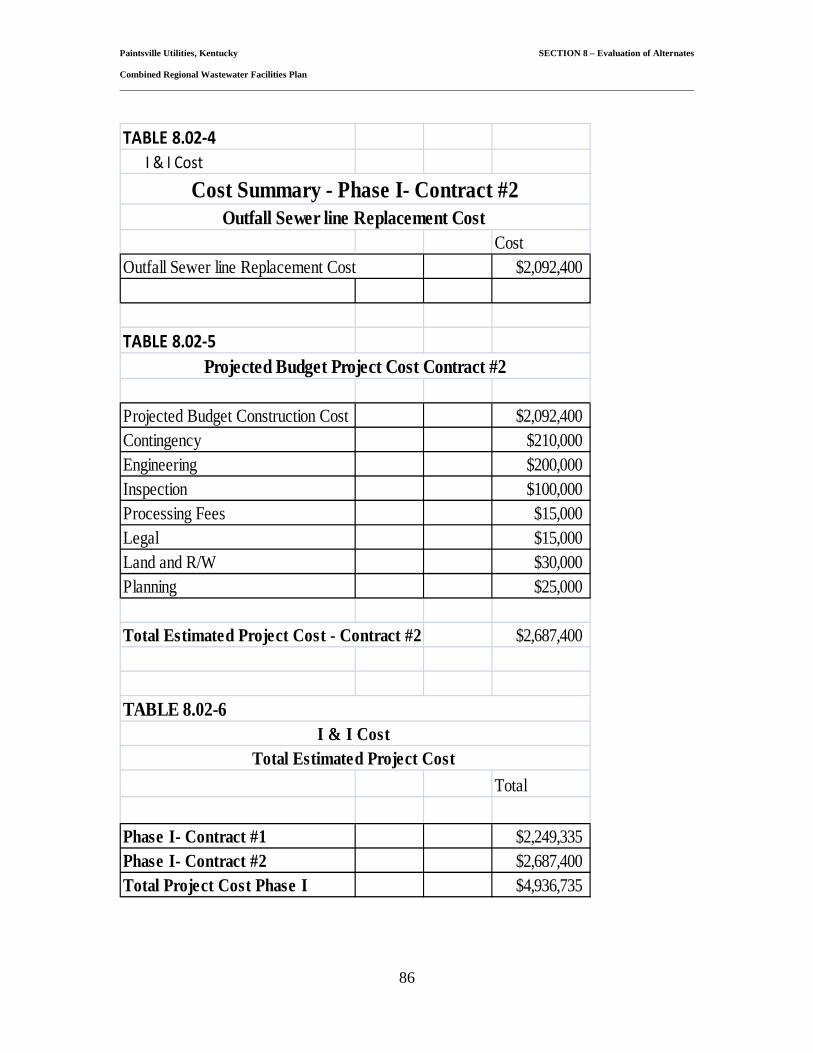
TABLE 8.02-4 I & I Cost
CostOutfall Sewer line Replacement Cost $2,092,400
TABLE 8.02-5
Projected Budget Construction Cost $2,092,400Contingency $210,000Engineering $200,000Inspection $100,000Processing Fees $15,000Legal $15,000Land and R/W $30,000Planning $25,000
Total Estimated Project Cost - Contract #2 $2,687,400