Page 1
7/30/2019 713713067
http://slidepdf.com/reader/full/713713067 1/37
This article was downloaded by: [University of Western Macedonia ]On: 23 October 2011, At: 17:16Publisher: Taylor & FrancisInforma Ltd Registered in England and Wales Registered Number: 1072954Registered office: Mortimer House, 37-41 Mortimer Street, London W1T 3JH,UK
Combustion Science andTechnologyPubl icat ion detai ls, including instruct ions forauthors and subscript ion information:h t t p : / / www. t andf onl i ne . com/ l oi / gcst 20
Establishment of a ConfinedSwirling Natural Gas/AirFlame as a Standard Flame:Temperature and SpeciesDistributions from Laser RamanMeasurements
O. Kecka
, W. Meiera
, W. Strickera
& M. Aignera
aDLR, Inst i tut für Verbrennungstechnik, Stuttgart ,
Germany
Avail able onli ne: 17 Sep 2010
To cite this art icle: O. Keck, W. Meier, W. St ri cker & M. Aigner (2002): Est abli shm entof a Confi ned Sw irl ing Nat ural Gas/ Air Flame as a St andard Flame: Temp erat ureand Speci es Dist ri but ions fr om Laser Raman Measure m ent s, Com bust ion Scienc e andTechnology, 174:8, 117-151
To link t o this art icle: ht t p : / / dx .doi .o rg/ 10 .1080/ 713713067
PLEASE SCROLL DOWN FOR ARTICLE
Full terms and conditions of use: http://www.tandfonline.com/page/terms-and-conditions
This article may be used for research, teaching, and private study purposes.Any substantial or systematic reproduction, redistribution, reselling, loan,sub-licensing, systematic supply, or distribution in any form to anyone isexpressly forbidden.
Page 2
7/30/2019 713713067
http://slidepdf.com/reader/full/713713067 2/37
The publisher does not give any warranty express or implied or make anyrepresentation that the contents will be complete or accurate or up todate. The accuracy of any instructions, formulae, and drug doses should beindependently verified with primary sources. The publisher shall not be liablefor any loss, actions, claims, proceedings, demand, or costs or damageswhatsoever or howsoever caused arising directly or indirectly in connectionwith or arising out of the use of this material.
D o w n l o a d e d b y [ U n i v e r s i t y o f W e s t e r n M a c e d o n i a ] a t 1 7 : 1 6 2 3 O c t o b e r 2 0 1 1
Page 3
7/30/2019 713713067
http://slidepdf.com/reader/full/713713067 3/37
ESTABLISHMENT OF A CONFINED SWIRLING
NATURAL GAS/AIR FLAME AS A STANDARD
FLAME: TEMPERATURE AND SPECIES
DISTRIBUTIONS FROM LASER RAMAN
MEASUREMENTS
O. KECK, W. MEIER*, W. STRICKER, AND M. AIGNER
Institut fˇrVerbrennungstechnik,
DLR, Stuttgart, Germany
A prototype of an industrial burner for confined swirling natural gas diffusion
flames with thermal powers in the range of 100 to 300 kW is presented. Within
the TECFLAM research cooperation, a well-defined ‘‘standard flame’’ was
investigated in this burner with complementary measuring techniques to yield
a comprehensive characterization of the combustion process. The aims of the
investigations were a better understanding of the complex physical and chem-
ical processes, their interactions in turbulent swirling flames, and the estab-
lishment of a database that can be used as a test case for numerical
simulations. The results from single-pulse Raman measurements of the tem-
perature, mixture fraction, and major species concentrations are presented.
The global flame behavior is illustrated by the spatial distributions of the
mean values and fluctuations of the temperature and mixture fraction.
The different flame regions and their characteristic features are discussed. The
main objective is the investigation of finite-rate chemistry effects, which can be
deduced from the correlations between the various simultaneously measured
Received 3 October 2001; accepted 7 May 2002.
The authors thank their TECFLAM partners for the fruitful cooperation and their col-
leagues B. Noll, O. Kunz, and M. Braun-Unkhoff for stimulating discussions. The authors
are also grateful to J.-Y. Chen from the University of California, Berkeley, for performing
the strained laminar flame calculations. The financial support from the Bundesministerium
fu ¨ r Bildung und Wissenschaft within the TECFLAM project (BMBF 0327059A) is grate-
fully acknowledged.
*Address correspondence to [email protected]
Combust. Sci. andTech.,174(8): 117^151, 2002
Copyright# 2002Taylor & Francis
0010-2202/02 $12.00þ.00
DOI: 10.1080/00102200290021272
117
D o w n l o a d e d b y [ U n i v e r s i t y o f W e s t e r n M a c e d o n i a ] a t 1 7 : 1 6 2 3 O c t o b e r 2 0 1 1
Page 4
7/30/2019 713713067
http://slidepdf.com/reader/full/713713067 4/37
quantities (scatterplots). Within the shear layers and the region of flame
reactions, large deviations from chemical equilibrium are observed, which can
be attributed to local flame extinction and ignition delay. Further discussion
points are the stabilization mechanism of the flame and the influence of tur-
bulent mixing on the thermochemical state. Finally, the effect of increased
swirl on the flame behavior is illustrated and discussed.
Keywords: Raman scattering, turbulent diffusion flame, swirl, turbulence-
chemistry interaction
INTRODUCTION
Swirling flows are applied widely in technical combustors because they
enable a fast and efficient mixing of fuel and air and because these flames
are very stable over a large tuning range due to the recirculation of hot
products to the flame root. There have been many experimental investi-
gations using laser Doppler velocimetry (LDV) and=or suction probe
techniques concerning various aspects of swirling flames, e.g., mixing and
stabilization (e.g., Leuckel and Fricker, 1976; Philipp et al., 1992; Syred
and Bee ` r, 1974), intermittency and vortical structures (e.g., Holza ¨ pfel
et al., 1996; Lucca-Negro and Doherty, 2001; Tangirala et al., 1987), or
NO formation (e.g., Chen, 1995; Newbold et al., 2000; Schmittel et al.,
2000). For more details, see the work of Lilley (1977) and Gupta et al.
(1984). In recent years, laser-based techniques have also been applied for
measuring scalars and structures in swirling flames, mostly in unconfined
lab-scale burners, but in some cases also in practical combustion devices.
Compared to probe techniques, laser methods work nonintrusively, offer
a better spatial and temporal resolution, and are capable of measuring
flame radicals, e.g., OH, CH, or C2, or instantaneous mixture fractions, insome cases even as one- or two-dimensional images (Eckbreth, 1996).
Some examples are given here. Takahashi et al. (1996) and Tacke et al.
(1996) investigated swirling H2=air flames using coherent anti-Stokes
Raman spectroscopy (CARS) and Raman=Rayleigh scattering, respec-
tively, both combined with LDV. One of their main objectives was the
measurement of detailed data for model validation. Cheng et al. (1998)
applied planar laser-induced fluorescence (PLIF) of OH and LDV in an
unconfined CH4=air diffusion flame to study the effect of mixing onpollutant formation. With respect to swirling flows in practical
combustion devices, Cooper and Laurendeau (2000) performed quanti-
tative NO LIF measurements in spray flames at elevated pressures.
118 O. KECK ET AL.
D o w n l o a d e d b y [ U n i v e r s i t y o f W e s t e r n M a c e d o n i a ] a t 1 7 : 1 6 2 3 O c t o b e r 2 0 1 1
Page 5
7/30/2019 713713067
http://slidepdf.com/reader/full/713713067 5/37
Kampmann et al. (1995) applied CARS and planar Rayleigh scattering in
a gas turbine combustor to determine temperature fields, and Hedman
and Warren (1995) used PLIF of OH, CARS, and LDV for the char-acterization of a gas-turbine-like combustor fired with propane. Sponta-
neous Raman scattering was used by Yeralan et al. (2001) for the
determination of temperature and species concentrations in an LOX=GH2
rocket chamber with swirl injector. Furthermore, a number of laser
techniques were employed within the TECFLAM group (TECFLAM is
the name of a research cooperation that involves several German uni-
versities and the German Aerospace Center, DLR) to investigate a con-
fined swirling natural gas=air flame (see the following discussion).Despite the experimental efforts, a systematic understanding of the
complex processes in strongly swirling flames, e.g., instabilities,
turbulence–chemistry interaction, or pollutant formation, is still missing.
Also, the numerical simulation of swirling reacting flows is a complex
problem and not satisfactorily solved to date. A promising approach for
improvements is the concept of defining a ‘‘standard swirl burner’’
and performing numerous quantitative measurements to achieve a com-
plete characterization of the burner and the flames. This strategy was
applied within the TECFLAM research group. Five identical copies of a
combustion chamber for flames with thermal powers of 100–300 kW have
been operated at different institutes where experimental and theoretical
studies have been performed for well-defined operating conditions
(TECFLAM, 1999). The burner was developed at the University of
Karlsruhe where the influence of swirl, equivalence ratio, and thermal load
on the flame stability was investigated (Schmittel, 2001). In addition, LDV
and probe measurements were performed for a quantitative character-
ization of the overall flame behavior. A numerical study by Habisreutheret al. (1997) compared results using different turbulent models with these
measurements. In a different group at the same university, the thermal
radiation of the flames was measured and the results incorporated into a
radiation model (Ganz et al., 1998). Bo ¨ ckle et al. (2000a, 2000b) from the
University of Heidelberg applied two-dimensional Rayleigh scattering
and PLIF of OH, NO, and H2CO to investigate the flame structures and
concentration fields. At the University of Darmstadt, velocity fields were
measured by LDV, and numerical studies were performed using aReynolds stress model and an ILDM reaction mechanism (Landenfeld,
1999) and, in a further step, a Monte Carlo probability density function
(PDF) approach (Hinz, 2000). At DLR Stuttgart, laser Raman scattering
CONFINED SWIRLING NATURAL GAS=AIR FLAME 119
D o w n l o a d e d b y [ U n i v e r s i t y o f W e s t e r n M a c e d o n i a ] a t 1 7 : 1 6 2 3 O c t o b e r 2 0 1 1
Page 6
7/30/2019 713713067
http://slidepdf.com/reader/full/713713067 6/37
was applied to determine the temperature, mixture fraction, and the major
species concentrations. Effects of finite-rate chemistry and first results
from a comparison of measurements with computational fluid dynamics(CFD) calculations were reported by Meier et al. (2000).
Single-pulse spontaneous Raman scattering is a well-established
technique for the investigation of turbulent flames and has been applied
in various configurations in laboratory flames and model combustors
(e.g., Barlow et al., 2002; Brockhinke et al., 1995; Chen et al., 1997; Correa
et al., 1994; Ebersohl et al., 1998; Fielding et al., 1998; Gru ¨ nefeld et al.,
1994; Masri et al., 1996; Meier et al., 1996; Neuber et al., 1998; Pitz and
Drake, 1986; Rabenstein and Leipertz, 1998; Wehrmeyer et al., 1992;Yeralan et al., 1997). A main advantage of this method is the capability
of measuring joint PDFs of all major species concentrations and the tem-
perature, which allows, for example, the determination of the mixture
fraction or the study of correlations between various quantities. In this
way, details of the thermochemical state of the flame can be revealed, e.g.,
the degree of mixing or deviations from equilibrium. The drawback of
spontaneous Raman scattering is, however, the small scattering cross
section leading to low signal intensities and possible interferences by other
laser-excited processes such as laser-induced fluorescence from polycyclic
hydrocarbons or laser-induced incandescence from particles. Therefore,
this technique has scarcely been applied to large combustors and, to our
knowledge, never before to natural gas flames of 150-kW thermal power.
This article describes the burner and combustion chamber and the
adaption of the measuring technique. The general behavior of a ‘‘stan-
dard flame’’ with 150-kW thermal power, a global equivalence ratio of
f¼ 0.833, and a swirl number of S ¼ 0.9 is described by the spatial dis-
tributions of mixture fraction and temperature. Additional informationabout flame structures is derived from flame luminosity measurements. A
major topic of this article is the characterization of the thermochemical
state of the flame and the study of finite-rate chemistry effects like local
flame extinction and ignition delay. In addition, the influence of the
amount of swirl on the flame behavior is investigated.
The main goals of the experiments were a better understanding of the
complex interactions within a turbulent swirling diffusion flame and the
establishment of a comprehensive data set. The good documentation of the combustion chamber and the operating conditions of the flame, as
well as the large amount of quantitative experimental results make this
flame well-suited as a reference case for the verification of predictions
120 O. KECK ET AL.
D o w n l o a d e d b y [ U n i v e r s i t y o f W e s t e r n M a c e d o n i a ] a t 1 7 : 1 6 2 3 O c t o b e r 2 0 1 1
Page 7
7/30/2019 713713067
http://slidepdf.com/reader/full/713713067 7/37
from numerical simulations (Mbiock et al., 2000). The data sets, which
also include the velocity fields (Schmittel et al., 2000, TECFLAM, 1999)
and two-dimensional distributions of OH, NO, H2CO, and temperature(Bo ¨ ckle et al., 2000a, 2000b), are available from the Internet (TEC-
FLAM, 1999) and modelers are encouraged to use them.
EXPERIMENT AND DATA EVALUATION
The Raman System
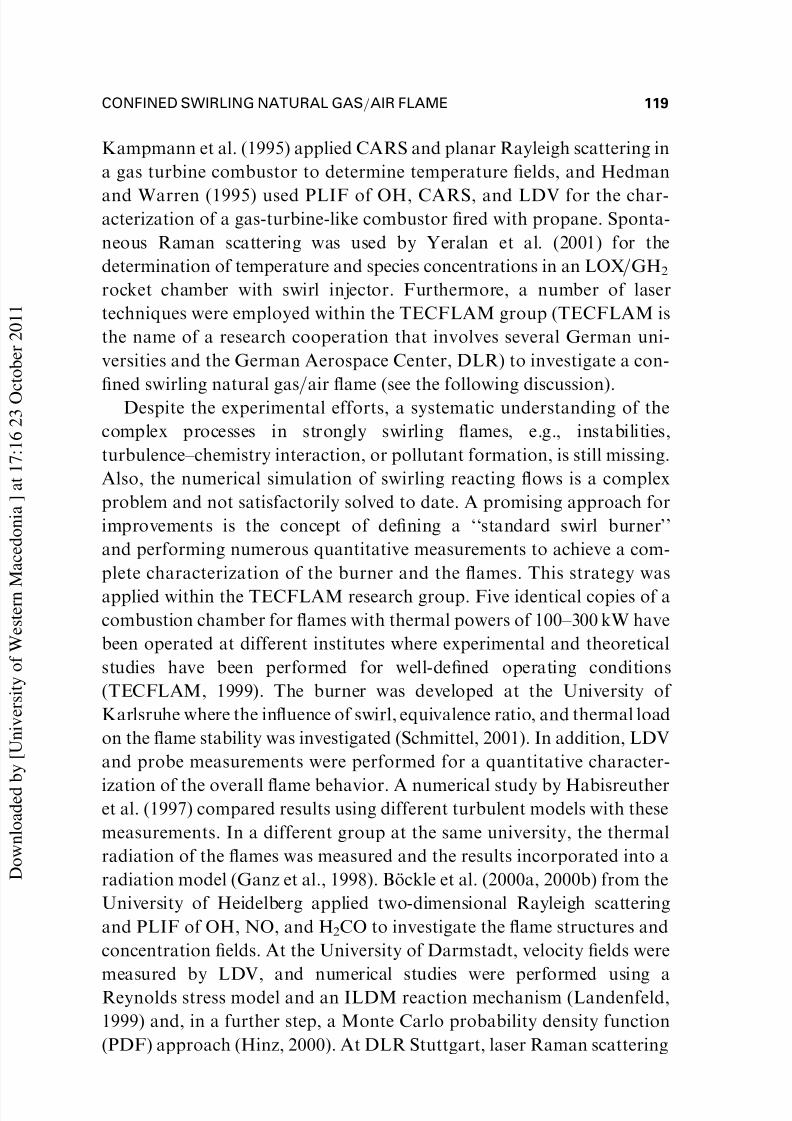
The experimental setup of the Raman system, schematically displayed in
Figure 1, was described in detail in previous publications (Bergmann
et al., 1998; Meier et al., 1996), therefore, only a short description is given
here including the modifications. The measurements were performed
using a flashlamp pumped dye laser, a spectrograph for the separation of
the different Raman signals, and photomultiplier tubes and boxcar
integrators for the signal detection. All components were optimized for
high efficiency in order to yield good signal levels, despite the small
Raman scattering cross sections.
Figure 1. Schematic drawing of the Raman apparatus.
CONFINED SWIRLING NATURAL GAS=AIR FLAME 121
D o w n l o a d e d b y [ U n i v e r s i t y o f W e s t e r n M a c e d o n i a ] a t 1 7 : 1 6 2 3 O c t o b e r 2 0 1 1
Page 8
7/30/2019 713713067
http://slidepdf.com/reader/full/713713067 8/37
The laser (Candela LFDL-20) provided pulses at a wavelength of
489 nm and a duration of about 3ms at a repetition rate of 5 Hz. After
expansion by a telescope, the laser beam was focused ( f ¼ 500 mm) to adiameter of 0.6 mm into the burner. A spherical mirror ( f ¼ 500 mm) at
the other side of the burner reflected the laser beam back through the
burner into the laser resonator. This quasi-intracavity configuration
raised the pulse energy up to 6 J, but the measurements were usually
performed with a moderate pump power yielding pulse energies of 3 J.
A small portion of the laser beam was coupled out by a glass plate to
record the laser pulse energy by a photodiode and to monitor the spectral
distribution with a spectrograph and a CCD camera. It turned out thatdue to beam steering effects in the turbulent flame, the diode signal was
not perfectly proportional to the effective laser power in the measuring
volume. Therefore, the energy of the reflected beam was also monitored
by a second diode, ensuring that the properly combined signal from both
diodes was linear with the effective pulse energy.
The Raman scattered light was collected at 90 by an achromatic lens
( f ¼ 300 mm) and relayed to the entrance slit of a spectrograph (SPEX
1802, f ¼ 1000 mm, f -number ¼ 8.4, width of focal plane 250 mm). A slit-
width of 2 mm and a magnification of the detection optics of 3.2 resulted
in a spatial resolution of approximately 0.6 mm in the direction of the
laser beam. With a dispersion of the grating of 0.5 nm=mm, the slit-width
of 2 mm corresponds to a spectral resolution of Dl% 1 nm or approxi-
mately 35 cmÀ1 in the spectral range of interest. After spectral separation,
the Raman bands from the different molecular species were detected by
photomultiplier tubes (PMTs) that were installed at positions in the focal
plane corresponding to the Raman shifts, i.e., 1282 cmÀ1 for CO2,
1555 cmÀ1
for O2, 2143 cmÀ1
for CO, 2331 cmÀ1
for N2, 2917cmÀ1
forCH4, 3652cmÀ1 for H2O, and 4156 cmÀ1 for H2. Signal background
caused by broadband laser-induced fluorescence from polycyclic aro-
matic hydrocarbons (PAHs) was detected by an additional PMT in a
Raman-free region at 1969 cmÀ1. The signals from the PMTs were
transferred to gated boxcar integrators, digitized, and stored in a PC on a
single-shot basis.
Burner and Flames
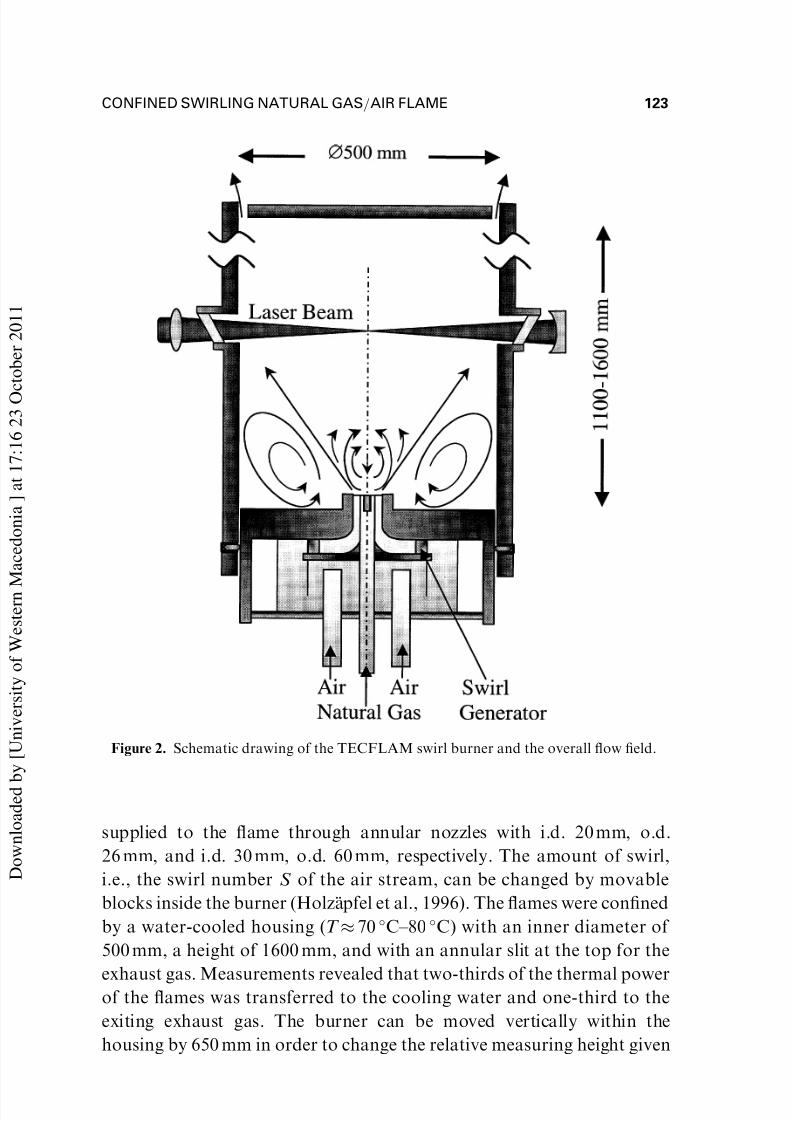
The burner and the combustion chamber are shown schematically in
Figure 2 (Keck, 2001; TECFLAM, 1999). Natural gas and air are
122 O. KECK ET AL.
D o w n l o a d e d b y [ U n i v e r s i t y o f W e s t e r n M a c e d o n i a ] a t 1 7 : 1 6 2 3 O c t o b e r 2 0 1 1
Page 9
7/30/2019 713713067
http://slidepdf.com/reader/full/713713067 9/37
supplied to the flame through annular nozzles with i.d. 20 mm, o.d.
26 mm, and i.d. 30 mm, o.d. 60 mm, respectively. The amount of swirl,
i.e., the swirl number S of the air stream, can be changed by movable
blocks inside the burner (Holza ¨ pfel et al., 1996). The flames were confined
by a water-cooled housing (T % 70 C–80 C) with an inner diameter of
500 mm, a height of 1600 mm, and with an annular slit at the top for the
exhaust gas. Measurements revealed that two-thirds of the thermal powerof the flames was transferred to the cooling water and one-third to the
exiting exhaust gas. The burner can be moved vertically within the
housing by 650 mm in order to change the relative measuring height given
Figure 2. Schematic drawing of the TECFLAM swirl burner and the overall flow field.
CONFINED SWIRLING NATURAL GAS=AIR FLAME 123
D o w n l o a d e d b y [ U n i v e r s i t y o f W e s t e r n M a c e d o n i a ] a t 1 7 : 1 6 2 3 O c t o b e r 2 0 1 1
Page 10
7/30/2019 713713067
http://slidepdf.com/reader/full/713713067 10/37
by the laser beam. Sufficient optical access is provided by four Ar-coated
quartz windows, comprising two ports with a diameter of 100 mm and
two with dimensions 250 Â 100 mm. The flames investigated had a ther-mal power of 150 kW, an overall air=fuel ratio of l¼ 1.2 (equivalence
ratio f¼ 0.833), and swirl numbers between S ¼ 0.9 and 1.8. They were
operated with 15 standard m3=h natural gas, which consisted typically of
98.0% CH4, 0.5% C2H6, 0.2% C3H8, 0.1% C4H10, 0.2% CO2, and 1.0%
N2. The methane concentration of the natural gas was checked during the
measurements by a CH4 analyzer (Fisher-Rosemount, Binos 100 IR). We
used 171.5 standard m3=h room air with a typical water content of 0.5%
to 1.0%. The air flow was measured by a vortex shedding flow meter(Yokogawa, YF104), and the natural gas flow was adjusted with an O2
analyzer (Bu ¨ hler, BA 1000) to 3.2% oxygen in the exhaust gas, corre-
sponding to the air=fuel ratio of 1.2. The temperature of the air and
natural gas was kept at 25 C–30 C by a water-cooling system. The
Reynolds numbers of the air and natural gas flows were 42,900 and 7900,
respectively.
The arrows in Figure 2 indicate the overall flow fields within the
chamber, which can be divided into three regimes:
1. The inlet flows of fuel and swirled air are indicated by the straight
arrows. The average injection velocities deduced from the flow rates
and nozzle cross sections for gas inlet temperatures of typically 25 C–
30 C are 22 m=s for natural gas and 25 m=s for air. The highest mean
velocities measured at h ¼ 1 mm above the nozzles are ugas ¼ 16.0 m=s
for the axial velocity of natural gas at r ¼ 13 mm and uair ¼ 38.5 m=s for
air at r ¼ 29 mm, vgas ¼ 16.3 m=s at r ¼ 14 mm, and vair ¼ 9.3m=s at
r ¼ 26 mm for the radial component, and wair ¼ 35.2 m=s at r ¼ 28mmfor the tangential component (C. Schneider, Universita ¨ t Darmstadt,
private communication, 2000; TECFLAM, 1999). The shear layer
between the natural gas and air flows is the region where reactive mix-
tures are formed and where combustion predominantly takes place.
2. The inner recirculation zone around the flame axis is where hot
combustion products are transported back to the flame root. This
transport mechanism is essential for the ignition and stabilization of
the flame. The reverse flow has its highest mean axial velocity of u % À21 m=s at h % 70 mm and extends down to the central bluff body
of the nozzle with u % À5 m=s at h ¼ 1 mm (C. Schneider, Universita ¨ t
Darmstadt, private communication, 2000; TECFLAM, 1999).
124 O. KECK ET AL.
D o w n l o a d e d b y [ U n i v e r s i t y o f W e s t e r n M a c e d o n i a ] a t 1 7 : 1 6 2 3 O c t o b e r 2 0 1 1
Page 11
7/30/2019 713713067
http://slidepdf.com/reader/full/713713067 11/37
3. The outer recirculation zone extends from the flame region to the walls
of the combustion chamber. Here, the flow velocities are much
smaller, typically u % À1.5m=s, v % À3 m=s, and w % 3–4m=s. Itshould also be noted that the axial symmetry of the flames was ex-
perimentally checked and confirmed.
Calibration and Data Reduction
The relationship between the measured Raman signals and the molecular
number densities is well known (e.g., Bergmann et al., 1998; Eckbreth,
1996); thus, only a brief summary is given here. The temperature-dependent calibration factors for each species were determined in cold
and electrically heated flows (T ¼ 300–1200 K) and in flat premixed
laminar flames (Bergmann et al., 1998; Prucker et al., 1994). The tem-
perature was deduced from the total number density via the ideal gas law.
Here, the radical concentrations (mainly OH), which could not be mea-
sured in this experiment, were not directly included. However, they are
typically smaller than 0.5% and the resulting error is partly compensated
by the calibration in the laminar flames that contain a similar amount of
radicals. Pressure differences within the turbulent flames were expected to
be low because the velocities are clearly in the low-Mach-number regime
and a calculation with the Fluent 5 code resulted in differences less than
0.3 mbar. Thus, they did not significantly influence the accuracy of the
temperature determination. The intensity of the Rayleigh scattered light
was also recorded by a PMT but was not used for the temperature eva-
luation because background from laser light scattered from surfaces was
too high to allow for an accurate temperature determination.
There were three sources of cross talk between different detectionchannels in our measurements: (1) spectral overlap of neighboring Raman
bands, (2) laser-induced fluorescence from hot water (Meier et al., 1996),
and (3) additional Raman bands of H2 (rotational lines) and CH4
(Bergmann et al., 1998). The amount of cross talk was determined in
the calibration measurements. Usually, the cross talk increased linearly
with temperature. Exceptions were cross talk from N2 to CO, CO2 to
O2, and CH4 to O2, which were described with polynomials up to the
fourth order.In high-temperature regions and especially in fuel-rich samples, a laser-
excited emission from PAHs was observed that appeared as a back-
ground in all Raman channels (Beretta et al., 1985; Correa et al., 1994;
CONFINED SWIRLING NATURAL GAS=AIR FLAME 125
D o w n l o a d e d b y [ U n i v e r s i t y o f W e s t e r n M a c e d o n i a ] a t 1 7 : 1 6 2 3 O c t o b e r 2 0 1 1
Page 12
7/30/2019 713713067
http://slidepdf.com/reader/full/713713067 12/37
Masri et al., 1987; Meier and Keck, 2002; Starner et al., 1990). The
spectral shape of this background exhibited only slight variations from
shot to shot and for different locations in the flame, so that it could becorrected to a good approximation using the signal from the PMT,
recording the background at 1969 cmÀ1 (Bergmann et al., 1998). Laser-
induced emissions from C2 in the Swan bands, which appeared in the
spectral region of interest, were a minor problem because the laser wave-
length was tuned to such a wavelength (489 nm) that these emissions did
not interfere significantly with the Raman channels (Meier and Keck,
2002).Comparedtojetdiffusionflames,theinterferencesweremuchweaker
due to an increased mixing rate of fuel and air by the swirl. However,some samples with high background level were filtered out in the data
reduction routine, predominantly samples from the inner recirculation
zone in the flame with the smallest swirl number (S ¼ 0.9). The fraction of
filtered samples within a series of single-pulse measurements was gen-
erally below 3% and an analysis of the possible bias of the mean values of
the temperature and mole fractions revealed errors that were smaller than
the overall measurement uncertainties (see the following text).
The precision of the presented measurements was mainly limited by
shot noise of the detected Raman photons and was quantified by
recording single-pulse data sets in stable laminar flames. The rms fluc-
tuations caused by photon statistics were, for example, 2% for N2 in a
flame with an N2 mole fraction of 0.72 at 2200 K and 10% for O2 in a
flame with 0.03 mole fraction O2 at 1800 K. The standard deviation (rms
fluctuation) for the temperature was 3% at flame temperatures. Also, the
correction for cross talk influenced the precision of species with low
concentrations, mainly CO. Without the cross talk correction of N2 into
CO, the evaluated CO mole fraction was 0.07 in a stable laminar CH4=airflame with 1900 K and 0.023 CO mole fraction. This corresponded to
% 80 detected photons with a shot noise of 9 photons. After subtraction
of cross talk, 23 photons remained as pure CO signal but had the same
rms of 9 photons. Therefore, the standard deviation increased to 40% (at
0.023 mole fraction CO). Due to the enhanced noise level of the CO
signal a further criterion for the assessment of the quality of a single-shot
measurement was used: The number ratio of the C to H atoms of the
detected species should be constant 1:4 in a CH4=(dry) air flame,regardless of the mixture. In a natural gas flame with humid air as oxi-
dizer the ratio changed with mixture fraction but was very close to 0.25
from f ¼ 0.02–1. It was checked experimentally by Raman measurements
126 O. KECK ET AL.
D o w n l o a d e d b y [ U n i v e r s i t y o f W e s t e r n M a c e d o n i a ] a t 1 7 : 1 6 2 3 O c t o b e r 2 0 1 1
Page 13
7/30/2019 713713067
http://slidepdf.com/reader/full/713713067 13/37
that differential molecular diffusion, which could affect the C=H ratio,
did not occur in the investigated flames. Single-shot measurements with
large statistical error, especially for CO, can be identified by significantdeviations from the expected C=H ratio. To exclude these samples from
the data evaluation, all shots with a C=H ratio outside the range 0.2–0.3
were filtered out (Keck, 2001). Considering all filtering criteria, i.e.,
detector saturation (which occurred very seldom), background level, and
C=H ratio, the worst case of discarded samples was 29 out of 300. The
mean values of a single-shot series were hardly affected by the screening,
i.e., a significant bias was not introduced by filtering.
The accuracy depends predominantly on the quality of the calibrationprocedure. The main uncertainties of our calibration flames were Æ 2%
for the temperature and Æ 3% for the mole fractions. This included the
errors from the gas flow meters and from temperature-induced drifts of
the adjustment between two calibration measurements. The mixture
fraction was calculated using Bilger’s definition (Bilger, 1988; Starner
et al., 1990), which is based on the measured atomic mass fractions Z i of
O, H, and C:
f ¼2Z C=W C þ 1
2Z H=W H þ ðZ O;air À Z OÞ=W O
2Z C;fuel=W C þ 12
Z H:fuel=W H þ Z O;air=W O
where W i are the atomic masses of the elements and the subscripts ‘‘air’’
and ‘‘fuel’’ refer to the mass fractions in pure air and pure fuel, respec-
tively. The stoichiometric mixture fraction for the flames investigated
is f stoich ¼ 0.055. The single-pulse uncertainty for the mixture fraction
is 3%–5%.
RESULTS AND DISCUSSION
Flames with two different swirl numbers (S ¼ 0.9 and 1.4) were investi-
gated by measuring radial profiles at eight heights above the burner
mouth (h ¼ 10, 20, 40, 60, 90, 120, 150, and 300 mm). In addition, radial
profiles were measured in a flame with S ¼ 1.8 at five heights (10, 20, 40,
60, and 90 mm). At each location, 300 single-pulse measurements werecarried out from which the joint PDFs of temperature T , mixture frac-
tion f , and major species mole fractions X i were deduced. The mean
values and rms fluctuations derived from the PDFs yield a general
CONFINED SWIRLING NATURAL GAS=AIR FLAME 127
D o w n l o a d e d b y [ U n i v e r s i t y o f W e s t e r n M a c e d o n i a ] a t 1 7 : 1 6 2 3 O c t o b e r 2 0 1 1
Page 14
7/30/2019 713713067
http://slidepdf.com/reader/full/713713067 14/37
characterization of the flames, and the correlations among various
quantities give an insight into the turbulence–chemistry interactions.
General Behavior of the Flames
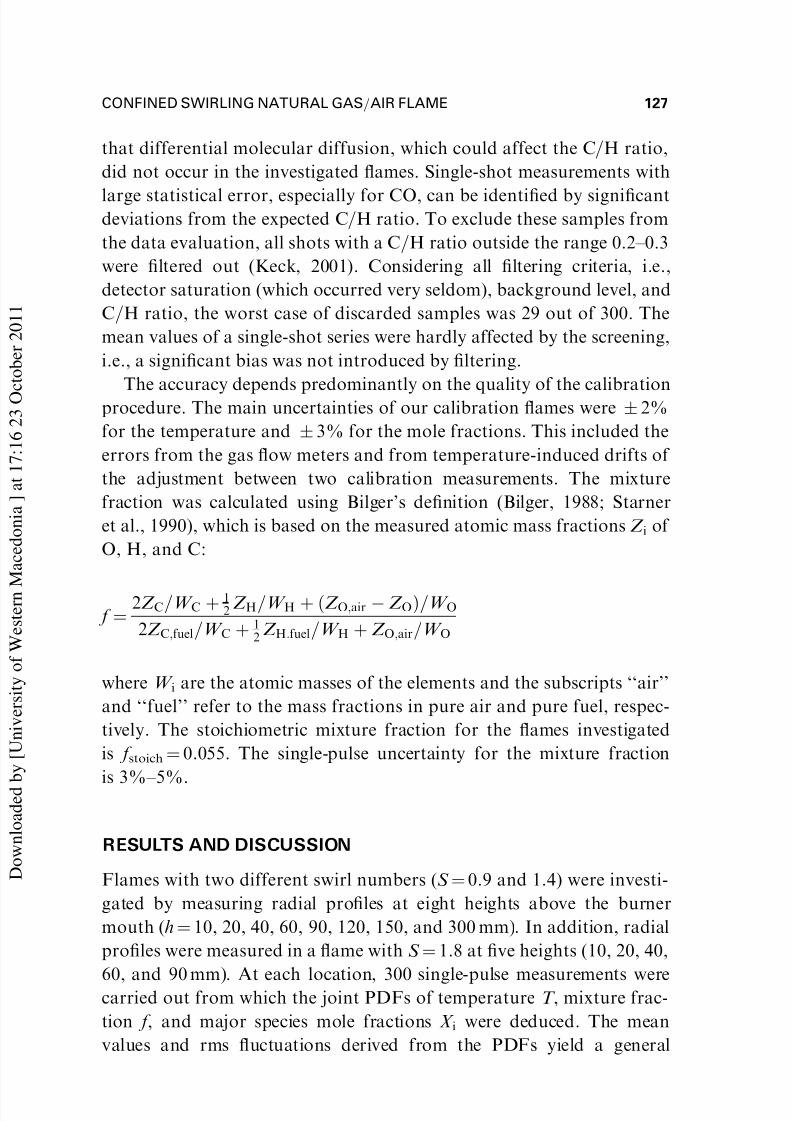
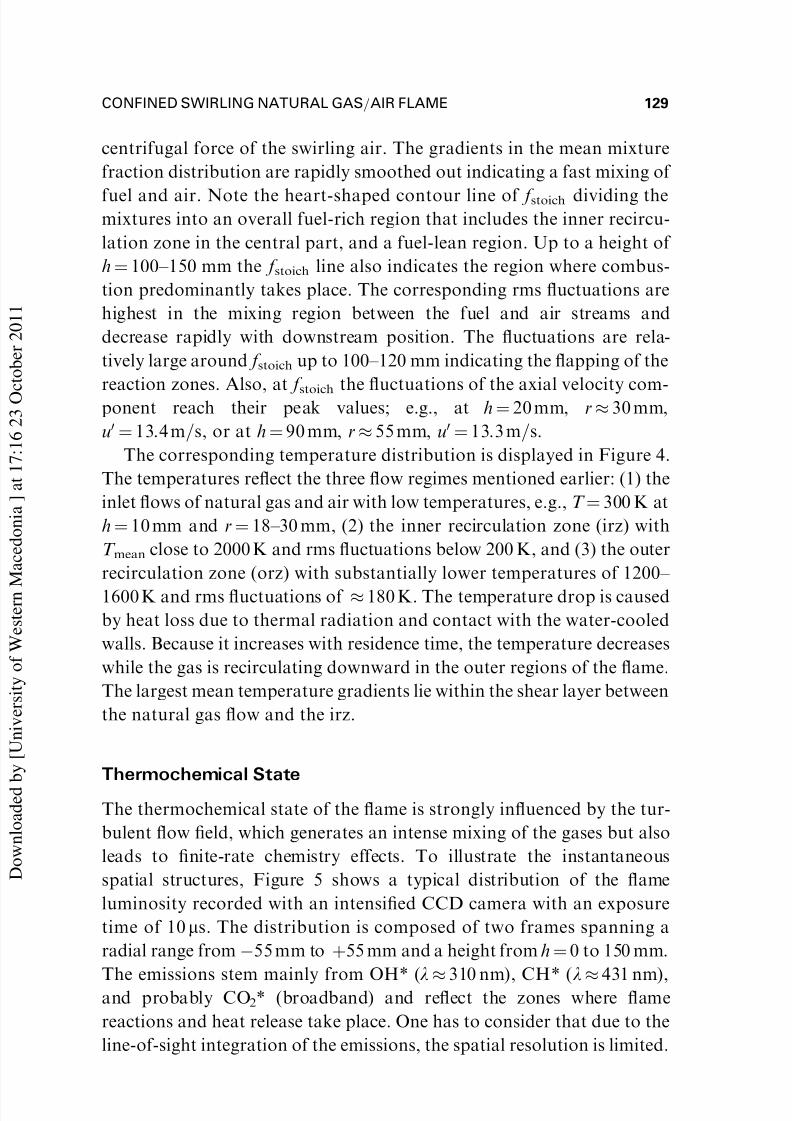
Figure 3 shows the distributions of the mean value (Reynolds average) of
f À f stoich and the rms fluctuation of f in the flame with S ¼ 0.9. In this
presentation, the results from nearly 120 measuring locations were
interpolated in a computer routine to yield two-dimensional charts. The
inlet flows of natural gas and air, which can be distinguished by the fuel-
rich and fuel-lean regions, respectively, are directed outward due to the
Figure 3. Two-dimensional distributions of mean value of f À f stoich and rms fluctuation of f
in the flame with S ¼ 0.9 (150 kW, l¼ 1.2). A section of 150 mm  300 mm above the burner
mouth is shown. The walls of the combustion chamber are located at r ¼ 250 mm.
128 O. KECK ET AL.
D o w n l o a d e d b y [ U n i v e r s i t y o f W e s t e r n M a c e d o n i a ] a t 1 7 : 1 6 2 3 O c t o b e r 2 0 1 1
Page 15
7/30/2019 713713067
http://slidepdf.com/reader/full/713713067 15/37
centrifugal force of the swirling air. The gradients in the mean mixture
fraction distribution are rapidly smoothed out indicating a fast mixing of
fuel and air. Note the heart-shaped contour line of f stoich dividing themixtures into an overall fuel-rich region that includes the inner recircu-
lation zone in the central part, and a fuel-lean region. Up to a height of
h ¼ 100–150 mm the f stoich line also indicates the region where combus-
tion predominantly takes place. The corresponding rms fluctuations are
highest in the mixing region between the fuel and air streams and
decrease rapidly with downstream position. The fluctuations are rela-
tively large around f stoich up to 100–120 mm indicating the flapping of the
reaction zones. Also, at f stoich the fluctuations of the axial velocity com-ponent reach their peak values; e.g., at h ¼ 20 mm, r % 30 mm,
u0 ¼ 13.4 m=s, or at h ¼ 90 mm, r % 55 mm, u0 ¼ 13.3 m=s.
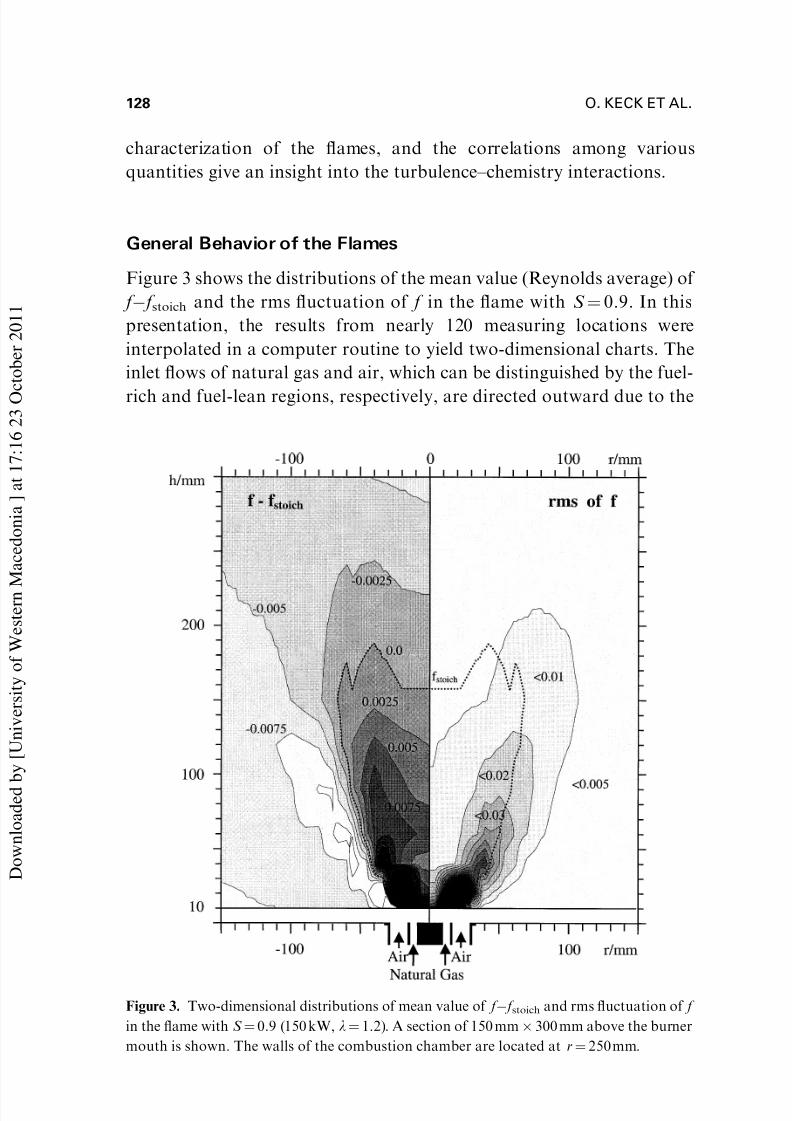
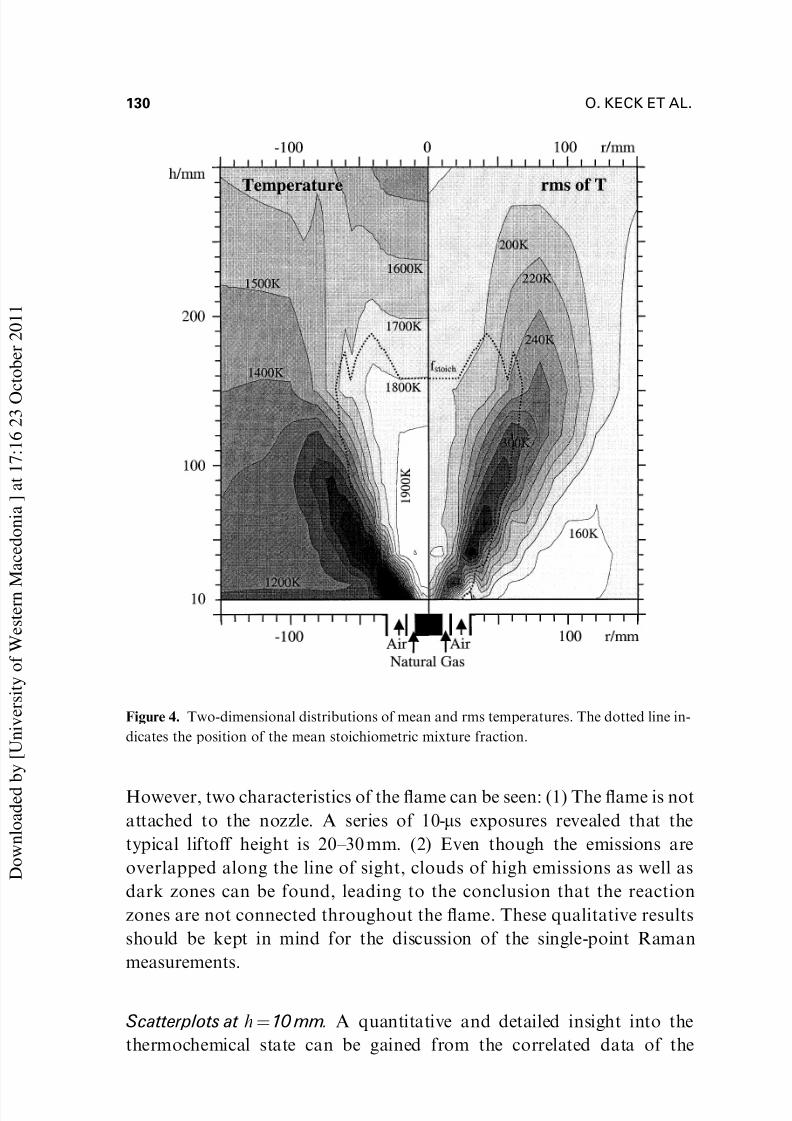
The corresponding temperature distribution is displayed in Figure 4.
The temperatures reflect the three flow regimes mentioned earlier: (1) the
inlet flows of natural gas and air with low temperatures, e.g., T ¼ 300 K at
h ¼ 10 mm and r ¼ 18–30 mm, (2) the inner recirculation zone (irz) with
T mean close to 2000 K and rms fluctuations below 200 K, and (3) the outer
recirculation zone (orz) with substantially lower temperatures of 1200–
1600 K and rms fluctuations of % 180 K. The temperature drop is caused
by heat loss due to thermal radiation and contact with the water-cooled
walls. Because it increases with residence time, the temperature decreases
while the gas is recirculating downward in the outer regions of the flame.
The largest mean temperature gradients lie within the shear layer between
the natural gas flow and the irz.
Thermochemical State
The thermochemical state of the flame is strongly influenced by the tur-
bulent flow field, which generates an intense mixing of the gases but also
leads to finite-rate chemistry effects. To illustrate the instantaneous
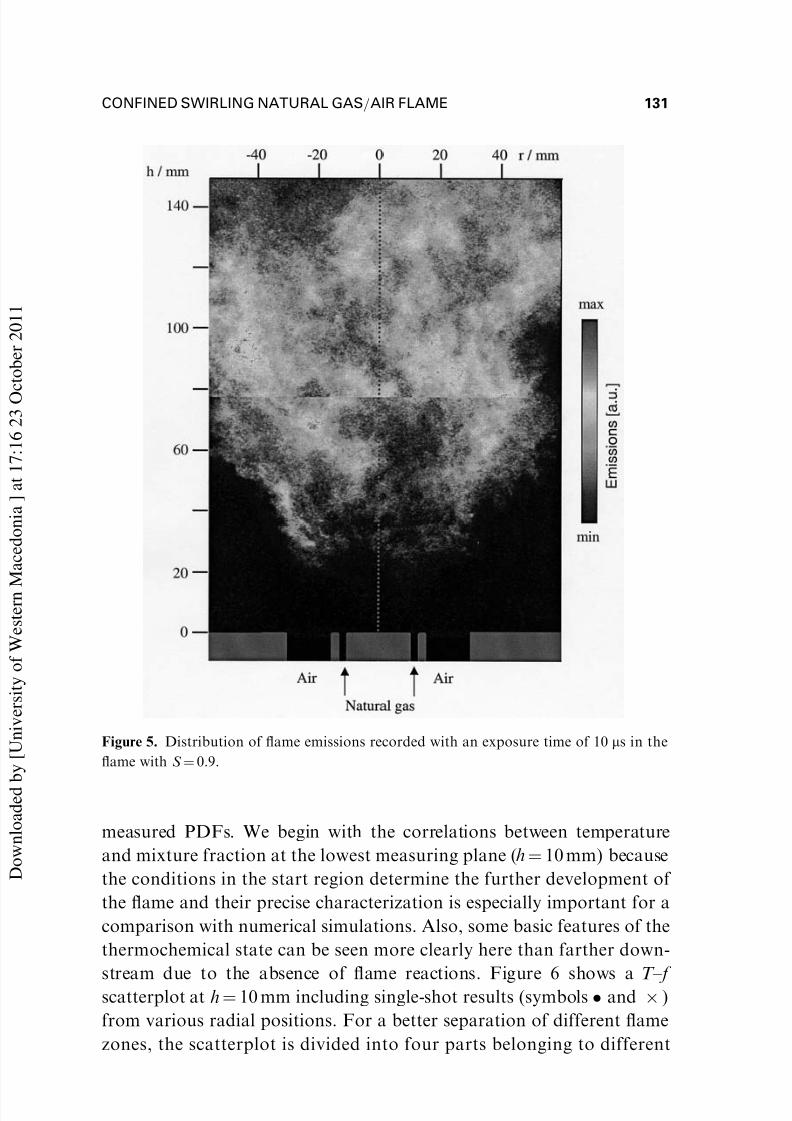
spatial structures, Figure 5 shows a typical distribution of the flame
luminosity recorded with an intensified CCD camera with an exposure
time of 10ms. The distribution is composed of two frames spanning a
radial range from À55 mm to þ55 mm and a height from h ¼ 0 to 150 mm.
The emissions stem mainly from OH* (l% 310 nm), CH* (l% 431 nm),and probably CO2* (broadband) and reflect the zones where flame
reactions and heat release take place. One has to consider that due to the
line-of-sight integration of the emissions, the spatial resolution is limited.
CONFINED SWIRLING NATURAL GAS=AIR FLAME 129
D o w n l o a d e d b y [ U n i v e r s i t y o f W e s t e r n M a c e d o n i a ] a t 1 7 : 1 6 2 3 O c t o b e r 2 0 1 1
Page 16
7/30/2019 713713067
http://slidepdf.com/reader/full/713713067 16/37
However, two characteristics of the flame can be seen: (1) The flame is not
attached to the nozzle. A series of 10-ms exposures revealed that the
typical liftoff height is 20–30 mm. (2) Even though the emissions are
overlapped along the line of sight, clouds of high emissions as well as
dark zones can be found, leading to the conclusion that the reaction
zones are not connected throughout the flame. These qualitative results
should be kept in mind for the discussion of the single-point Raman
measurements.
Scatterplots at h ¼10 mm. A quantitative and detailed insight into the
thermochemical state can be gained from the correlated data of the
Figure 4. Two-dimensional distributions of mean and rms temperatures. The dotted line in-
dicates the position of the mean stoichiometric mixture fraction.
130 O. KECK ET AL.
D o w n l o a d e d b y [ U n i v e r s i t y o f W e s t e r n M a c e d o n i a ] a t 1 7 : 1 6 2 3 O c t o b e r 2 0 1 1
Page 17
7/30/2019 713713067
http://slidepdf.com/reader/full/713713067 17/37
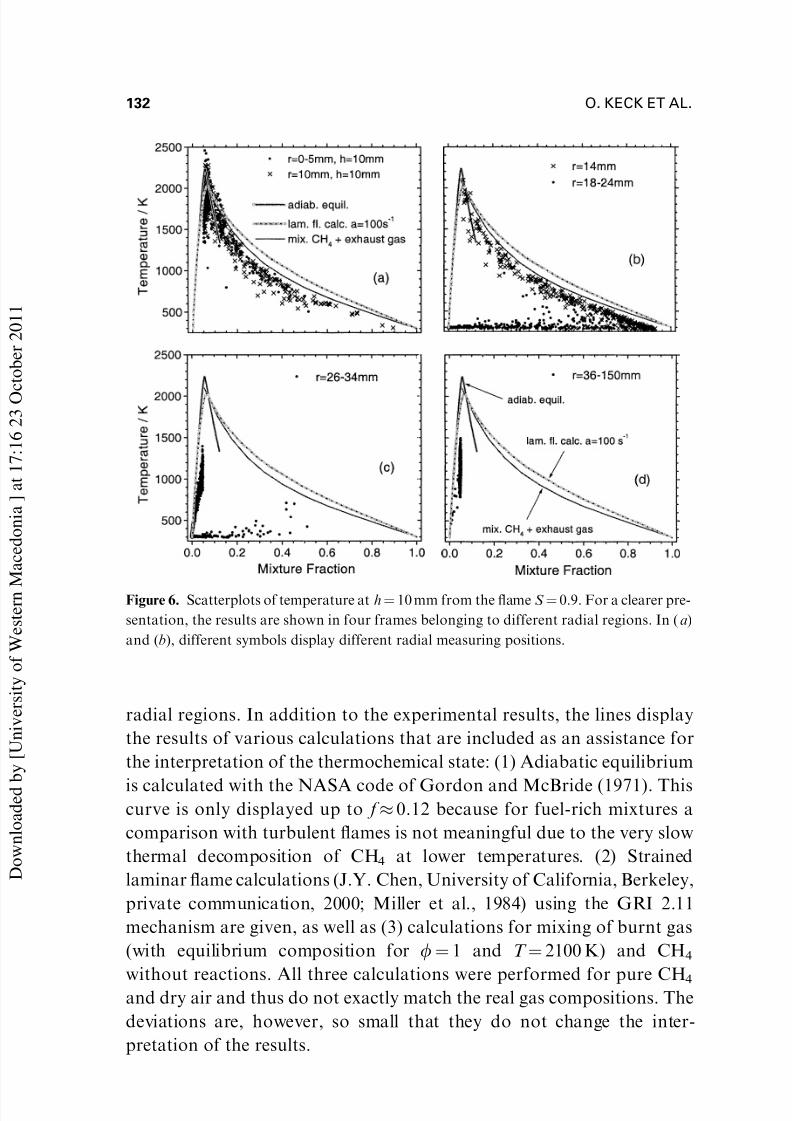
measured PDFs. We begin with the correlations between temperature
and mixture fraction at the lowest measuring plane (h ¼ 10 mm) because
the conditions in the start region determine the further development of
the flame and their precise characterization is especially important for a
comparison with numerical simulations. Also, some basic features of the
thermochemical state can be seen more clearly here than farther down-
stream due to the absence of flame reactions. Figure 6 shows a T – f scatterplot at h ¼ 10 mm including single-shot results (symbols and  )
from various radial positions. For a better separation of different flame
zones, the scatterplot is divided into four parts belonging to different
Figure 5. Distribution of flame emissions recorded with an exposure time of 10 ms in the
flame with S ¼ 0.9.
CONFINED SWIRLING NATURAL GAS=AIR FLAME 131
D o w n l o a d e d b y [ U n i v e r s i t y o f W e s t e r n M a c e d o n i a ] a t 1 7 : 1 6 2 3 O c t o b e r 2 0 1 1
Page 18
7/30/2019 713713067
http://slidepdf.com/reader/full/713713067 18/37
radial regions. In addition to the experimental results, the lines display
the results of various calculations that are included as an assistance for
the interpretation of the thermochemical state: (1) Adiabatic equilibrium
is calculated with the NASA code of Gordon and McBride (1971). Thiscurve is only displayed up to f % 0.12 because for fuel-rich mixtures a
comparison with turbulent flames is not meaningful due to the very slow
thermal decomposition of CH4 at lower temperatures. (2) Strained
laminar flame calculations (J.Y. Chen, University of California, Berkeley,
private communication, 2000; Miller et al., 1984) using the GRI 2.11
mechanism are given, as well as (3) calculations for mixing of burnt gas
(with equilibrium composition for f¼ 1 and T ¼ 2100 K) and CH4
without reactions. All three calculations were performed for pure CH4and dry air and thus do not exactly match the real gas compositions. The
deviations are, however, so small that they do not change the inter-
pretation of the results.
Figure 6. Scatterplots of temperature at h ¼ 10 mm from the flame S ¼ 0.9. For a clearer pre-
sentation, the results are shown in four frames belonging to different radial regions. In (a)
and (b), different symbols display different radial measuring positions.
132 O. KECK ET AL.
D o w n l o a d e d b y [ U n i v e r s i t y o f W e s t e r n M a c e d o n i a ] a t 1 7 : 1 6 2 3 O c t o b e r 2 0 1 1
Page 19
7/30/2019 713713067
http://slidepdf.com/reader/full/713713067 19/37
The samples in Figure 6(a) were recorded at the positions r ¼ 0, 5, and
10 mm, which correspond roughly to the irz. On the average, the axial
velocity changes direction at r % 10 mm (Schmittel et al., 2000; TEC-FLAM, 1999) but due to turbulent fluctuations the transition is, of
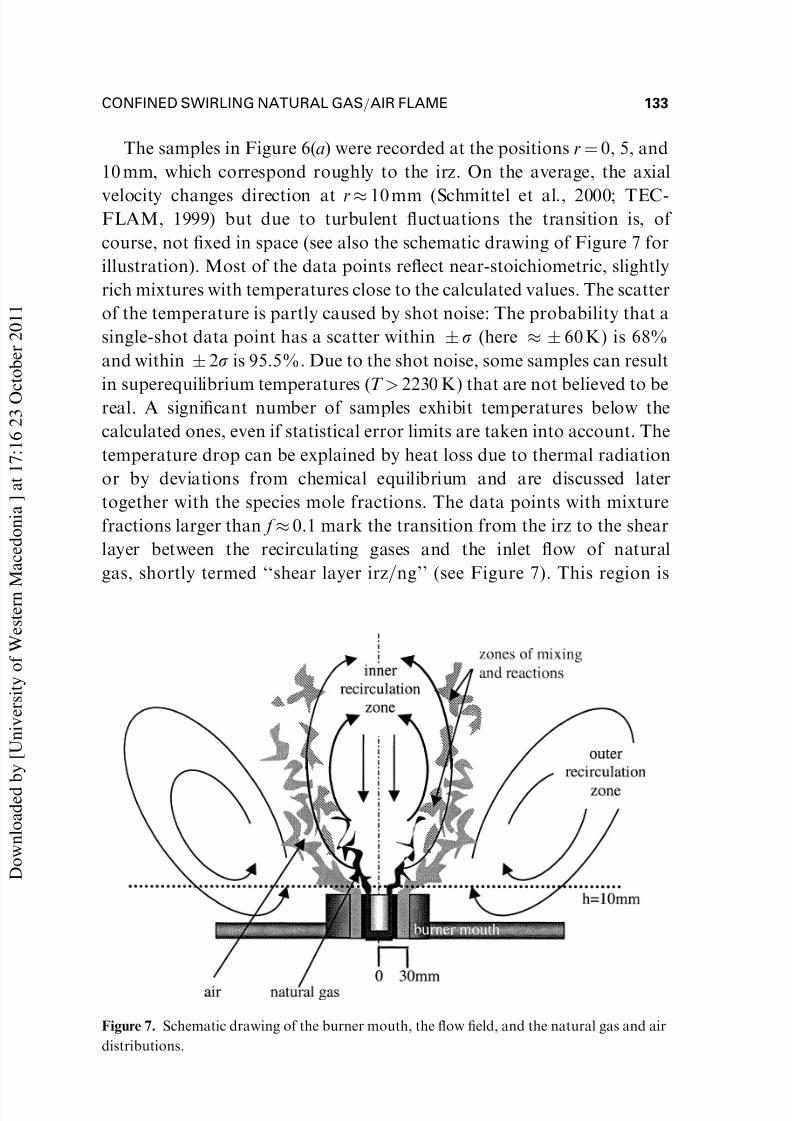
course, not fixed in space (see also the schematic drawing of Figure 7 for
illustration). Most of the data points reflect near-stoichiometric, slightly
rich mixtures with temperatures close to the calculated values. The scatter
of the temperature is partly caused by shot noise: The probability that a
single-shot data point has a scatter within Æs (here % Æ 60 K) is 68%
and within Æ 2s is 95.5%. Due to the shot noise, some samples can result
in superequilibrium temperatures (T > 2230 K) that are not believed to bereal. A significant number of samples exhibit temperatures below the
calculated ones, even if statistical error limits are taken into account. The
temperature drop can be explained by heat loss due to thermal radiation
or by deviations from chemical equilibrium and are discussed later
together with the species mole fractions. The data points with mixture
fractions larger than f % 0.1 mark the transition from the irz to the shear
layer between the recirculating gases and the inlet flow of natural
gas, shortly termed ‘‘shear layer irz=ng’’ (see Figure 7). This region is
Figure 7. Schematic drawing of the burner mouth, the flow field, and the natural gas and air
distributions.
CONFINED SWIRLING NATURAL GAS=AIR FLAME 133
D o w n l o a d e d b y [ U n i v e r s i t y o f W e s t e r n M a c e d o n i a ] a t 1 7 : 1 6 2 3 O c t o b e r 2 0 1 1
Page 20
7/30/2019 713713067
http://slidepdf.com/reader/full/713713067 20/37
dominated by turbulent mixing of hot exhaust gas from the irz and cold
fuel, and comparison with the calculated curves reveals that the mea-
surements are indeed closer to the curve ‘‘mixing of exhaust gas andCH4’’ than to the strained laminar flame calculation. An increase of the
strain rate to, e.g., a ¼ 400sÀ1 would decrease the calculated temperature
but the effect is only approximately 30 K compared to a ¼ 100sÀ1. The
exhaust gas temperature of 2100 K, which was used in the calculation for
the mixing, is subject to some arbitrariness and was chosen because it
matches the temperature in the inner recirculation zone well (this tem-
perature is also the same as for a ¼ 100sÀ1 at f % 0.065). The remaining
temperature drop of the measured values in comparison to this curveis, again, probably due to radiation and deviations from chemical
equilibrium.
Figure 6(b) shows the results from r ¼ 14–24 mm (four different mea-
suring positions), which is above the nozzles for natural gas and air (see
Figure 7). The scatterplot displays a large variation of f from pure air to
almost pure fuel and is divided into ‘‘cold’’ and ‘‘hot’’ branches. As
discussed before, the hot branch represents mixtures from the shear layer
irz=ng. The cold branch reflects the various states of mixing between fuel
and air, and the low temperatures (T % 300 K) are evidence that flame
reactions have not started. This finding is in agreement with the mea-
surement of the flame emissions and can be explained as follows. The
high flow velocities in this region of 20–35 m=s (P. Schmittel, Universita ¨ t
Karlsruhe, private communication, 1998; TECFLAM, 1999) prevent an
anchoring of the flame without further stabilization mechanism. In
swirling flames, the stabilization is accomplished by the transport of hot
combustion products and radicals to the flame root within the inner
recirculation zone. However, at h ¼ 10 mm, the hot gases are shieldedfrom the reactive mixtures at r % 20 mm by the inlet flow of natural gas at
r % 15 mm, as depicted in Figure 7. Farther downstream, at h % 20 mm,
the natural gas flow becomes sufficiently diluted by turbulent mixing so
that ignition and stabilization of the flame can take place.
The adjacent radial region, r ¼ 26–34 mm—Figure 6(c), six measuring
positions—covers the inlet flow of cold air and the shear layer between
air and the orz; the samples with f > 0 and T % 300 K belong to region (b)
discussed earlier. The temperatures of the mixtures of air and recircu-lating exhaust gas exhibit a scatter of several hundred degrees and lie
well below the calculated values. This behavior is explained by the
thermochemical state of the gases in the outer recirculation zone, as
134 O. KECK ET AL.
D o w n l o a d e d b y [ U n i v e r s i t y o f W e s t e r n M a c e d o n i a ] a t 1 7 : 1 6 2 3 O c t o b e r 2 0 1 1
Page 21
7/30/2019 713713067
http://slidepdf.com/reader/full/713713067 21/37
shown in Figure 6(d ) for r ¼ 36–150 mm (eight measuring positions).
Here, the samples have a nearly constant mixture fraction of f ¼ 0.047,
which corresponds to the overall air=fuel ratio of 1.2. The temperaturevaries between 800 and 1500 K and lies far below the adiabatic tem-
perature of T % 2060 K. The temperature drop is explained by thermal
radiation and wall contact of the gases during their (relatively long)
residence time within the outer recirculation zone.
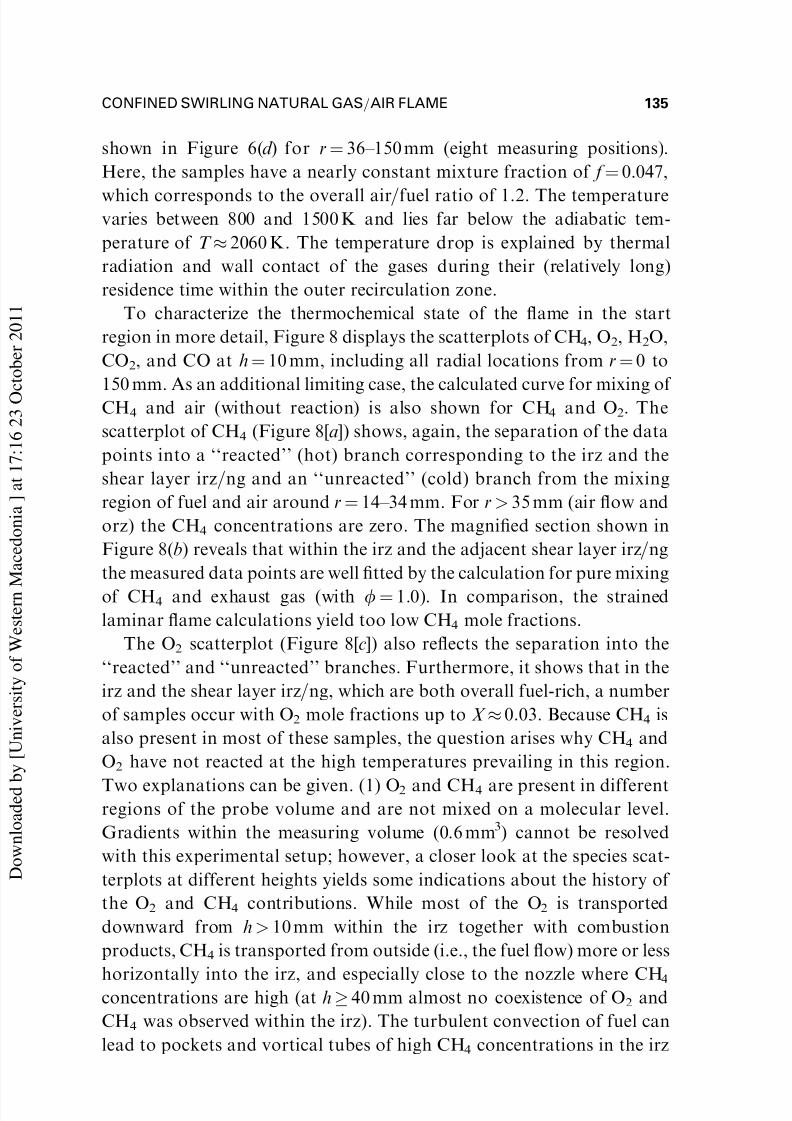
To characterize the thermochemical state of the flame in the start
region in more detail, Figure 8 displays the scatterplots of CH4, O2, H2O,
CO2, and CO at h ¼ 10 mm, including all radial locations from r ¼ 0 to
150 mm. As an additional limiting case, the calculated curve for mixing of CH4 and air (without reaction) is also shown for CH4 and O2. The
scatterplot of CH4 (Figure 8[a]) shows, again, the separation of the data
points into a ‘‘reacted’’ (hot) branch corresponding to the irz and the
shear layer irz=ng and an ‘‘unreacted’’ (cold) branch from the mixing
region of fuel and air around r ¼ 14–34 mm. For r> 35 mm (air flow and
orz) the CH4 concentrations are zero. The magnified section shown in
Figure 8(b) reveals that within the irz and the adjacent shear layer irz=ng
the measured data points are well fitted by the calculation for pure mixing
of CH4 and exhaust gas (with f¼ 1.0). In comparison, the strained
laminar flame calculations yield too low CH4 mole fractions.
The O2 scatterplot (Figure 8[c]) also reflects the separation into the
‘‘reacted’’ and ‘‘unreacted’’ branches. Furthermore, it shows that in the
irz and the shear layer irz=ng, which are both overall fuel-rich, a number
of samples occur with O2 mole fractions up to X % 0.03. Because CH4 is
also present in most of these samples, the question arises why CH4 and
O2 have not reacted at the high temperatures prevailing in this region.
Two explanations can be given. (1) O2 and CH4 are present in differentregions of the probe volume and are not mixed on a molecular level.
Gradients within the measuring volume (0.6 mm3) cannot be resolved
with this experimental setup; however, a closer look at the species scat-
terplots at different heights yields some indications about the history of
the O2 and CH4 contributions. While most of the O2 is transported
downward from h> 10 mm within the irz together with combustion
products, CH4 is transported from outside (i.e., the fuel flow) more or less
horizontally into the irz, and especially close to the nozzle where CH4concentrations are high (at h ! 40 mm almost no coexistence of O2 and
CH4 was observed within the irz). The turbulent convection of fuel can
lead to pockets and vortical tubes of high CH4 concentrations in the irz
CONFINED SWIRLING NATURAL GAS=AIR FLAME 135
D o w n l o a d e d b y [ U n i v e r s i t y o f W e s t e r n M a c e d o n i a ] a t 1 7 : 1 6 2 3 O c t o b e r 2 0 1 1
Page 22
7/30/2019 713713067
http://slidepdf.com/reader/full/713713067 22/37
and concentration gradients within 0.6 mm are possible. (2) O2 and CH4
are mixed on a molecular level but have not yet reacted due to ignition
delay. For typical mixtures of CH4, air, and exhaust gas, ignition delaytimes have been calculated using the CHEMKIN II code with the GRI
3.0 mechanism (Kee et al., 1993). The delay time was % 1 ms for 1750 K
and % 5 ms for 1500 K (M. Braun-Unkhoff, DLR, private communica-
Figure 8. Scatterplots of species mole fractions at h ¼ 10 mm for S ¼ 0.9.
136 O. KECK ET AL.
D o w n l o a d e d b y [ U n i v e r s i t y o f W e s t e r n M a c e d o n i a ] a t 1 7 : 1 6 2 3 O c t o b e r 2 0 1 1
Page 23
7/30/2019 713713067
http://slidepdf.com/reader/full/713713067 23/37
tion, 2000). The time scale for the flow field at h ¼ 10 mm can be esti-
mated by dividing a characteristic flow velocity of v% 10 m=s by a typical
length of l % h ¼ 10 mm, resulting in t% 1 ms with large fluctuations dueto the turbulent character of the flow. Thus, the time scales of the flow
and the flame reactions are on the same order of magnitude, and finite-
rate chemistry effects should be expected. The coexistence of O2 and CH4
in an environment of hot exhaust gas is therefore plausible. Because both
of the given explanations are realistic, we expect that both contribute to
the measured results. For those fuel-rich samples with O2 admixtures the
temperature is, of course, reduced in comparison to a completely reacted
gas, and thus the temperature difference between measurement and cal-culation in Figures 6(a) and 6(b) is partly explained by this effect.
The scatterplot of H2O, displayed in Figure 8(d ), is in good agreement
with the calculations. Lower measured than calculated H2O concentra-
tions in some samples of the fuel-rich branch can be explained by the
recently discussed effect of uncompleted reactions of O2 and CH4. For
the unreacted (cold) branch the H2O mole fractions are slightly above
zero due to the humidity of the air.
The measured CO2 mole fractions (Figure 8[e]) are not in agreement
with the strained laminar flame calculation (a ¼ 100sÀ1), but the lean
branch and the maximum concentrations around f stoich are close to
adiabatic equilibrium. On the fuel-rich side, in the shear layer irz=ng, the
data points are best described by pure mixing of CH4 and exhaust gas
from the irz. The unreacted (cold) branch shows an increase of the CO2
mole fractions with increasing f because the natural gas contains CO2.
But in contrast to the supplier’s analysis stating X CO2¼ 0.002 the Raman
measurements yield X CO2% 0.01 at f ¼ 1 (extrapolated). This value was
also confirmed in additional Raman measurements in cold natural gas.Although the discrepancy is only of minor importance for the flame
behavior it causes a slight shift in the mixture fraction, because for the
calculation of f the supplier’s composition was used. With the Raman-
measured CO2 concentration the mixture fraction increases by % 2%.
The slight mismatch between measurement and calculation, which can be
seen in some scatterplots at the fuel-rich end near f ¼ 1, may also be
caused by this difference and would be less pronounced with a 2% higher
mixture fraction of the data points.In the scatterplot of CO (Figure 8[ f ]) the bimodal character ‘‘reac-
ted=unreacted’’ is not so well pronounced as for the other species. For the
cold branch, the CO mole fractions are practically zero, as expected. The
CONFINED SWIRLING NATURAL GAS=AIR FLAME 137
D o w n l o a d e d b y [ U n i v e r s i t y o f W e s t e r n M a c e d o n i a ] a t 1 7 : 1 6 2 3 O c t o b e r 2 0 1 1
Page 24
7/30/2019 713713067
http://slidepdf.com/reader/full/713713067 24/37
highest CO mole fractions were measured in the irz where the data points
tend to follow the adiabatic equilibrium curve. A closer look at these
samples reveals that X CO varies strongly around f stoich from 0 toapproximately 0.07, in accordance with the calculations. In the shear
layer irz=ng the CO concentrations are below the calculated values
(a ¼ 100sÀ1) and exhibit a large scatter. This scatter is not due to tur-
bulence–chemistry interactions but is simply a consequence of the mixing
of exhaust gas from the irz and natural gas, which transfers the large
variation in CO concentrations from the irz to the shear layer.
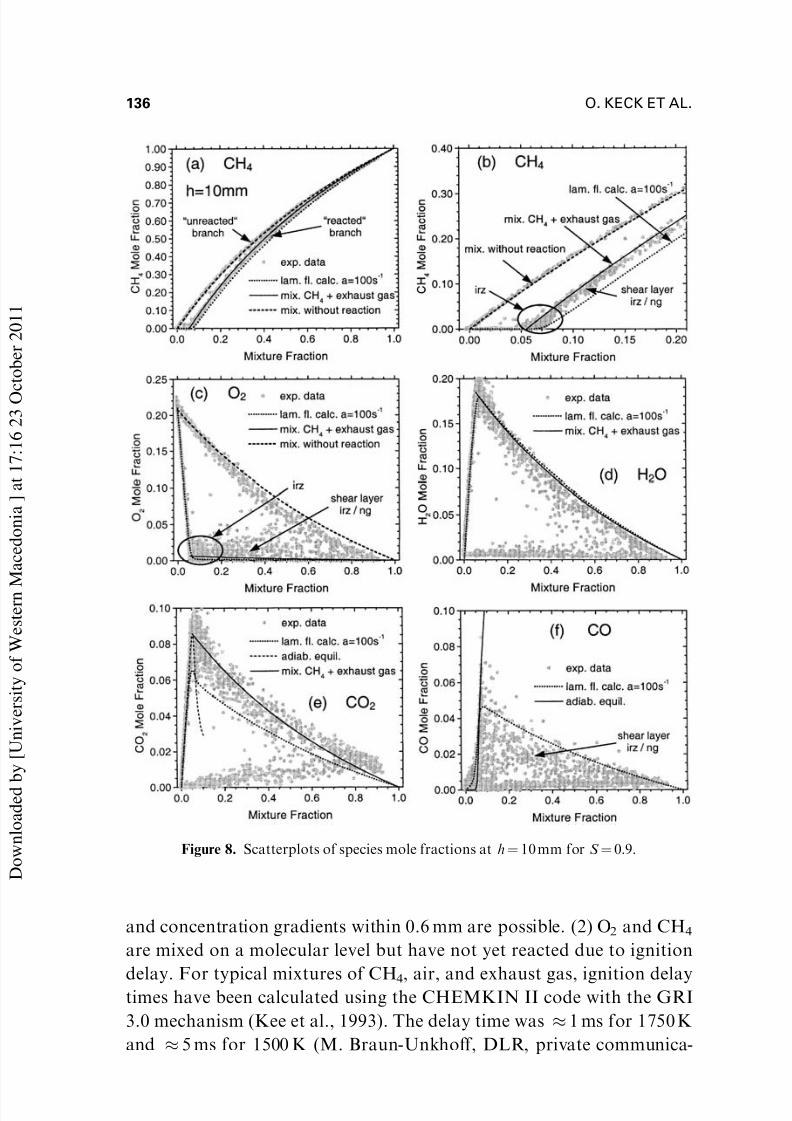
Scatterplots at Different Heights. The determination of the thermo-chemical state in the different zones at h ¼ 10 mm yielded a detailed
characterization of the starting conditions for the ignition and stabili-
zation of the flame at h % 20 mm, and the influence of the flame reactions
on the further development of the state can be better understood with this
knowledge. To illustrate this development, Figure 9 shows the scatter-
plots of the temperature for h ¼ 10, 20, 60, and 150 mm. With increasing
height, the variations in mixture fraction are rapidly reduced reflecting
Figure 9. Scatterplots of the temperature at various heights.
138 O. KECK ET AL.
D o w n l o a d e d b y [ U n i v e r s i t y o f W e s t e r n M a c e d o n i a ] a t 1 7 : 1 6 2 3 O c t o b e r 2 0 1 1
Page 25
7/30/2019 713713067
http://slidepdf.com/reader/full/713713067 25/37
the fast mixing within the swirled turbulent flow field. (Notice the
stretched scale of the f -axis in frames [c] and [d ].) At h ¼ 20 mm the bi-
modal character (reacted=unreacted) of the scatterplot begins to blur, i.e.,there are a number of samples with intermediate temperatures between
room and flame temperature. These partially reacted mixtures become
more frequent with increasing height and can be attributed to the onset of
flame reactions. There are three different interpretations of this behavior:
(1) In spatial averaging a nonhomogeneous gas composition of, for
example, reacted and unreacted mixtures within the probe volume can
result in an apparent deviation from chemical equilibrium. Strong spatial
averaging effects are predominantly expected when the reaction zone fallswithin the measuring volume because here the temperature and con-
centration gradients are high, and cold and hot gases are close together.
The probability of finding the reaction zone within the probe volume was
estimated with the help of single-pulse PLIF measurements of OH in this
flame (DLR, 2000; Keck, 2001). Steep gradients in the OH-LIF intensity
distribution are a characteristic marker of the reaction zone, or at least of
steep temperature gradients. At h ¼ 60 mm, steep OH gradients were
observed between r % 15 and 60 mm and most frequently (with a prob-
ability of p % 0.29) in the Dr ¼ 10 mm range from r ¼ 40 to 50 mm. With
an estimated width of d % 0.3 mm for the regions with large OH gradients,
the probability of having this region (or part of it) within l ¼ 0.6 mm of
the probe volume is p  (l þd )=Dr ¼ 0.29  (0.6 mm þ 0.3 mm)=10 mm ¼
0.026. Thus, severe spatial averaging could occur only in less than 3% of
the samples with the effect of mimicking a partially reacted mixture. (2)
Local flame extinction can leave the reacting gases in a state of un-
completed reactions. Visual observations of the flame as well as a high
noise level were indications of flame instabilities in the form of local flameextinction and re-ignition. At higher swirl numbers, even total flame
extinction occurred. Therefore, it seems plausible that local flame ex-
tinction contributed to the observed variation of the thermochemical
state. (3) The third interpretation involves ignition delay. Mixing of ex-
haust gas with fuel and air leads to reactive compositions with varying
temperatures. The ignition delay time depends on the composition and
temperature and is typically 1 ms at 1750 K and 10 ms at 1250 K (M.
Braun-Unkhoff, DLR, private communication, 2000). As stated earlier,the time scale of the flow field and mixing is on the same order of
magnitude, so a large variation of mixtures and reaction progress can
possibly be found in this region of the flame. Although the Raman data
CONFINED SWIRLING NATURAL GAS=AIR FLAME 139
D o w n l o a d e d b y [ U n i v e r s i t y o f W e s t e r n M a c e d o n i a ] a t 1 7 : 1 6 2 3 O c t o b e r 2 0 1 1
Page 26
7/30/2019 713713067
http://slidepdf.com/reader/full/713713067 26/37
cannot directly reveal the temporal development of these processes, it can
be concluded that the turbulent flow field suppresses and=or delays the
chemical reactions to a large extent and that strong effects of turbulence– chemistry interactions are obvious.
In the interpretation of the thermochemical state it should be kept in
mind that the swirled turbulent flow field generates a fast mixing of gases
of different origins. Whereas at h ¼ 10 mm only compositions of neigh-
boring regions (irz–fuel–air–orz) are present, farther downstream addi-
tional admixtures are observed, e.g., compositions of exhaust gas and
fuel=air mixtures or partially reacted gases. Above h % 60 mm pure nat-
ural gas=air mixtures (i.e., T ¼ 300 K) are no longer found, but the mixingof exhaust gas, fuel, and air can repeatedly generate reactive mixtures
until all fuel is consumed. With increasing height the state of the flame
approaches that of a completely reacted exhaust gas (see Figure 9[d ]).
The maximum of the temperature distribution lies around 2300–2400 K
up to h % 120 mm and begins to decrease for h ! 150 mm, reflecting the
heat loss by thermal radiation and wall contact.
The scatterplots of the species (not displayed) are in agreement with
the explanations given for the temperature scatterplots and also reflect
the large variation of the thermochemical state between unreacted and
completely reacted states. To examine whether the gas composition and
the temperature of the partially reacted mixtures are in (partial) equili-
brium, the correlations between the measured species mole fractions and
the temperature can be compared to the results from strained laminar
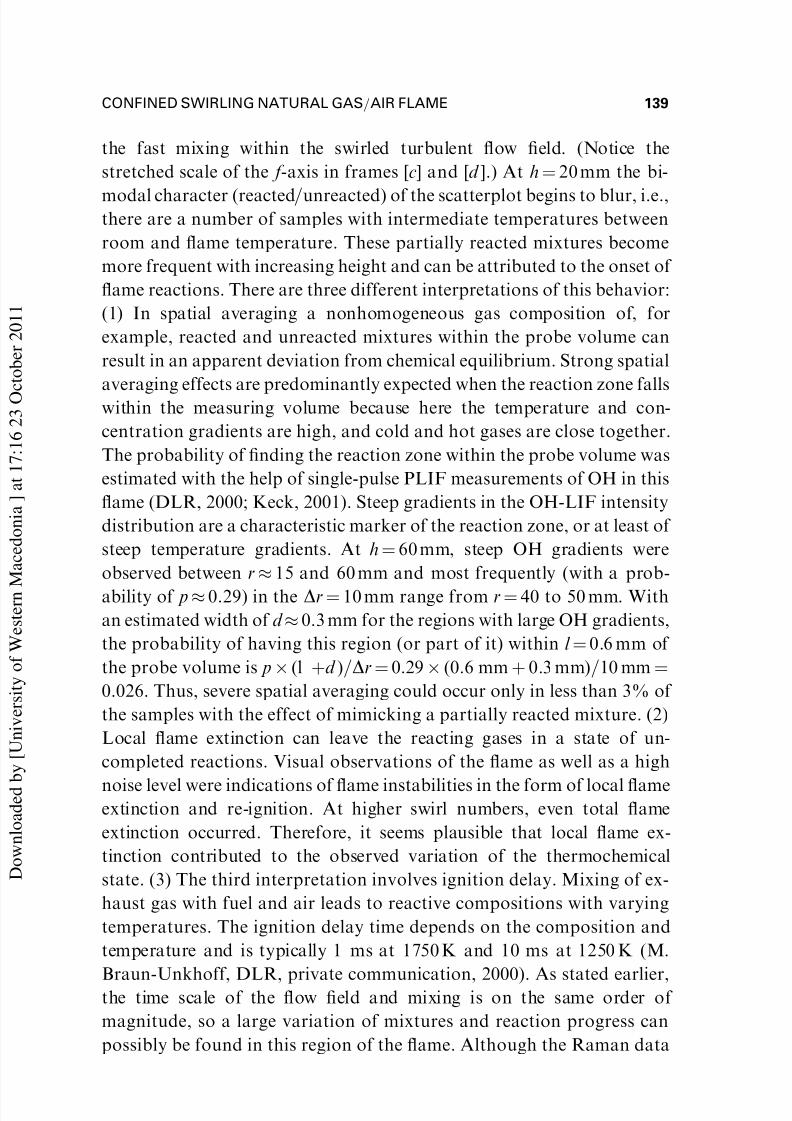
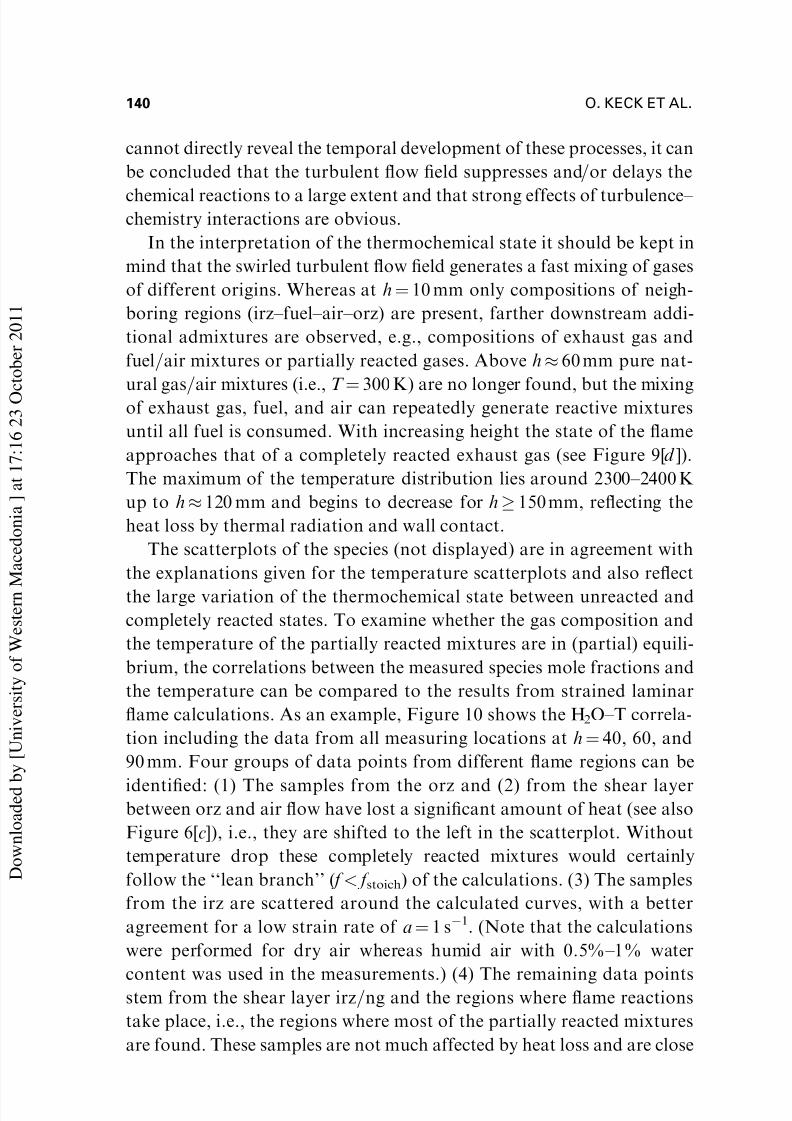
flame calculations. As an example, Figure 10 shows the H2O–T correla-
tion including the data from all measuring locations at h ¼ 40, 60, and
90 mm. Four groups of data points from different flame regions can be
identified: (1) The samples from the orz and (2) from the shear layerbetween orz and air flow have lost a significant amount of heat (see also
Figure 6[c]), i.e., they are shifted to the left in the scatterplot. Without
temperature drop these completely reacted mixtures would certainly
follow the ‘‘lean branch’’ ( f < f stoich) of the calculations. (3) The samples
from the irz are scattered around the calculated curves, with a better
agreement for a low strain rate of a ¼ 1 sÀ1. (Note that the calculations
were performed for dry air whereas humid air with 0.5%–1% water
content was used in the measurements.) (4) The remaining data pointsstem from the shear layer irz=ng and the regions where flame reactions
take place, i.e., the regions where most of the partially reacted mixtures
are found. These samples are not much affected by heat loss and are close
140 O. KECK ET AL.
D o w n l o a d e d b y [ U n i v e r s i t y o f W e s t e r n M a c e d o n i a ] a t 1 7 : 1 6 2 3 O c t o b e r 2 0 1 1
Page 27
7/30/2019 713713067
http://slidepdf.com/reader/full/713713067 27/37
to the rich branch ( f > f stoich) of the calculated curves. The good agree-
ment with the calculations shows that the partially reacted mixtures (aswell as the completely reacted) exhibit a ‘‘normal’’ correlation between
the mole fraction of H2O (and also CO2, not displayed) and temperature,
i.e., that these species and the temperature are in partial equilibrium. For
Figure 10. Correlations between H2O and temperature and CO and temperature. Data are
from the measuring heights h ¼ 40–90 mm. For CO, only fuel-rich samples are displayed.
CONFINED SWIRLING NATURAL GAS=AIR FLAME 141
D o w n l o a d e d b y [ U n i v e r s i t y o f W e s t e r n M a c e d o n i a ] a t 1 7 : 1 6 2 3 O c t o b e r 2 0 1 1
Page 28
7/30/2019 713713067
http://slidepdf.com/reader/full/713713067 28/37
the combustion intermediates CO and H2 the correlations look different,
as can be seen for CO in the lower frame of Figure 10. For a clearer
presentation and a concentration on the partially reacted mixtures, thefuel-lean samples are omitted in this scatterplot. The samples from the irz
with temperatures around 2000 K are in quite good agreement with cal-
culations for low strain rates, e.g., a ¼ 5 sÀ1. The partially reacted mix-
tures cover the intermediate temperature range. Here, the CO mole
fractions exhibit a large scatter and do not clearly follow one of the
calculated curves. Whether the scatter is mainly caused by mixing (as
discussed for h ¼ 10 mm) or by finite-rate chemistry cannot be decided
unambiguously, and a more detailed analysis is difficult due to the quitehigh measurement uncertainty for CO (see ‘‘Calibration and Data
Reduction’’), which also contributes to the observed scatter.
The results from the scatterplots can be summarized as follows. The
thermochemical state varies strongly in the different regions of the flame.
Within the irz, hot and slightly rich exhaust gas dominates, which is close
to equilibrium composition and temperature. The gases in the orz are
relatively old and have completely reacted. They exhibit a nearly constant
mixture fraction of f ¼ 0.047 and temperatures far below adiabatic flame
temperature due to heat loss. Below h ¼ 20 mm flame reactions are sup-
pressed by the high flow velocities and the shielding of the flame-stabi-
lizing hot gases by the cold natural gas flow. Here, the thermochemical
state is predominantly determined by mixing. Chemical reactions are of
minor importance and restricted to the irz, where remaining O2 can
oxidize fuel components. Above h ¼ 20 mm the processes become more
complex due to the onset of flame reactions and because all kinds of
mixtures of gases from different regions can appear. In the region of
combustion, effects of strong turbulence–chemistry interaction areobserved and the thermochemical state varies from unreacted to com-
pletely reacted with all possible intermediate states. Finally, at
h ! 200 mm (not shown) the fuel is consumed and the exhaust gas com-
position approaches chemical equilibrium and a mixture fraction of
f ¼ 0.047. The dominant process is then heat exchange by thermal
radiation or wall contact.
Influence of the Swirl Number
To study the influence of the swirl number on the flame behavior the
tangential velocity component of the air flow was increased by changing
142 O. KECK ET AL.
D o w n l o a d e d b y [ U n i v e r s i t y o f W e s t e r n M a c e d o n i a ] a t 1 7 : 1 6 2 3 O c t o b e r 2 0 1 1
Page 29
7/30/2019 713713067
http://slidepdf.com/reader/full/713713067 29/37
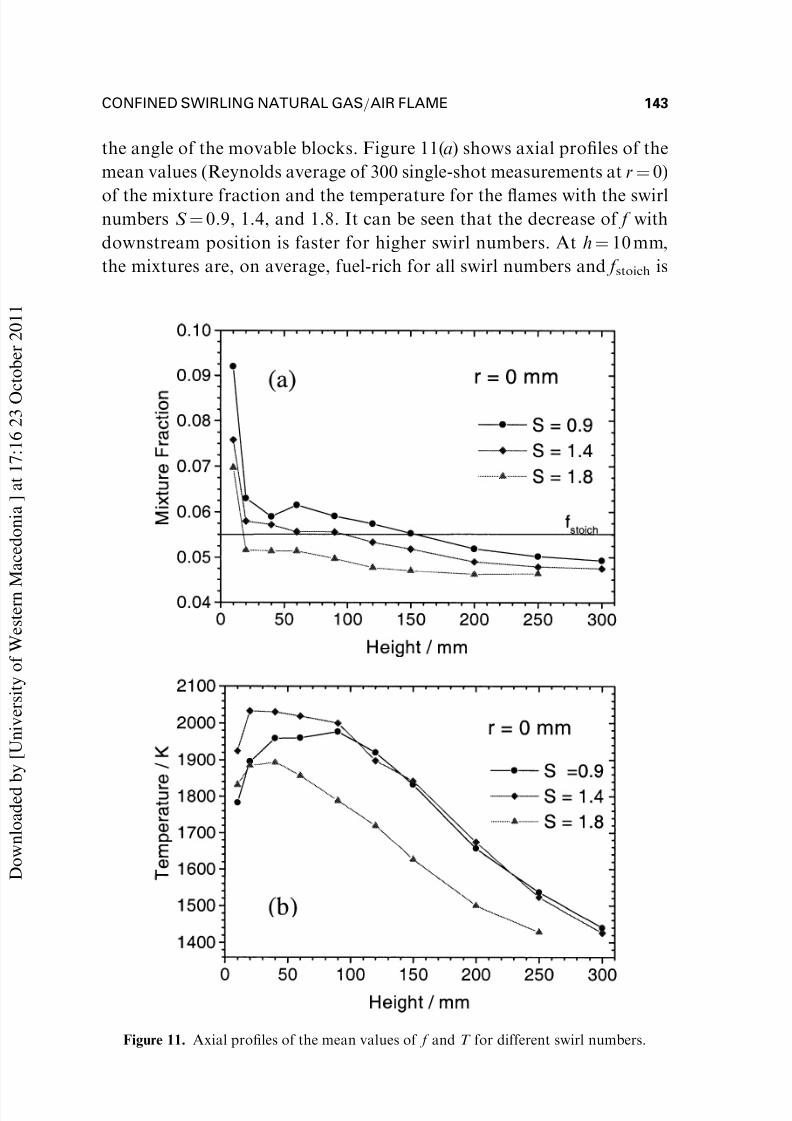
the angle of the movable blocks. Figure 11(a) shows axial profiles of the
mean values (Reynolds average of 300 single-shot measurements at r ¼ 0)
of the mixture fraction and the temperature for the flames with the swirlnumbers S ¼ 0.9, 1.4, and 1.8. It can be seen that the decrease of f with
downstream position is faster for higher swirl numbers. At h ¼ 10 mm,
the mixtures are, on average, fuel-rich for all swirl numbers and f stoich is
Figure 11. Axial profiles of the mean values of f and T for different swirl numbers.
CONFINED SWIRLING NATURAL GAS=AIR FLAME 143
D o w n l o a d e d b y [ U n i v e r s i t y o f W e s t e r n M a c e d o n i a ] a t 1 7 : 1 6 2 3 O c t o b e r 2 0 1 1
Page 30
7/30/2019 713713067
http://slidepdf.com/reader/full/713713067 30/37
reached at h % 18 mm for S ¼ 1.8, at h % 93 mm for S ¼ 1.4, and at
h % 150 mm for S ¼ 0.9. The final value of f ¼ 0.047 (l¼ 1.2) was mea-
sured at h ¼ 150 mm for S ¼ 1.8 and lies above 300 mm for the other twoflames. This behavior, i.e., enhanced mixing with increasing swirl num-
ber, is also apparent in the radial profiles of the mixture fraction (not
displayed). With increasing tangential velocity, shear-induced turbulence
becomes stronger in the shear layer between the natural gas and air flows
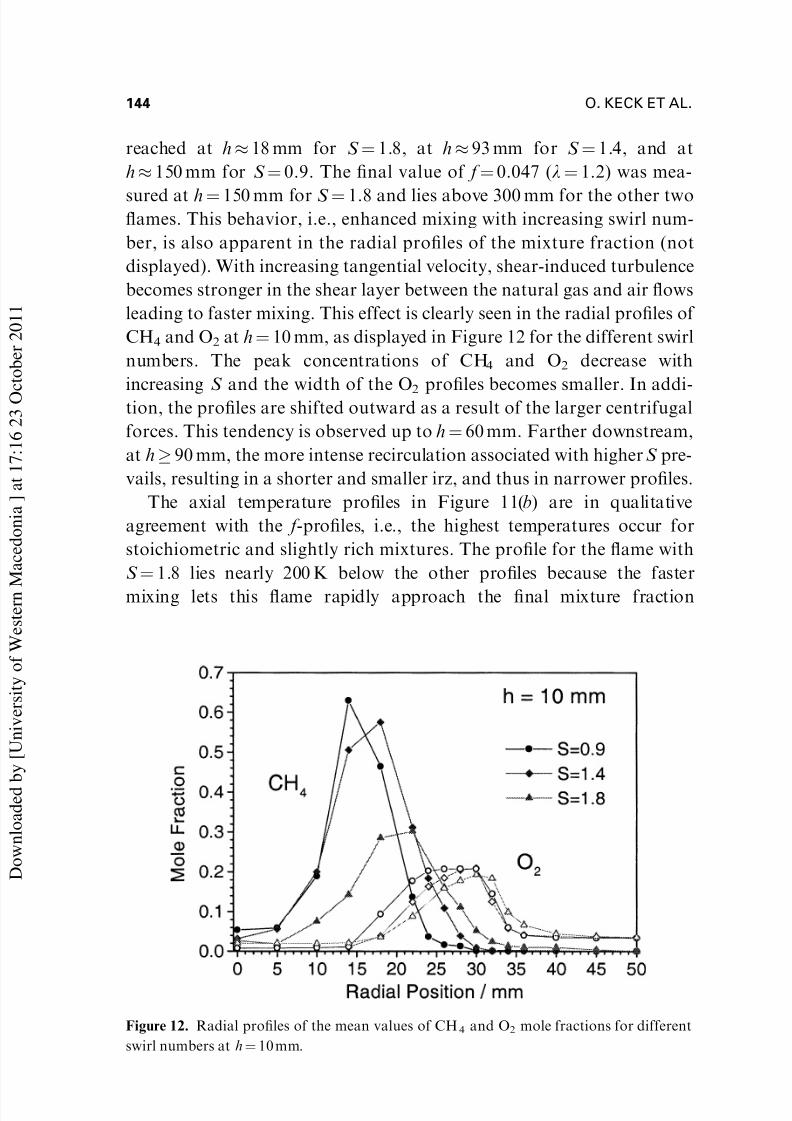
leading to faster mixing. This effect is clearly seen in the radial profiles of
CH4 and O2 at h ¼ 10 mm, as displayed in Figure 12 for the different swirl
numbers. The peak concentrations of CH4 and O2 decrease with
increasing S and the width of the O2 profiles becomes smaller. In addi-tion, the profiles are shifted outward as a result of the larger centrifugal
forces. This tendency is observed up to h ¼ 60 mm. Farther downstream,
at h ! 90 mm, the more intense recirculation associated with higher S pre-
vails, resulting in a shorter and smaller irz, and thus in narrower profiles.
The axial temperature profiles in Figure 11(b) are in qualitative
agreement with the f -profiles, i.e., the highest temperatures occur for
stoichiometric and slightly rich mixtures. The profile for the flame with
S ¼ 1.8 lies nearly 200 K below the other profiles because the faster
mixing lets this flame rapidly approach the final mixture fraction
Figure 12. Radial profiles of the mean values of CH4 and O2 mole fractions for different
swirl numbers at h ¼ 10 mm.
144 O. KECK ET AL.
D o w n l o a d e d b y [ U n i v e r s i t y o f W e s t e r n M a c e d o n i a ] a t 1 7 : 1 6 2 3 O c t o b e r 2 0 1 1
Page 31
7/30/2019 713713067
http://slidepdf.com/reader/full/713713067 31/37
f ¼ 0.047. (The adiabatic flame temperature for f stoich ¼ 0.055 is 210 K
higher than for f ¼ 0.047.) In comparing the profiles of the mean values of
f and T in Figure 11 one has to keep in mind that f and T exhibit astrongly nonlinear relationship around f stoich so that a correlation
between f mean and T mean has to be interpreted with care. For adiabatic
equilibrium, e.g., two samples with f 1 ¼ 0.04, T 1 ¼ 1865 K and f 2 ¼ 0.07,
T 2 ¼ 2063 K result in a mean of f ¼ 0.055 and T ¼ 1964 K. The adiabatic
temperature at f ¼ 0.055 is, however, 2225 K. For h> 120–150 mm the
temperature profiles are also influenced by thermal radiation. In general,
enhanced swirl reduces the residence time in the near field of the flame
due to faster reverse flows and, thus, also the temperature drop fromthermal radiation. This effect is clearly seen in the outer recirculation
zone (not displayed) and is also visible in the faster axial temperature
decay for the flame with S ¼ 0.9 in comparison to S ¼ 1.4.
A further consequence of the more intense mixing at higher S is a
faster decay and dilution of the natural gas flow, so that flame ignition
can take place closer to the burner mouth. In comparison to S ¼ 0.9, the
flame with S ¼ 1.8 is stabilized approximately 10 mm closer to the nozzle.
The scatterplots of temperature and mole fractions confirm the
enhancement of mixing and the earlier onset of flame reactions with
increasing swirl. As far as turbulence–chemistry interaction is concerned,
there are no significant changes for different swirl numbers. The scatter-
plots of all flames reveal basically a very similar thermochemical state in
the different flame regions and are therefore not displayed and discussed.
CONCLUSIONS
A highly efficient single-pulse Raman scattering system was used forsimultaneous measurements of the temperature, mixture fraction, and
major species concentrations in confined natural gas=air flames. The
burner was constructed within the TECFLAM research group as a
prototype of an industrial combustor with the aim to establish a reference
system for cooperative experimental and theoretical investigations of
swirling diffusion flames. The operating conditions of a standard flame
(150 kW, S ¼ 0.9, f¼ 0.833) were carefully controlled and documented
and the reproducibility of the experimental results was ensured byrepeated and comparative measurements.
The global flame behavior was characterized by the mean values
and rms fluctuations of the measured quantities and was displayed as
CONFINED SWIRLING NATURAL GAS=AIR FLAME 145
D o w n l o a d e d b y [ U n i v e r s i t y o f W e s t e r n M a c e d o n i a ] a t 1 7 : 1 6 2 3 O c t o b e r 2 0 1 1
Page 32
7/30/2019 713713067
http://slidepdf.com/reader/full/713713067 32/37
two-dimensional distributions of f and T . Three different regions were
identified: (1) the region dominated by the inlet flows of natural gas and
air with large fluctuations of f and T , (2) the inner recirculation zone withnear-stoichiometric and slightly rich exhaust gas with mean temperatures
of 1800–2000 K, and (3) the outer recirculation zone with exhaust gas of
nearly constant composition (f¼ 0.833) and temperatures of 1200–
1600 K. The measurements of the species concentrations and the flame
luminosity showed that the flame reactions and fuel consumption are
completed below h ¼ 200 mm.
The scatterplots revealed that the thermochemical state of the react-
ing gases changed significantly during the course of combustion. Inthe outer recirculation zone, which fills the largest part of the combus-
tion chamber, the exhaust gas composition is simply chemical equilib-
rium at f¼ 0.833. The temperature is far below adiabatic equilibrium
and reflects the heat loss by thermal radiation and wall contact. In
comparison, the exhaust gas in the inner recirculation zone is much
younger, i.e., it has been transported directly from the reaction zones to
the central part of the burner. The mixtures are near-stoichiometric and
slightly fuel-rich and the temperatures are close to the values from
adiabatic calculations. The fluctuations of f are higher than in the orz due
to the influence of the pronounced shear layer between the irz and the
neighboring fuel flow. In some probes, the exhaust gas contains small
concentrations of O2 that is transported from upper regions into the irz.
In that case, reactions between O2 and CH4, H2, or CO can occur, but are
delayed by typically 1–5 ms. In the lower part of the irz (h 30 mm), high
CH4 can be found, reflecting the turbulent mixing between the natural
gas flow and the irz.
In the region of the inlet flows of fuel and air, a large variation of themixture fraction was observed at h ¼ 10 mm, which rapidly decreased
farther downstream. This decrease of mixture fraction fluctuations with
height demonstrates the fast mixing generated by the swirling flow field.
The measurements show that flame reactions do not occur below
h ¼ 20 mm. This is explained by the influence of the natural gas flow,
which shields the hot gases from the irz from the reactive mixtures,
preventing the ignition and stabilization of the flame. Thus, for
h< 20 mm the thermochemical state is mainly determined by mixing andthe flame is partially premixed before ignition. So far, the observed
thermochemical states are not very complex and effects of turbulence–
chemistry interactions are small.
146 O. KECK ET AL.
D o w n l o a d e d b y [ U n i v e r s i t y o f W e s t e r n M a c e d o n i a ] a t 1 7 : 1 6 2 3 O c t o b e r 2 0 1 1
Page 33
7/30/2019 713713067
http://slidepdf.com/reader/full/713713067 33/37
After ignition, the scatterplots show a large number of samples with
partially reacted gas compositions and intermediate temperatures between
room and flame temperature. From the measured results it cannotunambiguously be decided whether local flame extinction or fast mixing
combined with ignition delay is the main source for this behavior. In the
authors’ opinion both effects are plausible and contribute to the non-
equilibrium states. The distributions of the flame emissions give the impres-
sion that the reaction zones are torn by the shear forces of the swirled
flow field. Even without knowing the history of the partially reacted
mixtures, it is clear that the thermochemical state in this region is strongly
affected by turbulence–chemistry interactions. Finally, at h ¼ 200 mm, theflame reactions and energy conversion are finished. This short flame
length is evidence of the high mixing intensity of the swirled turbulent
flow field.
With increasing swirl, mixing becomes even faster until the flame
stability limit is reached for S > 1.8. Increased swirl causes stronger
centrifugal forces and higher pressure gradients in the irz. Therefore, the
shape of the irz changes with swirl: It becomes broader close to the
burner and shorter in height. Significant changes of the thermochemical
state were, however, not identified.
The Raman measurements yielded a comprehensive quantitative char-
acterization of the global flame behavior and the thermochemical state of
the flame. Further investigations performed within the TECFLAM proj-
ect quantified the flow field (Schmittel et al., 2000; C. Schneider, Uni-
versita ¨ t Darmstadt, private communication, 2000, TECFLAM, 1999), the
thermal radiation (Ganz et al., 1998), two-dimensional distributions of
OH, NO, H2CO, and T (Bo ¨ ckle et al., 2000a, 2000b), and species con-
centrations and temperatures from probe measurements (P. Schmittel,Universita ¨ t Karlsruhe, private communication, 1998; Schmittel et al.,
2000). The large amount of data and the accurate documentation of the
flame parameters make this flame an ideal test case for the verification of
CFD codes. A few numerical simulations have been performed so far and
the results are available in the Internet (Mbiock et al., 2000) or in the
literature (Hinz, 2000; Landenfeld, 1999; Meier et al., 2000).
REFERENCES
Barlow, R.S., Campbell, C.D., and Pitz, R.W. (2002) Multiscalar diagnostics in
turbulent flames. In K. Kohse-Ho ¨ inghaus, and J.B. Jeffries (Eds.) Applied
Combustion Diagnostics, Taylor & Francis, New York, pp. 384–407.
CONFINED SWIRLING NATURAL GAS=AIR FLAME 147
D o w n l o a d e d b y [ U n i v e r s i t y o f W e s t e r n M a c e d o n i a ] a t 1 7 : 1 6 2 3 O c t o b e r 2 0 1 1
Page 34
7/30/2019 713713067
http://slidepdf.com/reader/full/713713067 34/37
Beretta, F., Cincotti, V., D’Alessio, A., and Menna, P. (1985) Ultraviolet and
visible fluorescence in the fuel pyrolysis region of gaseous diffusion flames.
Combust. Flame, 61, 211–218.Bergmann, V., Meier, W., Wolff, D., and Stricker, W. (1998) Application of sponta-
neous Raman and Rayleigh scattering and 2D LIF for the characterization
of a turbulent CH4=H2=N2 jet diffusion flame. Appl. Phys. B, 66, 489–502.
Bilger, R.W. (1988) The structure of turbulent nonpremixed flames. Proc. Com-
bust. Instit., 22, 475–488.
Bo ¨ ckle, S., Kazenwadel, J., Kunzelmann, T., and Schulz, C. (2000a) Laser-
diagnostic multi-species imaging in strongly swirling natural gas flames. Appl.
Phys. B, 71, 741–746.
Bo ¨ ckle, S., Kazenwadel, J., Kunzelmann, T., Shin, D.-I., Schulz, C., andWolfrum, J. (2000b) Simultaneous single-shot laser-based imaging of for-
maldehyde, OH, and temperature in turbulent flames. Proc. Combust. Instit.,
28, 279–286.
Brockhinke, A., Andresen, P., and Kohse-Ho ¨ inghaus, K. (1995) Quantitative
one-dimensional single-pulse multi-species concentration and temperature
measurement in the lift-off region of a turbulent H2=Air diffusion flame.
Appl. Phys. B, 61, 533–545.
Chen, R.H. (1995) Some characteristics of NOx emission of turbulent non-
premixed hydrogen-air flames stabilized by swirl-generated flow recircula-tion. Combust. Sci. Tech., 110=111, 443–460.
Chen, Y.-C., Mansour, M.S., and Peters, N. (1997) Measurements of scalar
dissipation in turbulent hydrogen diffusion flames and the implication on
combustion modeling. Combust. Sci. Tech., 126, 291–313.
Cheng, T.S., Chao, Y.-C., Wu, D.-C., Yuan, T., Lu, C.-C., Cheng, C.-K., and
Chang, J.-M. (1998) Effects of fuel-air mixing on flame structures and NOx
emission in swirling methane jet flames. Proc. Combust. Instit., 27, 1229–
1237.
Cooper, C.S., and Laurendeau, N.M. (2000) Comparison of laser-induced andplanar laser-induced fluorescence measurements of nitric oxide in a high-
pressure, swirl-stabilized, spray flame. Appl. Phys. B, 70, 903–910.
Correa, S.M., Gulati, A., and Pope, S.B. (1994) Raman measurements and joint
PDF modeling of a nonpremixed bluff-body-stabilized methane flame. Proc.
Combust. Instit., 25, 1167–1173.
DLR. Institut fu ¨ r Verbrennungstechnik. (section ‘‘Arbeitsgruppen=Laserdiag-
nostik=Arbeitsgebiete=Laserinduzierte Fluoreszenz’’). http:==www.dlr.de=
VT (accessed June 2002).
Ebersohl, N., Klos, Th., Suntz, R., and Bockhorn, H. (1998) One-dimensionalRaman scattering for determination of multipoint joint scalar probability
density functions in turbulent diffusion flames. Proc. Combust. Instit., 27,
997–1005.
148 O. KECK ET AL.
D o w n l o a d e d b y [ U n i v e r s i t y o f W e s t e r n M a c e d o n i a ] a t 1 7 : 1 6 2 3 O c t o b e r 2 0 1 1
Page 35
7/30/2019 713713067
http://slidepdf.com/reader/full/713713067 35/37
Eckbreth, A.C. (1996) Laser Diagnostics for Combustion Temperature and
Species, Gordon and Breach, Amsterdam, The Netherlands.
Fielding, J., Schaffer, A.M., and Long, M.B. (1998) Three-scalar imaging in tur-bulent nonpremixed flames of methane. Proc. Combust. Instit., 27, 1007–1014.
Ganz, B., Schmittel, P., Koch, R., Wittig, S., and Leuckel, W. (1998) Validation
of Numerical Methods at a Confined Turbulent Natural Gas Diffusion
Flame Considering Detailed Radiative Transfer. 43rd ASME International
Gas-Turbine & Aeroengine Congress & Exhibition, 2–5 June, Stockholm,
Paper 98-GT-228.
Gordon, S., and McBride, B.J. (1971) Computer Program for Calculation at Com-
plex Chemical Compositions, Rocket Performances, Incident and Reflected
Shocks and Chapman–Jouget Detonations. NASA SP-273, NTRIS N71-37775.Gru ¨ nefeld, G., Beushausen, V., Andresen, P., and Hentschel, W. (1994) Spatially
resolved Raman scattering for multi-species and temperature analysis in
technical applied combustion systems: Spray flame and four-cylinder in-line
engine. Appl. Phys. B, 58, 333–342.
Gupta, A.K., Lilley, D.G., and Syred, N. (1984) Swirl Flows, Abacus Press, Kent,
U.K.
Habisreuther, P., Schmittel, P., Idda, P., Eickhoff, H., and Lenze, B. (1997)
Experimentelle und numerische Untersuchungen an einer eingeschlossenen
Drall-Diffusionsflamme. Verbrennung und Feuerung, 18. Deutsch-Nieder-la ¨ ndischer Flammentag, VDI-Bericht 1313, 127–132.
Hedman, P.O., and Warren, D.L. (1995) Turbulent velocity and temperature
measurements from a gas-fueled technology combustor with a practical
injector. Combust. Flame, 100, 185–192.
Hinz, A. (2000) Numerische Simulation Turbulenter Methandiffusionsflammen
mittels Monte Carlo PDF Methoden. Ph.D. Dissertation, TU Darmstadt,
Fortschr.-Ber. VDI Reihe 6 Nr. 433, Du ¨ sseldorf: VDI-Verlag.
Holza ¨ pfel, F., Lenze, B., and Leuckel, W. (1996) Swirl-induced intermittency: A
novel effect modifying the turbulence structure of swirling free jets. Proc.Combust. Instit., 26, 187–194.
Kampmann, S., Seeger, T., and Leipertz, A. (1995) Simultaneous coherent anti-
Stokes Raman scattering and two-dimensional laser Rayleigh thermometry
in a contained technical combustor. Appl. Opt. 34, 2780–2786.
Keck, O. (2001) Untersuchungen zur Chemie-Turbulenz-Wechselwirkung an
eingeschlossenen verdrallten Erdgas=Luft-Diffusionsflammen. Ph.D. Dis-
sertation, Universita ¨ t Stuttgart, Stuttgart, Germany.
Kee, R.J., Grcar, J.F., Smooke, M.D., and Miller, J.A. (1993) A FORTRAN
Program for Modeling Steady Laminar One-Dimensional Premixed Flames.Sandia Report SAND85-8240 UC-401, Reprint 1993.
Landenfeld, T. (1999) Numerische Beschreibung turbulenter Methandiffusions-
flammen mit Schlieungsmodellen zweiter Ordnung und angenommenen
CONFINED SWIRLING NATURAL GAS=AIR FLAME 149
D o w n l o a d e d b y [ U n i v e r s i t y o f W e s t e r n M a c e d o n i a ] a t 1 7 : 1 6 2 3 O c t o b e r 2 0 1 1
Page 36
7/30/2019 713713067
http://slidepdf.com/reader/full/713713067 36/37
Wahrscheinlichkeits dichtefunktionen. Ph.D. Dissertation, TU Darmstadt,
Fortschr.-Ber. VDI Reihe 6 Nr. 422, Du ¨ sseldorf: VDI-Verlag.
Leuckel, W., and Fricker, N. (1976) The characteristics of swirl-stabilized naturalgas flames. Part I: Different flame types and their relation to flow and mixing
patterns. J. Inst. Fuel , 49, 103–112.
Lilley, D.G. (1977) Swirl flows in combustion: A Review. AIAA J., 15, 1063–1078.
Lucca-Negro, O., and Doherty, T.O. (2001) Vortex breakdown: A review. Prog.
Energy Combust. Sci., 27, 431–481.
Masri, A.R., Dibble, R.W., and Barlow, R.S. (1987) ‘Fluorescence’ interference
with Raman measurements in nonpremixed flames of methane. Combust.
Flame, 68, 109–119.
Masri, A.R., Dibble, R.W., and Barlow, R.S. (1996) The structure of turbulentnonpremixed flames revealed by Raman-Rayleigh-LIF measurements. Prog.
Energy Combust. Sci., 22, 307–362.
Mbiock, A., Roekaerts, D., and Barlow, R. (Eds.) (2000) Proceedings of the
5th International Workshop on Measurement and Computation of Turbu-
lent Non-premixed Flames, Section 3. http:==www.ca.sandia.gov=tdf =
5thWork-shop=TNF5_Proceedings.pdf (accessed June 2002).
Meier, W., and Keck, O. (2002) Laser Raman scattering in fuel-rich flames:
Background levels at different excitation wavelengths. Meas. Sci. Technol.,
13, 741–749.Meier, W., Keck, O., Noll, B., Kunz, O., and Stricker, W. (2000) Investigations in
the TECFLAM swirling diffusion flame: Laser Raman measurements and
CFD calculations. Appl. Phys. B, 71, 725–731.
Meier, W., Prucker, S., Cao, M.H., and Stricker, W. (1996) Characterization of
turbulent H2=N2=air jet diffusion flames by single-pulse spontaneous Raman
scattering. Combust. Sci. Tech., 118, 293–312.
Miller, J.H., Kee, R.J., Smooke, M.D., and Grcar, J.F. (1984) The Computation
of the Structure and Extinction Limit of a Methane–Air Stagnation Point
Diffusion Flame. Western State Section of the Combustion Institute, SpringMeeting, Paper WSS=CI 84–10.
Neuber, A., Krieger, G., Tacke, M., Hassel, E., and Janicka, J. (1998) Finite rate
chemistry and NO mole fraction in non premixed turbulent flames. Combust.
Flame, 113, 198–211.
Newbold, G.J.R., Nathan, G.J., Nobes, D.S., and Turns, S.R. (2000) Measure-
ment and prediction of NOx emissions from unconfined propane flames from
turbulent-jet, bluff-body, swirl, and precessing jet burners. Proc. Combust.
Instit., 28, 481–487.
Philipp, M., Hoffmann, S., Habisreuther, P., Lenze, B., and Eickhoff, H. (1992)Experimental and numerical study concerning stabilization of strongly swir-
ling premixed and nonpremixed flames. Proc. Combust. Instit., 24,
361–368.
150 O. KECK ET AL.
D o w n l o a d e d b y [ U n i v e r s i t y o f W e s t e r n M a c e d o n i a ] a t 1 7 : 1 6 2 3 O c t o b e r 2 0 1 1
Page 37
7/30/2019 713713067
http://slidepdf.com/reader/full/713713067 37/37
Pitz, R.W., and Drake, M.C. (1986) Intermittency and conditional averaging in a
turbulent nonpremixed flame by Raman scattering. AIAA J., 24, 815–822.
Prucker, S., Meier, W., and Stricker, W. (1994) A flat flame burner as calibrationsource for combustion research: Temperatures and species concentrations of
premixed H2=air flames, Rev. Sci. Instrum., 65, 2908–2911.
Rabenstein, F., and Leipertz, A. (1998) One-dimensional, time resolved Raman
measurements in a sooting flame made with 355-nm excitation. Appl. Opt.,
37, 4937–4943.
Schmittel, P. (2001) Untersuchungen zum Stabilisierungsmechanismus von ein-
geschlossenen turbulenten Flammen mit innerer Ru ¨ ckstro ¨ mzone. Ph.D.
Dissertation, TH Karlsruhe, Shaker-Verlag, Aachen.
Schmittel, P., Gu ¨ nther, B., Lenze, B., Leuckel, W., and Bockhorn, H. (2000)Turbulent swirling flames: Experimental investigation of the flow field and
formation of nitrogen oxide. Proc. Combust. Instit., 28, 303–309.
Schneider, C. (2000) Fachgebiet Energie- und Kraftwerkstechnik, Universita ¨ t
Darmstadt, Germany. Private communication.
Starner, S.H., Bilger, R.W., Dibble, R.W., and Barlow, R.S. (1990) Some
Raman=Rayleigh=LIF measurements in turbulent propane flames. Proc.
Combust. Instit., 23, 645–651.
Syred, N., and Bee ´ r, J.M. (1974) Combustion in swirling flows: A review. Com-
bust. Flame 23, 143–201.Tacke, M.M., Cheng, T.C., Hassel, E.P., and Janicka, J. (1996) Study of swirling
recirculating hydrogen diffusion flame using UV Raman spectroscopy. Proc.
Combust. Instit., 26, 169–175.
Takahashi, F., Vangsness, M.D., Durbin, M.D., and Schmoll, W.J. (1996)
Structure of turbulent hydrogen jet diffusion flames with or without swirl.
J. Heat Transfer, 118, 877–884.
Tangirala, V., Chen, R.H., and Driscoll, J.F. (1987) Effect of heat release and
swirl on the recirculation within swirl-stabilized flames. Combust. Sci. Tech.,
51, 75–95.TECFLAM. (1999) TECFLAM Swirl Burner Data Archive. Arbeitsgemeinschaft
Technische Flammen. http:==www.tu-darmstadt.de=fb=mb=ekt=tecflam (ac-
cessed June 2002).
Wehrmeyer, J.A., Cheng, T.-S., and Pitz, R.W. (1992) Raman scattering mea-
surements in flames using a tunable KrF excimer laser. Appl. Opt., 31, 1495–
1504.
Yeralan, S., Pal, S., and Santoro, R.J. (1997) Major Species and Temperature
Profiles of LOX =GH 2 Combustion. AIAA-97-2940.
Yeralan, S., Pal, S., and Santoro, R.J. (2001) Experimental study of major speciesand temperature profiles of liquid oxygen=gaseous hydrogen rocket com-
bustion. J. Propul. Power, 17, 788–793.
CONFINED SWIRLING NATURAL GAS=AIR FLAME 151
D o w n l o a d e d b y [ U n i v e r s i t y o f W e s t e r n M a c e d o n i a ] a t 1 7 : 1 6 2 3 O c t o b e r 2 0 1 1