7.2 Material Tests The material tests provide the basic materials data for conducting structural crack growth life and residual strength analyses. The tests are relatively simple to conduct compared to many of the tests in the other categories. Typically, a large number of material tests are conducted in the early part of the design phase so that the appropriate materials can be selected to meet design objectives. The materials selection process may concentrate on specific design criteria relative to requirements of cost, weight, strength, stiffness, fracture toughness, corrosion resistance, and crack growth resistance to fatigue loading. The damage tolerance materials tests discussed in this section must, of course, be supplemented by other tests, e.g. tensile tests, exfoliation tests, etc., in order to ensure that preliminary material trade studies result in the appropriate choices for the given application. Typically, before the final bill of materials for the structure is signed off, additional in-depth structural tests must be accomplished to verify initial material choices and to identify additional criteria not initially considered. Residual strength and crack growth life analyses are supported by a damage integration package that requires the definition of fracture toughness and crack growth rate properties for the materials being considered (See Section 2 for a discussion of the damage integration package). As indicated in Section 4 on Residual Strength and in Section 5 on Crack Growth, a material’s crack growth behavior is a function of a wide number of different factors such as anisotropy, environment, loading rate, processing variables, product form, thickness, etc. The damage integration package accounts for these effects by utilizing data collected from specimens (a) that are representative of the material variables of interest, (b) that contain cracks which grow in the appropriate direction, and (c) that are loaded in the manner representative of operational conditions. Standardization of test methodologies, data reduction and reporting procedures are to a large part responsible for the success of the current life prediction models. The predictive accuracy of any lifing model is only as good as the quality of the baseline crack growth and fracture data inputs. The American Society for Testing and Materials (ASTM) is the world leader in producing consensus testing standards to accurately identify materials behavior in general – and most important to the DTDH – have been the leader in developing procedures usable for damage tolerance applications. The ASTM Standards applicable to the DTDH are listed in Table 7.2.1 . The ASTM Book of Standards is published yearly to give all users of the test methods and analytical procedures the latest versions available. Within this section, whenever an ASTM Standard Test Method is referenced (i.e. ASTM E399), the ASTM Book of Standards for the current year should be consulted. 7.2.1
Transcript
7.2 Material Tests The material tests provide the basic materials data for conducting structural crack growth life and residual strength analyses. The tests are relatively simple to conduct compared to many of the tests in the other categories. Typically, a large number of material tests are conducted in the early part of the design phase so that the appropriate materials can be selected to meet design objectives. The materials selection process may concentrate on specific design criteria relative to requirements of cost, weight, strength, stiffness, fracture toughness, corrosion resistance, and crack growth resistance to fatigue loading. The damage tolerance materials tests discussed in this section must, of course, be supplemented by other tests, e.g. tensile tests, exfoliation tests, etc., in order to ensure that preliminary material trade studies result in the appropriate choices for the given application. Typically, before the final bill of materials for the structure is signed off, additional in-depth structural tests must be accomplished to verify initial material choices and to identify additional criteria not initially considered.
Residual strength and crack growth life analyses are supported by a damage integration package that requires the definition of fracture toughness and crack growth rate properties for the materials being considered (See Section 2 for a discussion of the damage integration package). As indicated in Section 4 on Residual Strength and in Section 5 on Crack Growth, a material’s crack growth behavior is a function of a wide number of different factors such as anisotropy, environment, loading rate, processing variables, product form, thickness, etc. The damage integration package accounts for these effects by utilizing data collected from specimens (a) that are representative of the material variables of interest, (b) that contain cracks which grow in the appropriate direction, and (c) that are loaded in the manner representative of operational conditions.
Standardization of test methodologies, data reduction and reporting procedures are to a large part responsible for the success of the current life prediction models. The predictive accuracy of any lifing model is only as good as the quality of the baseline crack growth and fracture data inputs. The American Society for Testing and Materials (ASTM) is the world leader in producing consensus testing standards to accurately identify materials behavior in general – and most important to the DTDH – have been the leader in developing procedures usable for damage tolerance applications. The ASTM Standards applicable to the DTDH are listed in Table 7.2.1.
The ASTM Book of Standards is published yearly to give all users of the test methods and analytical procedures the latest versions available. Within this section, whenever an ASTM Standard Test Method is referenced (i.e. ASTM E399), the ASTM Book of Standards for the current year should be consulted.
7.2.1
Table 7.2.1. ASTM Standards for Damage Tolerant Testing
Standard Title Specimens Results E399 Standard Test Method for Plane-Strain
Fracture Toughness of Metallic Materials C(T), SE(B), A(T),
DC(T), A(B) KIc
E561 Standard Practice for R-Curve Determination
M(T), C(T), C(W) KR
E647 Standard Test Method for Measurement of Fatigue Crack Growth Rates
M(T), C(T), ESE(T) da/dN vs ∆K
E740 Standard Practice for Fracture Testing with Surface-Crack Tension Specimens
SC(T) KIe
E812 Standard Test Method for Crack Strength of Slow-Bend Precracked Charpy Specimens
of High Strength Metallic Materials
Charpy σc
E1304 Standard Test Method for Plane-Strain (Chevron-Notch) Fracture Toughness of
Metallic Materials
Chevron-notch KIvJ, KIvM
E1457 Standard Test Method for Measurement of Creep Crack Growth Rates in Metals
C(T), da/dt
E1681 Standard Test Method for Determining a Threshold Stress Intensity Factor for
Environment-Assisted Cracking of Metallic Materials
MC(W), SE(B), C(T)
KIEAC, KEAC
E1820 Standard Test Method for Measurement of Fracture Toughness
SE(B), C(T), DC(T) KIc , JIc, CTOD
E1823 Standard Terminology Relating to Fatigue and Fracture Toughness
All NA
E1942 Standard Guide for Evaluating Data Acquisition Systems Used in Cyclic Fatigue
and Fracture Mechanics Testing
All NA
Each of the Standard Test Methods used for damage tolerance testing have a selection of test specimens that are preferred for each test. Figure 7.2.1 shows the most common types of specimens and includes the preferred specimen ratios of width/thickness (W/B) for each type. The thickness B is the dominant geometric consideration for determining if the specimen crack tip geometry is in a plane strain or a plane stress (or intermediate) condition. An asterisk denotes the most common W/B ratio for damage tolerance testing.
7.2.2
Figure 7.2.1. Specimens for Damage Tolerance Testing
7.2.3
Figure 7.2.1. Specimens for Damage Tolerance Testing (Continued)
7.2.4
As a result of the concerns about the effects of anistropy on material fracture toughness and crack growth resistance properties, standard nomenclature relative to directions of mechanical working (grain flow) has evolved. Figure 7.2.1 shows drawings of specimens which will be oriented in different directions relative to the product form. The orientation of the crack plane should be identified whenever possible in accordance with the systems shown in Figure 7.2.2.
For rectangular sections, the reference directions are identified in parts a and b of Figure 7.2.2 where an example of a rolled plate is used. The same system would be useful for sheet, extrusions, and forgings with non-symmetrical grain flow:
L – direction of principal deformation (maximum grain flow) T – direction of least deformation S – third orthogonal direction.
Figure 7.2.2. Crack Plane Orientation Code for Rectangular Sections and for Bar
and Hollow Cylinders [ASTM 2001]
7.2.5
When reporting crack orientation in rectangular sections, the two letter code, such as T-L in Figure 7.2.2a, is used when both the loading direction and direction of crack propagation are aligned with the axes of deformation.
For specimens tilted with respect to two of the reference axes (Figure 7.2.2b), a three-letter code, e.g. L-TS, is used. The designation used can be interpreted by considering the codes as a composite pair in which the first element in the pair designates the direction normal to the crack plane and the second element designates the expected direction of crack propagation. The code T-L for a cracked specimen indicates that the fracture plane has a stress application normal in the T direction (width direction of the plate) and the expected direction of propagation in the L direction (in the longitudinal direction of the plate), see Figure 7.2.2a. The code L-TS means that the crack plane is perpendicular to the L direction (principal deformation) and the expected crack direction is intermediate between T and S, see Figure 7.2.2b.
For cylindrical sections where the direction of principal deformation is parallel with the longitudinal axis of the cylinder, such as for drawn bar stock and for extrusions or forged parts having a circular cross section, the specimen reference directions are described in Figure 7.2.2c. The three directions used here are:
L – directional of maximum grain flow (axial) R – radial direction, and C – circumferential or tangential direction
Interpretation of the specimen designations relative to the location of the crack plane and crack path is similar to that employed for the rectangular sections.
In the remainder of this section, attention will be given to those tests which are utilized to collect data that support the material selection function and the damage integration package. The first of these subsections covers those tests which are used to establish the fracture toughness of materials. The other subsections cover tests utilized to collect sub-critical crack growth data.
7.2.1 Fracture Toughness Testing Methods Fracture toughness data have provided the basis for estimating the crack length-residual strength behavior of aerospace structures since the late fifties. Initial correlation tests for airplane skin-stringer type structures were typically conducted using wide, center crack panel tests of the skin material. It was soon realized that such tests were inappropriate for estimating the fracture behavior of thicker material/structure for a number of reasons. By the late sixties, ASTM had evolved a fracture toughness test for materials that fail by abrupt fracture. This test method eventually became the plane-strain fracture toughness (KIc) test standard, ASTM E399, in 1972.
Additional work by ASTM throughout the seventies resulted in several additional fracture toughness methods. One such method appropriate for tougher (or thinner) materials which fail by tearing fracture is ASTM Standard E561, which covers the development of the KR resistance curve. The KR resistance curve test has found wide acceptance in the aircraft industry since calculation procedures were already in place to utilize the data for residual strength estimates. Another recently-approved standard, ASTM E1820, covers the determination of fracture toughness using several methods. One such method applicable to materials which lack sufficient thickness for plane-strain fracture toughness (KIc) per ASTM E399 is the J-integral approach to determine the plane-strain toughness JIc.
7.2.6
7.2.1.1 Plane-Strain Fracture Toughness
The plane-strain fracture toughness (KIc) measures crack resistance to abrupt fracture under tri-tensile crack tip stress conditions where the constraint against crack tip deformation is maximized. As such, KIc data represent a lower bound on the fracture toughness that a material might experience under a wide range of cracking and geometric configurations. The ASTM E399 standard that covers plane-strain fracture toughness of metallic materials was developed to obtain values of fracture toughness using relatively thick specimens (thus maximizing the crack tip constraint) subjected to quasi-static loading conditions. The determination of KIc is also covered in the common fracture toughness method ASTM E1820.
A variety of specimen configurations are currently recommended for collecting KIc data, some of which are described in Figure 7.2.1. The compact tension [C(T)] and the single edge notched bend specimen [SE(B)] were initially the only specimens recommended for the measurements and most laboratories are well equipped to support these tests. The arc-shaped tension [A(T)], disk-shaped compact tension [DC(T)], and arc-shaped bend [A(B)] specimens have since been added as these configurations evolved to characterize the resistance of specific structural product forms, i.e. tube/pipe type structures and cylindrically shaped bar stock.
It should be noted that ASTM E399 uses linear elastic fracture mechanics as its basis for calculating fracture toughness. For this reason, specimen sizing requirements are predicated on maintaining a crack tip plastic zone size that is a small fraction of the planar dimensions of the specimen. The test method is also specific about ensuring that the thickness of a KIc specimen is substantially larger than the crack tip plastic zone size so that a crack tip tri-tensile stress state is established which maximizes the constraint on plastic deformation. Basically, the specimens are sized so that the dimensions of crack size (a), thickness (B), and remaining ligament size (W-a) are greater than the ratio of 2.5 (KIc/σys)2, i.e., so that
2
52
>−
ys
IcK.)aW(,B,aσ
(7.2.1)
where σys is the 0.2 percent offset yield strength and the KIc value meets all the test criteria.
The procedures for determining fracture toughness outlined in ASTM E1820 are essentially identical to E399 for samples sufficiently thick to provide valid KIc measurements. The plane-strain crack toughness test is unusual in that there can be no advanced assurance that the fracture toughness established by a given test will be a valid KIc value. The fracture toughness calculated after a given test must be validated through a series of criteria checks that are thoroughly described in E399 and E1820. The principle advantage of E1820 is that one can analyze the test information using different criteria to come up with valid toughness measurements if the thickness is too thin for valid KIc values.
Schematic load-displacement curves representative of the type of behavior exhibited during a test to determine the plane-strain fracture toughness are shown in Figure 7.2.3. The collection of such load-displacement data is a requirement of most ASTM fracture related standards. The objective of this test record is to establish the load, PQ, which will be used in the calculations of the test fracture toughness value (KQ), and the level of maximum test load (Pmax). The test fracture toughness (KQ) is a conditional result that must be validated through checking the size requirements before accepting KQ as a valid plane-strain fracture toughness (KIc) value. If KQ is
7.2.7
a non-valid test result according to ASTM E399, KQ should not be utilized as an estimate for KIc for design purposes since the value may be very non-conservative.
Figure 7.2.3. Principal Types of Load-Displacement Records [ASTM 2001]
7.2.1.2 R-Curve
The R-Curve measures crack resistance to tearing fracture for situations where the material thickness employed within a structure is below the requirement for plane-strain fracture toughness conditions. The R-curve describes the extent of crack movement from an initial starting condition as a function of the level of applied stress-intensity factor (K) and as such represents a complete history of quasi-static crack growth up until fracture occurs. It has been shown for several materials that the R-curve for a given thickness is independent of crack size and structural geometry [McCabe, 1973].
For the detailed reasons stated in Section 4 on Residual Strength, the R-curve is not as easily employed in design as abrupt fracture criteria. Early work on aerospace materials with thicknesses below that required for KIc was directed at obtaining the limits on the R-curve, i.e. on obtaining KONSET, associated with the K conditions at the start of crack movement, and Kc, associated with the K conditions at the moment of instability. After it was realized that the plane-stress fracture toughness (Kc) was a function of crack size and structural geometry as well as thickness, attention was focused on obtaining the complete history of the tearing fracture.
ASTM evolved a standard practice for determining the R-curve to accommodate the widespread need for this type of data. While the materials to which this standard practice can be applied are not restricted by strength, thickness or toughness, the test specimens utilized in tests must be of sufficient size to remain predominantly elastic throughout the duration of the test. The reason for the size requirement is to ensure the validity of the linear elastic fracture mechanics calculations. Specimens of standard proportions are required, but size is variable, to be adjusted for yield strength and toughness of the material considered.
7.2.8
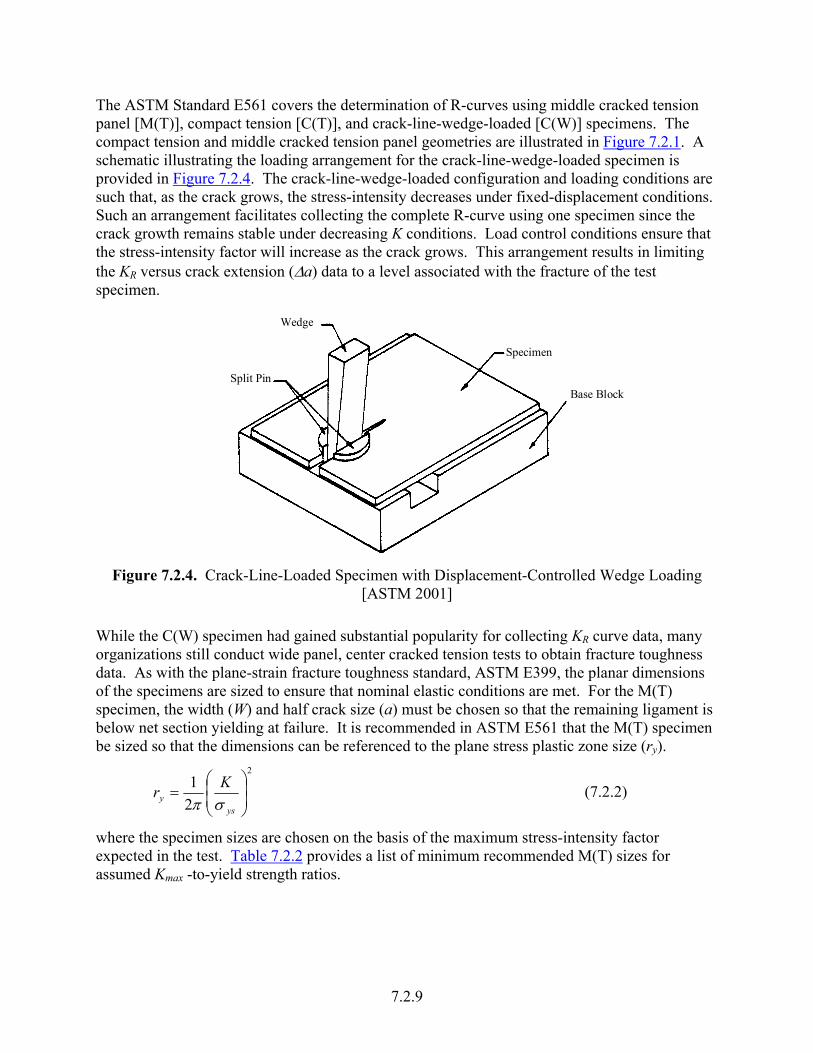
The ASTM Standard E561 covers the determination of R-curves using middle cracked tension panel [M(T)], compact tension [C(T)], and crack-line-wedge-loaded [C(W)] specimens. The compact tension and middle cracked tension panel geometries are illustrated in Figure 7.2.1. A schematic illustrating the loading arrangement for the crack-line-wedge-loaded specimen is provided in Figure 7.2.4. The crack-line-wedge-loaded configuration and loading conditions are such that, as the crack grows, the stress-intensity decreases under fixed-displacement conditions. Such an arrangement facilitates collecting the complete R-curve using one specimen since the crack growth remains stable under decreasing K conditions. Load control conditions ensure that the stress-intensity factor will increase as the crack grows. This arrangement results in limiting the KR versus crack extension (∆a) data to a level associated with the fracture of the test specimen.
Split Pin
Wedge
Specimen
Base Block
Figure 7.2.4. Crack-Line-Loaded Specimen with Displacement-Controlled Wedge Loading
[ASTM 2001]
While the C(W) specimen had gained substantial popularity for collecting KR curve data, many organizations still conduct wide panel, center cracked tension tests to obtain fracture toughness data. As with the plane-strain fracture toughness standard, ASTM E399, the planar dimensions of the specimens are sized to ensure that nominal elastic conditions are met. For the M(T) specimen, the width (W) and half crack size (a) must be chosen so that the remaining ligament is below net section yielding at failure. It is recommended in ASTM E561 that the M(T) specimen be sized so that the dimensions can be referenced to the plane stress plastic zone size (ry).
2
21
=
ysy
Krσπ
(7.2.2)
where the specimen sizes are chosen on the basis of the maximum stress-intensity factor expected in the test. Table 7.2.2 provides a list of minimum recommended M(T) sizes for assumed Kmax -to-yield strength ratios.
0.5 3.0 1.0 9 1.0 6.0 2.0 18 1.5 12.0 4.0 36 2.0 20.0 6.7 30* 3.0 48.0 16.0 72* * Panels wider than 12 in. will require multiple pin grips and the
length requirement is relaxed to 1.5W
It should be noted that the initial crack length is sized to be W/3 to minimize the potential for net section yielding prior to a stress-intensity factor controlled fracture. Based on data collected from a number of aluminum panels with different widths, it appears that there is a tendency for the calculated fracture toughness Kc to increase with increasing panel width, as shown in Table 7.2.3. While it is difficult to generalize the observation based on these results to all materials, such data indicates that it is possible to develop conservative predictions of the plane-stress fracture toughness by using sub-size specimens.
7.2.10
Table 7.2.3. Room Temperature Plane-Stress Fracture Toughness Values for Several Aluminum Alloys Presented as a Function of Thickness and Width
20.0* 77.9 96.7 16/12+ *Width requirements meet ASTM E 561 requirements. +First number represents number of Kapp calculations, the second represents Kc [ASTM 2001]
Another test condition important to consider during R-curve (or plane-stress fracture toughness) testing is the amount of buckling restraint that should be built into the test fixtures. Most tests are conducted either with no buckling restraint or with extensive fixturing that tends to maintain inplane loading by preventing buckling. With tests conducted with limited buckling restraint, the
7.2.11
spurious stress distributions created when buckling occurs (at the specimen edges or in the crack tip region) can lead to mechanical driving factors that either enhance or degrade the calculated levels of applied stress-intensity factor. The ASTM E561 method places restrictions on the amount of buckling exhibited during the R-curve test.
The data collected during an R-curve test includes load and crack size readings. The stress-intensity factor associated with a given increment of crack size, i.e. KR, is calculated using the stress-intensity factor formula for the specimen, the applied force (P), and a plasticity enhanced crack size. The plasticity enhanced crack length is referred to as the effective crack (aeff) and is calculated by adding the plane stress plastic zone radius (ry), per Equation 7.2.2, to the current physical crack, i.e.
yeff raaa ++= ∆0 (7.2.3)
where ao is the initial crack length and ∆a is the increment of crack movement.
Visual and non-visual methods of measuring crack size are available for collecting the data. Within ASTM E561, the details associated with making crack length measurements based on compliance (force-displacement) methods are fully described. In fact, for those situations where extensive crack tip plasticity can occur, the compliance methods are recommended since these methods yield an estimate of crack length that already accounts for a plasticity correction.
ASTM E561 recommends that the R-curve be presented using an effective crack increment (∆aeff = ∆a + ry) so that the instability predictions can be directly made from the plots. Thus, the R-curve is a plot of KR = K(aeff, P) versus ∆aeff. The test engineer must describe how ∆aeff and aeff were calculated so that structural engineers using the data have a full report of the behavior.
7.2.1.3 Crack Initiation J-Integral
The JIc can be used as a toughness value at the initiation of crack tearing from a sharp fatigue crack in metallic materials. This toughness value can serve as a basis for screening tough materials or for evaluating materials utilized in sub-KIc thicknesses. Requirements for a valid JIc value according to ASTM E1820 are based on the ratio of the JIc to yield strength, i.e.,
>
ys
QJb,B
σ250 (7.2.4)
where B is thickness and b0 is the initial ligament. The relationship between the J-integral and the stress-intensity factor was given in Section 11 as,
'EKJ
2
= (7.2.5)
where E′ = E, the elastic modulus, for plane stress, and E′ = E/(1-ν2) for plane strain, and ν = Poisson’s ratio. Thus, using Equations 7.2.5 evaluated at the critical condition (J = JIc, K = KJIc) and Equation 7.2.4, the thickness requirement becomes after some algebra
2
25
>
ys
JIc'ys K
EB
σσ
(7.2.6)
7.2.12
For the typical condition where the ratio of yield strength to elastic modulus (σys/E) is below 0.1, JIc values can be obtained using specimens thinner than that required by the KIc standard (ASTM E399).
The KJIc value in Equation 7.2.6, however, does not normally correspond to the KIc value that would be obtained using the plane-strain fracture toughness standard. The KJic value based on JIc measurements is typically lower and thus leads to conservative estimates of the ASTM E399 KIc value. The differences in KJIc and KIc arise as a result of differences in the amount of allowable physical crack growth associated with the two standards; there is less growth allowed for the JIc value than for the KIc value.
While the use of a toughness standard for sub-KIc thickness specimens provides additional opportunities for characterizing material resistance to fracture, the JIc concept appears somewhat limited relative to the design of aerospace structures. A single test of a JIc type specimen might be similar in cost to a KIc type test; but a number of JIc type specimens must be tested to develop the required crack resistance data prior to estimating the JIc value. Through unloading compliance testing, it is possible to reduce the number of tests.
7.2.2 Sub-Critical Crack Growth Testing Methods Since the early sixties, sub-critical crack growth data have provided the basis for estimating the crack growth behavior of structural components under service conditions. In the initial stages of damage tolerant design methodology and test development, the effects of stress ratio, environment and load sequencing were poorly understood. Thus, the initial damage integration packages did not account for these effects; furthermore, testing capability was for the most part limited to constant amplitude or to block loading. By the early seventies, understanding and capability had progressed to the point where evaluation of each major damage producing element in the service history could then be modeled by damage integration packages.
The ASTM Committee E08 on Fatigue and Fracture Testing also played an important part in developing standards for collecting data which could be used to support damage integration packages. Throughout the seventies, inter-laboratory testing programs were conducted which further refined the testing conditions that could be standardized by consensus. The AF Materials Laboratory funded development of a standard test method to ensure a stable methodology for information used in aircraft damage tolerance assessments [Hudak, et al., 1978]. In 1978, ASTM issued the first standard based on these developments, ASTM E647, on fatigue crack growth rate (da/dN) testing. Additional standards or additions to existing standards such as ASTM E1681 on environmentally assisted cracking testing (KIEAC), on corrosion fatigue, on automated methods and on threshold testing have and continue to evolve. Methods for non-visual crack size monitoring such as compliance and electric-potential have been developed over the last 15 years and incorporated into nearly all of the fracture related standards.
7.2.2.1 Fatigue Crack Growth Rate Testing
Fatigue crack growth rate data that support standard damage integration packages of the type described in Sections 5.1 and 5.2 are based on constant amplitude testing of cracked specimens. Typically, multiple specimen tests are conducted at a number of fixed stress ratio (R) conditions so that the complete range of crack growth rate is covered for the mechanical and environmental variations of interest. For the most part, all tests of this type are covered by ASTM E647 on fatigue crack growth rate testing.
7.2.13
Test conditions that deal with the conditions essential for obtaining near threshold growth rates are further described by ASTM E647. Substantial care is necessary for correctly controlling the precracking operation and the stress-intensity-factor control conditions in the near threshold region of the fatigue crack growth rate curve (da/dN vs ∆K) [Yoder, et al., 1981; Wei & Novak, 1982]. Also, ASTM E647 must be supplemented with information relative to control of environmental conditions when these conditions affect behavior.
The ASTM E647 describes the test, as well as the data collection, reduction and reporting requirements. The test itself requires standard fatigue test capability and utilizes precracked specimens which have widely accepted stress-intensity factor solutions. The standard currently recommends three specimen configurations, the middle-cracked tension [M(T)], the compact tension [C(T)], and the eccentrically-loaded single edge tension [ESE(T)] specimen geometries, which are shown in Figure 7.2.1. While the M(T) specimen is generally recommended for all stress ratio conditions, it should be noted that the C(T) and the ESE(T) specimens can only be used for positive stress ratio conditions.
The primary control exercised during a test is the control of the fatigue forces that are being applied to the test sample. Most modern servocontrolled, electrohydraulic test machines that are periodically recalibrated using force cells traceable to the National Institute of Standards and Technology (NIST) will result in force control well within the ASTM E647 requirements. Force cells, of course, should be selected such that fatigue crack growth rate tests are being conducted using forces that are at the higher end of the load cell range to maximize force accuracy. Specific care should be taken to minimize force errors. Such errors can cause major errors in reported crack growth rate data since stress-intensity factor (K) is a linear function of force.
Fatigue crack growth rate data are derived from the crack length data (discrete pairs of crack length and cycle count data) and test load data. Significant errors in crack growth rate behavior can also result if systematic errors in crack length measurement occur since such errors directly affect the calculated stress-intensity factor parameters. ASTM E647 places strict requirements on the measurement of crack size and recommends a frequency of crack length measurement based on the gradient (rate of change) of the stress-intensity factor through the crack length interval in the given test specimen.
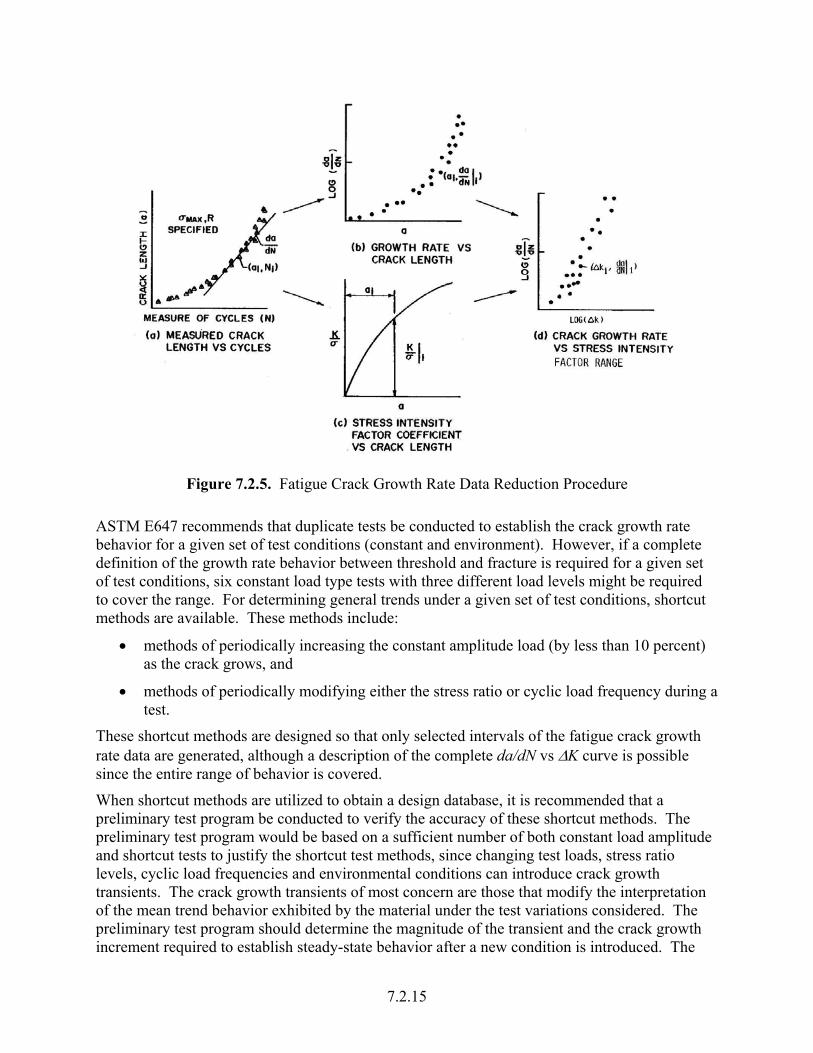
Figure 7.2.5 shows a schematic that illustrates the data reduction of a single test’s crack length data to the fatigue crack growth rate format. The procedures that one uses to differentiate the crack length data have some effect on the individual da/dN vs ∆K discrete data points. To ensure some uniformity in this part of the data reduction process, ASTM E647 recommends that either the secant or the 7-point incremental polynomial methods be utilized. In fact, the standard includes a listing of a FORTRAN computer program that can be utilized to reduce the crack length data according to the 7-point incremental polynomial method. Other differentiation methods leading to the same data trends for a given test include 5, 7, 9 point incremental, linear, quadratic, and power law least squares fitting schemes and the three-point average incremental slope method utilized by MIL-HDBK-5. The specific differences that result from differentiating a set of crack length data using different methods are primarily associated with point-to-point data scatter in the a vs N data. Discussion of the impact of this scatter on design was covered in Section 5.1.
7.2.14
Figure 7.2.5. Fatigue Crack Growth Rate Data Reduction Procedure
ASTM E647 recommends that duplicate tests be conducted to establish the crack growth rate behavior for a given set of test conditions (constant and environment). However, if a complete definition of the growth rate behavior between threshold and fracture is required for a given set of test conditions, six constant load type tests with three different load levels might be required to cover the range. For determining general trends under a given set of test conditions, shortcut methods are available. These methods include:
• methods of periodically increasing the constant amplitude load (by less than 10 percent) as the crack grows, and
• methods of periodically modifying either the stress ratio or cyclic load frequency during a test.
These shortcut methods are designed so that only selected intervals of the fatigue crack growth rate data are generated, although a description of the complete da/dN vs ∆K curve is possible since the entire range of behavior is covered.
When shortcut methods are utilized to obtain a design database, it is recommended that a preliminary test program be conducted to verify the accuracy of these shortcut methods. The preliminary test program would be based on a sufficient number of both constant load amplitude and shortcut tests to justify the shortcut test methods, since changing test loads, stress ratio levels, cyclic load frequencies and environmental conditions can introduce crack growth transients. The crack growth transients of most concern are those that modify the interpretation of the mean trend behavior exhibited by the material under the test variations considered. The preliminary test program should determine the magnitude of the transient and the crack growth increment required to establish steady-state behavior after a new condition is introduced. The
7.2.15
approving agency should review the results of the preliminary test program relative to the impact of transient behavior and to the development of data reduction methods that exclude those intervals of crack length where transient behavior might be exhibited.
7.2.2.2 Stress Corrosion Cracking
Stress corrosion or environmentally-assisted cracking data which support standard damage integration schemes, as well as materials evaluation and selection studies, are based on either constant load or constant displacement type tests of fatigue cracked specimens placed in simulated service environments. There are two types of stress corrosion cracking data properties measured by such tests:
1) the threshold property (KIEAC), which is the level of the stress-intensity factor associated with no cracking in the given environment, and
2) the crack growth rate resistance property (da/dt as a function of the static stress-intensity factor K).
ASTM E1681 covers determination of stress corrosion threshold. Figure 7.2.1 describes the three types of test specimen configurations utilized in the ASTM standard:
• a bolt-loaded, compact [MC(W)] specimen,
• a constant load single-edge specimen [SE(B)], and
• a compact tension specimen [C(T)].
As can be noted from the figure, the bolt-loaded MC(W) specimen is a self-loading specimen. The force loaded SE(B) and C(T) specimens must be placed in a test figure that supports the specimen while under load, which is typically applied using weights attached to one end of the specimen. (Note that ASTM E1681 does not describe da/dt testing, but does mention da/dt information may be obtained on such tests.)
As with other sub-critical crack growth resistance tests, the materials test engineer must pay particular attention to the pre-cracking, loading, and crack size measurement details. In addition, because the environment has a more important influence on the crack growth resistance of many materials, specific controls must be instituted here also.
Crack growth tests conducted in aqueous or similar deleterious environments lead to difficult crack length measurement problems since typically the direct use of visual techniques is restricted to conditions whereby the specimen is removed from the environment. Use of visual techniques under these conditions is acceptable if it can be shown that removing the specimen from the environment introduces no major crack growth transient effects. Collecting crack length data using electric potential difference (EPD) methodology and the relationships between crack size and potential voltage difference has gained credibility in recent years as a means of automating the measurement of crack size in both SE(B) and C(T) specimens. Since stress-corrosion cracking tests are conducted over longer periods of time (~ 10,000 hours) than other mechanical tests, stability of the crack size measurement system must be given a great deal of attention.
Differences of opinion exist between the experts relative to the use of either the increasing (constant load) or decreasing (constant displacement) stress-intensity factor (K) type specimens for collecting threshold stress corrosion cracking data. These differences result from the
7.2.16
influences of test conditions and of crack growth transients. Since the objective of the KIEAC test is to obtain a threshold level of K associated with a preset growth rate limit, a series of tests should be conducted which would minimize these effects.
The KIEAC results obtained using constant load specimens are influenced somewhat by the fact that the test time includes both the time associated with initiating the crack movement from the sharp precrack and that associated with subsequent propagation. For KIEAC data collection programs using increasing K specimens, a number of tests should be conducted such that the precracked specimens are loaded above and below the level of the expected stress-intensity factor condition associated with zero crack movement. Subsequently, each unbroken specimen should be broken open and examined for evidence of crack movement during the test period. In all cases, the KIEAC value is lower than the lowest value of the stress-intensity factor associated with the broken specimens. If no stress-corrosion cracking movement is observed when the unbroken specimens are examined, the KIEAC is taken as the highest stress-intensity factor level associated with the unbroken specimen group. When stress-corrosion cracking movement is observed in the unbroken specimen group, the amount of crack movement should be divided by the test time in order to ascertain if the average growth rate associated with any test is below that required to obtain the KIEAC value. The highest level of stress-intensity factor that yields an average growth rate below that required is taken as the KIEAC value.
The KIEAC results obtained using the bolt-loaded (K-decreasing type) specimen can be influenced by crack growth transients that occur after loading. (For additional information see the discussion in ASTM E1681 on stress relaxation influences in Section 5.1.7) For KIEAC data collection programs using decreasing K specimens, a number of tests should be conducted such that the precracked specimens are loaded to levels that are slightly above (10 to 25 percent) the level of expected KIEAC. High initial stress-intensity factor levels (relative to KIEAC) result in a number of problems in determining KIEAC accurately. These problems sometimes result from the fact that once the precrack starts to move it has a longer distance to travel before arresting as a result of the high initial K condition and the slowly decaying K gradient associated with the bolt-loaded conditions. Another problem associated with high initial K conditions is that cracks will sometimes initiate and arrest prematurely due to crack blunting (under first loading) and crack front tunneling. In the decreasing K specimen, as soon as crack movement occurs from the precrack, the crack front loses the sharpness of a fatigue crack; this sometimes results in a value of KIEAC that is somewhat above that measured in the increasing K specimen.
Some of the problems in estimating KIEAC using either constant-load (increasing K) and bolt-loaded (decreasing K) specimens are alleviated when crack growth measurements are continuously made throughout the test. Specifically, measurement of the first crack movement that occurs in constant-load specimens provide a better time basis for estimating the crack growth rate from unbroken specimens. Even periodic measurement of the crack length in the bolt-loaded C(T) specimens will increase the test engineer’s confidence that transient or abnormal crack growth behavior has not occurred during the test. Crack growth rate data used for sensing a material’s resistance to environmental attack is collected and reduced in a manner similar to fatigue crack growth rate data. The principal difference in an environmental attack testing program is that the loads or displacements are held constant during the test. KIEAC is used primarily for ranking materials for sub-critical crack growth resistance in environments. Because fatigue testing is conducted extensively in similar environments during the design of airframe structures, a high level of interest continues in combining the time dependent rate
7.2.17
7.2.18
information with the cyclic dependent data into a common predictive model. It is therefore suggested that when such tests are necessary to support damage integration packages, that stress-corrosion cracking rate tests follow the basic guidelines of the fatigue crack growth rate tests in ASTM E647.