Phase Separation of Wheat Flour Dough Studied by Ultracentrifugationand Stress Relaxation. I. Influence of Water Content
HELENA LARSSON' and ANN-CHARLOTTE ELIASSON1'2
ABSTRACT Cereal Chem. 73(1):18-24
Separation of starch and gluten into two aqueous phases is an impor- unseparated dough was found at the bottom of the test-tube. At lowtant aspect of wheat flour dough development. The fact that starch can water contents no separation was observed. The influence of dougheasily be washed from dough, leaving behind a gluten gel, illustrates the water content on the stress-relaxation modulus was considerable at waterphase separation of dough very well. To study this phase separation, contents where no separation took place. For doughs prepared with in-dough was subjected to high centrifugal forces of 100,000 X g. The creasing water contents, where separation occurred, the modulus wastendency of starch and gluten to separate into two phases is reported for less affected. This was interpreted as being the region where glutensix wheat cultivars at water contents ranging from 38 to 50%. At high development was complete. Separation properties varied for cultivars ofwater contents, a separation of the dough into liquid, gel, gluten, and wheat. Three cultivars with the same relative amounts of separatedstarch phases was observed. When the water content was reduced, phases produced roughly the same stress-relaxation modulus.
Wheat flour dough has been described as being bicontinuous,i.e., consisting of two continuous aqueous phases (Eliasson andLarsson 1993). The two aqueous phases in developed dough,described as phase-separated, are the water-swelled protein phase(gluten) and the liquid phase (containing dispersed starch gran-ules and solubles) (Eliasson and Larsson 1993). The fact thatstarch can easily be removed from a wheat flour dough by wash-ing leaving behind a gluten gel, illustrates the phase separation ofdough very well.
The importance of the liquid phase in wheat flour dough waspointed out by MacRitchie (1976). Submitting the dough to ultra-centrifugation resulted in separation into a liquid phase and asolid phase. Conductivity measurements showed that the liquidphase in dough was continuous and not dispersed. The watercontents of the separated phases were 86.0% (liquid phase) and34.5% (solid phase). A summary of the composition of doughliquors, including other studies, is given in MacRitchie (1986).
Attempts have been made through rheological investigations torelate the dynamic modulus to the gluten and starch componentsof wheat flour dough (Hibberd 1970b, Smith et al 1970, Navickiset al 1982). In other studies, the modulus was related to the loafvolume of baked bread (He and Hoseney 1991, Mani et al 1992).The liquid phase of bicontinuous dough is interesting from aTheological point of view, as the rheological behavior at smalldeformations is determined by the properties of the two aqueousphases. In this study, the phase separation of wheat flour dough isillustrated by the phases obtained after separation by ultracen-trifugation. Our objective was to relate this separation behavior torheological measurements at small deformations, i.e., stressrelaxation. The influence of water content was studied for sixwheat flours.
MATERIAL AND METHODS
MaterialSix wheat flours of different origin and with different baking
performance were selected for this study. The protein (Kjeldahl,N x 5.7), starch (Aman et al 1994), ash (650'C, 16 hr), and dam-
IUniversity of Lund, Dept. of Food Technology, Box 124, S-221 00 Lund, Sweden.2Corresponding author. Fax: 46-46-10-95-17.
aged starch (method 76-30A, AACC 1983) contents are given inTable I. The baking performance of the flours was obtainedaccording to Olered (1979) and is given in Table II. Wheat floursincluded in the study were: Kosack and Sport (Swedish winterand spring wheat, respectively); Rouquin (a spelt [dinkel] wheat);wheat cv. Prairie; a feed wheat; and Prego (a triticale). The flourswere all milled in a Quadrumat Senior Mill to extraction rates of59-69% (Svaldf Weibull AB, Svalbv, Sweden).
Dough MixingWheat flour doughs were mixed in a 10-g farinograph bowl.
Flour (10 g) was mixed with distilled water to give doughs withwater contents of 38-50% by dough weight. The investigatedwater contents differed by cultivar, depending on where in thewater interval the doughs were convenient to handle. At least sixdoughs with different water contents were prepared from eachflour to study the influence of water content on the Theologicalbehavior and separation properties. Mixing was done at 30'C, 60rpm. Mixing time was fixed to 5 min because an optimal mixingtime was hard to determine with the 10 g mixing bowl, particu-larly at low water contents. To estimate the farinograph waterabsorption using the 10-g mixing bowl, the mixing resistance wascalibrated against the mixing resistance resulting from mixing inthe 300-g mixing bowl. Method 54-21 (AACC 1983) was used.Estimated farinograph water absorptions are given in Table II.
Dough RheologyThe Theological behavior of the doughs was studied using a
Bohlin VOR rheometer (Metric Analys, Stockholm, Sweden) inthe stress-relaxation mode. Tests were performed with cone andplate geometry (diameter 30 mm, cone angle 5.40). Measurementswere made at 250C, with an initial equilibrium time of 600 secbetween the application of the sample and the imposition of thestrain (0.006). The strain rise time was 0.1 sec. To prevent waterloss, dough surfaces exposed to air were covered with siliconeoil. The initial value of the stress-relaxation modulus (Go) andtwo relaxation times (t0 .5 and to.) were chosen to characterize therheological behavior. Relaxation times were taken as the timeswhere G was reduced to 50 and 10% of Go, respectively. Thestress was allowed to relax during at least 1,000 sec. The waterdependence of the modulus was fitted to power-law relationships(R > 0.99). The relaxation times were fitted either to second order(R > 0.98) or linear relationships (R > 0.68). As the measurementswere performed in a range of water contents, and only a few
measurements were performed at the same water content, adeviation given by replicates can not be calculated. The repro-ducibility of the stress-relaxation parameters studied is in generalwithin 10% for flour-water doughs (Larsson and Eliasson 1996).
Ultracentrifugation of DoughDoughs with the same water contents as those used in the
stress-relaxation measurements were centrifuged for 1 hr at100,000 x g in an MSE superspeed 65 centrifuge (MSE Ltd.,Manor Royal, Crawley, Sussex, England). The dough sample (=5 g)was placed in a test tube with a diameter of 8.5 mm and a heightof 71 mm. The volume fraction of the separated phases wasestimated by measuring the height in the test tube with a slidecaliper. Larsson and Eliasson (1996) determined the volumefraction of the separated phases with an accuracy of ±6%, exceptfor some of the unseparated fractions and the smallest liquidphases, which deviated up to 15%. To determine the water con-tent, the separated phases were dried for 1 hr at 130'C. Dryingthe samples for an extra 30 min did not reduce the water contentfurther. The water content of the separated phases was obtainedwith an accuracy of ±1.5 % for triplicates (Larsson and Eliasson1996). In the present study, the same reproducibility was obtainedfor Sport and Prego, run in duplicate. For the other cultivars, foursingle samples in the range of water contents were studied.
RESULTS AND DISCUSSION
Chemical Composition and Baking PerformanceThe chemical compositions of the flours are listed in Table I.
The flours cover a wide range of protein contents from 8.8 to16.7%. Baking performance (Table II) was related to the proteincontent of the flour. A high-damaged starch content was obtainedfor Prairie wheat, indicating a hard endosperm. In contrast, thespelt wheat, Rouquin had a low-damaged starch content.
Farinograph MeasurementsFarinograph water absorptions are listed in Table II. The lowest
water addition was required for Rouquin and Prego. Prairie andSport required the highest amounts of water. According to Tippleset al (1978), the water absorption of a wheat flour can be attrib-uted to the amount of damaged starch, as well as the protein con-
TABLE IIBaking Performance and Water Absorption of Flours
Farinograph EstimatedBaking Water Water Contentab
Performance Absorptiona
Kosack Medium 45.3 43.5Sport Good 47.1 45.3Prairie Medium 47.5 46.5Feed Poor 44.4 43.7Rouquin Medium 43.3 43.2Prego Poor 43.6 42.7
a % By dough weight.b At the intersection of the two linear parts in Figure Sa.
tent. Consequently, the high-damaged starch content in Prairiewould explain its high water absorption. For Sport, the high waterabsorption is probably the result of high protein content.
UltracentrifugationThe phase separation of gluten and starch was studied by cen-
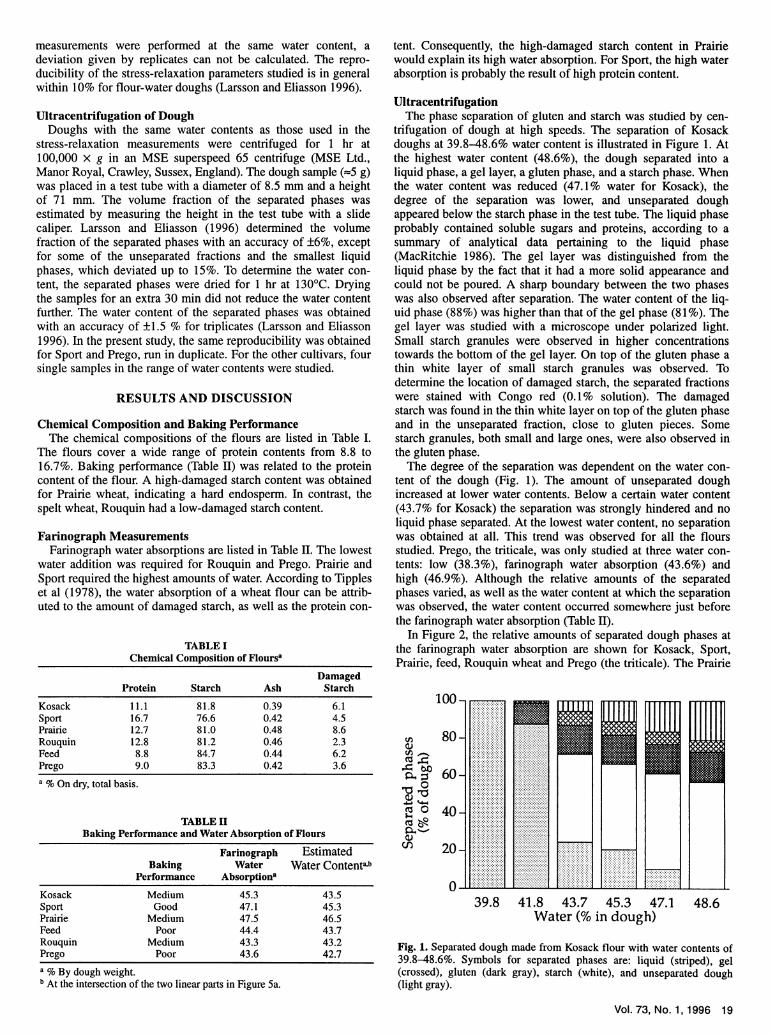
trifugation of dough at high speeds. The separation of Kosackdoughs at 39.8-48.6% water content is illustrated in Figure 1. Atthe highest water content (48.6%), the dough separated into aliquid phase, a gel layer, a gluten phase, and a starch phase. Whenthe water content was reduced (47.1 % water for Kosack), thedegree of the separation was lower, and unseparated doughappeared below the starch phase in the test tube. The liquid phaseprobably contained soluble sugars and proteins, according to asummary of analytical data pertaining to the liquid phase(MacRitchie 1986). The gel layer was distinguished from theliquid phase by the fact that it had a more solid appearance andcould not be poured. A sharp boundary between the two phaseswas also observed after separation. The water content of the liq-uid phase (88%) was higher than that of the gel phase (81 %). Thegel layer was studied with a microscope under polarized light.Small starch granules were observed in higher concentrationstowards the bottom of the gel layer. On top of the gluten phase athin white layer of small starch granules was observed. Todetermine the location of damaged starch, the separated fractionswere stained with Congo red (0.1% solution). The damagedstarch was found in the thin white layer on top of the gluten phaseand in the unseparated fraction, close to gluten pieces. Somestarch granules, both small and large ones, were also observed inthe gluten phase.
The degree of the separation was dependent on the water con-tent of the dough (Fig. 1). The amount of unseparated doughincreased at lower water contents. Below a certain water content(43.7% for Kosack) the separation was strongly hindered and noliquid phase separated. At the lowest water content, no separationwas obtained at all. This trend was observed for all the floursstudied. Prego, the triticale, was only studied at three water con-tents: low (38.3%), farinograph water absorption (43.6%) andhigh (46.9%). Although the relative amounts of the separatedphases varied, as well as the water content at which the separationwas observed, the water content occurred somewhere just beforethe farinograph water absorption (Table II).
In Figure 2, the relative amounts of separated dough phases atthe farinograph water absorption are shown for Kosack, Sport,Prairie, feed, Rouquin wheat and Prego (the triticale). The Prairie
A. O A s A .. A.. . 0 ... .. ;..s .Water (%in dough
48.6
Fig. 1. Separated dough made from Kosack flour with water contents of39.8-48.6%. Symbols for separated phases are: liquid (striped), gel(crossed), gluten (dark gray), starch (white), and unseparated dough(light gray).
Vol. 73, No. 1, 1996 19
wheat differed from the other cultivars, in that complete separa-tion of starch and gluten was obtained at the farinograph waterabsorption. Rouquin and Sport on the other hand, showed littletendency to separate, with the largest volume fraction of unsepa-rated dough observed. A lower degree of separation was alsoindicated for Sport by diffuse boundaries between the separatedphases, and the gluten and starch phases appearing less separatedfrom each other at any water content investigated. The most dis-tinct boundaries were obtained for the triticale, feed and Prairiewheats. Kosack separated almost as well as the latter cultivars.Larsson and Eliasson (1996) showed that the separation wasimpaired when the polar lipid lecithin was added to the dough.
1001 I1iliTI
X 80-
v o 60-0
°40
V 20-
0-1 6
Fig. 2. Separated dough at the farinograph water absorption for Kosack(1), Sport (2), Prairie (3), feed wheat (4), Rouquin (5), and Prego (6).Symbols as in Fig. 1.
35-1
30-
25 -
20
15-
10
5-
b
20-
15-
10-
5-
0- C L.. . . ., .. . .A .. ....
38 40 42 44 46 48 50 52Water (% in dough)
Fig. 3. Amount of separated gluten (a) and liquid (b) phase as a functionof dough water content. Swedish winter wheat, Kosack (0); Swedishspring wheat, Sport (A); Prairie (K); feed wheat (+); spelt wheat, Rou-quin(O); and triticale, Prego (x).
These results imply the possibility that the lower degree of sepa-ration observed for Sport doughs was caused by a high content ofnative polar lipids. On the other hand, based on the good phaseseparation for the Prairie and the feed wheats and Prego (the triti-cale) one might speculate that their amount of polar lipids waslower. For the feed wheat, the separation of a thin oil film wasobserved on the top of the liquid phase. The largest volume frac-tion of gluten phase observed for the Sport dough was consistentwith its high protein content (Table I). The gluten phase recov-ered from Rouquin dough was remarkably small in relation to itsprotein content (Table I). Apart from a considerable gluten phase,a large amount of gel phase was observed for Sport. The investi-gation of the phases by microscopy, showed that a large amountof damaged starch was present towards the bottom of the gelphase. However, the large amount of gel phase could not be corre-lated with a high amount of damaged starch, as the damagedstarch was low for Sport (Table I). The separated liquid phase wassmall for Sport, which may be due to the high protein content ofSport flour (Table I). No liquid phase at all was observed forPrego (the triticale), instead a large amount of gel phase wasfound. The sum of protein, starch, and ash in Table I is lower forPrego, which indicates a higher content of some component(s)not analyzed. A higher content of total pentosans has beenreported for triticales compared with wheat (Bushuk and Larter1980, Saini and Henry 1989). It seems reasonable that pentosanscontribute to the large amount of gel phase observed for Prego inthe present study. The fact that no liquid phase was observed,even at the highest water content investigated, implies that thesecond aqueous phase of Prego consists only of the gel and starchphases.
According to Figure 1, the gluten phase of Kosack developedbefore any liquid phase separated out. The amounts of gluten andliquid phases which separated out in the water range studied, areshown for all flours in Figure 3a and b. The lowest dough watercontent required to produce a gluten or liquid phase may be esti-mated by extrapolation of the amount of the separated phases.The highest dough water contents, where no phase separated out,are included in Figure 3a and b. Comparing these two figuresshows a separation of a gluten phase before a liquid phase forSport. This was also most likely the result for Prairie. No liquidphase at all was obtained for Prego. For these four cultivars, theamount of water required for the separation of a liquid phaseseemed to be higher than the amount required for the glutenphase to separate. This indicates that the properties of developedgluten induce the phase separation in accordance with an earlierdiscussion of the phase separation (Eliasson and Larsson 1993).The different separation properties of the gluten and the liquidphases may also be studied in Figure 3a and b. When the watercontent of the doughs was increased, the amount of liquid phaseincreased significantly, while the gluten phase increasedmoderately. This increase leveled off to various degrees. In somecases, the amount of gluten remained fairly constant at higherwater contents. This behavior indicates that gluten is only able toswell to a certain degree and is not capable of incorporating morewater at higher water contents. Instead, excess water wasrecovered in the liquid phase (Fig. 3b). However, a slight increasein the amount of separated gluten phase was observed when thedough water content was increased. The degree of the increasevaried by cultivar and was greatest for Sport and Prairie. Thisincrease appears to indicate further gluten swelling, but this wasruled out by determination of the water content of the separatedphases. Less unseparated dough was obtained for Kosack as thewater content was increased (Fig. 1), which showed thatadditional gluten was released from the unseparated fraction. Thiswas also the case for the other cultivars. As expected, theseparation of gluten and starch was favored by higher doughwater contents.
In a study by MacRitchie (1976), dough was separated by
20 CEREAL CHEMISTRY
(I)
'00
bo-4
cu0U
04
(TI
ou)
o4
0 0
I
ultracentrifugation at 100,000 x g. No liquid phase was observedat a dough water content of 34.5%. This water content was con-sistent with the appearance of a second continuous aqueous phasein dough, as indicated by conductivity measurements. Resultsfrom the present investigation differ from those of MacRitchie ina number of ways. An improved separation of the solid phase intostarch and gluten phases was maintained in the present study. Theliquid phase was also observed first at higher water contents (41-46%, Fig. 3b). Despite the difference in these results, the unsepa-rated fraction in the present investigation contained approxi-mately the same amount of water (33.5-35.5%) as the solid phaseand the dough where no liquid phase separated in the study byMacRitchie. The reason for the divergence of the results is notclear, however, the improved separation in the present investiga-tion may be due to the fact that longer test tubes were used. Themixing procedure also differed between the two studies. In thework of MacRitchie the doughs were mixed to peak consistencyin a mixograph (46% water), while in the present investigation thedoughs were mixed 5 min in a farinograph. The separation maybe improved by a longer mixing time (Larsson and Eliasson1996).
The water contents of the separated phases (total weight basis)are given for the flours studied in Figure 4a-f. The gel layer con-tained z80% water, the gluten phase 50-55%, and the starchphase =30%. The unseparated dough observed below the starchphase contained 33.5-35.5% water (results not shown). The watercontents of the gluten and the gel phases of the triticale, weresomewhat higher than those of the other flours. Although theamount of developed gluten increased moderately at higherdough water contents (Fig. 3a), the amount of water associatedwith the separated gluten phase was almost independent of thewater content of the doughs (Fig. 4a,c-f). The observation that anincrease in dough water content did not increase the water contentof gluten is in agreement with the findings of Willhoft (1973).Neither was the water content of the separated gel and starchphases affected by the water content of the dough. This was truefor all the cultivars, except for Sport, where the amount of waterassociated with the separated gel and gluten phases increasedwhen the dough water content increased (Fig. 4b). Comparedwith the other cultivars, a higher water content of both the gellayer and the gluten phase was observed for the separated Sportdoughs. The findings for Sport seemed to be explained by thelower tendency of the dough to separate. The diffuse boundarylines of Sport were not observed for any of the other cultivars. ForSport, an improved degree of separation was observed at higher
water contents; first as a larger amount of water in the gel phase,second, as an increase in the water content of the gluten phase,concomitant with less starch in the gluten phase; and third, adecrease in the water content of the starch phase, i.e., less glutenwas recovered in the starch phase.
The distribution of water in dough has been estimated fromwater absorption measurements of the different components(Bushuk 1966). It was found that the total amount of waterassociated with starch, protein, and pentosans was 45.5, 31.2, and23.4%, respectively. For the phase separation properties, thisimplies that the whole liquid phase is occupied by starch andpentosans so there is no free water. The water distribution indough may also be evaluated from the phases separated by ultra-centrifugation. These values can be obtained if the approximationthat the density of the separated phase is equal to the density ofdough is accepted. Calculated for the Kosack dough containing45.3% water (Fig. 2), the fractions of the total amount of water,associated with the phases obtained were: 16% (unseparated),30% (starch), 19% (gluten), 13% (gel), and 22% (liquid phase).Considering the large differences for cultivars in the amount ofseparated gluten phase, the amount of water in the separatedphases of the different cultivars would also vary. At farinographwater absorption, the amount of water associated with the glutenphase of the cultivars was: 12% (Rouquin), 13% (feed wheat),17% (Prego), 19% (Kosack), 22% (Prairie), and 34% (Sport). Itcan be concluded that the high protein content of Sport gave thelargest amount of water associated with the gluten phase. On theother hand, Rouquin, with a rather large amount of unseparateddough and a protein content similar to that of the Prairie (Table I),exhibited a small amount of water associated with the glutenphase, i.e., a small amount of separated gluten phase (Fig. 2).Consequently, the fraction of the available water in dough thatwas incorporated into the gluten phase was strongly dependent oncultivar.
Stress-Relaxation ModulusFigure Sa shows the relationship between stress-relaxation
modulus (Go) and dough water content for the flours. G( wasstrongly dependent on water content; the modulus decreased withincreased water content. The strong dependence of the dynamicmodulus on water content is well established (Hibberd 1970a,Smith et al 1970, Hibberd and Parker 1975, Navickis et al 1982,Abdelrahman and Spies 1986, Dreese et al 1988). In this study,flours from six wheat cultivars with water contents of 38-50%(by dough weight) were investigated. All the flours, except the
.-I
-~ A
0o 2
w mA-Atv (
Water (% in dough) Water (% in dough) 44 46 4t,Water (% in dough)Fig. 4. Water content of gel (0), gluten (-), and starch (A) phases. a-f, Kosack, Sport, Prairie, feed wheat, Rouquin, and Prego, respectively.
3 0 .. .. .. . .. . .. .. .. . . ........ .. .. .. . .. .. . . . . . .. . . ... .. . .. . ... . .2 ., . . .X6 -4i - A!'''''''t-----------20. 4 42 46- ' ' At) z s A t Z A 1% A A ., I _i
s0-zlr_ �yv w 42
Prairie, exhibited approximately the same modulus at a givenwater content (Fig. 5a). The differences between cultivars weregreatest at lower water contents. At higher water contents, a pla-teau where Go was less dependent of water content was observedfor all cultivars. The water content at which the plateau starteddiffered for the cultivars. For Prairie, the value was 47%, whereas,for the other flours, it was 44-45%. The farinograph waterabsorption (Table II) was found at approximately the same watercontent as the onset of the plateau in the Go versus water contentplot (Fig. 5a). This was observed for all cultivars except Sport,where the water content corresponding to the farinograph waterabsorption was on the plateau at 47.1%. This elevated water ab-sorption may be due to the high protein content of Sport. Ingeneral, the plateau (where Go is less dependent on water content)may be considered as the range of water contents where glutenswelling was complete and the two continuous aqueous phasesare developed. This was confirmed by the fact that the phase sepa-ration occurred in the same range of water contents (Fig. 3a and b).
The stress-relaxation modulus can be related to gluten strength
100-
(Z
0
C-
1-
en
CD
42 44 46Water (% in dough)
Fig. 5. Influence of dough water content on a, stress-relaxation modulus(Go); b and c, stress-relaxation times (t. 5 and to.,, respectively). Symbolsas in Fig. 3.
22 CEREAL CHEMISTRY
and amount, the amount of liquid phase (fraction of starch in theliquid phase), and the amount of unseparated dough. We con-cluded that no simple comparison between cultivars could beundertaken as both the amounts and the properties of the sepa-rated phases differed between cultivars. However, some observa-tions can be made.
When values of Go were compared at the highest water con-tents, which was expected to relate to the greatest influence ofgluten on Go, the highest moduli were observed for Prego (8.8kPa), Prairie (7.1 kPa), and Sport (6.6 ± 0.5 kPa). With a repro-ducibility of 10%, it seems possible to distinguish between thesehigher values and the lower ones obtained for Rouquin (4.1 kPa),feed wheat (3.5 ± 0.3 kPa), and Kosack (3.0 ± 0.3 kPa).Approximately the same amount of each dough phase separatedfor Rouquin, feed wheat, and Kosack. Figure 3a and b shows theseparated gluten and liquid phases. The same amount of all theseparated phases for Rouquin, feed wheat, and Kosack correlateswell with the small difference in modulus obtained on the plateau.For Prego, Prairie, and Sport, different reasons for the highmodulus may be distinguished. Prairie was expected to have astronger gluten than the Swedish cultivars. Sport, the Swedishspring wheat, with a high protein content (Table I), had a smallliquid phase densely packed with starch. On the other hand, thegluten phase was large and the amount of starch low. The greatestinfluence on the stress-relaxation modulus of Sport was probablydue to the lower tendency to separate. The behavior of Sportseemed to agree well with the fact that starch cannot be consid-ered as an inert filler (Hibberd 1970b, Smith et al 1970). In thecase of Prego (triticale), the high value of Go (8.8 kPa) wasattributed to the lack of a liquid phase, causing reduced flowproperties to the second aqueous phase of the dough.
The phase separation characteristics of doughs made of differ-ent types of flours are affected by the varying amounts of gluten,starch, or gel phase in the system. The amount of liquid phaseseemed to play an important role in the determination of theeffect on the modulus at small deformations. For example, whengluten was added to the system (at constant water content), as inthe study by Smith et al (1970), a reduction in the amount ofseparated liquid phase was observed, due to the high waterabsorption of gluten. Depending on the original amount of theliquid phase, the increase in modulus can vary from one cultivarto another. On the other hand, when the water content wasincreased at different protein-to-starch ratios, as in the study byHibberd (1970b), the fraction of starch in the liquid phasedecreased at a constant protein-to-starch ratio. This is consistentwith a reduced volume fraction of starch in the liquid phase and,hence, a decrease in the modulus. The modulus was less affectedby the protein-to-starch ratio at lower water contents. At increas-ing water contents, the protein-to-starch ratio became more andmore important because of the amount of liquid phase present inthe phase-separated system.
Relaxation TimesThe stress-relaxation of dough can be separated into two flow
processes (Bohlin and Carlsson 1981). The first relaxation proc-ess is strongly cooperative and occurs at shorter times (0.1-10 sec),whereas the second process is weakly cooperative and takes placeat longer times (10-10,000 sec). In this study, the stress-relaxation times, tO.5 and to.,, were chosen to represent the twoflow processes. The first relaxation process was characterized bythe short relaxation time (t0 .5), the time when half of Go hadrelaxed. When the second relaxation process started, Go wasreduced to 20-30 % of its initial value. This indicates that to., (thetime when 10% of Go remained) took place during the secondrelaxation process. The second relaxation process has beenrelated to the continuous gluten phase in dough (Carlsson 1981).
The dependence of the relaxation of the first flow process, rep-resented by tO.5 on water content, is shown in Figure Sb. Two dif-
ferent types of relationship were observed, depending on thewheat cultivar. In one type, the relaxation time was only slightlyinfluenced by water content (Kosack, Sport, and Prairie). The tO5for Prairie was high. The relaxation time of the feed wheat, Rou-quin, and Prego appeared to be sensitive to water content, particu-larly at low water contents. The influence of water content onthese cultivars was reminiscent of the effect on Go.
The largest differences between cultivars for the influence ofwater content were observed for the long relaxation time, to., (Fig.5c). A faster relaxation of the second flow process (lower to.,) wasfound for Kosack, Sport, and the feed wheat at increasing watercontents. The reduction in to., may be interpreted as a dilution ofthe second flow process or possibly a decrease in the amount ofthe unseparated fraction at higher water contents, which was pro-nounced for the feed wheat and only moderate for Sport, Rou-quin, and Prego. The most conspicuous behavior was observedfor Prairie, with an increasing to., at increasing water contents.This unexpected behavior prompted a study on the influence ofmixing time at the farinograph water absorption on Prairiedoughs. Even after 20 min of mixing, there was no significantinfluence on to., (results not shown). When Kosack and Sportwere mixed for 20 min, an increase in to., was observed for bothcultivars (Larsson and Eliasson 1996). The different effects ofprolonged mixing on to., indicates that the Prairie gluten wasstronger than that of the other cultivars. One explanation of theeffect of water content on to., may be related to the influence ofstarch on the second relaxation process at lower water contents.Below the farinograph water absorption (47.5% water), the datareproduced very well, while at higher water contents large scatter-ing was observed (Fig. Sc). The separation of starch and glutenwas already complete at the farinograph water absorption (Fig. 2).At the highest water contents a spontaneous separation (lumpydough) was observed. These inhomogeneities of the samples mayexplain the large scattering of Prairie data in Figure Sc. For Rou-quin (the spelt wheat) and Prego (the triticale), the relaxationtimes of the second flow processes were not affected by the watercontent in the interval studied.
Relationship Between Phase Separation and Stress-RelaxationBehavior
Considering dough as bicontinuous with two interpenetratingaqueous phases (Eliasson and Larsson 1993), the liquid phaseserves as the medium in which starch and solubles (the gel phase)are located. To correlate the phase separation properties with thestress-relaxation measurements, the modulus was plotted as afunction of the amount of separated liquid phase for the five cul-tivars (Fig. 6). As soon as phase separation had taken place, a
linear relationship between the modulus and the liquid phase wasobserved for all cultivars. The linear relationship in Figure 6seemed to indicate that starch suspended in the liquid phase con-ferred viscoelasticity to the dough, also at the highest water con-tents studied. This may either be caused by the dilution of thesecond aqueous phase or originate in the presumed washing effectof the liquid phase, i.e., reducing the starch content of gluten. Thelatter suggestion is consistent with the behavior of Kosack (Fig. 1)as a decreasing amount of unseparated dough was observed atincreasing dough water contents. Prairie deviated slightly fromthe linear relationship and was only linear at the three highestwater contents corresponding to the plateau in Fig. Sa, wherecomplete separation was obtained.
In the water content range studied, it is tempting to divide thedependence of Go into two regions. In the first region (at lowerwater contents), Go was strongly dependent on the water contentand no separation occurred when the dough was submitted toultracentrifugation. In the second region, at higher water contents,separation had taken place, and the modulus was less dependenton the water content. If these two regions are approximated tolinear, the intersection of them seems to coincide with the area ofwater contents where the second aqueous phase appeared. Thewater content here was estimated at =43-44% for Kosack, thefeed wheat, Rouquin, and Prego, and =46% for Sport and Prairie(Table II). This estimated water content also seems to be relatedto the farinograph water absorption (Table II).
It may be expected that the influence of starch on the stress-relaxation modulus would be almost eliminated at a certain ratioof starch-to-liquid phase. To further evaluate the effect on thestress-relaxation modulus of the amount of starch in the liquidphase, the modulus was plotted as a function of the total starchcontent (Table I) divided by the amount of separated liquid phase(Fig. 7). This involved the assumption that all the starch was sus-pended in the liquid phase, i.e., no unseparated fraction. This wastrue for Prairie at the farinograph water absorption and forKosack, the feed wheat, and Rouquin only at the highest watercontents investigated. A complete separation of gluten and starchwas not observed for Sport. Figure 7 shows that when the stress-relaxation modulus approached 0, the ratio of starch to theamount of liquid phase was =2. Figure 6 shows that the influenceof the liquid phase on the stress-relaxation modulus decreasedlinearly in the water range studied where separation occurred.Figure 7 shows that the amount (volume) of liquid phase neededto reduce the influence of the aqueous starch phase on the stress-relaxation modulus must be more than half the amount (weight)of starch present in flour. At such high water contents, the dough
1-1(z
r-
0
u
40
35
30
25
20 -
15
10
5:
n-
40
35 -
30 :
25-
20:
15 -
10 :
5 :
m
(U
UCD
U - ..I I I I I I lI I I i f I I I I . . . . . . . . . . . . . . .
I I . r I , I I I I ,I I, I I I I I I I, I . .. I
0 5 10 15 20 25Liquid phase (% of dough)
Fig. 6. Stress-relaxation modulus (Go) as a function of amount of sepa-rated liquid phase. Symbols as in Fig. 3.
0 5 10 15 20 25 30Starch/separated liquid phase
35 40
Fig. 7. Stress-relaxation modulus (Go) as a function of starch content indough (weight %) divided by the amount of separated liquid phase(volume %). Symbols as in Fig. 3.
was judged to be impossible to handle, perhaps because the liquidphase was present in amounts large enough to enable noninteract-ing starch to spontaneously leave the dough.
CONCLUSIONS
The bicontinuous aqueous phases in wheat flour dough werecharacterized. Phase separation occurred at high water contentswhere gluten was fully developed. Because of the glutendevelopment, the remaining water was able to form a secondaqueous phase with starch. This caused a greater influence of thegluten phase on the stress-relaxation modulus at higher watercontents. In the water content range studied, where separationoccurred and a dough of acceptable handling properties could beprepared, starch or the amount of starch relative to the dilutingsystem still influenced the modulus slightly. No phase separationoccurred at low water contents. A high stress-relaxation moduluswas caused by the highly concentrated suspension resulting at lowerwater concentrations where gluten development was limited.
ACKNOWLEDGMENTS
Financial support was obtained from the Cerealia Foundation R&Dand the SL Foundation.
LITERATURE CITED
AMERICAN ASSOCIATION OF CEREAL CHEMISTS. 1983.Approved Methods of the AACC, 8th ed. Method 54-21; Method 76-30A. The Association: St. Paul, MN.
ABDELRAHMAN, A., and SPIES, R. 1986. Dynamic rheological stud-ies of dough systems. Pages 87-103 in: Fundamentals of DoughRheology. H. Faridi and J. M. Faubion, eds. Am. Assoc. CerealChem.: St. Paul, MN.
AMAN, P, WESTERLUND, E., and THEANDER, 0. 1994. Determina-tion of starch using a thermostable a-amylase. Pages 111-115 in:Methods in Carbohydrate Chemistry. Vol. 10. J. N. BeMiller, D. J.Manners, and R. J. Sturgeon, eds. John Wiley and Sons: New York.
BOHLIN, L., and CARLSSON, T. L.-G. 1981. Shear stress-relaxation ofwheat flour dough and gluten. Colloid Surface 2:59-69.
BUSHUK, W. 1966. Distribution of water in dough and bread. Baker'sDig. 40(5):38-40.
BUSHUK, W., and LARTER, E. N. 1980. Triticale: Production, chemis-try, and technology. Pages 115-157 in: Advances in Cereal Scienceand Technology, Vol. 3. Y. Pomeranz, ed. Am. Assoc. Cereal Chem.:St. Paul, MN.
CARLSSON, T. L.-G. 1981. Law and order in wheat flour dough: Col-loidal aspects of the wheat flour dough and its lipid and protein con-
stituents in aqueous media. PhD thesis. Lujnd University: Sweden.DREESE, P. C., FAUBION, J. M., and HOSENEY, R. C. 1988. Dynamic
rheological properties of flour, gluten, and gluten-starch doughs. II.Effect of various processing and ingredient changes. Cereal Chem.65:354-359.
ELIASSON, A.-C., and LARSSON, K. 1993. Cereals in breadmaking: Amolecular colloidal approach. Marcel Dekker: New York.
HE, H., and HOSENEY, R. C. 1991. Differences in gas retention, proteinsolubility, and rheological properties between flours of different bak-ing quality. Cereal Chem. 68:526-530.
HIBBERD, G. E. 1970a. Dynamic viscoelastic behavior of wheat flourdoughs. II. Effects of water content in the linear region. Rheol. Acta9:497-500.
HIBBERD, G. E. 1970b. Dynamic viscoelastic behavior of wheat flourdoughs. III. The influence of the starch granules. Rheol. Acta 9:501-505.
HIBBERD, G. E., and PARKER, N. S. 1975. Dynamic viscoelasticbehavior of wheat flour doughs. IV. Non-linear behavior. Rheol. Acta14:151-157.
LARSSON, H., and ELIASSON, A.-C. 1996. Phase separation of wheatflour dough studied by ultracentrifugation and stress-relaxation. II.Influence of mixing time, ascorbic acid and lipids. Cereal Chem.73:25-31.
MacRITCHIE, F. 1976. The liquid phase of dough and its role in baking.Cereal Chem. 53:318-326.
MacRITCHIE, F. 1986. Physicochemical processes in mixing. Pages132-146 in: Chemistry and Physics of Baking. J. M. V. Blanshard, P.J. Frazier, and T. Galliard, ed. R. Soc. Chem.: London.
MANI, K., ELIASSON, A.-C., LINDAHL, L., and TRAGARDH, C.1992. Rheological properties and breadmaking quality of wheat flourdoughs made with different dough mixers. Cereal Chem. 69:222-225.
NAVICKIS, L. L., ANDERSON, R. A., BAGLEY, E. B., and JASBERG,B. K. 1982. Viscoelastic properties of wheat flour doughs: Variationof dynamic moduli with water and protein content. J. Texture Stud.13:249-264.
OLERED, R. 1979. Inverkan an glutentillsats pa baknings egenskapernahos vete. Sveriges Utsades f5renings Tidskrift 89.
SAINI, H. S., and HENRY, R. J. 1989. Fractionation and evaluation oftriticale pentosans: Comparison with wheat and rye. Cereal Chem.66:11-14.
SMITH, J. R., SMITH, T. L., and TSCHOEGL, N. W. 1970. Rheologicalproperties of wheat flour doughs. III. Dynamic shear modulus and itsdependence on amplitude, frequency, and dough composition. Rheol.Acta 9:239-252.
TIPPLES, K. H., MEREDITH, J. O., and HOLAS, J. 1978. Factorsaffecting farinograph and baking absorption. II. Relative influence offlour components. Cereal Chem. 55:652-660.
WILLHOFT, E. M. A. 1973. Recent developments on the bread stalingproblem. Baker's Dig. 47(6):14-20.
[Received May 10, 1995. Accepted September 12, 1995.]