96

Corporate Headquarters7401 West Wilson AvenueChicago, Illinois 60706Phone: (708) 867-6777Fax: (708) 867-3288
www.methode.com
Methode Cover 7/23/09 10:16 AM Page 1

C O M PA N Y P R O F I L E
Methode Electronics, Inc. (NYSE: MEI) is a global d esigner and manufacturer
of electro-mechanical devices with manufacturing, design and testing
facilities in the United States, Malta, Mexico, the United Kingdom,
Germany, the Czech Republic, China, Singapore, the Philippines and India.
We design, manufacture and market devices employing electrical, electronic,
wireless, radio remote control, sensing and optical technologies to control
and convey signals through sensors, interconnections and controls.
Our business is managed on a segment basis, with those segments being
Automotive, Interconnect, Power Products and Other. Our components are
in the primary end markets of the automobile, computer, information
processing and networking equipment, voice and data communication
systems, consumer electronics, appliances, aerospace vehicles and
industrial equipment industries.
Further information can be found at Methode’s Web site www.methode.com.
Methode is. . . possibilities.
U N I T E D S TA T E SAutomotive Electronic ControlsManufacturing Plant111 West Buchanan StreetCarthage, IL 62321James L. KendrickPlant Manager
Automotive Electronic ControlsSales and Engineering Office24585 Evergreen RoadSouthfield, MI 48075Theodore P. KillVice President, WorldwideAutomotive Sales
Automotive Safety Technologies, Inc.
111 West Buchanan StreetCarthage, IL 62321Timothy R. GlandonVice President and GeneralManager, North AmericanAutomotive Operations
Cableco Technologies, Inc.1750 Junction Avenue, Suite 150San Jose, CA 95112Arthur H. BronkGeneral Manager
Printed on Recycled Paper.
I N T E R N AT I O N A LHetronic Asia Manufacturing & Trading Corp.
Laguna Technopark 121 East Main Avenue L4, P5 Binan, Laguna PhilippinesHans JohnPresident
Hetronic Malta Mosta Technopark Factory 15B Mosta, Malta MST 3000 MaltaSimon GrimaPresident
Methode Electronics International GmbH
Rhein Strasse 4855435 Gau-AlgesheimGermanyJoseph E. KhouryVice President European Automotive
Methode Electronics U.K., Ltd.Design OfficePrestige Park Active Way Burnley, Lancashire BB11 1BSEnglandRussell L. SchoonoverEuropean Program Director
M A N A G E M E N T O F B U S I N E S S U N I T S S H A R E H O L D E R I N F O R M AT I O N
Connectivity Technologies, Inc.1111 Digital DriveRichardson, TX 75081Timothy A. HazzardPresident
dataMate Products7401 West Wilson AvenueChicago, IL 60706Albert C. ChiappettaGeneral Manager
Hetronic International, Inc. 3000 NW 149th Street Oklahoma City, OK 73134 Torsten RempePresident & CEO
Hetronic USA, Inc. 4300 Highline Boulevard Building A Oklahoma City, OK 73108 Torsten RempePresident
Magna-lastic Devices, Inc.7401 West Wilson AvenueChicago, IL 60706LeVern J. HooverGeneral Manager
Methode Mexico, S.A. de C.V.Calle Spectrum #200 Suite “D”Parque Industrial Finsa-MonterreyApodaca, Nuevo Leon, C.P. 66600Mexico Ezequiel Acevedo PeredaPlant Manager
Methode Electronics Far East Pte Ltd.
60 Alexandra Terrace#02-09A The ComtechSingapore 118502Ken WongRegional Sales Manager for Asia
Methode Electronics India Private Limited
Raj Driva, 99/A 3rd Floor, 5th BlockKHB Colony, KoramangalaBangalore, India 560095Anil ShettyGeneral Manager
Methode Electronics Ireland, Ltd.Crossagalla Business Park, Unit HBallysimon RoadLimerick, IrelandJohn A. LyonsSales Manager
Methode Electronics Malta Ltd.Mriehel Industrial EstateMriehel QRM09MaltaJoseph E. KhouryVice President European Automotive
Transfer Agent and RegistrarContinental Stock Transfer & Trust Co.17 Battery Place8th FloorNew York, NY 10004212-509-4000Toll-Free 800-509-5586 www.continentalstock.com
Corporate CounselLocke Lord Bissell & Liddell LLP111 South Wacker DriveChicago, IL 60606
Independent AuditorsErnst & Young LLP233 South Wacker DriveChicago, IL 60606
Corporate HeadquartersMethode Electronics, Inc.7401 West Wilson AvenueChicago, IL 60706708-867-6777Toll-Free 877-316-7700www.methode.com
Annual MeetingThe Annual Meeting ofShareholders will be held at 11:00 A.M. on September 17, 2009 at: Methode Electronics, Inc.7401 West Wilson AvenueChicago, IL 60706
MarketThe shares are traded on the New York Stock Exchangeunder the symbol MEI.
Methode Development Company7401 West Wilson AvenueChicago, IL 60706Albert C. ChiappettaGeneral Manager
Network Bus ProductsValue Engineered Products1700 Hicks RoadRolling Meadows, IL 60008 Thomas D. ReynoldsActing General Manager
TouchSensor Technologies, LLC203 North Gables BoulevardWheaton, IL 60187Robert B. CampbellGeneral Manager
Trace Laboratories Inc.1150 West Euclid AvenuePalatine, IL 60067Kevin MehaffeyGeneral Managerand5 North Park DriveHunt Valley, MD 21030Gaylon D. MorrisGeneral Manager
Methode Electronics (Shanghai) Co. Ltd.
Interconnect OperationsNo. 40B (T40B-7) No. 1765 Jin Qiao Export Processing ZonePudong Shanghai 201206People’s Republic of ChinaShang ZhengGeneral Manager
Methode Electronics (Shanghai) Co., Ltd.
211 Qin Qiao RoadBuilding T71-5 EastJin Qiao Export Processing ZonePudong Shanghai 201206People’s Republic of ChinaAutomotive OperationsShang ZhengGeneral ManagerPower ProductsJay SeelanGeneral Manager
Optokon Co., Ltd.Cerveny Kriz 250586 02 Jihlava Czech RepublicJiri SteflManaging Director
Universal Resources de Mexico, S.A. de C.V.
Carr. Riberena Km 10.5Maquilpark C.D. ReynosaTamaulipas, MexicoMichael S. BrothertonPlant Manager
Methode Cover 7/23/09 10:16 AM Page 3
METHODE ELECTRONICS ANNUAL REPORT 2009 1
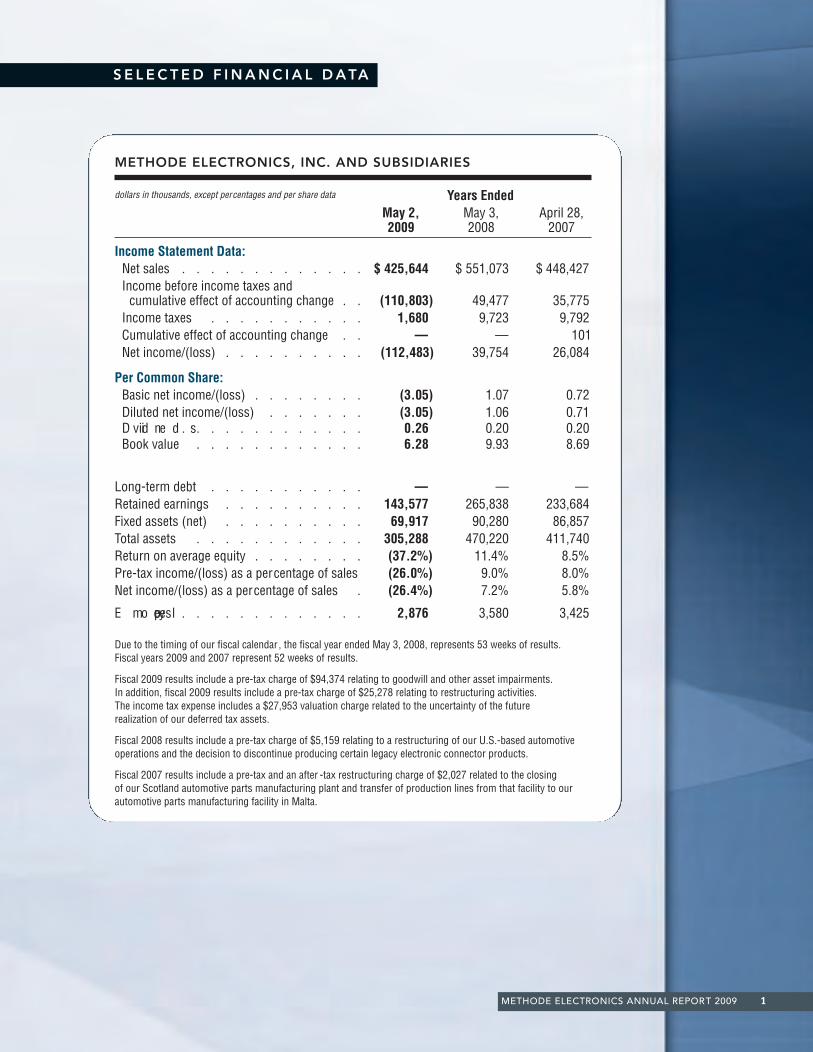
METHODE ELECTRONICS, INC. AND SUBSIDIARIES
dollars in thousands, except percentages and per share data Years Ended May 2, May 3, April 28,2009 2008 2007
Income Statement Data:Net sales . . . . . . . . . . . . . $ 425,644 $ 551,073 $ 448,427Income before income taxes and
cumulative effect of accounting change . . (110,803) 49,477 35,775Income taxes . . . . . . . . . . . 1,680 9,723 9,792Cumulative effect of accounting change . . — — 101Net income/(loss) . . . . . . . . . . (112,483) 39,754 26,084
Per Common Share:Basic net income/(loss) . . . . . . . . (3.05) 1.07 0.72Diluted net income/(loss) . . . . . . . (3.05) 1.06 0.71D ivid en d s. . . . . . . . . . . . . 0.26 0.20 0.20Book value . . . . . . . . . . . . 6.28 9.93 8.69
Long-term debt . . . . . . . . . . . — — —Retained earnings . . . . . . . . . . 143,577 265,838 233,684Fixed assets (net) . . . . . . . . . . 69,917 90,280 86,857Total assets . . . . . . . . . . . . 305,288 470,220 411,740Return on average equity . . . . . . . . (37.2%) 11.4% 8.5%Pre-tax income/(loss) as a percentage of sales (26.0%) 9.0% 8.0%Net income/(loss) as a percentage of sales . (26.4%) 7.2% 5.8%
E m p lo yees . . . . . . . . . . . . . 2,876 3,580 3,425
Due to the timing of our fiscal calendar , the fiscal year ended May 3, 2008, represents 53 weeks of results. Fiscal years 2009 and 2007 represent 52 weeks of results.
Fiscal 2009 results include a pre-tax charge of $94,374 relating to goodwill and other asset impairments. In addition, fiscal 2009 results include a pre-tax charge of $25,278 relating to restructuring activities. The income tax expense includes a $27,953 valuation charge related to the uncertainty of the future realization of our deferred tax assets.
Fiscal 2008 results include a pre-tax charge of $5,159 relating to a restructuring of our U.S.-based automotiveoperations and the decision to discontinue producing certain legacy electronic connector products.
Fiscal 2007 results include a pre-tax and an after -tax restructuring charge of $2,027 related to the closing of our Scotland automotive parts manufacturing plant and transfer of production lines from that facility to ourautomotive parts manufacturing facility in Malta.
S E L E C T E D F I N A N C I A L D ATA
Methode Body 7/23/09 10:28 AM Page 1

Without question, Fiscal 2009 was a challenging year for the world’s economy and,consequently for our company. The increasingly difficult economic situation, and moresignificantly, the severe downturn in the worldwide automotive industry, greatly
impacted our results in Fiscal 2009. In addition, our results were reduced by charges relating toour restructuring initiatives and the write off of impaired goodwill and intangible assets. Whilethe majority of the decrease in sales was due to our Automotive segment, our Interconnect andPower Products segments were also down due to the slowdown in housing, construction,business infrastructure spending, and consumer spending. Despite reduced earnings, we stillgenerated $43.2 million in positive operating cash flow during the fiscal year.
In 2005, long before the current economically induced difficulties in the automotive industry,we realized the challenges and issues that our legacy automotive business could face and beganto take actions to reduce Methode’s exposure to this business. Specifically we:
✁ First, focused our efforts on providing an expanded array of engineered solutions inorder to penetrate the User Interface (Human Machine Interface), Sensors, and Powercategories.
✁ Second, made acquisitions to build Methode’s innovative and patented technologyportfolio, which increased the Company’s percent of sales covered by patents fromapproximately 16 percent in Fiscal 2004 to over 29 per cent in Fiscal 2009.
✁ Third, began to diversify by r egion, market and customer to the extent that wereduced North American sales to 62 percent in Fiscal 2009, compared to 76 percentin fiscal 2004, by increasing our European and Asian sales, and adding newcustomers.
As a result, auto-related sales decreased from 76 percent of total sales in Fiscal 2005 to 57 percent of total sales in Fiscal 2009. With th e additional actions we announced in Fiscal 2009, we expect our automotive sales to be approximately 40 percent of total sales by Fiscal 2011.
While we had made much progress diversifying Methode away from our legacy automotiveproducts and customers from Fiscal 2005 to Fiscal 2008, we r ealized during the second half ofFiscal 2009 that we had to acceler ate our plans to reduce Methode’s exposure to this troubledmarket even further. With this acceleration and other actions in the fourth quarter of Fiscal2009, and the first and second quarters of Fiscal 2010, we will combat th e current economicsituation, position Methode for growth and improve results over time.
In March 2009, we announced that we were exiting our existing business with Ford NorthAmerica for products manufactured at our facility in Reynosa, Mexico, moving this production to another supplier. This business contributed a substantial portion of our operating losses inthe second half of Fiscal 2009. We will continue to manufacture user interface switches, positionsensors, and other products for Ford out of our facility in Malta, which is a profitable businessfor us, largely because we have diversified manufacturing at this location with Europeancustomers.
Moreover, we are continuing to optimize our global manufacturing footprint and processes toconsolidate facilities, migrate manufacturing to lower cost regions, and reduce factory costs.Moving forward Methode’s principal manufacturing operations will be in Mexico, Malta andChina. This restructuring will not only save manufacturing costs, but will allow us to combin eback office functions and reduce operating costs. It is anticipated that these actions will becompleted by the end of the second quarter of Fiscal 2010. Corporate-wide, every division hasbeen asked to reduce overall spending in line with their reduced sales.
2 METHODE ELECTRONICS ANNUAL REPORT 2009
D E A R F E L L O W S H A R E H O L D E R S
Methode Body 7/23/09 10:28 AM Page 2
METHODE ELECTRONICS ANNUAL REPORT 2009 3
Although the global recession may continue to unfavorably impact the markets Methodeserves in the near term, we have taken stepsto reduce Methode’s cost structure and furtherimprove its cash flow through restructuringand tighter working capital and capitalexpenditure management. While our sales havebeen impacted by the weakening economicconditions, we are pleased with the significantprogress we have made to diversify ourcustomer base and markets.
In the Power Products segment, Methode has been awarded the production contract to provide alaminated bus bar which will be part of the power control system for a hybrid-electric vehicle.This new relationship with a major Japanese Tier 1 demonstrates Methode’s capability to bringan engineered solution to enable these new and emerging propulsion systems, and serves as alaunching point for us in the electric and hybrid-electric vehicle market.
Additionally, we have been contracted to produce a steering sensor for an All Terrain Vehiclewith our new MDI Triband sensor technology. You may recall that our MDI technology was usedon the Spider three-wheel motorcycle. This is an example of our technology being able topropagate across our customers’ platforms and applications.
Utilizing technology we gained from our Tribotek acquisition, we will begin producing a custom power solution for a military application. The customer required a highly reliable andefficient high-power product. Methode’s technology and know-how made us uniquely qualified to create the engineered solution to this challenging application.
Methode is working to expand its share of the User Interface, Sensor and Power markets byleveraging new products and technology that it has recently acquired or developed, as well as improving our solution selling capabilities. In the future, we will continue to look foracquisitions to add to our product portfolio, technical expertise and sales base, so that we can provide customers with the most complete solutions available in the marketplace.
More specifically, as we traverse this increasingly challenging macroeconomic environment, we remain committed to investing in advanced development activities to launch new productsusing our technology.
In summary, Methode’s balance sheet, which includes $54 million in cash, with no debt, and a $75 million line-of-credit, places the Company in a strong financial position during thisrecession, not only to weather the downturn, but to be strategic on acquisitions and businessopportunities which may arise.
Finally, we would like to thank our shareholders for your continued support, and our board ofdirectors and the entire Methode team for their commitment to making the necessary changesto position Methode for growth. While fiscal 2010 will certainly pr esent serious challenges, weare committed to delivering value to our customers and shareholders.
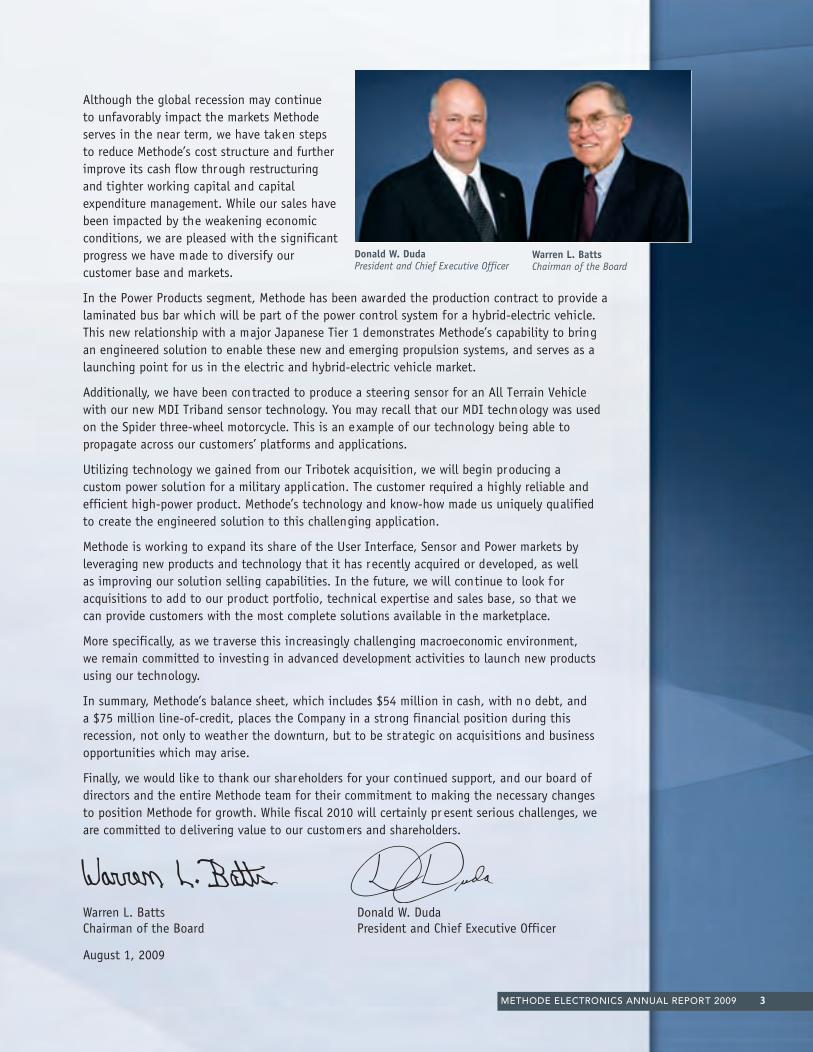
Warren L. Batts Donald W. DudaChairman of the Board President and Chief Executive Officer
August 1, 2009
Donald W. DudaPresident and Chief Executive Officer
Warren L. BattsChairman of the Board
Methode Body 7/23/09 10:28 AM Page 3

BOARD OF DIRECTORS CORPORATE EXECUTIVESWalter J. AspatoreChairman and Co-Founder ofAmherst Partners, LLC
Director since 2008Audit committeeTechnology committee
Warren L. BattsChairman of the Board,Methode Electronics, Inc.
Retired Chairman and Chief Executive Officer,Tupperware Corporation
Director since 2001Compensation committeeNominating and Governance committee
Dr. J. Edward ColgatePentair-Nugent Professor,Department of MechanicalEngineering,Northwestern University
Director since 2004Nominating and Governance committeeTechnology committee
Dr. Darren M. DawsonMcQueen QuattlebaumProfessor, HalcombeDepartment of Electrical andComputer Engineering, Clemson University
Director since 2004Compensation committeeTechnology committee*
Donald W. DudaPresident and Chief Executive Officer, Methode Electronics, Inc.
Director since 2001
Donald W. Duda President and Chief Executive Officer
Timothy R. GlandonVice President and GeneralManager, North AmericanAutomotive Operations
Theodore P. KillVice President, Worldwide Automotive Sales
Douglas A. KomanChief Financial Officer and Vice President, Corporate Finance
Thomas D. ReynoldsSenior Vice President, Worldwide AutomotiveOperations
Ronald L. G. TsoumasTreasurer and Controller
Forward-Looking Statements Certain statements in this 2009 Annual Report are forward-looking statements that are subject to certain risks and uncertainties. Our business is highly dependent upon two large automotive customers and specific makes and models of automobiles. The Company’s results will be subject to many of the same risks that apply to the international automotive, computer, information processing and networking equipment, voice and data communications systems, consumer electronics, appliance, aerospace vehicles and industrial equipment industries, such as general economic conditions, interest rates, consumer spending patterns and technological changes. Other factors which may result in materially different results for future periods include significant customer bankruptcy filings; restructuring, operationalimprovement and cost reduction programs currently under review by Methode; the current macroeconomic environment, including higher petroleum and copper prices affecting material and components used by Methode; potential manufacturing plant closures by automotive customers; potential strikes at automotive customers; and significant fluctuations in the demand for certain automobile models. In addition,market growth, operating costs, currency exchange rates and devaluations, delays in development, production and marketing of new products,ability to protect our intellectual property, ability to keep pace with rapid technological changes, the seasonal and cyclical nature of some of our businesses, ability to avoid design and manufacturing defects and other factors set forth from time to time in our reports filed with the Securities and Exchange Commission impact our business. Any of these factors could cause our actual results to differ materially from those described in the forward-looking statements. The forward-looking statements in this Annual Report are subject to the safe harborprotection provided under the securities laws. All information in this Annual Report is as of August 1, 2009. Methode undertakes no duty to update any forward-looking statement to conform the statement to actual results or changes in the Company’s expectations on a quarterly basis or otherwise.
B O A R D O F D I R E C T O R S A N D E X E C U T I V E S
*Committee Chairperson
Isabelle C. GoossenVice President for Finance and Administration,Chicago Symphony Orchestra Association
Director since 2004Audit committeeCompensation committeeTechnology committee
Christopher J. HornungChief Executive Officer, Next Testing, Inc.
Director since 2004Compensation committeeNominating and Governance committee*Technology committee
Paul G. SheltonRetired Vice President and Chief Financial Officer,FleetPride, Inc.
Director since 2004Audit committeeCompensation committee*
Lawrence B. SkatoffRetired Executive Vice President and Chief Financial Officer,BorgWarner, Inc.
Director since 2004Audit committee*Nominating and Governance committee
4 METHODE ELECTRONICS ANNUAL REPORT 2009
Methode Body 7/23/09 10:28 AM Page 4

UNITED STATES SECURITIES AND EXCHANGE COMMISSION Washington, D.C. 20549
FORM 10-K ANNUAL REPORT PURSUANT TO SECTION 13 OR 15 (d) OF THE
SECURITIES EXCHANGE ACT OF 1934
For the fiscal year ended May 2, 2009
Commission File Number 0-2816
METHODE ELECTRONICS, INC. (Exact name of Registrant as specified in its charter)
Delaware 36-2090085 (State or other jurisdiction of (IRS Employer
incorporation or organization) Identification No.)
7401 West Wilson Avenue 60706-4548 Chicago, Illinois (Zip Code)
(Address of Principal Executive Offices)
Registrant’s telephone number (including area code): (708) 867-6777
Securities registered pursuant to Section 12(b) of the Act:
Name of each exchange Title of each Class on which registered
Common Stock, $0.50 Par Value New York Stock Exchange
Securities registered pursuant to Section 12(g) of the Act: None
(Title of Class)
Indicate by check mark if the Registrant is a well-known seasoned issuer, as defined in Rule 405 of the Securities Act. Yes No
Indicate by check mark if the Registrant is not required to file reports pursuant to Section 13 or Section 15(d) of the Act. Yes No
Indicate by check mark whether the Registrant (1) has filed all reports required to be filed by Section 13 or 15 (d) of the Securities Exchange Act of 1934 during the preceding 12 months (or for such shorter period that the Registrant was required to file such reports), and (2) has been subject to such filing requirements for the past 90 days. Yes No
Indicate by check mark if disclosure of delinquent filers pursuant to Item 405 of Regulation S-K is not contained herein, and will not be contained, to the best of Registrant’s knowledge, in definitive proxy or information statements incorporated by reference in Part III of this Form 10-K or any amendment to this Form 10-K.
Indicate by check mark whether the registrant has submitted electronically and posted on its corporate Web site, if any, every Interactive Data File required to be submitted and posted pursuant to Rule 405 of Regulation S-T during the preceding 12 months (or for such shorter period that the registrant was required to submit and post such files). Yes No
Indicate by check mark whether the registrant is a large accelerated filer, an accelerated filer, a non-accelerated filer, or a smaller reporting company. See definitions of “large accelerated filer,” “accelerated filer,” and “smaller reporting company” in Rule 12b-2 of the Exchange Act. (Check one):
Large accelerated filer Accelerated filer Non-accelerated filer Smaller reporting company
Indicate by check mark whether the registrant is a shell company (as defined in Rule 12b-2 of the Act). Yes No The aggregate market value of common stock, $0.50 par value, held by non-affiliates of the Registrant on November 1, 2008, based upon the average of the closing bid and asked prices on that date as reported by the New York Stock Exchange was $278.5 million.
Registrant had 38,174,261 shares of common stock, $0.50 par value, outstanding as of July 1, 2009.
DOCUMENTS INCORPORATED BY REFERENCE
Portions of the proxy statement for the annual shareholders meeting to be held September 17, 2009 are incorporated by referenceinto Part III.
10k.indd 1 7/16/09 1:17:56 PM

1 1
PART I
Item 1. Business
Methode Electronics, Inc. was incorporated in 1946 as an Illinois corporation and reincorporated in
Delaware in 1966. As used herein, “we,” “us,” “our,” the “Company” or “Methode” mean Methode Electronics, Inc. and its subsidiaries.
We are a global designer and manufacturer of electro-mechanical devices. We design, manufacture and
market devices employing electrical, radio remote control, electronic, wireless, sensing and optical technologies.
Our components are found in the primary end markets of the aerospace, appliance, automotive, consumer and
industrial equipment markets, communications (including information processing and storage, networking
equipment, wireless and terrestrial voice/data systems), rail and other transportation industries.
On September 30, 2008, we acquired certain assets of Hetronic LLC (Hetronic) for $53.6 million in cash.
We also incurred $2.4 million in transaction costs related to the purchase. Hetronic is a global leader in industrial
safety radio remote controls with locations in the U.S., Malta, the Philippines and Germany. Hetronic is represented
in 45 countries by direct sales associates, licensed partners, distributors and representatives. Hetronic provides application specific and standard controls to many different industries, such as material handling, transportation,
mining, military, agriculture and construction. The accounts and transactions of Hetronic have been included in the
Interconnect segment in the Consolidated Financial Statements from the effective date of the acquisition.
Our business has been and will likely continue to be materially adversely affected by the current
economic environment, particularly as it impacts the automotive industry. The disruptions in global financial and
credit markets have significantly impacted global economic activity and led to an economic recession. As a result of
these disruptions, our customers and markets have been adversely affected. We have experienced a significant drop
in sales in all our reporting segments. If demand for our products continues to decline, our business, results of
operations and financial condition could be materially adversely affected. If we are unable to successfully anticipate
changing economic and financial conditions, we may be unable to effectively plan for and respond to these changes and our business could be adversely affected.
We have recorded and may record additional impairment charges which would adversely impact our results
of operations. We review our goodwill and other intangible assets for impairment whenever events or changes in
circumstances indicate that the carrying amount of these assets may not be recoverable, and we also review our
goodwill annually in accordance with Statement of Financial Accounting Standards, (SFAS) No. 142, “Goodwill
and Other Intangibles”. The values assigned to goodwill and intangible assets are normally based on estimates and
judgments regarding expectations for the success and life cycle of products and technologies acquired. A decline in
expectations, future cash flows, a change in strategic direction or our market capitalization remaining below our net
book value for a significant additional period of time could result in further significant impairment charges, which
could have a material adverse effect on our financial condition and results of operations. See Note 4 to our
Consolidated Financial Statements for additional information regarding our goodwill and other intangible asset impairment charges.
On March 12, 2009, we announced several additional restructuring actions to further reduce our exposure
to the North American automotive industry and to consolidate manufacturing facilities in lower cost regions to
reduce costs. After these actions, our principal manufacturing operations will be in Mexico, Malta and China. In
addition, we have decided to transfer certain new General Motors (GM) business to other suppliers. This business
was scheduled to be produced in our Shanghai, China automotive facility.
All Ford Motor Company production at our Reynosa, Mexico facility is being moved to another supplier.
TouchSensor manufacturing currently in west suburban Chicago, Illinois will be moved to Monterrey, Mexico.
Additionally, our operations in Shanghai, China will be consolidated to two facilities from three.
In total, this additional restructuring will affect approximately 850 employees worldwide. We estimate that
we will record a pre-tax charge between $16.0 million and $25.0 million, during fiscal 2009 and 2010. The cash
portion of this charge is estimated between $7.0 million and $8.0 million. During the fiscal year ended May 2, 2009,
we recorded a restructuring charge of $7.3 million, which consisted of $0.1 million for employee severance, $1.4
million for impairment and accelerated depreciation for buildings and improvements and machinery and equipment,
METHODE ELECTRONICS, INC. FORM 10-K May 2, 2009
TABLE OF CONTENTS
PART I
Item 1. Business 1Item 1A. Risk Factors 5Item 2. Properties 9Item 3. Legal Proceedings 10
PART II Item 5. Market for Registrant’s Common Equity, Related Stockholder Matters and Issuer Purchases of
Equity Securities 11Item 6. Selected Financial Data 13Item 7. Management’s Discussion and Analysis of Financial Condition and Results of Operations 14Item 7A. Quantitative and Qualitative Disclosures About Market Risk 38Item 8. Financial Statements and Supplementary Data 38Item 9A. Controls and Procedures 39
PART III Item 10. Directors, Executive Officers and Corporate Governance 40Item 11. Executive Compensation 40Item 12. Security Ownership of Certain Beneficial Owners and Management and Related Stockholder
Matters 40Item 13. Certain Relationships and Related Transactions, and Director Independence 40Item 14. Principal Accounting Fees and Services 40
PART IV Item 15. Exhibits, Financial Statement Schedules 41
10k.indd 2 7/16/09 1:17:57 PM

1 1
PART I
Item 1. Business
Methode Electronics, Inc. was incorporated in 1946 as an Illinois corporation and reincorporated in
Delaware in 1966. As used herein, “we,” “us,” “our,” the “Company” or “Methode” mean Methode Electronics, Inc. and its subsidiaries.
We are a global designer and manufacturer of electro-mechanical devices. We design, manufacture and
market devices employing electrical, radio remote control, electronic, wireless, sensing and optical technologies.
Our components are found in the primary end markets of the aerospace, appliance, automotive, consumer and
industrial equipment markets, communications (including information processing and storage, networking
equipment, wireless and terrestrial voice/data systems), rail and other transportation industries.
On September 30, 2008, we acquired certain assets of Hetronic LLC (Hetronic) for $53.6 million in cash.
We also incurred $2.4 million in transaction costs related to the purchase. Hetronic is a global leader in industrial
safety radio remote controls with locations in the U.S., Malta, the Philippines and Germany. Hetronic is represented
in 45 countries by direct sales associates, licensed partners, distributors and representatives. Hetronic provides application specific and standard controls to many different industries, such as material handling, transportation,
mining, military, agriculture and construction. The accounts and transactions of Hetronic have been included in the
Interconnect segment in the Consolidated Financial Statements from the effective date of the acquisition.
Our business has been and will likely continue to be materially adversely affected by the current
economic environment, particularly as it impacts the automotive industry. The disruptions in global financial and
credit markets have significantly impacted global economic activity and led to an economic recession. As a result of
these disruptions, our customers and markets have been adversely affected. We have experienced a significant drop
in sales in all our reporting segments. If demand for our products continues to decline, our business, results of
operations and financial condition could be materially adversely affected. If we are unable to successfully anticipate
changing economic and financial conditions, we may be unable to effectively plan for and respond to these changes and our business could be adversely affected.
We have recorded and may record additional impairment charges which would adversely impact our results
of operations. We review our goodwill and other intangible assets for impairment whenever events or changes in
circumstances indicate that the carrying amount of these assets may not be recoverable, and we also review our
goodwill annually in accordance with Statement of Financial Accounting Standards, (SFAS) No. 142, “Goodwill
and Other Intangibles”. The values assigned to goodwill and intangible assets are normally based on estimates and
judgments regarding expectations for the success and life cycle of products and technologies acquired. A decline in
expectations, future cash flows, a change in strategic direction or our market capitalization remaining below our net
book value for a significant additional period of time could result in further significant impairment charges, which
could have a material adverse effect on our financial condition and results of operations. See Note 4 to our
Consolidated Financial Statements for additional information regarding our goodwill and other intangible asset impairment charges.
On March 12, 2009, we announced several additional restructuring actions to further reduce our exposure
to the North American automotive industry and to consolidate manufacturing facilities in lower cost regions to
reduce costs. After these actions, our principal manufacturing operations will be in Mexico, Malta and China. In
addition, we have decided to transfer certain new General Motors (GM) business to other suppliers. This business
was scheduled to be produced in our Shanghai, China automotive facility.
All Ford Motor Company production at our Reynosa, Mexico facility is being moved to another supplier.
TouchSensor manufacturing currently in west suburban Chicago, Illinois will be moved to Monterrey, Mexico.
Additionally, our operations in Shanghai, China will be consolidated to two facilities from three.
In total, this additional restructuring will affect approximately 850 employees worldwide. We estimate that
we will record a pre-tax charge between $16.0 million and $25.0 million, during fiscal 2009 and 2010. The cash
portion of this charge is estimated between $7.0 million and $8.0 million. During the fiscal year ended May 2, 2009,
we recorded a restructuring charge of $7.3 million, which consisted of $0.1 million for employee severance, $1.4
million for impairment and accelerated depreciation for buildings and improvements and machinery and equipment,
METHODE ELECTRONICS, INC. FORM 10-K May 2, 2009
TABLE OF CONTENTS
PART I
Item 1. Business 1Item 1A. Risk Factors 5Item 2. Properties 9Item 3. Legal Proceedings 10
PART II Item 5. Market for Registrant’s Common Equity, Related Stockholder Matters and Issuer Purchases of
Equity Securities 11Item 6. Selected Financial Data 13Item 7. Management’s Discussion and Analysis of Financial Condition and Results of Operations 14Item 7A. Quantitative and Qualitative Disclosures About Market Risk 38Item 8. Financial Statements and Supplementary Data 38Item 9A. Controls and Procedures 39
PART III Item 10. Directors, Executive Officers and Corporate Governance 40Item 11. Executive Compensation 40Item 12. Security Ownership of Certain Beneficial Owners and Management and Related Stockholder
Matters 40Item 13. Certain Relationships and Related Transactions, and Director Independence 40Item 14. Principal Accounting Fees and Services 40
PART IV Item 15. Exhibits, Financial Statement Schedules 41
10k.indd 1 7/16/09 1:17:57 PM

2 32
Item 1. Business - Continued
$5.4 million for customer funded tooling and $0.1 in forfeited security deposits related to the cancellation of the new GM business and $0.3 million relating to professional fees. We estimate that we will record pre-tax restructuring charges in fiscal 2010 between $8.7 million and $17.7 million. See Note 2 to our Consolidated Financial Statements for additional information regarding the March 2009 restructuring.
On January 24, 2008, we announced a restructuring of our U.S.-based automotive operations and a decision to discontinue producing certain legacy products in the Interconnect segment. The Automotive and Interconnect segment restructuring is expected to be completed during fiscal 2010. On January 24, 2008, the total pre-tax charges were estimated to be between $19.0 million and $25.0 million. Through May 2, 2009, we have recorded $23.2 million of charges, of which $18.0 million was recorded during fiscal 2009. We estimate that we will record pre-tax restructuring charges in fiscal 2010 between $0.5 million and $1.5 million, of which $0.5 million will relate to the termination of approximately 225 employees and the cost of one-time employee benefits, retention, COBRA and outplacement services. See Note 2 to our Consolidated Financial Statements for additional information regarding the January 2008 restructuring.
We maintain our financial records on the basis of a fifty-two or fifty-three week fiscal year ending on the Saturday closest to April 30. Due to the timing of our fiscal calendar, the fiscal year ended May 2, 2009 represents 52 weeks of results, the fiscal year ended May 3, 2008 represents 53 weeks of results and the fiscal year ended April 28, 2007 represents 52 weeks of results.
Segments. Our business is managed and our financial results are reported on a segment basis, with those segments being Automotive, Interconnect, Power Products and Other.
The Automotive segment supplies electronic and electromechanical devices and related products to automobile OEMs, either directly or through their tiered suppliers, including control switches for electrical power and signals, connectors for electrical devices, integrated control components, switches and sensors that monitor the operation or status of a component or system, and packaging of electrical components.
The Interconnect segment provides a variety of copper and fiber-optic interconnect and interface solutions for the aerospace, appliance, commercial, computer, construction, consumer, material handling, medical, military, mining, networking, storage, and telecommunications markets. Solutions include connectors, conductive polymer, thick film inks, custom cable assemblies, industrial safety radio remote controls, solid-state field effect interface panels, optical and copper transceivers, PC and express card packaging and terminators. Services include the design and installation of fiber optic and copper infrastructure systems, and manufacturing active and passive optical components.
The Power Products segment manufactures braided flexible cables, current-carrying laminated bus devices, custom power-product assemblies, high-current low voltage flexible power cabling systems and powder coated bus bars that are used in various markets and applications, including aerospace, computers, industrial and power conversion, insulated gate bipolar transistor solutions, military, telecommunications, and transportation.
The Other segment includes a designer and manufacturer of magnetic torque sensing products, and independent laboratories that provide services for qualification testing and certification, and analysis of electronic and optical components.
Financial results by segment are summarized in Note 13 to the Consolidated Financial Statements.
3
Item 1. Business - Continued
Sales. The following table reflects the percentage of net sales of the segments of the Company for the last three fiscal years.
May 2, May 3, April 28,2009 2008 2007
Automotive 57.2% 65.7% 70.4%Interconnect 30.8% 24.7% 18.3%Power Products 10.0% 8.3% 9.6%Other 1.9% 1.3% 1.7%
Year Ended
Our sales activities are directed by sales managers who are supported by field application engineers and other engineering personnel who work with customers to design our products into their systems. Our field application engineers also help us identify emerging markets and new products. Our products are sold through in-house sales staff and through independent manufacturers’ representatives with offices throughout the world. Information about our sales and operations in different geographic regions is summarized in Note 13 to the Consolidated Financial Statements. Sales are made primarily to OEMs, either directly or through their tiered suppliers as well as selling partners and distributors.
Sources and Availability of Raw Materials. Principal raw materials that we purchase include coil and bar stock, die castings, ferrous and copper alloy sheet, glass, plastic molding materials, precious metals, semiconductor components, silicon and urethane. All of these items are available from several suppliers and we generally rely on more than one supplier for each item. We have not experienced any significant shortages of raw materials and normally do not carry inventories of raw materials or finished products in excess of those reasonably required to meet production and shipping schedules. We did experience significant price increases in fiscal 2008 and 2007 for copper, precious metals and petroleum-based raw materials.
Patents; Licensing Agreements. We have numerous United States and foreign patents and license agreements covering certain of our products and manufacturing processes, several of which are considered significant to our business. Our ability to compete effectively with other companies depends, in part, on our ability to maintain the proprietary nature of our technology. Although we have been awarded, have filed applications for, or have been licensed under numerous patents in the United States and other countries, there can be no assurance concerning the degree of protection afforded by these patents or the likelihood that pending patents will be issued.
Seasonality. A significant portion of our business is dependent on automotive sales and the vehicle production schedules of our customers. The automotive market is cyclical and depends on general economic conditions, interest rates, fuel prices and consumer spending patterns. During fiscal 2009, we experienced significantly lower automotive sales due to the global recession. Also in fiscal 2009, we significantly reduced shipments to Chrysler, LLC (“Chrysler”) due to our decision to exit unprofitable or marginally profitable legacy business and we are transferring some Ford business from our Reynosa, Mexico facility to other suppliers. In addition, new GM business from our Shanghai, China facility will be transferred to other suppliers during the first quarter of fiscal 2010. This loss of business will affect our U.S. automotive results in future periods. Traditionally, in prior fiscal years, our business was moderately seasonal as our North American automotive customers historically halt operations for approximately two weeks in July for model changeovers and one to two weeks during the December holiday period. During the second half of fiscal 2009, we experienced additional customer plant shutdowns due to lower demand for their products. Accordingly, if we experience additional shutdowns, future quarterly results may be affected.
Material Customers. During the fiscal year ended May 2, 2009, shipments to Ford and Delphi Corporation (“Delphi”), each represented approximately 10% or greater of consolidated net sales and, in the aggregate, amounted to approximately 28.5% of consolidated net sales. Such shipments included a wide variety of our automotive component products.
10k.indd 2 7/16/09 1:17:58 PM

2 32
Item 1. Business - Continued
$5.4 million for customer funded tooling and $0.1 in forfeited security deposits related to the cancellation of the new GM business and $0.3 million relating to professional fees. We estimate that we will record pre-tax restructuring charges in fiscal 2010 between $8.7 million and $17.7 million. See Note 2 to our Consolidated Financial Statements for additional information regarding the March 2009 restructuring.
On January 24, 2008, we announced a restructuring of our U.S.-based automotive operations and a decision to discontinue producing certain legacy products in the Interconnect segment. The Automotive and Interconnect segment restructuring is expected to be completed during fiscal 2010. On January 24, 2008, the total pre-tax charges were estimated to be between $19.0 million and $25.0 million. Through May 2, 2009, we have recorded $23.2 million of charges, of which $18.0 million was recorded during fiscal 2009. We estimate that we will record pre-tax restructuring charges in fiscal 2010 between $0.5 million and $1.5 million, of which $0.5 million will relate to the termination of approximately 225 employees and the cost of one-time employee benefits, retention, COBRA and outplacement services. See Note 2 to our Consolidated Financial Statements for additional information regarding the January 2008 restructuring.
We maintain our financial records on the basis of a fifty-two or fifty-three week fiscal year ending on the Saturday closest to April 30. Due to the timing of our fiscal calendar, the fiscal year ended May 2, 2009 represents 52 weeks of results, the fiscal year ended May 3, 2008 represents 53 weeks of results and the fiscal year ended April 28, 2007 represents 52 weeks of results.
Segments. Our business is managed and our financial results are reported on a segment basis, with those segments being Automotive, Interconnect, Power Products and Other.
The Automotive segment supplies electronic and electromechanical devices and related products to automobile OEMs, either directly or through their tiered suppliers, including control switches for electrical power and signals, connectors for electrical devices, integrated control components, switches and sensors that monitor the operation or status of a component or system, and packaging of electrical components.
The Interconnect segment provides a variety of copper and fiber-optic interconnect and interface solutions for the aerospace, appliance, commercial, computer, construction, consumer, material handling, medical, military, mining, networking, storage, and telecommunications markets. Solutions include connectors, conductive polymer, thick film inks, custom cable assemblies, industrial safety radio remote controls, solid-state field effect interface panels, optical and copper transceivers, PC and express card packaging and terminators. Services include the design and installation of fiber optic and copper infrastructure systems, and manufacturing active and passive optical components.
The Power Products segment manufactures braided flexible cables, current-carrying laminated bus devices, custom power-product assemblies, high-current low voltage flexible power cabling systems and powder coated bus bars that are used in various markets and applications, including aerospace, computers, industrial and power conversion, insulated gate bipolar transistor solutions, military, telecommunications, and transportation.
The Other segment includes a designer and manufacturer of magnetic torque sensing products, and independent laboratories that provide services for qualification testing and certification, and analysis of electronic and optical components.
Financial results by segment are summarized in Note 13 to the Consolidated Financial Statements.
3
Item 1. Business - Continued
Sales. The following table reflects the percentage of net sales of the segments of the Company for the last three fiscal years.
May 2, May 3, April 28,2009 2008 2007
Automotive 57.2% 65.7% 70.4%Interconnect 30.8% 24.7% 18.3%Power Products 10.0% 8.3% 9.6%Other 1.9% 1.3% 1.7%
Year Ended
Our sales activities are directed by sales managers who are supported by field application engineers and other engineering personnel who work with customers to design our products into their systems. Our field application engineers also help us identify emerging markets and new products. Our products are sold through in-house sales staff and through independent manufacturers’ representatives with offices throughout the world. Information about our sales and operations in different geographic regions is summarized in Note 13 to the Consolidated Financial Statements. Sales are made primarily to OEMs, either directly or through their tiered suppliers as well as selling partners and distributors.
Sources and Availability of Raw Materials. Principal raw materials that we purchase include coil and bar stock, die castings, ferrous and copper alloy sheet, glass, plastic molding materials, precious metals, semiconductor components, silicon and urethane. All of these items are available from several suppliers and we generally rely on more than one supplier for each item. We have not experienced any significant shortages of raw materials and normally do not carry inventories of raw materials or finished products in excess of those reasonably required to meet production and shipping schedules. We did experience significant price increases in fiscal 2008 and 2007 for copper, precious metals and petroleum-based raw materials.
Patents; Licensing Agreements. We have numerous United States and foreign patents and license agreements covering certain of our products and manufacturing processes, several of which are considered significant to our business. Our ability to compete effectively with other companies depends, in part, on our ability to maintain the proprietary nature of our technology. Although we have been awarded, have filed applications for, or have been licensed under numerous patents in the United States and other countries, there can be no assurance concerning the degree of protection afforded by these patents or the likelihood that pending patents will be issued.
Seasonality. A significant portion of our business is dependent on automotive sales and the vehicle production schedules of our customers. The automotive market is cyclical and depends on general economic conditions, interest rates, fuel prices and consumer spending patterns. During fiscal 2009, we experienced significantly lower automotive sales due to the global recession. Also in fiscal 2009, we significantly reduced shipments to Chrysler, LLC (“Chrysler”) due to our decision to exit unprofitable or marginally profitable legacy business and we are transferring some Ford business from our Reynosa, Mexico facility to other suppliers. In addition, new GM business from our Shanghai, China facility will be transferred to other suppliers during the first quarter of fiscal 2010. This loss of business will affect our U.S. automotive results in future periods. Traditionally, in prior fiscal years, our business was moderately seasonal as our North American automotive customers historically halt operations for approximately two weeks in July for model changeovers and one to two weeks during the December holiday period. During the second half of fiscal 2009, we experienced additional customer plant shutdowns due to lower demand for their products. Accordingly, if we experience additional shutdowns, future quarterly results may be affected.
Material Customers. During the fiscal year ended May 2, 2009, shipments to Ford and Delphi Corporation (“Delphi”), each represented approximately 10% or greater of consolidated net sales and, in the aggregate, amounted to approximately 28.5% of consolidated net sales. Such shipments included a wide variety of our automotive component products.
10k.indd 3 7/16/09 1:17:58 PM

4 54
Item 1. Business - Continued
Backlog. Our backlog of orders was approximately $66.7 million at May 2, 2009, and $120.6 million at May 3, 2008. It is expected that most of the total backlog at May 2, 2009 will be shipped within fiscal 2010.
Competitive Conditions. The markets in which we operate are highly competitive and characterized by rapid changes due to technological improvements and developments. We compete with a large number of other manufacturers in each of our product areas; many of these competitors have greater resources and sales. Price, service and product performance are significant elements of competition in the sale of our products.
Research and Development. We maintain a research and development program involving a number of professional employees who devote a majority of their time to the development of new products and processes and the advancement of existing products. Senior management of our Company participates directly in the program. Expenditures for such activities amounted to $22.0 million, $25.6 million and $21.3 million for fiscal 2009, 2008 and 2007, respectively.
Environmental Quality. Compliance with foreign, federal, state and local provisions regulating the discharge of materials into the environment has not materially affected our capital expenditures, earnings or our competitive position. Currently, we do not have any environmental related lawsuits or material administrative proceedings pending against us. Further information as to environmental matters affecting us is presented in Note 9 to the Consolidated Financial Statements.
Employees. At May 2, 2009 and May 3, 2008, we had 2,876 and 3,580 employees, respectively. We also from time to time employ part-time employees and hire independent contractors. As of May 2, 2009 our employees from our Malta and Mexico facilities, which account for about 45% of the total number of employees, are represented by a collective bargaining agreement. We have never experienced a work stoppage and we believe that our employee relations are good.
Segment Information and Foreign Sales. Information about our operations by segment and in different geographic regions is summarized in Note 13 to the Consolidated Financial Statements.
Available Information. We are subject to the informational requirements of the Securities Exchange Act of 1934 (Exchange Act) and file periodic reports, proxy statements and other information with the Securities and Exchange Commission (SEC). Such reports may be obtained by visiting the Public Reference Room of the SEC at 100 F Street, NE, Washington, D.C. 20549, or by calling the SEC at (800) SEC-0330. In addition, the SEC maintains an internet site (www.sec.gov) that contains reports, proxy and information statements and other information.
Financial and other information can also be accessed on the investor section of our website at www.methode.com. We make available, free of charge, copies of our annual report on Form 10-K, quarterly reports on Form 10-Q, current reports on Form 8-K, and amendments to those reports filed or furnished pursuant to Section 13(a) or 15(d) of the Exchange Act as soon as reasonably practicable after filing such material electronically or otherwise furnishing it to the SEC. Also posted on our website are the Company’s Corporate Governance Guidelines, Code of Conduct and the charters of the Audit Committee, Compensation Committee, Nominating and Governance Committee and Technology Committee. Copies of these documents are also available free of charge by sending a request to Methode Electronics, Inc., 7401 West Wilson Avenue, Chicago, Illinois 60706, Attention: Investor Relations Department. Information on our website is not incorporated into this Form 10-K or our other securities filings and is not a part of them.
Certifications. As required by the rules and regulations of the New York Stock Exchange (“NYSE”), we delivered to the NYSE a certification signed by our Chief Executive Officer, Donald W. Duda, certifying that Mr. Duda was not aware of any violation by the Company of the NYSE’s corporate governance listing standards as of October 20, 2008.
As required by the rules and regulations of the SEC, the Sarbanes-Oxley Act Section 302 certifications regarding the quality of our public disclosures are filed as exhibits to this Annual Report on Form 10-K.
5
Item 1A. Risk Factors
Certain statements in this report are forward-looking statements that are subject to certain risks and uncertainties. We undertake no duty to update any such forward-looking statements to conform to actual results or changes in our expectations. Our business is highly dependent upon two large automotive customers and specific makes and models of automobiles. Our results will be subject to many of the same risks that apply to the automotive, appliance, computer and telecommunications industries, such as general economic conditions, interest rates, consumer spending patterns and technological changes. Other factors, which may result in materially different results for future periods, include the following risk factors. These risk factors should be considered in connection with evaluating the forward-looking statements contained in this report because these factors could cause our actual results and condition to differ materially from those projected in forward-looking statements. The forward-looking statements in this report are subject to the safe harbor protection provided under the securities laws and are made as of the date of this report. We undertake no duty to update any such forward-looking statements.
We depend on a small number of large customers. If we were to lose any of these customers or any of these customers decreased the number of orders it placed, or if any of the customers declare bankruptcy, our future results could be adversely affected.
During the year ended May 2, 2009, shipments to Ford and Delphi, each represented 10% or greater of consolidated net sales and, in the aggregate, amounted to approximately 28.5% of consolidated net sales. It is expected that in fiscal 2010, we will significantly reduce sales to Ford in North America due to our decision to transfer business from our Reynosa, Mexico facility to other suppliers. The exit of this business will affect our U.S. automotive segment results in future periods. The loss of all or a substantial portion of the sales to Delphi, which has been in bankruptcy since October 2005, could have a material adverse effect on our sales, margins, profitability and, as a result, our share price. The Company is involved in certain disputes with Delphi, which could have an adverse impact on the Company’s future sales to Delphi. The contracts we have entered into with many of our customers provide for supplying the customers’ requirements for a particular model, rather than for manufacturing a specific quantity of products. Such contracts range from one year to the life of the model, which is generally three to seven years. Therefore, the loss of a contract for a major model or a significant decrease in demand for certain key models or group of related models sold by Ford or Delphi could have a material adverse impact on our results of operations and financial condition. We also compete to supply products for successor models and are subject to the risk that Ford or Delphi will not select us to produce products on any such model, which could have a material adverse impact on our results of operations and financial condition.
In addition, we have significant receivable balances related to these customers and other major customers that would be at risk in the event of their bankruptcy. Due to the financial stresses within the worldwide automotive industry, certain automakers and tiered customers have already declared bankruptcy or may be considering bankruptcy.
Because we derive a substantial portion of our revenues from customers in the automotive, appliance, computer and communications industries, we are susceptible to trends and factors affecting those industries.
Our components are found in the primary end markets of the automotive, communications (including information processing and storage, networking equipment, wireless and terrestrial voice/data systems), aerospace, rail and other transportation industries, appliances and the consumer and industrial equipment markets. Factors negatively affecting these industries and the demand for products also negatively affect our business, financial condition and operating results. Recently, we have experienced slow-downs in all segments due to the recession. Any adverse occurrence, including additional industry slowdown, recession, rising interest rates, political instability, costly or constraining regulations, armed hostilities, terrorism, excessive inflation, prolonged disruptions in one or more of our customers’ production schedules or labor disturbances, that results in significant decline in the volume of sales in these industries, or in an overall downturn in the business and operations of our customers in these industries, could materially adversely affect our business, financial condition and operating results.
Our business is cyclical and seasonal in nature and further downturns in the automotive industry could reduce the sales and profitability of our business.
A large portion of our business is dependent on automotive sales and the vehicle production schedules of our customers. The automotive market is cyclical and depends on general economic conditions, interest rates and
10k.indd 4 7/16/09 1:17:59 PM
4 54
Item 1. Business - Continued
Backlog. Our backlog of orders was approximately $66.7 million at May 2, 2009, and $120.6 million at May 3, 2008. It is expected that most of the total backlog at May 2, 2009 will be shipped within fiscal 2010.
Competitive Conditions. The markets in which we operate are highly competitive and characterized by rapid changes due to technological improvements and developments. We compete with a large number of other manufacturers in each of our product areas; many of these competitors have greater resources and sales. Price, service and product performance are significant elements of competition in the sale of our products.
Research and Development. We maintain a research and development program involving a number of professional employees who devote a majority of their time to the development of new products and processes and the advancement of existing products. Senior management of our Company participates directly in the program. Expenditures for such activities amounted to $22.0 million, $25.6 million and $21.3 million for fiscal 2009, 2008 and 2007, respectively.
Environmental Quality. Compliance with foreign, federal, state and local provisions regulating the discharge of materials into the environment has not materially affected our capital expenditures, earnings or our competitive position. Currently, we do not have any environmental related lawsuits or material administrative proceedings pending against us. Further information as to environmental matters affecting us is presented in Note 9 to the Consolidated Financial Statements.
Employees. At May 2, 2009 and May 3, 2008, we had 2,876 and 3,580 employees, respectively. We also from time to time employ part-time employees and hire independent contractors. As of May 2, 2009 our employees from our Malta and Mexico facilities, which account for about 45% of the total number of employees, are represented by a collective bargaining agreement. We have never experienced a work stoppage and we believe that our employee relations are good.
Segment Information and Foreign Sales. Information about our operations by segment and in different geographic regions is summarized in Note 13 to the Consolidated Financial Statements.
Available Information. We are subject to the informational requirements of the Securities Exchange Act of 1934 (Exchange Act) and file periodic reports, proxy statements and other information with the Securities and Exchange Commission (SEC). Such reports may be obtained by visiting the Public Reference Room of the SEC at 100 F Street, NE, Washington, D.C. 20549, or by calling the SEC at (800) SEC-0330. In addition, the SEC maintains an internet site (www.sec.gov) that contains reports, proxy and information statements and other information.
Financial and other information can also be accessed on the investor section of our website at www.methode.com. We make available, free of charge, copies of our annual report on Form 10-K, quarterly reports on Form 10-Q, current reports on Form 8-K, and amendments to those reports filed or furnished pursuant to Section 13(a) or 15(d) of the Exchange Act as soon as reasonably practicable after filing such material electronically or otherwise furnishing it to the SEC. Also posted on our website are the Company’s Corporate Governance Guidelines, Code of Conduct and the charters of the Audit Committee, Compensation Committee, Nominating and Governance Committee and Technology Committee. Copies of these documents are also available free of charge by sending a request to Methode Electronics, Inc., 7401 West Wilson Avenue, Chicago, Illinois 60706, Attention: Investor Relations Department. Information on our website is not incorporated into this Form 10-K or our other securities filings and is not a part of them.
Certifications. As required by the rules and regulations of the New York Stock Exchange (“NYSE”), we delivered to the NYSE a certification signed by our Chief Executive Officer, Donald W. Duda, certifying that Mr. Duda was not aware of any violation by the Company of the NYSE’s corporate governance listing standards as of October 20, 2008.
As required by the rules and regulations of the SEC, the Sarbanes-Oxley Act Section 302 certifications regarding the quality of our public disclosures are filed as exhibits to this Annual Report on Form 10-K.
5
Item 1A. Risk Factors
Certain statements in this report are forward-looking statements that are subject to certain risks and uncertainties. We undertake no duty to update any such forward-looking statements to conform to actual results or changes in our expectations. Our business is highly dependent upon two large automotive customers and specific makes and models of automobiles. Our results will be subject to many of the same risks that apply to the automotive, appliance, computer and telecommunications industries, such as general economic conditions, interest rates, consumer spending patterns and technological changes. Other factors, which may result in materially different results for future periods, include the following risk factors. These risk factors should be considered in connection with evaluating the forward-looking statements contained in this report because these factors could cause our actual results and condition to differ materially from those projected in forward-looking statements. The forward-looking statements in this report are subject to the safe harbor protection provided under the securities laws and are made as of the date of this report. We undertake no duty to update any such forward-looking statements.
We depend on a small number of large customers. If we were to lose any of these customers or any of these customers decreased the number of orders it placed, or if any of the customers declare bankruptcy, our future results could be adversely affected.
During the year ended May 2, 2009, shipments to Ford and Delphi, each represented 10% or greater of consolidated net sales and, in the aggregate, amounted to approximately 28.5% of consolidated net sales. It is expected that in fiscal 2010, we will significantly reduce sales to Ford in North America due to our decision to transfer business from our Reynosa, Mexico facility to other suppliers. The exit of this business will affect our U.S. automotive segment results in future periods. The loss of all or a substantial portion of the sales to Delphi, which has been in bankruptcy since October 2005, could have a material adverse effect on our sales, margins, profitability and, as a result, our share price. The Company is involved in certain disputes with Delphi, which could have an adverse impact on the Company’s future sales to Delphi. The contracts we have entered into with many of our customers provide for supplying the customers’ requirements for a particular model, rather than for manufacturing a specific quantity of products. Such contracts range from one year to the life of the model, which is generally three to seven years. Therefore, the loss of a contract for a major model or a significant decrease in demand for certain key models or group of related models sold by Ford or Delphi could have a material adverse impact on our results of operations and financial condition. We also compete to supply products for successor models and are subject to the risk that Ford or Delphi will not select us to produce products on any such model, which could have a material adverse impact on our results of operations and financial condition.
In addition, we have significant receivable balances related to these customers and other major customers that would be at risk in the event of their bankruptcy. Due to the financial stresses within the worldwide automotive industry, certain automakers and tiered customers have already declared bankruptcy or may be considering bankruptcy.
Because we derive a substantial portion of our revenues from customers in the automotive, appliance, computer and communications industries, we are susceptible to trends and factors affecting those industries.
Our components are found in the primary end markets of the automotive, communications (including information processing and storage, networking equipment, wireless and terrestrial voice/data systems), aerospace, rail and other transportation industries, appliances and the consumer and industrial equipment markets. Factors negatively affecting these industries and the demand for products also negatively affect our business, financial condition and operating results. Recently, we have experienced slow-downs in all segments due to the recession. Any adverse occurrence, including additional industry slowdown, recession, rising interest rates, political instability, costly or constraining regulations, armed hostilities, terrorism, excessive inflation, prolonged disruptions in one or more of our customers’ production schedules or labor disturbances, that results in significant decline in the volume of sales in these industries, or in an overall downturn in the business and operations of our customers in these industries, could materially adversely affect our business, financial condition and operating results.
Our business is cyclical and seasonal in nature and further downturns in the automotive industry could reduce the sales and profitability of our business.
A large portion of our business is dependent on automotive sales and the vehicle production schedules of our customers. The automotive market is cyclical and depends on general economic conditions, interest rates and
10k.indd 5 7/16/09 1:18:00 PM

6 76
Item 1A. Risk Factors - Continued
consumer spending patterns. Any significant reduction in vehicle production by our customers would have a material adverse effect on our business. During fiscal 2009, we experienced significantly lower automotive sales due to the global recession. Also in fiscal 2009, we significantly reduced shipments to Chrysler due to our decision to exit unprofitable or marginally profitable legacy business and we are transferring some Ford business from our Reynosa, Mexico facility to other suppliers during the first quarter of fiscal 2010. In addition, we are in the process of transferring new GM business from our Shanghai, China facility to other suppliers, which is expected to be completed during the first quarter of fiscal 2010. The loss of business will affect our U.S. automotive results in future periods. Traditionally, in prior fiscal years, our business was moderately seasonal as our North American automotive customers historically halt operations for approximately two weeks in July for model changeovers and one to two weeks during the December holiday period. During the second half of fiscal 2009, we experienced additional customer plant shutdowns due to lower demand for their products. Accordingly, if we experience additional shutdowns, quarterly results may be affected.
If we are unable to protect our intellectual property or we infringe, or are alleged to infringe, on another person’s intellectual property, our business, financial condition and operating results could be materially adversely affected.
We have numerous United States and foreign patents and license agreements covering certain of our products and manufacturing processes, several of which are considered material to our business. Our ability to compete effectively with other companies depends, in part, on our ability to maintain the proprietary nature of our technology. Although we have been awarded, have filed applications for, or have been licensed under numerous patents in the United States and other countries, there can be no assurance concerning the degree of protection afforded by these patents or the likelihood that pending patents will be issued. The loss of any significant patents and trade secrets could adversely affect our sales, margins, profitability and, as a result, share price.
We may become involved in litigation in the future to protect our intellectual property or because others may allege that we infringe on their intellectual property. These claims and any resulting lawsuit could subject us to liability for damages and invalidate our intellectual property rights. If an infringement claim is successfully asserted by a holder of intellectual property rights, we may be required to cease marketing or selling certain products, pay a penalty for past infringement and spend significant time and money to develop a non-infringing product or process or to obtain licenses for the technology, process or information from the holder. We may not be successful in the development of a non-infringing alternative, or licenses may not be available on commercially acceptable terms, if at all, in which case we may lose sales and profits. In addition, any litigation could be lengthy and costly and could materially adversely affect us even if we are successful in the litigation.
We face risks relating to our international operations.
Because we have significant international operations, our operating results and financial condition could be adversely affected by economic, political, health, regulatory and other factors existing in foreign countries in which we operate. Our international operations are subject to inherent risks, which may adversely affect us, including: fluctuations in exchange rates; political and economic instability in countries in which our products are manufactured; expropriation, or the imposition of government controls; changes in government regulations; export license requirements; trade restrictions; earnings expatriation restrictions; exposure to different legal standards; less favorable intellectual property laws; health conditions and standards; currency controls; increases in the duties and taxes we pay; high levels of inflation or deflation; greater difficulty in collecting our accounts receivable and longer payment cycles; changes in labor conditions and difficulties in staffing and managing our international operations; limitations on insurance coverage against geopolitical risks, natural disasters and business operations; and communication among and management of international operations. In addition, these same factors may also place us at a competitive disadvantage to some of our foreign competitors.
We cannot assure you that the newly acquired Hetronic business will be successful or that we can implement and profit from any new applications of the acquired technology.
We acquired Hetronic on September 30, 2008. As a result of this acquisition, we now design and manufacture industrial safety radio remote controls that are used primarily in the material handling, transportation, mining, military, agriculture and construction industries. The current economic recession has had an adverse effect
7
Item 1A. Risk Factors - Continued
on the Hetronic business and our operating results. Also, the market for safety radio remote controls is competitive and rapidly changing. If we do not keep pace with technological innovations in the industry, our products may not be competitive and our revenue and operating results may suffer. Furthermore, while we intend to expand the Hetronic business by integrating the technology into additional automotive and other applications, we can make no guarantee that such ventures will be successful or profitable.
Our technology-based business and the markets in which we operate are highly competitive. If we are unable to compete effectively, our sales will decline.
The markets in which we operate are highly competitive and characterized by rapid changes due to technological improvements and developments. We compete with a large number of other manufacturers in each of our product areas; many of these competitors have greater resources and sales. Price, service and product performance are significant elements of competition in the sale of our products. Competition may intensify further if more companies enter the markets in which we operate. Our failure to compete effectively could materially adversely affect our business, financial condition and operating results.
We may acquire businesses or divest business operations. These transactions may pose significant risks and may materially adversely affect our business, financial condition and operating results.
We intend to explore opportunities to acquire other businesses or technologies that could complement, enhance or expand our current business or product lines or that might otherwise offer growth opportunities. Any transactions that we are able to identify and complete may involve a number of risks, including: the diversion of our management’s attention from our existing business to integrate the operations and personnel of the acquired or combined business or joint venture; possible adverse effects on our operating results during the integration process; and our possible inability to achieve the intended objectives of the transaction. In addition, we may not be able to successfully or profitably integrate, operate, maintain and manage our newly acquired operations or employees. We may not be able to maintain uniform standards, controls, procedures and policies, and this may lead to operational inefficiencies. In addition, future acquisitions may result in dilutive issuances of equity securities, a reduction of cash or the incurrence of debt.
We have in the past, and may in the future, consider divesting certain business operations. Divestitures may involve a number of risks, including the diversion of management’s attention, significant costs and expenses, the loss of customer relationships and cash flow, and the disruption of operations in the affected business. Failure to timely complete a divestiture or to consummate a divestiture may negatively affect valuation of the affected business or result in restructuring charges.
We may be unable to keep pace with rapid technological changes, which would adversely affect our business.
The technologies relating to some of our products have undergone, and are continuing to undergo, rapid and significant changes. Specifically, end markets for electronic components and assemblies are characterized by technological change, frequent new product introductions and enhancements, changes in customer requirements and emerging industry standards. These changes could render our existing products unmarketable before we can recover any or all of our research, development and other expenses. Furthermore, the life cycles of our products vary, may change and are difficult to estimate. If we are unable, for technological or other reasons, to develop and market new products or product enhancements in a timely and cost-effective manner, our business, financial condition and operating results could be materially adversely affected.
Products we manufacture may contain design or manufacturing defects that could result in reduced demand for our products or services and liability claims against us.
Despite our quality control and quality assurance efforts, defects may occur in the products we manufacture due to design or manufacturing errors or component failure. Product defects may result in delayed shipments and reduced demand for our products. We may be subject to increased costs due to warranty claims on defective products. Product defects may result in product liability claims against us where defects cause, or are alleged to cause, property damage, bodily injury or death. We may be required to participate in a recall involving products that are, or are alleged to be, defective. We carry insurance for certain legal matters involving product liability, however,
10k.indd 6 7/16/09 1:18:01 PM
6 76
Item 1A. Risk Factors - Continued
consumer spending patterns. Any significant reduction in vehicle production by our customers would have a material adverse effect on our business. During fiscal 2009, we experienced significantly lower automotive sales due to the global recession. Also in fiscal 2009, we significantly reduced shipments to Chrysler due to our decision to exit unprofitable or marginally profitable legacy business and we are transferring some Ford business from our Reynosa, Mexico facility to other suppliers during the first quarter of fiscal 2010. In addition, we are in the process of transferring new GM business from our Shanghai, China facility to other suppliers, which is expected to be completed during the first quarter of fiscal 2010. The loss of business will affect our U.S. automotive results in future periods. Traditionally, in prior fiscal years, our business was moderately seasonal as our North American automotive customers historically halt operations for approximately two weeks in July for model changeovers and one to two weeks during the December holiday period. During the second half of fiscal 2009, we experienced additional customer plant shutdowns due to lower demand for their products. Accordingly, if we experience additional shutdowns, quarterly results may be affected.
If we are unable to protect our intellectual property or we infringe, or are alleged to infringe, on another person’s intellectual property, our business, financial condition and operating results could be materially adversely affected.
We have numerous United States and foreign patents and license agreements covering certain of our products and manufacturing processes, several of which are considered material to our business. Our ability to compete effectively with other companies depends, in part, on our ability to maintain the proprietary nature of our technology. Although we have been awarded, have filed applications for, or have been licensed under numerous patents in the United States and other countries, there can be no assurance concerning the degree of protection afforded by these patents or the likelihood that pending patents will be issued. The loss of any significant patents and trade secrets could adversely affect our sales, margins, profitability and, as a result, share price.
We may become involved in litigation in the future to protect our intellectual property or because others may allege that we infringe on their intellectual property. These claims and any resulting lawsuit could subject us to liability for damages and invalidate our intellectual property rights. If an infringement claim is successfully asserted by a holder of intellectual property rights, we may be required to cease marketing or selling certain products, pay a penalty for past infringement and spend significant time and money to develop a non-infringing product or process or to obtain licenses for the technology, process or information from the holder. We may not be successful in the development of a non-infringing alternative, or licenses may not be available on commercially acceptable terms, if at all, in which case we may lose sales and profits. In addition, any litigation could be lengthy and costly and could materially adversely affect us even if we are successful in the litigation.
We face risks relating to our international operations.
Because we have significant international operations, our operating results and financial condition could be adversely affected by economic, political, health, regulatory and other factors existing in foreign countries in which we operate. Our international operations are subject to inherent risks, which may adversely affect us, including: fluctuations in exchange rates; political and economic instability in countries in which our products are manufactured; expropriation, or the imposition of government controls; changes in government regulations; export license requirements; trade restrictions; earnings expatriation restrictions; exposure to different legal standards; less favorable intellectual property laws; health conditions and standards; currency controls; increases in the duties and taxes we pay; high levels of inflation or deflation; greater difficulty in collecting our accounts receivable and longer payment cycles; changes in labor conditions and difficulties in staffing and managing our international operations; limitations on insurance coverage against geopolitical risks, natural disasters and business operations; and communication among and management of international operations. In addition, these same factors may also place us at a competitive disadvantage to some of our foreign competitors.
We cannot assure you that the newly acquired Hetronic business will be successful or that we can implement and profit from any new applications of the acquired technology.
We acquired Hetronic on September 30, 2008. As a result of this acquisition, we now design and manufacture industrial safety radio remote controls that are used primarily in the material handling, transportation, mining, military, agriculture and construction industries. The current economic recession has had an adverse effect
7
Item 1A. Risk Factors - Continued
on the Hetronic business and our operating results. Also, the market for safety radio remote controls is competitive and rapidly changing. If we do not keep pace with technological innovations in the industry, our products may not be competitive and our revenue and operating results may suffer. Furthermore, while we intend to expand the Hetronic business by integrating the technology into additional automotive and other applications, we can make no guarantee that such ventures will be successful or profitable.
Our technology-based business and the markets in which we operate are highly competitive. If we are unable to compete effectively, our sales will decline.
The markets in which we operate are highly competitive and characterized by rapid changes due to technological improvements and developments. We compete with a large number of other manufacturers in each of our product areas; many of these competitors have greater resources and sales. Price, service and product performance are significant elements of competition in the sale of our products. Competition may intensify further if more companies enter the markets in which we operate. Our failure to compete effectively could materially adversely affect our business, financial condition and operating results.
We may acquire businesses or divest business operations. These transactions may pose significant risks and may materially adversely affect our business, financial condition and operating results.
We intend to explore opportunities to acquire other businesses or technologies that could complement, enhance or expand our current business or product lines or that might otherwise offer growth opportunities. Any transactions that we are able to identify and complete may involve a number of risks, including: the diversion of our management’s attention from our existing business to integrate the operations and personnel of the acquired or combined business or joint venture; possible adverse effects on our operating results during the integration process; and our possible inability to achieve the intended objectives of the transaction. In addition, we may not be able to successfully or profitably integrate, operate, maintain and manage our newly acquired operations or employees. We may not be able to maintain uniform standards, controls, procedures and policies, and this may lead to operational inefficiencies. In addition, future acquisitions may result in dilutive issuances of equity securities, a reduction of cash or the incurrence of debt.
We have in the past, and may in the future, consider divesting certain business operations. Divestitures may involve a number of risks, including the diversion of management’s attention, significant costs and expenses, the loss of customer relationships and cash flow, and the disruption of operations in the affected business. Failure to timely complete a divestiture or to consummate a divestiture may negatively affect valuation of the affected business or result in restructuring charges.
We may be unable to keep pace with rapid technological changes, which would adversely affect our business.
The technologies relating to some of our products have undergone, and are continuing to undergo, rapid and significant changes. Specifically, end markets for electronic components and assemblies are characterized by technological change, frequent new product introductions and enhancements, changes in customer requirements and emerging industry standards. These changes could render our existing products unmarketable before we can recover any or all of our research, development and other expenses. Furthermore, the life cycles of our products vary, may change and are difficult to estimate. If we are unable, for technological or other reasons, to develop and market new products or product enhancements in a timely and cost-effective manner, our business, financial condition and operating results could be materially adversely affected.
Products we manufacture may contain design or manufacturing defects that could result in reduced demand for our products or services and liability claims against us.
Despite our quality control and quality assurance efforts, defects may occur in the products we manufacture due to design or manufacturing errors or component failure. Product defects may result in delayed shipments and reduced demand for our products. We may be subject to increased costs due to warranty claims on defective products. Product defects may result in product liability claims against us where defects cause, or are alleged to cause, property damage, bodily injury or death. We may be required to participate in a recall involving products that are, or are alleged to be, defective. We carry insurance for certain legal matters involving product liability, however,
10k.indd 7 7/16/09 1:18:01 PM
8 98
Item 1A. Risk Factors - Continued
we do not have coverage for all costs related to product defects and the costs of such claims, including costs of defense and settlement, may exceed our available coverage.
We are dependent on the availability and price of raw materials.
We require substantial amounts of raw materials, including petroleum-based products, glass, copper and precious metals, and all raw mateials we require are purchased from outside sources. The availability and prices of raw materials may be subject to curtailment or change due to, among other things, new laws or regulations, suppliers’ allocations to other purchasers, interruptions in production by suppliers, changes in exchange rates and worldwide price levels. Any change in the supply of, or price for, these raw materials could materially affect our results of operations and financial condition. We did experience price increases in fiscal 2008 and 2007 for copper, precious metals and petroleum-based raw materials.
Because we derive approximately 57% of our revenues from customers in the automotive segment, rising oil prices could adversely affect future results.
A large portion of our revenue is derived from parts and components that are provided in our customers’ less fuel-efficient vehicles. Increasing oil and gasoline prices have, and, are expected to continue to negatively affect the sales of those vehicles in the future, which could negatively impact our future automotive revenue.
We have and may continue to incur additional significant restructuring charges that will adversely affect our results of operations.
Due to the economic downturn, we have incurred $25.3 million in restructuring charges in fiscal 2009, and we expect to incur $9.2 million to $19.2 million of restructuring charges in fiscal 2010. This will have an adverse effect on our financial condition and results of operations. If economic conditions worsen, we could have additional restructuring efforts in addition to those mentioned above.
We may incur additional goodwill and other asset impairments.
Our business has been and may continue to be materially adversely affected by the current economic environment. The recent disruptions in global financial and credit markets have significantly impacted global economic activity and led to an economic recession. As a result of these disruptions, our customers and markets have been adversely affected. We have recently experienced a significant drop in sales in all our reporting segments. If we experience reduced demand because of these disruptions in the macroeconomic environment or other factors, our business, results of operation and financial condition could be materially adversely affected. If we are unable to successfully anticipate changing economic and financial conditions, we may be unable to effectively plan for and respond to these changes and our business could be adversely affected.
We have recorded and may record additional impairment charges that would adversely impact our results of operations. We review our goodwill and other assets for impairment whenever events or changes in circumstances indicate that the carrying amount of these assets may not be recoverable, and we also review our goodwill annually in accordance with SFAS No. 142, “Goodwill and Other Intangibles” as well as SFAS No. 144, “Accounting for the Impairment or Disposal of Long-Lived Assets”. The values assigned to goodwill and intangible assets are normally based on estimates and judgments regarding expectations for the success and life cycle of products and technologies acquired. A decline in expectations, future cash flows, a change in strategic direction or our market capitalization remaining below our net book value for a significant period of time could result in significant impairment charges, which could have a material adverse effect on our financial condition and results of operations. See Note 4 to our Consolidated Financial Statements for additional information regarding our goodwill and other asset impairment charges.
9
Item 2. Properties
We operate the following manufacturing and other facilities, all of which we believeto be in good condition and adequate to meet our current and reasonably anticipated needs:
Owned/ ApproximateUse Leased Square Footage
Chicago, Illinois Corporate Headquarters Owned 15,000
Automotive Segment:Carthage, Illinois Manufacturing Owned 261,000Mriehel, Malta Manufacturing Leased 209,000Reynosa, Mexico Manufacturing Leased 102,000Golden, Illinois Manufacturing Owned 90,000Shanghai, China Manufacturing Leased 75,500McAllen, Texas Warehousing Leased 38,000Monterrey, Mexico Manufacturing Leased 36,000Southfield, Michigan Sales and Engineering Design Center Owned 17,000Gau-Algesheim, Germany Sales and Engineering Design Center Leased 6,800Burnley, England Engineering Design Center Leased 5,900
Interconnect Segment:Rolling Meadows, Illinois Manufacturing Owned 75,000Carol Stream, Illinois Manufacturing Leased 50,000Shanghai, China Manufacturing Leased 49,000Richardson, Texas Manufacturing Leased 45,000Chicago, Illinois Manufacturing Owned 38,400Jihlava, Czech Republic Manufacturing Owned 36,000Mosta, Malta Manufacturing Leased 32,500Laguna, Philippines Manufacturing Leased 22,800Wheaton, Illinois Manufacturing Leased 22,500Oklahoma City, Oklahoma Manufacturing/Design Center Leased 19,800San Jose, California Sales and Design Leased 7,250Warsaw, Poland Sales and Distribution Leased 5,700Limerick, Ireland Sales and Distribution Leased 4,700Singapore Sales and Administrative Leased 3,000Kiev, Ukraine Sales and Distribution Leased 900Bucharest, Romania Sales and Distribution Leased 400Ljubljana, Slovenia Sales and Distribution Leased 400
Power Products Segment:Shaghai, China Manufacturing Leased 60,000Rolling Meadows, Illinois Manufacturing Owned 52,000Naperville, Illinois Manufacturing Leased 30,000Reynosa, Mexico Manufacturing Leased 27,000San Jose, California Prototype and Design Center Leased 7,250
Other Segment:Palatine, Illinois Test Laboratory Owned 27,000Hunt Valley, Maryland Test Laboratory Owned 16,000Chicago, Illinois Manufacturing Owned 10,000
Location
10k.indd 8 7/16/09 1:18:02 PM
8 98
Item 1A. Risk Factors - Continued
we do not have coverage for all costs related to product defects and the costs of such claims, including costs of defense and settlement, may exceed our available coverage.
We are dependent on the availability and price of raw materials.
We require substantial amounts of raw materials, including petroleum-based products, glass, copper and precious metals, and all raw mateials we require are purchased from outside sources. The availability and prices of raw materials may be subject to curtailment or change due to, among other things, new laws or regulations, suppliers’ allocations to other purchasers, interruptions in production by suppliers, changes in exchange rates and worldwide price levels. Any change in the supply of, or price for, these raw materials could materially affect our results of operations and financial condition. We did experience price increases in fiscal 2008 and 2007 for copper, precious metals and petroleum-based raw materials.
Because we derive approximately 57% of our revenues from customers in the automotive segment, rising oil prices could adversely affect future results.
A large portion of our revenue is derived from parts and components that are provided in our customers’ less fuel-efficient vehicles. Increasing oil and gasoline prices have, and, are expected to continue to negatively affect the sales of those vehicles in the future, which could negatively impact our future automotive revenue.
We have and may continue to incur additional significant restructuring charges that will adversely affect our results of operations.
Due to the economic downturn, we have incurred $25.3 million in restructuring charges in fiscal 2009, and we expect to incur $9.2 million to $19.2 million of restructuring charges in fiscal 2010. This will have an adverse effect on our financial condition and results of operations. If economic conditions worsen, we could have additional restructuring efforts in addition to those mentioned above.
We may incur additional goodwill and other asset impairments.
Our business has been and may continue to be materially adversely affected by the current economic environment. The recent disruptions in global financial and credit markets have significantly impacted global economic activity and led to an economic recession. As a result of these disruptions, our customers and markets have been adversely affected. We have recently experienced a significant drop in sales in all our reporting segments. If we experience reduced demand because of these disruptions in the macroeconomic environment or other factors, our business, results of operation and financial condition could be materially adversely affected. If we are unable to successfully anticipate changing economic and financial conditions, we may be unable to effectively plan for and respond to these changes and our business could be adversely affected.
We have recorded and may record additional impairment charges that would adversely impact our results of operations. We review our goodwill and other assets for impairment whenever events or changes in circumstances indicate that the carrying amount of these assets may not be recoverable, and we also review our goodwill annually in accordance with SFAS No. 142, “Goodwill and Other Intangibles” as well as SFAS No. 144, “Accounting for the Impairment or Disposal of Long-Lived Assets”. The values assigned to goodwill and intangible assets are normally based on estimates and judgments regarding expectations for the success and life cycle of products and technologies acquired. A decline in expectations, future cash flows, a change in strategic direction or our market capitalization remaining below our net book value for a significant period of time could result in significant impairment charges, which could have a material adverse effect on our financial condition and results of operations. See Note 4 to our Consolidated Financial Statements for additional information regarding our goodwill and other asset impairment charges.
9
Item 2. Properties
We operate the following manufacturing and other facilities, all of which we believeto be in good condition and adequate to meet our current and reasonably anticipated needs:
Owned/ ApproximateUse Leased Square Footage
Chicago, Illinois Corporate Headquarters Owned 15,000
Automotive Segment:Carthage, Illinois Manufacturing Owned 261,000Mriehel, Malta Manufacturing Leased 209,000Reynosa, Mexico Manufacturing Leased 102,000Golden, Illinois Manufacturing Owned 90,000Shanghai, China Manufacturing Leased 75,500McAllen, Texas Warehousing Leased 38,000Monterrey, Mexico Manufacturing Leased 36,000Southfield, Michigan Sales and Engineering Design Center Owned 17,000Gau-Algesheim, Germany Sales and Engineering Design Center Leased 6,800Burnley, England Engineering Design Center Leased 5,900
Interconnect Segment:Rolling Meadows, Illinois Manufacturing Owned 75,000Carol Stream, Illinois Manufacturing Leased 50,000Shanghai, China Manufacturing Leased 49,000Richardson, Texas Manufacturing Leased 45,000Chicago, Illinois Manufacturing Owned 38,400Jihlava, Czech Republic Manufacturing Owned 36,000Mosta, Malta Manufacturing Leased 32,500Laguna, Philippines Manufacturing Leased 22,800Wheaton, Illinois Manufacturing Leased 22,500Oklahoma City, Oklahoma Manufacturing/Design Center Leased 19,800San Jose, California Sales and Design Leased 7,250Warsaw, Poland Sales and Distribution Leased 5,700Limerick, Ireland Sales and Distribution Leased 4,700Singapore Sales and Administrative Leased 3,000Kiev, Ukraine Sales and Distribution Leased 900Bucharest, Romania Sales and Distribution Leased 400Ljubljana, Slovenia Sales and Distribution Leased 400
Power Products Segment:Shaghai, China Manufacturing Leased 60,000Rolling Meadows, Illinois Manufacturing Owned 52,000Naperville, Illinois Manufacturing Leased 30,000Reynosa, Mexico Manufacturing Leased 27,000San Jose, California Prototype and Design Center Leased 7,250
Other Segment:Palatine, Illinois Test Laboratory Owned 27,000Hunt Valley, Maryland Test Laboratory Owned 16,000Chicago, Illinois Manufacturing Owned 10,000
Location
10k.indd 9 7/16/09 1:18:03 PM

10 1110
Item 3. Legal Proceedings
As of July 2, 2009, we were not involved in any material legal proceedings or any legal proceedings or material administrative proceedings with governmental authorities pertaining to the discharge of materials into the environment or otherwise.
Executive Officers of the Registrant
Name Age Offices and Positions Held and Length of Service as OfficerDonald W. Duda 54 Chief Executive Officer of the Company since May 1, 2004.
President and Director of the Company since February 2001. Prior thereto Mr. Duda was Vice President-Interconnect Group since March 2000. Prior thereto Mr. Duda was with Amphenol Corporation through November 1998 as General Manager of its Fiber Optic Products Division since 1988.
Douglas A. Koman 59 Chief Financial Officer of the Company since May 1, 2004. Vice
President, Corporate Finance, of the Company since April 2001. Prior thereto Mr. Koman was Assistant Vice President-Financial Analysis since December 2000. Prior thereto Mr. Koman was with Illinois Central Corporation through March 2000 as Controller since November 1997 and Treasurer since July 1991.
Thomas D. Reynolds 46 Senior Vice President, Worldwide Automotive Operations, of the
Company since September 14, 2006. Vice President and General Manager, North American Automotive Operations, of the Company since October 2001. Prior thereto Mr. Reynolds was with Donnelly Corporation through October 2001 as Senior Manager of Operations since 1999, and as Director of Transnational Business Unit from 1995 to 1999.
Timothy R. Glandon 45 Vice President and General Manager, North American
Automotive, of the Company since September 14, 2006. Prior thereto Mr. Glandon was General Manager of Automotive Safety Technologies since August 1, 2001. Prior thereto Mr. Glandon was Vice President and General Manager with American Components, Inc. from 1996 to 2001.
Theodore D. Kill 58 Vice President, Worldwide Automotive Sales, of the Company
since August 2006. Prior thereto Mr. Kill was a principal with Kill and Associates from 2003 to 2006. Prior thereto Mr. Kill was a principal with Kill and Bolton Associates from 1995 to 2003.
Ronald L.G. Tsoumas 48 Controller and Treasurer of the Company since September 2007.
Prior thereto Mr. Tsoumas was Assistant Controller of the Company since July 1998.
All executive officers are elected by the Board of Directors and serve a term of one year or until their successors are duly elected and qualified.
11
PART II
Item 5. Market for Registrant’s Common Equity, Related Stockholder Matters and Issuer Purchases of Equity Securities
The following is a tabulation of high and low sales prices for the periods indicated as reported by the New York Stock Exchange.
Dividends Sales Price Per Share Paid High Low Per ShareFiscal Year ended May 2, 2009 First Quarter . . . . . . . . . . . . . . . . $ 12.51 $ 9.50 $ 0.05 Second Quarter . . . . . . . . . . . . . . 13.65 6.11 0.07 Third Quarter . . . . . . . . . . . . . . . 9.66 4.45 0.07 Fourth Quarter . . . . . . . . . . . . . . 6.43 2.59 0.07 Fiscal Year ended May 3, 2008 First Quarter . . . . . . . . . . . . . . . . $ 18.90 $ 14.30 $ 0.05 Second Quarter . . . . . . . . . . . . . . 17.04 10.27 0.05 Third Quarter . . . . . . . . . . . . . . . 16.94 10.53 0.05 Fourth Quarter . . . . . . . . . . . . . . 12.95 9.89 0.05
On June 23, 2009, the Board declared a dividend of $0.07 per share of common stock, payable on July 31, 2009, to holders of record on July 17, 2009.
As of July 1, 2009, the number of record holders of our common stock was 636.
Equity Compensation Plan Information
The following table provides information about shares of our common stock that may be issued upon exercise of stock options or granting of stock awards under all of the existing equity compensation plans as of May 2, 2009.
Plan category
Number of securities to be issued upon
exercise of outstanding options, warrants and rights
Weighted-average exercise price of
outstanding options, warrants and rights
Number of securities remaining available for future issuance
under equity compensation plans (excluding securities reflected in the first
column) Equity compensation plans approved by security holders 910,633 $7.97 394,718 Equity compensation plans not approved by security holders - - - Total 910,633 $7.97 394,718
10k.indd 10 7/16/09 1:18:03 PM

10 1110
Item 3. Legal Proceedings
As of July 2, 2009, we were not involved in any material legal proceedings or any legal proceedings or material administrative proceedings with governmental authorities pertaining to the discharge of materials into the environment or otherwise.
Executive Officers of the Registrant
Name Age Offices and Positions Held and Length of Service as OfficerDonald W. Duda 54 Chief Executive Officer of the Company since May 1, 2004.
President and Director of the Company since February 2001. Prior thereto Mr. Duda was Vice President-Interconnect Group since March 2000. Prior thereto Mr. Duda was with Amphenol Corporation through November 1998 as General Manager of its Fiber Optic Products Division since 1988.
Douglas A. Koman 59 Chief Financial Officer of the Company since May 1, 2004. Vice
President, Corporate Finance, of the Company since April 2001. Prior thereto Mr. Koman was Assistant Vice President-Financial Analysis since December 2000. Prior thereto Mr. Koman was with Illinois Central Corporation through March 2000 as Controller since November 1997 and Treasurer since July 1991.
Thomas D. Reynolds 46 Senior Vice President, Worldwide Automotive Operations, of the
Company since September 14, 2006. Vice President and General Manager, North American Automotive Operations, of the Company since October 2001. Prior thereto Mr. Reynolds was with Donnelly Corporation through October 2001 as Senior Manager of Operations since 1999, and as Director of Transnational Business Unit from 1995 to 1999.
Timothy R. Glandon 45 Vice President and General Manager, North American
Automotive, of the Company since September 14, 2006. Prior thereto Mr. Glandon was General Manager of Automotive Safety Technologies since August 1, 2001. Prior thereto Mr. Glandon was Vice President and General Manager with American Components, Inc. from 1996 to 2001.
Theodore D. Kill 58 Vice President, Worldwide Automotive Sales, of the Company
since August 2006. Prior thereto Mr. Kill was a principal with Kill and Associates from 2003 to 2006. Prior thereto Mr. Kill was a principal with Kill and Bolton Associates from 1995 to 2003.
Ronald L.G. Tsoumas 48 Controller and Treasurer of the Company since September 2007.
Prior thereto Mr. Tsoumas was Assistant Controller of the Company since July 1998.
All executive officers are elected by the Board of Directors and serve a term of one year or until their successors are duly elected and qualified.
11
PART II
Item 5. Market for Registrant’s Common Equity, Related Stockholder Matters and Issuer Purchases of Equity Securities
The following is a tabulation of high and low sales prices for the periods indicated as reported by the New York Stock Exchange.
Dividends Sales Price Per Share Paid High Low Per ShareFiscal Year ended May 2, 2009 First Quarter . . . . . . . . . . . . . . . . $ 12.51 $ 9.50 $ 0.05 Second Quarter . . . . . . . . . . . . . . 13.65 6.11 0.07 Third Quarter . . . . . . . . . . . . . . . 9.66 4.45 0.07 Fourth Quarter . . . . . . . . . . . . . . 6.43 2.59 0.07 Fiscal Year ended May 3, 2008 First Quarter . . . . . . . . . . . . . . . . $ 18.90 $ 14.30 $ 0.05 Second Quarter . . . . . . . . . . . . . . 17.04 10.27 0.05 Third Quarter . . . . . . . . . . . . . . . 16.94 10.53 0.05 Fourth Quarter . . . . . . . . . . . . . . 12.95 9.89 0.05
On June 23, 2009, the Board declared a dividend of $0.07 per share of common stock, payable on July 31, 2009, to holders of record on July 17, 2009.
As of July 1, 2009, the number of record holders of our common stock was 636.
Equity Compensation Plan Information
The following table provides information about shares of our common stock that may be issued upon exercise of stock options or granting of stock awards under all of the existing equity compensation plans as of May 2, 2009.
Plan category
Number of securities to be issued upon
exercise of outstanding options, warrants and rights
Weighted-average exercise price of
outstanding options, warrants and rights
Number of securities remaining available for future issuance
under equity compensation plans (excluding securities reflected in the first
column) Equity compensation plans approved by security holders 910,633 $7.97 394,718 Equity compensation plans not approved by security holders - - - Total 910,633 $7.97 394,718
10k.indd 11 7/16/09 1:18:04 PM

12 1312
Purchase of Equity Securities by the Company and Affiliated Purchasers
Total Number of Maximum Number of Total Shares Purchased as Shares that Number of Average Part of Publicly May Yet Be Purchased Shares Price Paid Announced Plans Under the Plans or Period Purchased (1) Per Share or Programs (2) Programs (2)
February 1, 2009 through February 28, 2009 297 $ 4.62 - 2,360,120
March 1, 2009 through April 4, 2009 29,600 $3.88 29,600 2,330,520
April 5, 2009 through May 2, 2009 14,252 $ 6.20 - 2,330,520
44,149 $ 4.63 29,600 2,330,520
(1) The amount includes the repurchase and cancellation of shares of common stock redeemed by the Company for the payment of minimum withholding taxes on the value of restricted stock awards vesting during the period.
(2) On September 18, 2008, the Board of Directors adopted a plan to repurchase up to 3 million shares of its common stock. The plan will expire on May 1, 2010.
13
Item 6. Selected Financial Data
The following selected financial data should be read in conjunction with “Management’s Discussion and Analysis of Financial Condition and Results of Operations” and the Company’s Consolidated Financial Statements and related notes included elsewhere in this report. The consolidated statement of operations data for fiscal 2009, 2008 and 2007, and the consolidated balance sheet data as of May 2, 2009 and May 3, 2008, are derived from, and are qualified by reference to, the Company’s audited Consolidated Financial Statements included elsewhere in this report. The consolidated statement of operations data for fiscal 2006 and 2005, and the consolidated balance sheet data as of April 28, 2007, April 29, 2006 and April 30, 2005, are derived from audited consolidated financial statements not included in this report. Due to the timing of our fiscal calendar, fiscal 2008 represents 53 weeks of results. Fiscal 2009, 2007, 2006 and 2005 represent 52 weeks of results.
May 2, May 3, April 28, April 29, April 30,2009 2008 (53 wks) 2007 2006 2005
Income Statement Data:Net sales 425.6$ 551.1$ 448.4$ 421.6$ 392.7$Income/(loss) before income taxes and cumulative affect of accounting change (110.8) (1) 49.5 (2) 35.8 (3) 32.4 (4) 38.4 (5)
Income taxes 1.7 (1) 9.7 (2) 9.8 (3) 15.3 (4) 12.9 (5)
Cumulative effect of accounting change - - 0.1 - -Net income/(loss) (112.5) (1) 39.8 (2) 26.1 (3) 17.0 (4) 25.5 (5)
Per Common Share:Basic net income/(loss) (3.05) (1) 1.07 (2) 0.72 (3) 0.47 (4) 0.71 (5)
Diluted net income/(loss) (3.05) (1) 1.06 (2) 0.71 (3) 0.47 (4) 0.71 (5)
Dividends 0.26 0.20 0.20 0.20 0.20Book Value 6.28 9.93 8.69 7.82 7.62
Long-term Debt - - - - -Retained Earnings 143.6 265.8 233.7 215.1 205.5Fixed Assets (net) 69.9 90.3 86.9 90.5 92.6Total Assets 305.3 470.2 411.7 374.6 356.7Return on Average Equity -37.2% (1) 11.4% (2) 8.5% (3) 5.9% (4) 9.6% (5)
Pre-tax Income/(loss) as a Percentage of Sales -26.0% (1) 9.0% (2) 8.0% (3) 7.7% (4) 9.8% (5)
Net Income/(loss) as a Percentage of Sales -26.4% (1) 7.2% (2) 5.8% (3) 4.0% (4) 6.5% (5)
Fiscal Year Ended
(In Millions, Except Percentages and Per Share Amounts)
(1) Fiscal 2009 results include a pre-tax charge of $94.4 million relating to goodwill and other asset impairments. In addition, fiscal 2009 results include a pre-tax charge of $25.3 million relating to restructuring activities. The income tax expense includes a $28.0 million valuation charge related to the uncertainty of the future realization of our deferred tax assets.
(2) Fiscal 2008 results include a pre-tax charge of $5.2 million relating to a restructuring of our U.S.-based automotive operations and the decision to discontinue producing certain legacy products in the Interconnect segment.
(3) Fiscal 2007 results include a pre-tax and an after-tax restructuring charge of $2.0 million related to the closing of our Scotland automotive parts manufacturing plant and transfer of production lines from that facility to our automotive parts manufacturing facility in Malta.
(4) Fiscal 2006 results include $4.5 million of income tax expense related to the repatriation of $38.1 million of foreign earnings for which income taxes were not previously provided, and an after-tax charge of $1.5 million ($2.3 million pre-tax) related to receivables deemed to be impaired due to the Chapter 11 bankruptcy filing by Delphi.
(5) Fiscal 2005 results include $1.0 million of tax-free income from life insurance proceeds.
10k.indd 12 7/16/09 1:18:04 PM
12 1312
Purchase of Equity Securities by the Company and Affiliated Purchasers
Total Number of Maximum Number of Total Shares Purchased as Shares that Number of Average Part of Publicly May Yet Be Purchased Shares Price Paid Announced Plans Under the Plans or Period Purchased (1) Per Share or Programs (2) Programs (2)
February 1, 2009 through February 28, 2009 297 $ 4.62 - 2,360,120
March 1, 2009 through April 4, 2009 29,600 $3.88 29,600 2,330,520
April 5, 2009 through May 2, 2009 14,252 $ 6.20 - 2,330,520
44,149 $ 4.63 29,600 2,330,520
(1) The amount includes the repurchase and cancellation of shares of common stock redeemed by the Company for the payment of minimum withholding taxes on the value of restricted stock awards vesting during the period.
(2) On September 18, 2008, the Board of Directors adopted a plan to repurchase up to 3 million shares of its common stock. The plan will expire on May 1, 2010.
13
Item 6. Selected Financial Data
The following selected financial data should be read in conjunction with “Management’s Discussion and Analysis of Financial Condition and Results of Operations” and the Company’s Consolidated Financial Statements and related notes included elsewhere in this report. The consolidated statement of operations data for fiscal 2009, 2008 and 2007, and the consolidated balance sheet data as of May 2, 2009 and May 3, 2008, are derived from, and are qualified by reference to, the Company’s audited Consolidated Financial Statements included elsewhere in this report. The consolidated statement of operations data for fiscal 2006 and 2005, and the consolidated balance sheet data as of April 28, 2007, April 29, 2006 and April 30, 2005, are derived from audited consolidated financial statements not included in this report. Due to the timing of our fiscal calendar, fiscal 2008 represents 53 weeks of results. Fiscal 2009, 2007, 2006 and 2005 represent 52 weeks of results.
May 2, May 3, April 28, April 29, April 30,2009 2008 (53 wks) 2007 2006 2005
Income Statement Data:Net sales 425.6$ 551.1$ 448.4$ 421.6$ 392.7$Income/(loss) before income taxes and cumulative affect of accounting change (110.8) (1) 49.5 (2) 35.8 (3) 32.4 (4) 38.4 (5)
Income taxes 1.7 (1) 9.7 (2) 9.8 (3) 15.3 (4) 12.9 (5)
Cumulative effect of accounting change - - 0.1 - -Net income/(loss) (112.5) (1) 39.8 (2) 26.1 (3) 17.0 (4) 25.5 (5)
Per Common Share:Basic net income/(loss) (3.05) (1) 1.07 (2) 0.72 (3) 0.47 (4) 0.71 (5)
Diluted net income/(loss) (3.05) (1) 1.06 (2) 0.71 (3) 0.47 (4) 0.71 (5)
Dividends 0.26 0.20 0.20 0.20 0.20Book Value 6.28 9.93 8.69 7.82 7.62
Long-term Debt - - - - -Retained Earnings 143.6 265.8 233.7 215.1 205.5Fixed Assets (net) 69.9 90.3 86.9 90.5 92.6Total Assets 305.3 470.2 411.7 374.6 356.7Return on Average Equity -37.2% (1) 11.4% (2) 8.5% (3) 5.9% (4) 9.6% (5)
Pre-tax Income/(loss) as a Percentage of Sales -26.0% (1) 9.0% (2) 8.0% (3) 7.7% (4) 9.8% (5)
Net Income/(loss) as a Percentage of Sales -26.4% (1) 7.2% (2) 5.8% (3) 4.0% (4) 6.5% (5)
Fiscal Year Ended
(In Millions, Except Percentages and Per Share Amounts)
(1) Fiscal 2009 results include a pre-tax charge of $94.4 million relating to goodwill and other asset impairments. In addition, fiscal 2009 results include a pre-tax charge of $25.3 million relating to restructuring activities. The income tax expense includes a $28.0 million valuation charge related to the uncertainty of the future realization of our deferred tax assets.
(2) Fiscal 2008 results include a pre-tax charge of $5.2 million relating to a restructuring of our U.S.-based automotive operations and the decision to discontinue producing certain legacy products in the Interconnect segment.
(3) Fiscal 2007 results include a pre-tax and an after-tax restructuring charge of $2.0 million related to the closing of our Scotland automotive parts manufacturing plant and transfer of production lines from that facility to our automotive parts manufacturing facility in Malta.
(4) Fiscal 2006 results include $4.5 million of income tax expense related to the repatriation of $38.1 million of foreign earnings for which income taxes were not previously provided, and an after-tax charge of $1.5 million ($2.3 million pre-tax) related to receivables deemed to be impaired due to the Chapter 11 bankruptcy filing by Delphi.
(5) Fiscal 2005 results include $1.0 million of tax-free income from life insurance proceeds.
10k.indd 13 7/16/09 1:18:05 PM
14 1514
Item 7. Management’s Discussion and Analysis of Financial Condition and Results of Operations
Overview
We are a global manufacturer of component and subsystem devices with manufacturing, design and testing facilities in China, Czech Republic, Germany, Malta, Mexico, the Philippines, Singapore, the United Kingdom and the United States. We are a global designer and manufacturer of electro-mechanical devices. We design, manufacture and market devices employing electrical, radio remote control, electronic, wireless, sensing and optical technologies. Our business is managed on a segment basis, with those segments being Automotive, Interconnect, Power Products and Other. For more information regarding the business and products of these segments, see “Item 1. Business.”
Our components are found in the primary end markets of the aerospace, appliance, automotive, consumer and industrial equipment markets, communications (including information processing and storage, networking equipment, wireless and terrestrial voice/data systems), rail and other transportation industries. Recent trends in the industries that we serve include:
Automotive industry sales volume in the United States and European markets declined suddenly and substantially in fiscal 2009 and continue at historically low levels into fiscal 2010;
The deteriorating condition of certain of our customers and the uncertainty as they undergo restructuring initiatives, including in some cases, reorganization under bankruptcy laws;
Decline in demand for new houses and the over-supply of new and existing houses;
Demand for construction and material handling equipment is cyclical and has been impacted by the weakness of the economy, availability of credit and higher interest rates;
Our business has been and will likely continue to be materially adversely affected by the current economic environment, particularly as it impacts the automotive industry. The recent disruptions in global financial and credit markets have significantly impacted global economic activity and led to an economic recession. As a result of these disruptions, our customers and markets have been adversely affected. We have recently experienced a significant drop in sales in all of our reporting segments. If we experience reduced demand because of these disruptions in the macroeconomic environment or other factors, our business, results of operation and financial condition could be materially adversely affected. If we are unable to successfully anticipate changing economic and financial conditions, we may be unable to effectively plan for and respond to these changes and our business could be adversely affected.
We review our goodwill and other intangible assets for impairment whenever events or changes in circumstances indicate that the carrying amount of these assets may not be recoverable, and we also review our goodwill annually in accordance with SFAS No. 142, “Goodwill and Other Intangibles”. The values assigned to goodwill and intangible assets are normally based on estimates and judgments regarding expectations for the success and life cycle of products and technologies acquired. A severe decline in expectations, future cash flows, a change in strategic direction or our market capitalization remaining below our net book value for a significant period of time could result in significant impairment charges, which could have a material adverse effect on our financial condition and results of operations. Based on events and general business declines, we performed “step one” of the goodwill impairment test in accordance with paragraph 19 of SFAS No. 142, on the reporting units that have goodwill during fiscal 2009. Based on this test, we determined that the fair value was less than the carrying value of the net assets for certain reporting units. We completed “step two” of the goodwill test and concluded that goodwill was impaired. Therefore, during fiscal 2009, we recorded a goodwill impairment charge of $25.8 million in our Automotive segment, $30.8 million in our Interconnect segment, $5.4 million in our Power Products segment and $1.2 million in our Other segment for a total of $63.2 million related to these assets.
Also, in accordance with FASB Statement No. 144, “Accounting for the Impairment or Disposal of Long-Lived Assets”, we record impairment losses on long-lived assets used in operations when events and circumstances indicate that long-lived assets might be impaired and the undiscounted cash flows estimated to be generated by those assets are less than the carrying amounts of those assets. During fiscal 2009, based on our future estimates of the
15
Overview - Continued
undiscounted cash flows, it was determined that certain identifiable assets of our TouchSensor and Hetronic businesses in the Interconnect segment, the Automotive Safety Technologies business in our Automotive segment and Magna-Lastic Devices, Inc. from our Other segment were impaired. Therefore, we recorded an impairment charge of $26.2 million in the Interconnect segment, $4.6 million in the Automotive segment and $0.4 million in the Other segment for a total of $31.2 million for these assets.
On September 30, 2008, we acquired certain assets of Hetronic LLC (Hetronic) for $53.6 million in cash. We also incurred $2.4 million in transaction costs related to the purchase. Hetronic is a global leader in industrial safety radio remote controls with locations in the U.S., Malta, the Philippines and Germany. Hetronic is represented in 45 countries by direct sales associates, licensed partners, distributors and representatives. Hetronic provides application specific and standard controls to many different industries, such as material handling, transportation, mining, military, agriculture and construction.
On January 24, 2008, we announced a restructuring of our U.S.-based automotive operations and a decision to discontinue producing certain legacy products in the Interconnect segment. The Automotive and Interconnect restructuring is expected to be completed during fiscal 2010. We record the expense in the restructuring section of our Consolidated Statement of Operations. On January 24, 2008, the total pre-tax charges were estimated between $19.0 million and $25.0 million. As of May 2, 2009, we have recorded $23.2 million of the charges. We estimate that we will record pre-tax restructuring charges in fiscal 2010 between $0.5 million and $1.5 million, of which $0.5 million will relate to the termination of approximately 225 employees and the cost of one-time employee benefits, retention, COBRA and outplacement services. We continue to perform periodic impairment testing, if indicators exist, and will record any charges incurred as per SFAS No. 144, ”Accounting for the Impairment or Disposal of Long-Lived Assets”, (“SFAS No. 144”) in the period when impairment is incurred.
On March 12, 2009, we announced several additional restructuring actions to further reduce our exposure to the North American automotive industry and to consolidate manufacturing facilities in lower cost regions to reduce costs. After these actions our principal manufacturing operations will be in Mexico, Malta and China. In addition, we decided to transfer certain new GM business to other suppliers. This business was scheduled to be produced in our Shanghai, China automotive facility.
All Ford Motor Company production at Methode's Reynosa, Mexico, facility will be moved to another supplier. TouchSensor manufacturing currently in west suburban Chicago, Illinois, will be moved to Monterrey, Mexico. Additionally, our operations in Shanghai, China, will be consolidated to two facilities from three. The addition of a plant in Morocco has been put on indefinite hold.
In total, this additional restructuring will affect approximately 850 employees worldwide. We estimate that we will record a pre-tax charge between $16.0 million and $25.0 million, during fiscal years 2009 and 2010. The cash portion of this charge is estimated between $7.0 million and $8.0 million. We estimate that we will record pre-tax restructuring charges in fiscal 2010 between $8.7 million and $17.7 million.
Business Outlook We are very cautious about fiscal 2010, expecting that it will be another challenging year. The financial
sector crisis and stagnant global economic conditions have increased uncertainty in the markets in every geographic region we serve. We expect the unprecedented current global economic environment to continue to affect near-term results and to create difficult conditions. Looking forward, visibility is low and forecasting is very challenging. Sales of Automotive segment products are expected to decline, as our forecasted sales from North American and European automotive OEMs are lower. Additionally, we took actions in fiscal 2008 and 2009 to exit certain unprofitable or marginally profitable North American automotive business. Sales of sensor pads for passive occupant-detection systems are expected to decline due to lower North American automotive volumes, and as the current systems are replaced, with new technology. We expect sales declines in the Interconnect and Power Products segments as well as demand for information processing and networking equipment, construction, voice and data communications systems, consumer electronics, appliance, aerospace vehicles and industrial equipment to be stagnant. In our Interconnect segment, sales from our Hetronic acquisition will be offset by sales lost due to our decision to exit certain unprofitable component products in fiscal 2009. While we have taken steps to restructure our businesses, operating margin improvement will not be realized until economic conditions begin to improve.
Results may differ materially from what is expressed or forecasted. See “ Item 1A Risk Factors” herein.
10k.indd 14 7/16/09 1:18:05 PM

14 1514
Item 7. Management’s Discussion and Analysis of Financial Condition and Results of Operations
Overview
We are a global manufacturer of component and subsystem devices with manufacturing, design and testing facilities in China, Czech Republic, Germany, Malta, Mexico, the Philippines, Singapore, the United Kingdom and the United States. We are a global designer and manufacturer of electro-mechanical devices. We design, manufacture and market devices employing electrical, radio remote control, electronic, wireless, sensing and optical technologies. Our business is managed on a segment basis, with those segments being Automotive, Interconnect, Power Products and Other. For more information regarding the business and products of these segments, see “Item 1. Business.”
Our components are found in the primary end markets of the aerospace, appliance, automotive, consumer and industrial equipment markets, communications (including information processing and storage, networking equipment, wireless and terrestrial voice/data systems), rail and other transportation industries. Recent trends in the industries that we serve include:
Automotive industry sales volume in the United States and European markets declined suddenly and substantially in fiscal 2009 and continue at historically low levels into fiscal 2010;
The deteriorating condition of certain of our customers and the uncertainty as they undergo restructuring initiatives, including in some cases, reorganization under bankruptcy laws;
Decline in demand for new houses and the over-supply of new and existing houses;
Demand for construction and material handling equipment is cyclical and has been impacted by the weakness of the economy, availability of credit and higher interest rates;
Our business has been and will likely continue to be materially adversely affected by the current economic environment, particularly as it impacts the automotive industry. The recent disruptions in global financial and credit markets have significantly impacted global economic activity and led to an economic recession. As a result of these disruptions, our customers and markets have been adversely affected. We have recently experienced a significant drop in sales in all of our reporting segments. If we experience reduced demand because of these disruptions in the macroeconomic environment or other factors, our business, results of operation and financial condition could be materially adversely affected. If we are unable to successfully anticipate changing economic and financial conditions, we may be unable to effectively plan for and respond to these changes and our business could be adversely affected.
We review our goodwill and other intangible assets for impairment whenever events or changes in circumstances indicate that the carrying amount of these assets may not be recoverable, and we also review our goodwill annually in accordance with SFAS No. 142, “Goodwill and Other Intangibles”. The values assigned to goodwill and intangible assets are normally based on estimates and judgments regarding expectations for the success and life cycle of products and technologies acquired. A severe decline in expectations, future cash flows, a change in strategic direction or our market capitalization remaining below our net book value for a significant period of time could result in significant impairment charges, which could have a material adverse effect on our financial condition and results of operations. Based on events and general business declines, we performed “step one” of the goodwill impairment test in accordance with paragraph 19 of SFAS No. 142, on the reporting units that have goodwill during fiscal 2009. Based on this test, we determined that the fair value was less than the carrying value of the net assets for certain reporting units. We completed “step two” of the goodwill test and concluded that goodwill was impaired. Therefore, during fiscal 2009, we recorded a goodwill impairment charge of $25.8 million in our Automotive segment, $30.8 million in our Interconnect segment, $5.4 million in our Power Products segment and $1.2 million in our Other segment for a total of $63.2 million related to these assets.
Also, in accordance with FASB Statement No. 144, “Accounting for the Impairment or Disposal of Long-Lived Assets”, we record impairment losses on long-lived assets used in operations when events and circumstances indicate that long-lived assets might be impaired and the undiscounted cash flows estimated to be generated by those assets are less than the carrying amounts of those assets. During fiscal 2009, based on our future estimates of the
15
Overview - Continued
undiscounted cash flows, it was determined that certain identifiable assets of our TouchSensor and Hetronic businesses in the Interconnect segment, the Automotive Safety Technologies business in our Automotive segment and Magna-Lastic Devices, Inc. from our Other segment were impaired. Therefore, we recorded an impairment charge of $26.2 million in the Interconnect segment, $4.6 million in the Automotive segment and $0.4 million in the Other segment for a total of $31.2 million for these assets.
On September 30, 2008, we acquired certain assets of Hetronic LLC (Hetronic) for $53.6 million in cash. We also incurred $2.4 million in transaction costs related to the purchase. Hetronic is a global leader in industrial safety radio remote controls with locations in the U.S., Malta, the Philippines and Germany. Hetronic is represented in 45 countries by direct sales associates, licensed partners, distributors and representatives. Hetronic provides application specific and standard controls to many different industries, such as material handling, transportation, mining, military, agriculture and construction.
On January 24, 2008, we announced a restructuring of our U.S.-based automotive operations and a decision to discontinue producing certain legacy products in the Interconnect segment. The Automotive and Interconnect restructuring is expected to be completed during fiscal 2010. We record the expense in the restructuring section of our Consolidated Statement of Operations. On January 24, 2008, the total pre-tax charges were estimated between $19.0 million and $25.0 million. As of May 2, 2009, we have recorded $23.2 million of the charges. We estimate that we will record pre-tax restructuring charges in fiscal 2010 between $0.5 million and $1.5 million, of which $0.5 million will relate to the termination of approximately 225 employees and the cost of one-time employee benefits, retention, COBRA and outplacement services. We continue to perform periodic impairment testing, if indicators exist, and will record any charges incurred as per SFAS No. 144, ”Accounting for the Impairment or Disposal of Long-Lived Assets”, (“SFAS No. 144”) in the period when impairment is incurred.
On March 12, 2009, we announced several additional restructuring actions to further reduce our exposure to the North American automotive industry and to consolidate manufacturing facilities in lower cost regions to reduce costs. After these actions our principal manufacturing operations will be in Mexico, Malta and China. In addition, we decided to transfer certain new GM business to other suppliers. This business was scheduled to be produced in our Shanghai, China automotive facility.
All Ford Motor Company production at Methode's Reynosa, Mexico, facility will be moved to another supplier. TouchSensor manufacturing currently in west suburban Chicago, Illinois, will be moved to Monterrey, Mexico. Additionally, our operations in Shanghai, China, will be consolidated to two facilities from three. The addition of a plant in Morocco has been put on indefinite hold.
In total, this additional restructuring will affect approximately 850 employees worldwide. We estimate that we will record a pre-tax charge between $16.0 million and $25.0 million, during fiscal years 2009 and 2010. The cash portion of this charge is estimated between $7.0 million and $8.0 million. We estimate that we will record pre-tax restructuring charges in fiscal 2010 between $8.7 million and $17.7 million.
Business Outlook We are very cautious about fiscal 2010, expecting that it will be another challenging year. The financial
sector crisis and stagnant global economic conditions have increased uncertainty in the markets in every geographic region we serve. We expect the unprecedented current global economic environment to continue to affect near-term results and to create difficult conditions. Looking forward, visibility is low and forecasting is very challenging. Sales of Automotive segment products are expected to decline, as our forecasted sales from North American and European automotive OEMs are lower. Additionally, we took actions in fiscal 2008 and 2009 to exit certain unprofitable or marginally profitable North American automotive business. Sales of sensor pads for passive occupant-detection systems are expected to decline due to lower North American automotive volumes, and as the current systems are replaced, with new technology. We expect sales declines in the Interconnect and Power Products segments as well as demand for information processing and networking equipment, construction, voice and data communications systems, consumer electronics, appliance, aerospace vehicles and industrial equipment to be stagnant. In our Interconnect segment, sales from our Hetronic acquisition will be offset by sales lost due to our decision to exit certain unprofitable component products in fiscal 2009. While we have taken steps to restructure our businesses, operating margin improvement will not be realized until economic conditions begin to improve.
Results may differ materially from what is expressed or forecasted. See “ Item 1A Risk Factors” herein.
10k.indd 15 7/16/09 1:18:06 PM

16 1716
Results of Operations
Results of Operations for the Fiscal Year Ended May 2, 2009 (52 weeks) as Compared to the Fiscal Year Ended May 3, 2008 (53 weeks)
Consolidated Results
Below is a table summarizing results for the years ended:(in millions)
May 2, May 3,2009 2008 Net Change Net Change
Net sales 425.6$ 551.1$ (125.5)$ -22.8%Other income 3.2 1.9 1.3 68.5%
428.8 553.0 (124.2) -22.5%
Cost of products sold 356.4 428.4 (72.0) -16.8%
Gross margins (including other income) 72.4 124.6 (52.2) -41.9%
Restructuring 25.3 5.2 20.1 386.5%Impairment of goodwill and other assets 94.4 1.5 92.9 6193.3%Selling and administrative expenses 57.5 61.5 (4.0) -6.5%Amortization of intangibles 6.9 6.0 0.9 15.0%Interest income, net 1.4 2.3 (0.9) -39.9%Other, net - expense (0.5) (3.2) 2.7 -85.0%Income taxes - expense 1.7 9.7 (8.0) -82.7%
Net income/(loss) (112.5)$ 39.8$ (152.3)$ -382.6%
May 2, May 3,Percent of sales: 2009 2008Net sales 100.0% 100.0%Other income 0.8% 0.3%Cost of products sold 83.7% 77.7%Gross margins (including other income) 17.0% 22.6%Restructuring 5.9% 0.9%Impairment of goodwill and other assets 22.2% 0.3%Selling and administrative expenses 13.5% 11.2%Amortization of intangibles 1.6% 1.1%Interest income, net 0.3% 0.4%Other, net - expense -0.1% -0.6%Income taxes - expense 0.4% 1.8%Net income/(loss) -26.4% 7.2%
Net Sales. Consolidated net sales decreased $125.5 million, or 22.8%, to $425.6 million for the fiscal year ended May 2, 2009 from $551.1 million for the fiscal year ended May 3, 2008. The Automotive segment net sales declined $118.5 million or 32.7% to $243.6 million for fiscal 2009 from $362.1 million for fiscal 2008. The decline is attributable to the softening of the global economic environment, especially the effect on the automotive industry. The Automotive segment net sales were also negatively impacted by planned lower Chrysler sales volumes of $14.8 million in fiscal 2009, compared to $59.2 million in fiscal 2008. In July 2007, we decided to exit production for certain Chrysler products at the expiration of our manufacturing commitment. The transfer of the Chrysler product was completed during the second quarter of fiscal 2009. Excluding Chrysler, the North American Automotive segment net sales declined 18.5% in fiscal 2009, as compared to fiscal 2008. The Interconnect segment net sales
17
Consolidated Results - Continued
decreased $5.3 million, or 3.9% to $131.0 million in fiscal 2009 as compared to $136.3 million in fiscal 2008. The Interconnect segment net sales were favorably impacted by the Hetronic acquisition, which was purchased on September 30, 2008, offset by lower sales in the other Interconnect businesses. The Power Products segment net sales decreased $3.1 million to $42.7 million in fiscal 2009, compared to $45.8 million in fiscal 2008. Translation of net sales from our foreign operations increased reported net sales by $1.6 million or 0.4% due to currency rate fluctuations.
Other Income. Other income increased $1.3 million to $3.2 million for the fiscal year ended May 2, 2009 from $1.9 million for the fiscal year ended May 3, 2008. Other income consisted primarily of earnings from engineering design fees and royalties.
Cost of Products Sold. Consolidated cost of products sold decreased $72.0 million, or 16.8%, to $356.4 million for the fiscal year ended May 2, 2009 from $428.4 million for the fiscal year ended May 3, 2008. The decrease is due to the lower sales volumes. Consolidated cost of products sold as a percentage of sales was 83.7% for fiscal 2009 and 77.7% for fiscal 2008. This increase relates to manufacturing inefficiencies experienced in the third and fourth quarters of fiscal 2009 due to a significant, unexpected drop in sales, in addition to the drop in the planned sales to Chrysler. A large portion of the drop in sales is due to the North American automotive manufacturers extending plant shutdowns that occurred during the second half of fiscal 2009.
Gross Margins (including other income). Consolidated gross margins (including other income) decreased $52.2 million, or 41.9%, to $72.4 million for the fiscal year ended May 2, 2009 as compared to $124.6 million for the fiscal year ended May 3, 2008. Gross margins as a percentage of net sales were 17.0% for fiscal 2009 and 22.6% for fiscal 2008. Gross margins were impacted negatively due to manufacturing inefficiencies during the third and fourth quarters of fiscal 2009 related to significantly lower sales volumes. In addition, gross margins were impacted due to unfavorable product mix and production costs for the Power Products segment.
Restructuring. On January 24, 2008, we announced a restructuring of our U.S.-based automotive operations and the decision to discontinue producing certain legacy products in the Interconnect segment. During the fiscal year ended May 2, 2009, we recorded a restructuring charge of $18.0 million, which consisted of $6.1 million for employee severance, $10.8 million for impairment and accelerated depreciation for buildings and improvements and machinery and equipment, $0.2 million for inventory write-downs and $0.9 million relating to professional fees. During fiscal 2008, we recorded restructuring charges of $5.2 million, which consisted of $3.4 million for employee severance, $1.3 million for asset write-downs and $0.5 million for professional fees.
On March 12, 2009, we announced several additional restructuring actions to further reduce our exposure to the North American automotive industry and to consolidate manufacturing facilities in lower cost regions to reduce costs. During the fiscal year ended May 2, 2009, we recorded a restructuring charge of $7.3 million, which consisted of $0.1 million for employee severance, $1.4 million for impairment and accelerated depreciation for buildings and improvements and machinery and equipment, $5.4 million for impairment of customer funded tooling and $0.1 million in forfeited security deposits related to the cancellation of the new GM business and $0.3 million relating to professional fees.
Impairment of Goodwill and Other Assets. We review our goodwill and other intangible assets for impairment whenever events or changes in circumstances indicate that the carrying amount of these assets may not be recoverable, and we also review our goodwill annually in accordance with SFAS No. 142, “Goodwill and Other Intangibles”. The values assigned to goodwill and intangible assets are normally based on estimates and judgments regarding expectations for the success and life cycle of products and technologies acquired. A severe decline in expectations, future cash flows, a change in strategic direction or our market capitalization remaining below our net book value for a significant period of time could result in significant impairment charges, which could have a material adverse effect on our financial condition and results of operations. Based on events and general business declines, we performed “step one” of the goodwill impairment test in accordance with paragraph 19 of SFAS No. 142, on the reporting units that had goodwill during fiscal 2009. Based on this test, we determined that the fair value was less than the carrying value of the net assets for certain reporting units. We completed “step two” of the goodwill test and concluded that goodwill was impaired. During fiscal 2009, we recorded a goodwill impairment charge of $25.8 million in our Automotive segment, $30.8 million in our Interconnect segment, $5.4 million in our Power Products segment and $1.2 million in our Other segment for a total of $63.2 million related to these assets.
10k.indd 16 7/16/09 1:18:07 PM

16 1716
Results of Operations
Results of Operations for the Fiscal Year Ended May 2, 2009 (52 weeks) as Compared to the Fiscal Year Ended May 3, 2008 (53 weeks)
Consolidated Results
Below is a table summarizing results for the years ended:(in millions)
May 2, May 3,2009 2008 Net Change Net Change
Net sales 425.6$ 551.1$ (125.5)$ -22.8%Other income 3.2 1.9 1.3 68.5%
428.8 553.0 (124.2) -22.5%
Cost of products sold 356.4 428.4 (72.0) -16.8%
Gross margins (including other income) 72.4 124.6 (52.2) -41.9%
Restructuring 25.3 5.2 20.1 386.5%Impairment of goodwill and other assets 94.4 1.5 92.9 6193.3%Selling and administrative expenses 57.5 61.5 (4.0) -6.5%Amortization of intangibles 6.9 6.0 0.9 15.0%Interest income, net 1.4 2.3 (0.9) -39.9%Other, net - expense (0.5) (3.2) 2.7 -85.0%Income taxes - expense 1.7 9.7 (8.0) -82.7%
Net income/(loss) (112.5)$ 39.8$ (152.3)$ -382.6%
May 2, May 3,Percent of sales: 2009 2008Net sales 100.0% 100.0%Other income 0.8% 0.3%Cost of products sold 83.7% 77.7%Gross margins (including other income) 17.0% 22.6%Restructuring 5.9% 0.9%Impairment of goodwill and other assets 22.2% 0.3%Selling and administrative expenses 13.5% 11.2%Amortization of intangibles 1.6% 1.1%Interest income, net 0.3% 0.4%Other, net - expense -0.1% -0.6%Income taxes - expense 0.4% 1.8%Net income/(loss) -26.4% 7.2%
Net Sales. Consolidated net sales decreased $125.5 million, or 22.8%, to $425.6 million for the fiscal year ended May 2, 2009 from $551.1 million for the fiscal year ended May 3, 2008. The Automotive segment net sales declined $118.5 million or 32.7% to $243.6 million for fiscal 2009 from $362.1 million for fiscal 2008. The decline is attributable to the softening of the global economic environment, especially the effect on the automotive industry. The Automotive segment net sales were also negatively impacted by planned lower Chrysler sales volumes of $14.8 million in fiscal 2009, compared to $59.2 million in fiscal 2008. In July 2007, we decided to exit production for certain Chrysler products at the expiration of our manufacturing commitment. The transfer of the Chrysler product was completed during the second quarter of fiscal 2009. Excluding Chrysler, the North American Automotive segment net sales declined 18.5% in fiscal 2009, as compared to fiscal 2008. The Interconnect segment net sales
17
Consolidated Results - Continued
decreased $5.3 million, or 3.9% to $131.0 million in fiscal 2009 as compared to $136.3 million in fiscal 2008. The Interconnect segment net sales were favorably impacted by the Hetronic acquisition, which was purchased on September 30, 2008, offset by lower sales in the other Interconnect businesses. The Power Products segment net sales decreased $3.1 million to $42.7 million in fiscal 2009, compared to $45.8 million in fiscal 2008. Translation of net sales from our foreign operations increased reported net sales by $1.6 million or 0.4% due to currency rate fluctuations.
Other Income. Other income increased $1.3 million to $3.2 million for the fiscal year ended May 2, 2009 from $1.9 million for the fiscal year ended May 3, 2008. Other income consisted primarily of earnings from engineering design fees and royalties.
Cost of Products Sold. Consolidated cost of products sold decreased $72.0 million, or 16.8%, to $356.4 million for the fiscal year ended May 2, 2009 from $428.4 million for the fiscal year ended May 3, 2008. The decrease is due to the lower sales volumes. Consolidated cost of products sold as a percentage of sales was 83.7% for fiscal 2009 and 77.7% for fiscal 2008. This increase relates to manufacturing inefficiencies experienced in the third and fourth quarters of fiscal 2009 due to a significant, unexpected drop in sales, in addition to the drop in the planned sales to Chrysler. A large portion of the drop in sales is due to the North American automotive manufacturers extending plant shutdowns that occurred during the second half of fiscal 2009.
Gross Margins (including other income). Consolidated gross margins (including other income) decreased $52.2 million, or 41.9%, to $72.4 million for the fiscal year ended May 2, 2009 as compared to $124.6 million for the fiscal year ended May 3, 2008. Gross margins as a percentage of net sales were 17.0% for fiscal 2009 and 22.6% for fiscal 2008. Gross margins were impacted negatively due to manufacturing inefficiencies during the third and fourth quarters of fiscal 2009 related to significantly lower sales volumes. In addition, gross margins were impacted due to unfavorable product mix and production costs for the Power Products segment.
Restructuring. On January 24, 2008, we announced a restructuring of our U.S.-based automotive operations and the decision to discontinue producing certain legacy products in the Interconnect segment. During the fiscal year ended May 2, 2009, we recorded a restructuring charge of $18.0 million, which consisted of $6.1 million for employee severance, $10.8 million for impairment and accelerated depreciation for buildings and improvements and machinery and equipment, $0.2 million for inventory write-downs and $0.9 million relating to professional fees. During fiscal 2008, we recorded restructuring charges of $5.2 million, which consisted of $3.4 million for employee severance, $1.3 million for asset write-downs and $0.5 million for professional fees.
On March 12, 2009, we announced several additional restructuring actions to further reduce our exposure to the North American automotive industry and to consolidate manufacturing facilities in lower cost regions to reduce costs. During the fiscal year ended May 2, 2009, we recorded a restructuring charge of $7.3 million, which consisted of $0.1 million for employee severance, $1.4 million for impairment and accelerated depreciation for buildings and improvements and machinery and equipment, $5.4 million for impairment of customer funded tooling and $0.1 million in forfeited security deposits related to the cancellation of the new GM business and $0.3 million relating to professional fees.
Impairment of Goodwill and Other Assets. We review our goodwill and other intangible assets for impairment whenever events or changes in circumstances indicate that the carrying amount of these assets may not be recoverable, and we also review our goodwill annually in accordance with SFAS No. 142, “Goodwill and Other Intangibles”. The values assigned to goodwill and intangible assets are normally based on estimates and judgments regarding expectations for the success and life cycle of products and technologies acquired. A severe decline in expectations, future cash flows, a change in strategic direction or our market capitalization remaining below our net book value for a significant period of time could result in significant impairment charges, which could have a material adverse effect on our financial condition and results of operations. Based on events and general business declines, we performed “step one” of the goodwill impairment test in accordance with paragraph 19 of SFAS No. 142, on the reporting units that had goodwill during fiscal 2009. Based on this test, we determined that the fair value was less than the carrying value of the net assets for certain reporting units. We completed “step two” of the goodwill test and concluded that goodwill was impaired. During fiscal 2009, we recorded a goodwill impairment charge of $25.8 million in our Automotive segment, $30.8 million in our Interconnect segment, $5.4 million in our Power Products segment and $1.2 million in our Other segment for a total of $63.2 million related to these assets.
10k.indd 17 7/16/09 1:18:08 PM
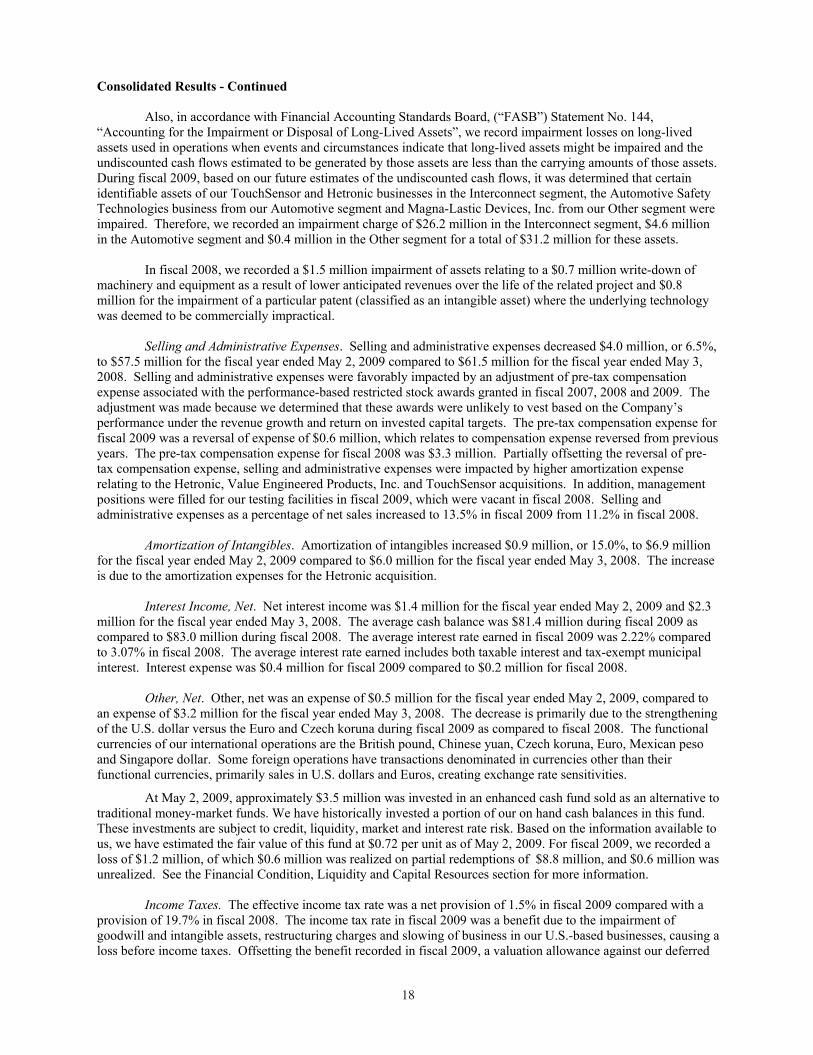
18 1918
Consolidated Results - Continued
Also, in accordance with Financial Accounting Standards Board, (“FASB”) Statement No. 144, “Accounting for the Impairment or Disposal of Long-Lived Assets”, we record impairment losses on long-lived assets used in operations when events and circumstances indicate that long-lived assets might be impaired and the undiscounted cash flows estimated to be generated by those assets are less than the carrying amounts of those assets. During fiscal 2009, based on our future estimates of the undiscounted cash flows, it was determined that certain identifiable assets of our TouchSensor and Hetronic businesses in the Interconnect segment, the Automotive Safety Technologies business from our Automotive segment and Magna-Lastic Devices, Inc. from our Other segment were impaired. Therefore, we recorded an impairment charge of $26.2 million in the Interconnect segment, $4.6 million in the Automotive segment and $0.4 million in the Other segment for a total of $31.2 million for these assets.
In fiscal 2008, we recorded a $1.5 million impairment of assets relating to a $0.7 million write-down of machinery and equipment as a result of lower anticipated revenues over the life of the related project and $0.8 million for the impairment of a particular patent (classified as an intangible asset) where the underlying technology was deemed to be commercially impractical.
Selling and Administrative Expenses. Selling and administrative expenses decreased $4.0 million, or 6.5%, to $57.5 million for the fiscal year ended May 2, 2009 compared to $61.5 million for the fiscal year ended May 3, 2008. Selling and administrative expenses were favorably impacted by an adjustment of pre-tax compensation expense associated with the performance-based restricted stock awards granted in fiscal 2007, 2008 and 2009. The adjustment was made because we determined that these awards were unlikely to vest based on the Company’s performance under the revenue growth and return on invested capital targets. The pre-tax compensation expense for fiscal 2009 was a reversal of expense of $0.6 million, which relates to compensation expense reversed from previous years. The pre-tax compensation expense for fiscal 2008 was $3.3 million. Partially offsetting the reversal of pre-tax compensation expense, selling and administrative expenses were impacted by higher amortization expense relating to the Hetronic, Value Engineered Products, Inc. and TouchSensor acquisitions. In addition, management positions were filled for our testing facilities in fiscal 2009, which were vacant in fiscal 2008. Selling and administrative expenses as a percentage of net sales increased to 13.5% in fiscal 2009 from 11.2% in fiscal 2008.
Amortization of Intangibles. Amortization of intangibles increased $0.9 million, or 15.0%, to $6.9 million for the fiscal year ended May 2, 2009 compared to $6.0 million for the fiscal year ended May 3, 2008. The increase is due to the amortization expenses for the Hetronic acquisition.
Interest Income, Net. Net interest income was $1.4 million for the fiscal year ended May 2, 2009 and $2.3 million for the fiscal year ended May 3, 2008. The average cash balance was $81.4 million during fiscal 2009 as compared to $83.0 million during fiscal 2008. The average interest rate earned in fiscal 2009 was 2.22% compared to 3.07% in fiscal 2008. The average interest rate earned includes both taxable interest and tax-exempt municipal interest. Interest expense was $0.4 million for fiscal 2009 compared to $0.2 million for fiscal 2008.
Other, Net. Other, net was an expense of $0.5 million for the fiscal year ended May 2, 2009, compared to an expense of $3.2 million for the fiscal year ended May 3, 2008. The decrease is primarily due to the strengthening of the U.S. dollar versus the Euro and Czech koruna during fiscal 2009 as compared to fiscal 2008. The functional currencies of our international operations are the British pound, Chinese yuan, Czech koruna, Euro, Mexican peso and Singapore dollar. Some foreign operations have transactions denominated in currencies other than their functional currencies, primarily sales in U.S. dollars and Euros, creating exchange rate sensitivities.
At May 2, 2009, approximately $3.5 million was invested in an enhanced cash fund sold as an alternative to traditional money-market funds. We have historically invested a portion of our on hand cash balances in this fund. These investments are subject to credit, liquidity, market and interest rate risk. Based on the information available to us, we have estimated the fair value of this fund at $0.72 per unit as of May 2, 2009. For fiscal 2009, we recorded a loss of $1.2 million, of which $0.6 million was realized on partial redemptions of $8.8 million, and $0.6 million was unrealized. See the Financial Condition, Liquidity and Capital Resources section for more information.
Income Taxes. The effective income tax rate was a net provision of 1.5% in fiscal 2009 compared with a provision of 19.7% in fiscal 2008. The income tax rate in fiscal 2009 was a benefit due to the impairment of goodwill and intangible assets, restructuring charges and slowing of business in our U.S.-based businesses, causing a loss before income taxes. Offsetting the benefit recorded in fiscal 2009, a valuation allowance against our deferred
19
Consolidated Results - Continued
tax assets of $28.0 was recorded in accordance with FASB No. 109 “Accounting for Income Taxes”. This was recorded due to the uncertainty of the future utilization of our deferred tax assets. See Note 7 for additional information. The effective tax rates for both fiscal 2009 and 2008 reflect utilization of foreign investment tax credits and the effect of lower tax rates on income of the Company’s foreign earnings and a higher percentage of earnings at those foreign operations.
Net Income/(Loss). Net income decreased $152.3 million to a loss of $112.5 million for the fiscal year ended May 2, 2009 as compared to net income of $39.8 million for the fiscal year ended May 3, 2008 due to the impairment of goodwill and intangible assets, lower sales volumes, the income tax valuation allowance recorded against our deferred tax assets, increased restructuring expenses, offset by favorable other income and lower selling and administrative expenses.
Operating Segments
Automotive Segment Results
Below is a table summarizing results for the years ended:(in millions)
May 2, May 3,2009 2008 Net Change Net Change
Net sales 243.6$ 362.1$ (118.5)$ -32.7%Other income 2.5 0.9 1.6 177.8%
246.1 363.0 (116.9) -32.2%
Cost of products sold 206.0 282.1 (76.1) -27.0%
Gross margins (including other income) 40.1 80.9 (40.8) -50.4%
Restructuring 19.3 4.4 14.9 338.6%Impairment of goodwill and other assets 30.5 1.5 29.0 1933.3%Selling and administrative expenses 14.6 18.0 (3.4) -18.9%Other, net - income/(expense) 0.3 (1.7) 2.0 -117.6%
Income/(loss) before income taxes (24.0)$ 55.3$ (79.3)$ -143.4%
May 2, May 3,Percent of sales: 2009 2008Net sales 100.0% 100.0%Other income 1.0% 0.2%Cost of products sold 84.6% 77.9%Gross margins (including other income) 16.5% 22.3%Restructuring 7.9% 1.2%Impairment of goodwill and other assets 12.5% 0.4%Selling and administrative expenses 6.0% 5.0%Other, net 0.1% -0.5%Income/(loss) before income taxes -9.9% 15.3%
Net Sales. Automotive segment net sales decreased $118.5 million, or 32.7%, to $243.6 million for the fiscal year ended May 2, 2009 from $362.1 million for the fiscal year ended May 3, 2008. The decline is attributable to the softening of the global economic environment, especially the effect on the North American automotive industry. Net sales have declined in fiscal 2009 as compared to fiscal 2008 by 34.2% in North America, 30.6% in Europe and 30.7% in Asia. A large portion of the drop in sales is due to the North American automotive
10k.indd 18 7/16/09 1:18:08 PM
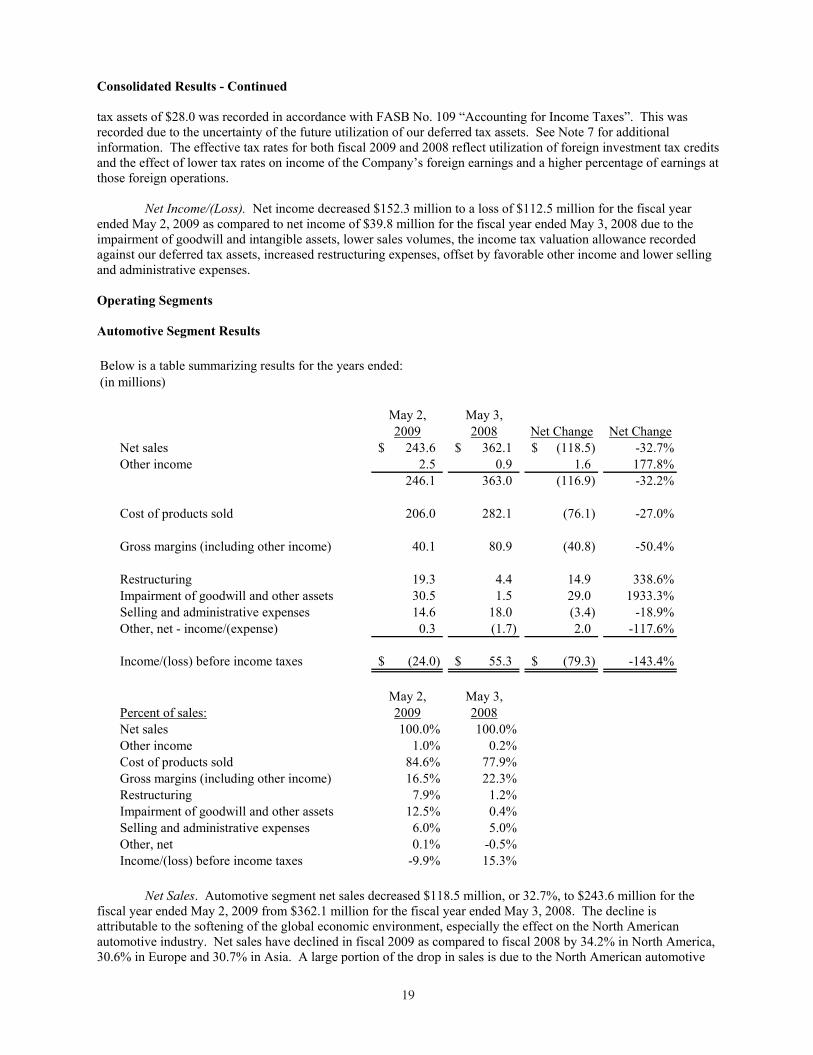
18 1918
Consolidated Results - Continued
Also, in accordance with Financial Accounting Standards Board, (“FASB”) Statement No. 144, “Accounting for the Impairment or Disposal of Long-Lived Assets”, we record impairment losses on long-lived assets used in operations when events and circumstances indicate that long-lived assets might be impaired and the undiscounted cash flows estimated to be generated by those assets are less than the carrying amounts of those assets. During fiscal 2009, based on our future estimates of the undiscounted cash flows, it was determined that certain identifiable assets of our TouchSensor and Hetronic businesses in the Interconnect segment, the Automotive Safety Technologies business from our Automotive segment and Magna-Lastic Devices, Inc. from our Other segment were impaired. Therefore, we recorded an impairment charge of $26.2 million in the Interconnect segment, $4.6 million in the Automotive segment and $0.4 million in the Other segment for a total of $31.2 million for these assets.
In fiscal 2008, we recorded a $1.5 million impairment of assets relating to a $0.7 million write-down of machinery and equipment as a result of lower anticipated revenues over the life of the related project and $0.8 million for the impairment of a particular patent (classified as an intangible asset) where the underlying technology was deemed to be commercially impractical.
Selling and Administrative Expenses. Selling and administrative expenses decreased $4.0 million, or 6.5%, to $57.5 million for the fiscal year ended May 2, 2009 compared to $61.5 million for the fiscal year ended May 3, 2008. Selling and administrative expenses were favorably impacted by an adjustment of pre-tax compensation expense associated with the performance-based restricted stock awards granted in fiscal 2007, 2008 and 2009. The adjustment was made because we determined that these awards were unlikely to vest based on the Company’s performance under the revenue growth and return on invested capital targets. The pre-tax compensation expense for fiscal 2009 was a reversal of expense of $0.6 million, which relates to compensation expense reversed from previous years. The pre-tax compensation expense for fiscal 2008 was $3.3 million. Partially offsetting the reversal of pre-tax compensation expense, selling and administrative expenses were impacted by higher amortization expense relating to the Hetronic, Value Engineered Products, Inc. and TouchSensor acquisitions. In addition, management positions were filled for our testing facilities in fiscal 2009, which were vacant in fiscal 2008. Selling and administrative expenses as a percentage of net sales increased to 13.5% in fiscal 2009 from 11.2% in fiscal 2008.
Amortization of Intangibles. Amortization of intangibles increased $0.9 million, or 15.0%, to $6.9 million for the fiscal year ended May 2, 2009 compared to $6.0 million for the fiscal year ended May 3, 2008. The increase is due to the amortization expenses for the Hetronic acquisition.
Interest Income, Net. Net interest income was $1.4 million for the fiscal year ended May 2, 2009 and $2.3 million for the fiscal year ended May 3, 2008. The average cash balance was $81.4 million during fiscal 2009 as compared to $83.0 million during fiscal 2008. The average interest rate earned in fiscal 2009 was 2.22% compared to 3.07% in fiscal 2008. The average interest rate earned includes both taxable interest and tax-exempt municipal interest. Interest expense was $0.4 million for fiscal 2009 compared to $0.2 million for fiscal 2008.
Other, Net. Other, net was an expense of $0.5 million for the fiscal year ended May 2, 2009, compared to an expense of $3.2 million for the fiscal year ended May 3, 2008. The decrease is primarily due to the strengthening of the U.S. dollar versus the Euro and Czech koruna during fiscal 2009 as compared to fiscal 2008. The functional currencies of our international operations are the British pound, Chinese yuan, Czech koruna, Euro, Mexican peso and Singapore dollar. Some foreign operations have transactions denominated in currencies other than their functional currencies, primarily sales in U.S. dollars and Euros, creating exchange rate sensitivities.
At May 2, 2009, approximately $3.5 million was invested in an enhanced cash fund sold as an alternative to traditional money-market funds. We have historically invested a portion of our on hand cash balances in this fund. These investments are subject to credit, liquidity, market and interest rate risk. Based on the information available to us, we have estimated the fair value of this fund at $0.72 per unit as of May 2, 2009. For fiscal 2009, we recorded a loss of $1.2 million, of which $0.6 million was realized on partial redemptions of $8.8 million, and $0.6 million was unrealized. See the Financial Condition, Liquidity and Capital Resources section for more information.
Income Taxes. The effective income tax rate was a net provision of 1.5% in fiscal 2009 compared with a provision of 19.7% in fiscal 2008. The income tax rate in fiscal 2009 was a benefit due to the impairment of goodwill and intangible assets, restructuring charges and slowing of business in our U.S.-based businesses, causing a loss before income taxes. Offsetting the benefit recorded in fiscal 2009, a valuation allowance against our deferred
19
Consolidated Results - Continued
tax assets of $28.0 was recorded in accordance with FASB No. 109 “Accounting for Income Taxes”. This was recorded due to the uncertainty of the future utilization of our deferred tax assets. See Note 7 for additional information. The effective tax rates for both fiscal 2009 and 2008 reflect utilization of foreign investment tax credits and the effect of lower tax rates on income of the Company’s foreign earnings and a higher percentage of earnings at those foreign operations.
Net Income/(Loss). Net income decreased $152.3 million to a loss of $112.5 million for the fiscal year ended May 2, 2009 as compared to net income of $39.8 million for the fiscal year ended May 3, 2008 due to the impairment of goodwill and intangible assets, lower sales volumes, the income tax valuation allowance recorded against our deferred tax assets, increased restructuring expenses, offset by favorable other income and lower selling and administrative expenses.
Operating Segments
Automotive Segment Results
Below is a table summarizing results for the years ended:(in millions)
May 2, May 3,2009 2008 Net Change Net Change
Net sales 243.6$ 362.1$ (118.5)$ -32.7%Other income 2.5 0.9 1.6 177.8%
246.1 363.0 (116.9) -32.2%
Cost of products sold 206.0 282.1 (76.1) -27.0%
Gross margins (including other income) 40.1 80.9 (40.8) -50.4%
Restructuring 19.3 4.4 14.9 338.6%Impairment of goodwill and other assets 30.5 1.5 29.0 1933.3%Selling and administrative expenses 14.6 18.0 (3.4) -18.9%Other, net - income/(expense) 0.3 (1.7) 2.0 -117.6%
Income/(loss) before income taxes (24.0)$ 55.3$ (79.3)$ -143.4%
May 2, May 3,Percent of sales: 2009 2008Net sales 100.0% 100.0%Other income 1.0% 0.2%Cost of products sold 84.6% 77.9%Gross margins (including other income) 16.5% 22.3%Restructuring 7.9% 1.2%Impairment of goodwill and other assets 12.5% 0.4%Selling and administrative expenses 6.0% 5.0%Other, net 0.1% -0.5%Income/(loss) before income taxes -9.9% 15.3%
Net Sales. Automotive segment net sales decreased $118.5 million, or 32.7%, to $243.6 million for the fiscal year ended May 2, 2009 from $362.1 million for the fiscal year ended May 3, 2008. The decline is attributable to the softening of the global economic environment, especially the effect on the North American automotive industry. Net sales have declined in fiscal 2009 as compared to fiscal 2008 by 34.2% in North America, 30.6% in Europe and 30.7% in Asia. A large portion of the drop in sales is due to the North American automotive
10k.indd 19 7/16/09 1:18:09 PM

20 2120
Automotive Segment Results - Continued
manufacturers extending plant shutdowns that occurred during the third and fourth quarters of fiscal 2009. The Automotive segment net sales were also negatively impacted by anticipated lower Chrysler sales volumes of $14.8 million in fiscal 2009, compared to $59.2 million in fiscal 2008. Excluding Chrysler, the North American Automotive segment net sales declined 18.5% in fiscal 2009, as compared to fiscal 2008. Translation of net sales from our foreign operations in the fiscal year ended May 2, 2009 increased reported net sales by $1.3 million, or 0.5%, due to currency rate fluctuations.
Other Income. Other income increased $1.6 million, or 177.8%, to $2.5 million for the fiscal year ended May 2, 2009 from $0.9 million for the fiscal year ended May 3, 2008. Other income consisted primarily of earnings from engineering design fees and royalties.
Cost of Products Sold. Automotive segment cost of products sold decreased $76.1 million to $206.0 million for the fiscal year ended May 2, 2009 from $282.1 million for the fiscal year ended May 3, 2008. The decrease relates to lower sales volumes. Automotive segment costs of products sold as a percentage of sales increased to 84.6% for fiscal 2009 from 77.9% for fiscal 2008. This increase relates to manufacturing inefficiencies experienced in the third and fourth quarters of fiscal 2009 due to a significant, unexpected drop in sales, in addition to lower planned sales to Chrysler. A large portion of the drop in sales is due to the North American automotive manufacturers extending plant shutdowns that occurred during the second half of fiscal 2009.
Gross Margins (including other income). Automotive segment gross margins (including other income) decreased $40.8 million, or 50.4%, to $40.1 million for the fiscal year ended May 2, 2009 as compared to $80.9 million for the fiscal year ended May 3, 2008. Gross margins as a percentage of net sales decreased to 16.5% for fiscal 2009 from 22.3% for fiscal 2008. Gross margins were impacted negatively due to manufacturing inefficiencies during the second half of fiscal 2009 due to significantly lower sales volumes. In addition, gross margins were impacted by the planned lower Chrysler sales volumes in fiscal 2009.
Restructuring. On January 24, 2008, we announced a restructuring of our U.S.-based automotive operations. During fiscal 2009, we recorded a restructuring charge of $12.8 million, which consisted of $4.7 million for employee severance, $7.4 million for impairment and accelerated depreciation for buildings, building improvements and machinery and equipment and $0.7 million for professional fees. We expect the restructuring to be complete during fiscal 2010.
In fiscal 2008, we recorded a restructuring charge of $4.4 million, $2.7 million relating to employee severance, $1.3 million relating to impairment and accelerated depreciation for assets and $0.4 million for professional fees relating to the January 2008 restructuring.
On March 12, 2009, we announced several additional restructuring actions to further reduce our exposure to the North American automotive industry and to consolidate manufacturing facilities in lower cost regions to reduce costs. During the fiscal year ended May 2, 2009, we recorded a restructuring charge of $6.5 million, which consisted of $1.0 million for impairment and accelerated depreciation for buildings and improvements and machinery and equipment and $5.4 million for customer funded tooling and $0.1 million in forfeited security deposits related to the cancellation of the new GM business.
Impairment of Goodwill and Other Assets. Based on events and general business declines, we performed “step one” and “step two” of the goodwill impairment test in accordance with paragraph 19 of SFAS No. 142, on the reporting units that had goodwill during fiscal 2009. Based on these tests, we concluded that goodwill was impaired. We recorded a goodwill impairment charge of $25.8 million in our Automotive segment related to these assets. See Note 4 for more information.
Also, in accordance with FASB Statement No. 144, “Accounting for the Impairment or Disposal of Long-Lived Assets”, during the fourth quarter of fiscal 2009, based on our future estimates of the undiscounted cash flows, it was determined that certain identifiable assets were impaired. We recorded an impairment charge of $4.7 million for these assets. See Note 4 for more information.
In fiscal 2008, we recorded a $1.5 million impairment of assets relating to a $0.7 million write-down of machinery and equipment as a result of lower anticipated revenues over the life of the related project and $0.8
21
Automotive Segment Results - Continued
million for the impairment of a particular patent (classified as an intangible asset) where the underlying technology was deemed to be commercially impractical.
Selling and Administrative Expenses. Selling and administrative expenses decreased $3.4 million, or 18.9%, to $14.6 million for the fiscal year ended May 2, 2009 compared to $18.0 million for the fiscal year ended May 3, 2008. The decrease is due to lower commission expense as a result of lower sales during fiscal 2009. Selling and administrative expenses as a percentage of net sales increased to 6.0% in fiscal 2009 from 5.0% in fiscal 2008.
Other, Net. Other, net was income of $0.3 million for the fiscal year ended May 2, 2009, compared to an expense of $1.7 million for the fiscal year ended May 3, 2008. The decrease is primarily due to the strengthening of the U.S. dollar versus the Euro during fiscal 2009 as compared to fiscal 2008. The functional currencies of our international operations are the British pound, Chinese yuan, Euro and Mexican peso. Some foreign operations have transactions denominated in currencies other than their functional currencies, primarily sales in U.S. dollars and Euros, creating exchange rate sensitivities.
Income/(Loss) Before Income Taxes. Automotive segment income/(loss) before income taxes decreased $79.3 million, or 143.4%, to a loss of $24.0 million for the fiscal year ended May 2, 2009 compared to income of $55.3 million for the fiscal year ended May 3, 2008. The decrease occurred due to goodwill and intangible asset write-offs, manufacturing inefficiencies due to significantly lower sales volumes during the third and fourth quarters of fiscal 2009, increased restructuring expenses, partially offset by lower selling and administrative expenses.
10k.indd 20 7/16/09 1:18:10 PM
20 2120
Automotive Segment Results - Continued
manufacturers extending plant shutdowns that occurred during the third and fourth quarters of fiscal 2009. The Automotive segment net sales were also negatively impacted by anticipated lower Chrysler sales volumes of $14.8 million in fiscal 2009, compared to $59.2 million in fiscal 2008. Excluding Chrysler, the North American Automotive segment net sales declined 18.5% in fiscal 2009, as compared to fiscal 2008. Translation of net sales from our foreign operations in the fiscal year ended May 2, 2009 increased reported net sales by $1.3 million, or 0.5%, due to currency rate fluctuations.
Other Income. Other income increased $1.6 million, or 177.8%, to $2.5 million for the fiscal year ended May 2, 2009 from $0.9 million for the fiscal year ended May 3, 2008. Other income consisted primarily of earnings from engineering design fees and royalties.
Cost of Products Sold. Automotive segment cost of products sold decreased $76.1 million to $206.0 million for the fiscal year ended May 2, 2009 from $282.1 million for the fiscal year ended May 3, 2008. The decrease relates to lower sales volumes. Automotive segment costs of products sold as a percentage of sales increased to 84.6% for fiscal 2009 from 77.9% for fiscal 2008. This increase relates to manufacturing inefficiencies experienced in the third and fourth quarters of fiscal 2009 due to a significant, unexpected drop in sales, in addition to lower planned sales to Chrysler. A large portion of the drop in sales is due to the North American automotive manufacturers extending plant shutdowns that occurred during the second half of fiscal 2009.
Gross Margins (including other income). Automotive segment gross margins (including other income) decreased $40.8 million, or 50.4%, to $40.1 million for the fiscal year ended May 2, 2009 as compared to $80.9 million for the fiscal year ended May 3, 2008. Gross margins as a percentage of net sales decreased to 16.5% for fiscal 2009 from 22.3% for fiscal 2008. Gross margins were impacted negatively due to manufacturing inefficiencies during the second half of fiscal 2009 due to significantly lower sales volumes. In addition, gross margins were impacted by the planned lower Chrysler sales volumes in fiscal 2009.
Restructuring. On January 24, 2008, we announced a restructuring of our U.S.-based automotive operations. During fiscal 2009, we recorded a restructuring charge of $12.8 million, which consisted of $4.7 million for employee severance, $7.4 million for impairment and accelerated depreciation for buildings, building improvements and machinery and equipment and $0.7 million for professional fees. We expect the restructuring to be complete during fiscal 2010.
In fiscal 2008, we recorded a restructuring charge of $4.4 million, $2.7 million relating to employee severance, $1.3 million relating to impairment and accelerated depreciation for assets and $0.4 million for professional fees relating to the January 2008 restructuring.
On March 12, 2009, we announced several additional restructuring actions to further reduce our exposure to the North American automotive industry and to consolidate manufacturing facilities in lower cost regions to reduce costs. During the fiscal year ended May 2, 2009, we recorded a restructuring charge of $6.5 million, which consisted of $1.0 million for impairment and accelerated depreciation for buildings and improvements and machinery and equipment and $5.4 million for customer funded tooling and $0.1 million in forfeited security deposits related to the cancellation of the new GM business.
Impairment of Goodwill and Other Assets. Based on events and general business declines, we performed “step one” and “step two” of the goodwill impairment test in accordance with paragraph 19 of SFAS No. 142, on the reporting units that had goodwill during fiscal 2009. Based on these tests, we concluded that goodwill was impaired. We recorded a goodwill impairment charge of $25.8 million in our Automotive segment related to these assets. See Note 4 for more information.
Also, in accordance with FASB Statement No. 144, “Accounting for the Impairment or Disposal of Long-Lived Assets”, during the fourth quarter of fiscal 2009, based on our future estimates of the undiscounted cash flows, it was determined that certain identifiable assets were impaired. We recorded an impairment charge of $4.7 million for these assets. See Note 4 for more information.
In fiscal 2008, we recorded a $1.5 million impairment of assets relating to a $0.7 million write-down of machinery and equipment as a result of lower anticipated revenues over the life of the related project and $0.8
21
Automotive Segment Results - Continued
million for the impairment of a particular patent (classified as an intangible asset) where the underlying technology was deemed to be commercially impractical.
Selling and Administrative Expenses. Selling and administrative expenses decreased $3.4 million, or 18.9%, to $14.6 million for the fiscal year ended May 2, 2009 compared to $18.0 million for the fiscal year ended May 3, 2008. The decrease is due to lower commission expense as a result of lower sales during fiscal 2009. Selling and administrative expenses as a percentage of net sales increased to 6.0% in fiscal 2009 from 5.0% in fiscal 2008.
Other, Net. Other, net was income of $0.3 million for the fiscal year ended May 2, 2009, compared to an expense of $1.7 million for the fiscal year ended May 3, 2008. The decrease is primarily due to the strengthening of the U.S. dollar versus the Euro during fiscal 2009 as compared to fiscal 2008. The functional currencies of our international operations are the British pound, Chinese yuan, Euro and Mexican peso. Some foreign operations have transactions denominated in currencies other than their functional currencies, primarily sales in U.S. dollars and Euros, creating exchange rate sensitivities.
Income/(Loss) Before Income Taxes. Automotive segment income/(loss) before income taxes decreased $79.3 million, or 143.4%, to a loss of $24.0 million for the fiscal year ended May 2, 2009 compared to income of $55.3 million for the fiscal year ended May 3, 2008. The decrease occurred due to goodwill and intangible asset write-offs, manufacturing inefficiencies due to significantly lower sales volumes during the third and fourth quarters of fiscal 2009, increased restructuring expenses, partially offset by lower selling and administrative expenses.
10k.indd 21 7/16/09 1:18:10 PM
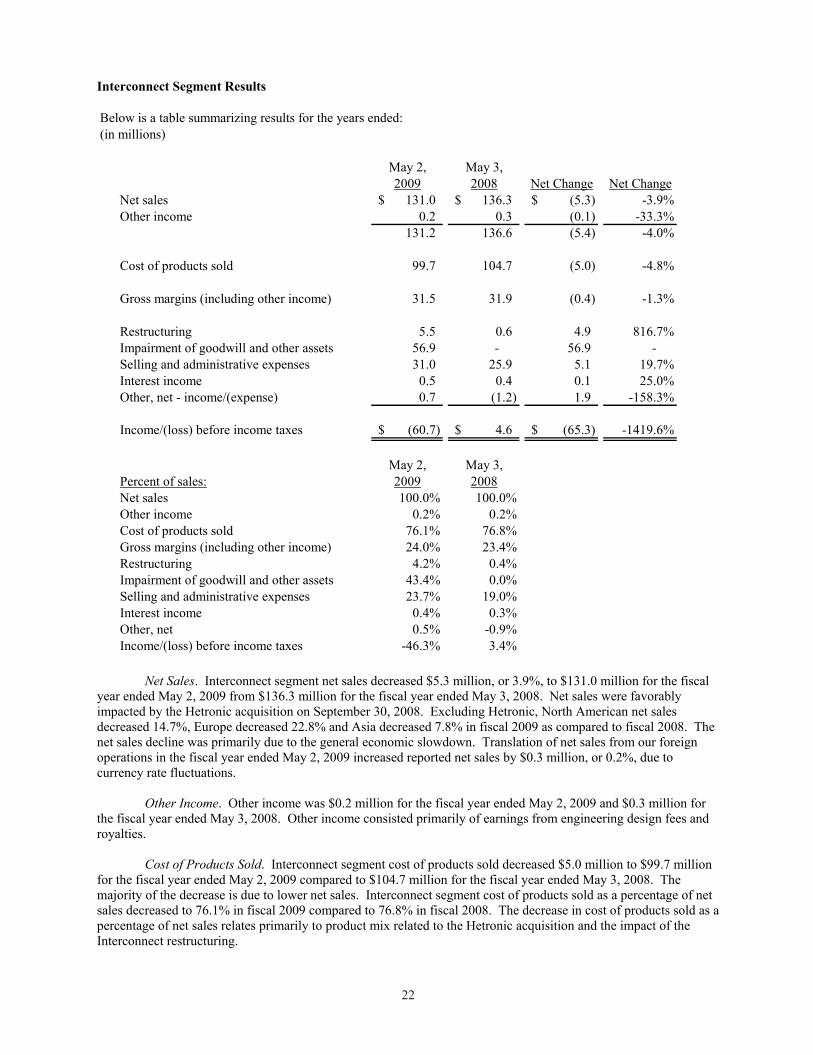
22 2322
Interconnect Segment Results
Below is a table summarizing results for the years ended:(in millions)
May 2, May 3,2009 2008 Net Change Net Change
Net sales 131.0$ 136.3$ (5.3)$ -3.9%Other income 0.2 0.3 (0.1) -33.3%
131.2 136.6 (5.4) -4.0%
Cost of products sold 99.7 104.7 (5.0) -4.8%
Gross margins (including other income) 31.5 31.9 (0.4) -1.3%
Restructuring 5.5 0.6 4.9 816.7%Impairment of goodwill and other assets 56.9 - 56.9 -Selling and administrative expenses 31.0 25.9 5.1 19.7%Interest income 0.5 0.4 0.1 25.0%Other, net - income/(expense) 0.7 (1.2) 1.9 -158.3%
Income/(loss) before income taxes (60.7)$ 4.6$ (65.3)$ -1419.6%
May 2, May 3,Percent of sales: 2009 2008Net sales 100.0% 100.0%Other income 0.2% 0.2%Cost of products sold 76.1% 76.8%Gross margins (including other income) 24.0% 23.4%Restructuring 4.2% 0.4%Impairment of goodwill and other assets 43.4% 0.0%Selling and administrative expenses 23.7% 19.0%Interest income 0.4% 0.3%Other, net 0.5% -0.9%Income/(loss) before income taxes -46.3% 3.4%
Net Sales. Interconnect segment net sales decreased $5.3 million, or 3.9%, to $131.0 million for the fiscal year ended May 2, 2009 from $136.3 million for the fiscal year ended May 3, 2008. Net sales were favorably impacted by the Hetronic acquisition on September 30, 2008. Excluding Hetronic, North American net sales decreased 14.7%, Europe decreased 22.8% and Asia decreased 7.8% in fiscal 2009 as compared to fiscal 2008. The net sales decline was primarily due to the general economic slowdown. Translation of net sales from our foreign operations in the fiscal year ended May 2, 2009 increased reported net sales by $0.3 million, or 0.2%, due to currency rate fluctuations.
Other Income. Other income was $0.2 million for the fiscal year ended May 2, 2009 and $0.3 million for the fiscal year ended May 3, 2008. Other income consisted primarily of earnings from engineering design fees and royalties.
Cost of Products Sold. Interconnect segment cost of products sold decreased $5.0 million to $99.7 million for the fiscal year ended May 2, 2009 compared to $104.7 million for the fiscal year ended May 3, 2008. The majority of the decrease is due to lower net sales. Interconnect segment cost of products sold as a percentage of net sales decreased to 76.1% in fiscal 2009 compared to 76.8% in fiscal 2008. The decrease in cost of products sold as a percentage of net sales relates primarily to product mix related to the Hetronic acquisition and the impact of the Interconnect restructuring.
23
Interconnect Segment Results - Continued
Gross Margins (including other income) Interconnect segment gross margins (including other income) decreased $0.4 million, or 1.3%, to $31.5 million for the fiscal year ended May 2, 2009 as compared to $31.9 million for the fiscal year ended May 3, 2008. Gross margins as a percentage of net sales increased to 24.0% in fiscal 2009 from 23.4% in fiscal 2008. The increase in gross margins as a percentage of net sales relates primarily to product mix related to the Hetronic acquisition and the impact of the Interconnect restructuring.
Restructuring. On January 24, 2008, we announced our decision to discontinue producing certain legacy products in the Interconnect segment. During fiscal 2009, we recorded a restructuring charge of $5.2 million, which consisted of $1.4 million for employee severance, $3.4 million for impairment and accelerated depreciation for buildings, building improvements and machinery and equipment, $0.2 million for inventory write-downs and $0.2 million relating to professional fees. We expect the Interconnect restructuring to be complete in fiscal 2010.
In fiscal 2008, we recorded a restructuring charge of $0.7 million, $0.6 million for employee severance and $0.1 million for professional fees relating to the January 2008 restructuring.
On March 12, 2009, we announced several additional restructuring actions to consolidate manufacturing facilities in lower cost regions to reduce costs. During the fiscal year ended May 2, 2009, we recorded a restructuring charge of $0.3 million, which consisted of $0.1 million for employee severance and $0.2 million relating to professional fees.
Impairment of Goodwill and Intangible Assets. Based on events and general business declines, we performed “step one” and “step two” of the goodwill impairment test in accordance with paragraph 19 of SFAS No. 142, on the reporting units that had goodwill during fiscal 2009. Based on these tests, we concluded that goodwill was impaired. We recorded a goodwill impairment charge of $30.8 million in our Interconnect segment related to these assets. See Note 4 for more information.
Also, in accordance with FASB Statement No. 144, “Accounting for the Impairment or Disposal of Long-Lived Assets”, during the fourth quarter of fiscal 2009, based on our future estimates of the undiscounted cash flows, it was determined that certain identifiable assets were impaired. We recorded an impairment charge of $26.1 million for these assets. See Note 4 for more information.
Selling and Administrative Expenses. Selling and administrative expenses increased $5.1 million, or 19.7%, to $31.0 million for the fiscal year ended May 2, 2009 compared to $25.9 million for the fiscal year ended May 3, 2008. Selling and administrative expenses are higher due to the Hetronic acquisition, higher amortization expense, slightly offset by lower commission expense due to lower sales in fiscal 2009 as compared to fiscal 2008. Selling and administrative expenses as a percentage of net sales increased to 23.7% in fiscal 2009 from 19.0% in fiscal 2008.
Interest Income, Net. Net interest income was $0.5 million for the fiscal year ended May 2, 2009, compared to $0.4 million for the fiscal year ended May 3, 2008.
Other, Net. Other, net was income of $0.7 million for the fiscal year ended May 2, 2009, compared to an expense of $1.2 million for the fiscal year ended May 3, 2008. The increase is primarily due to the strengthening of the U.S. dollar versus the Euro and Czech koruna during fiscal 2009 as compared to fiscal 2008. The functional currencies of these operations are the Chinese yuan, Czech koruna, Euro and Singapore dollar. Some foreign operations have transactions denominated in currencies other than their functional currencies, primarily sales in U.S. dollars and Euros, creating exchange rate sensitivities.
Income/(Loss) Before Income Taxes. Interconnect segment income/(loss) before income taxes decreased $65.3 million to a loss of $60.7 million for the fiscal year ended May 2, 2009 compared to income of $4.6 million for the fiscal year ended May 3, 2008 due to the goodwill and intangible asset write-off, higher selling and administrative expenses, increased amortization expense and increased restructuring expenses.
10k.indd 22 7/16/09 1:18:11 PM
22 2322
Interconnect Segment Results
Below is a table summarizing results for the years ended:(in millions)
May 2, May 3,2009 2008 Net Change Net Change
Net sales 131.0$ 136.3$ (5.3)$ -3.9%Other income 0.2 0.3 (0.1) -33.3%
131.2 136.6 (5.4) -4.0%
Cost of products sold 99.7 104.7 (5.0) -4.8%
Gross margins (including other income) 31.5 31.9 (0.4) -1.3%
Restructuring 5.5 0.6 4.9 816.7%Impairment of goodwill and other assets 56.9 - 56.9 -Selling and administrative expenses 31.0 25.9 5.1 19.7%Interest income 0.5 0.4 0.1 25.0%Other, net - income/(expense) 0.7 (1.2) 1.9 -158.3%
Income/(loss) before income taxes (60.7)$ 4.6$ (65.3)$ -1419.6%
May 2, May 3,Percent of sales: 2009 2008Net sales 100.0% 100.0%Other income 0.2% 0.2%Cost of products sold 76.1% 76.8%Gross margins (including other income) 24.0% 23.4%Restructuring 4.2% 0.4%Impairment of goodwill and other assets 43.4% 0.0%Selling and administrative expenses 23.7% 19.0%Interest income 0.4% 0.3%Other, net 0.5% -0.9%Income/(loss) before income taxes -46.3% 3.4%
Net Sales. Interconnect segment net sales decreased $5.3 million, or 3.9%, to $131.0 million for the fiscal year ended May 2, 2009 from $136.3 million for the fiscal year ended May 3, 2008. Net sales were favorably impacted by the Hetronic acquisition on September 30, 2008. Excluding Hetronic, North American net sales decreased 14.7%, Europe decreased 22.8% and Asia decreased 7.8% in fiscal 2009 as compared to fiscal 2008. The net sales decline was primarily due to the general economic slowdown. Translation of net sales from our foreign operations in the fiscal year ended May 2, 2009 increased reported net sales by $0.3 million, or 0.2%, due to currency rate fluctuations.
Other Income. Other income was $0.2 million for the fiscal year ended May 2, 2009 and $0.3 million for the fiscal year ended May 3, 2008. Other income consisted primarily of earnings from engineering design fees and royalties.
Cost of Products Sold. Interconnect segment cost of products sold decreased $5.0 million to $99.7 million for the fiscal year ended May 2, 2009 compared to $104.7 million for the fiscal year ended May 3, 2008. The majority of the decrease is due to lower net sales. Interconnect segment cost of products sold as a percentage of net sales decreased to 76.1% in fiscal 2009 compared to 76.8% in fiscal 2008. The decrease in cost of products sold as a percentage of net sales relates primarily to product mix related to the Hetronic acquisition and the impact of the Interconnect restructuring.
23
Interconnect Segment Results - Continued
Gross Margins (including other income) Interconnect segment gross margins (including other income) decreased $0.4 million, or 1.3%, to $31.5 million for the fiscal year ended May 2, 2009 as compared to $31.9 million for the fiscal year ended May 3, 2008. Gross margins as a percentage of net sales increased to 24.0% in fiscal 2009 from 23.4% in fiscal 2008. The increase in gross margins as a percentage of net sales relates primarily to product mix related to the Hetronic acquisition and the impact of the Interconnect restructuring.
Restructuring. On January 24, 2008, we announced our decision to discontinue producing certain legacy products in the Interconnect segment. During fiscal 2009, we recorded a restructuring charge of $5.2 million, which consisted of $1.4 million for employee severance, $3.4 million for impairment and accelerated depreciation for buildings, building improvements and machinery and equipment, $0.2 million for inventory write-downs and $0.2 million relating to professional fees. We expect the Interconnect restructuring to be complete in fiscal 2010.
In fiscal 2008, we recorded a restructuring charge of $0.7 million, $0.6 million for employee severance and $0.1 million for professional fees relating to the January 2008 restructuring.
On March 12, 2009, we announced several additional restructuring actions to consolidate manufacturing facilities in lower cost regions to reduce costs. During the fiscal year ended May 2, 2009, we recorded a restructuring charge of $0.3 million, which consisted of $0.1 million for employee severance and $0.2 million relating to professional fees.
Impairment of Goodwill and Intangible Assets. Based on events and general business declines, we performed “step one” and “step two” of the goodwill impairment test in accordance with paragraph 19 of SFAS No. 142, on the reporting units that had goodwill during fiscal 2009. Based on these tests, we concluded that goodwill was impaired. We recorded a goodwill impairment charge of $30.8 million in our Interconnect segment related to these assets. See Note 4 for more information.
Also, in accordance with FASB Statement No. 144, “Accounting for the Impairment or Disposal of Long-Lived Assets”, during the fourth quarter of fiscal 2009, based on our future estimates of the undiscounted cash flows, it was determined that certain identifiable assets were impaired. We recorded an impairment charge of $26.1 million for these assets. See Note 4 for more information.
Selling and Administrative Expenses. Selling and administrative expenses increased $5.1 million, or 19.7%, to $31.0 million for the fiscal year ended May 2, 2009 compared to $25.9 million for the fiscal year ended May 3, 2008. Selling and administrative expenses are higher due to the Hetronic acquisition, higher amortization expense, slightly offset by lower commission expense due to lower sales in fiscal 2009 as compared to fiscal 2008. Selling and administrative expenses as a percentage of net sales increased to 23.7% in fiscal 2009 from 19.0% in fiscal 2008.
Interest Income, Net. Net interest income was $0.5 million for the fiscal year ended May 2, 2009, compared to $0.4 million for the fiscal year ended May 3, 2008.
Other, Net. Other, net was income of $0.7 million for the fiscal year ended May 2, 2009, compared to an expense of $1.2 million for the fiscal year ended May 3, 2008. The increase is primarily due to the strengthening of the U.S. dollar versus the Euro and Czech koruna during fiscal 2009 as compared to fiscal 2008. The functional currencies of these operations are the Chinese yuan, Czech koruna, Euro and Singapore dollar. Some foreign operations have transactions denominated in currencies other than their functional currencies, primarily sales in U.S. dollars and Euros, creating exchange rate sensitivities.
Income/(Loss) Before Income Taxes. Interconnect segment income/(loss) before income taxes decreased $65.3 million to a loss of $60.7 million for the fiscal year ended May 2, 2009 compared to income of $4.6 million for the fiscal year ended May 3, 2008 due to the goodwill and intangible asset write-off, higher selling and administrative expenses, increased amortization expense and increased restructuring expenses.
10k.indd 23 7/16/09 1:18:12 PM
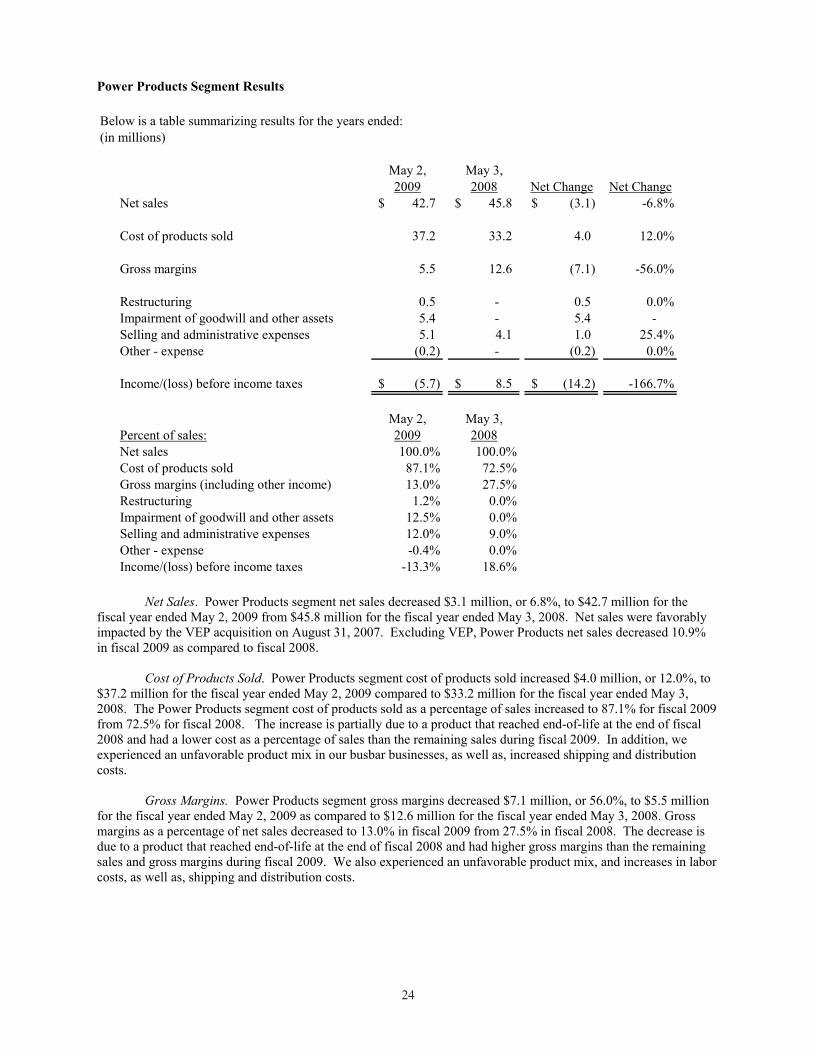
24 2524
Power Products Segment Results
Below is a table summarizing results for the years ended:(in millions)
May 2, May 3,2009 2008 Net Change Net Change
Net sales 42.7$ 45.8$ (3.1)$ -6.8%
Cost of products sold 37.2 33.2 4.0 12.0%
Gross margins 5.5 12.6 (7.1) -56.0%
Restructuring 0.5 - 0.5 0.0%Impairment of goodwill and other assets 5.4 - 5.4 -Selling and administrative expenses 5.1 4.1 1.0 25.4%Other - expense (0.2) - (0.2) 0.0%
Income/(loss) before income taxes (5.7)$ 8.5$ (14.2)$ -166.7%
May 2, May 3,Percent of sales: 2009 2008Net sales 100.0% 100.0%Cost of products sold 87.1% 72.5%Gross margins (including other income) 13.0% 27.5%Restructuring 1.2% 0.0%Impairment of goodwill and other assets 12.5% 0.0%Selling and administrative expenses 12.0% 9.0%Other - expense -0.4% 0.0%Income/(loss) before income taxes -13.3% 18.6%
Net Sales. Power Products segment net sales decreased $3.1 million, or 6.8%, to $42.7 million for the fiscal year ended May 2, 2009 from $45.8 million for the fiscal year ended May 3, 2008. Net sales were favorably impacted by the VEP acquisition on August 31, 2007. Excluding VEP, Power Products net sales decreased 10.9% in fiscal 2009 as compared to fiscal 2008.
Cost of Products Sold. Power Products segment cost of products sold increased $4.0 million, or 12.0%, to $37.2 million for the fiscal year ended May 2, 2009 compared to $33.2 million for the fiscal year ended May 3, 2008. The Power Products segment cost of products sold as a percentage of sales increased to 87.1% for fiscal 2009 from 72.5% for fiscal 2008. The increase is partially due to a product that reached end-of-life at the end of fiscal 2008 and had a lower cost as a percentage of sales than the remaining sales during fiscal 2009. In addition, we experienced an unfavorable product mix in our busbar businesses, as well as, increased shipping and distribution costs.
Gross Margins. Power Products segment gross margins decreased $7.1 million, or 56.0%, to $5.5 million for the fiscal year ended May 2, 2009 as compared to $12.6 million for the fiscal year ended May 3, 2008. Gross margins as a percentage of net sales decreased to 13.0% in fiscal 2009 from 27.5% in fiscal 2008. The decrease is due to a product that reached end-of-life at the end of fiscal 2008 and had higher gross margins than the remaining sales and gross margins during fiscal 2009. We also experienced an unfavorable product mix, and increases in labor costs, as well as, shipping and distribution costs.
25
Power Products Segment Results - Continued
Restructuring. On March 12, 2009, we announced several additional restructuring actions to consolidate manufacturing facilities in lower cost regions to reduce costs. During the fiscal year ended May 2, 2009, we recorded a restructuring charge of $0.5 million, which consisted of $0.4 million for impairment and accelerated depreciation for buildings and improvements and machinery and equipment and $0.1 million relating to professional services.
Impairment of Goodwill and Intangible Assets. Based on events and general business declines, we performed “step one” and “step two” of the goodwill impairment test in accordance with paragraph 19 of SFAS No. 142, on the reporting units that had goodwill during fiscal 2009. Based on these tests, we concluded that goodwill was impaired. We recorded a goodwill impairment charge of $5.4 million in our Power Products segment related to these assets. See Note 4 for more information.
Selling and Administrative Expenses. Selling and administrative expenses increased $1.0 million, or 25.4%, to $5.1 million for the fiscal year ended May 2, 2009 compared to $4.1 million for the fiscal year ended May 3, 2008. Selling and administrative expenses increased due to the Tribotek acquisition on March 30, 2008, partially offset by lower commission and bonus expenses in fiscal 2009. Selling and administrative expenses as a percentage of net sales increased to 12.0% in the fiscal 2009 from 9.0% in fiscal 2008.
Other, Net. Other, net was an expense of $0.2 million for the fiscal year ended May 2, 2009, compared to no other, net for the fiscal year ended May 3, 2008.
Income/(Loss) Before Income Taxes. Power Products segment income/(loss) before income taxes decreased by $14.2 million to a loss of $5.7 million for the fiscal year ended May 2, 2009 from a profit of $8.5 million for the fiscal year ended May 3, 2008 due to impairment of goodwill, decreased sales of products which became end-of-life at the end of fiscal year 2008, restructuring costs, higher material, labor and shipping costs, expenses related to Tribotek, partially offset by lower commission and bonus expenses.
Other Segment Results
Below is a table summarizing results for the years ended:(in millions)
May 2, May 3,2009 2008 Net Change Net Change
Net sales 8.2$ 6.9$ 1.3$ 18.8%
Cost of products sold 8.9 6.7 2.2 32.8%
Gross margins (0.7) 0.2 (0.9) 0.0%
Impairment of goodwill and intangible assets 1.6 - 1.6 0.0%Selling and administrative expenses 2.8 2.0 0.8 40.0%
Loss before income taxes (5.1)$ (1.8)$ (3.3)$ 183.3%
May 2, May 3,Percent of sales: 2009 2008Net sales 100.0% 100.0%Cost of products sold 108.5% 97.1%Gross margins -8.5% 2.9%Impairment of goodwill and intangible assets 19.5% 0.0%Selling and administrative expenses 34.1% 29.0%Loss before income taxes -62.2% -26.1%
10k.indd 24 7/16/09 1:18:12 PM

24 2524
Power Products Segment Results
Below is a table summarizing results for the years ended:(in millions)
May 2, May 3,2009 2008 Net Change Net Change
Net sales 42.7$ 45.8$ (3.1)$ -6.8%
Cost of products sold 37.2 33.2 4.0 12.0%
Gross margins 5.5 12.6 (7.1) -56.0%
Restructuring 0.5 - 0.5 0.0%Impairment of goodwill and other assets 5.4 - 5.4 -Selling and administrative expenses 5.1 4.1 1.0 25.4%Other - expense (0.2) - (0.2) 0.0%
Income/(loss) before income taxes (5.7)$ 8.5$ (14.2)$ -166.7%
May 2, May 3,Percent of sales: 2009 2008Net sales 100.0% 100.0%Cost of products sold 87.1% 72.5%Gross margins (including other income) 13.0% 27.5%Restructuring 1.2% 0.0%Impairment of goodwill and other assets 12.5% 0.0%Selling and administrative expenses 12.0% 9.0%Other - expense -0.4% 0.0%Income/(loss) before income taxes -13.3% 18.6%
Net Sales. Power Products segment net sales decreased $3.1 million, or 6.8%, to $42.7 million for the fiscal year ended May 2, 2009 from $45.8 million for the fiscal year ended May 3, 2008. Net sales were favorably impacted by the VEP acquisition on August 31, 2007. Excluding VEP, Power Products net sales decreased 10.9% in fiscal 2009 as compared to fiscal 2008.
Cost of Products Sold. Power Products segment cost of products sold increased $4.0 million, or 12.0%, to $37.2 million for the fiscal year ended May 2, 2009 compared to $33.2 million for the fiscal year ended May 3, 2008. The Power Products segment cost of products sold as a percentage of sales increased to 87.1% for fiscal 2009 from 72.5% for fiscal 2008. The increase is partially due to a product that reached end-of-life at the end of fiscal 2008 and had a lower cost as a percentage of sales than the remaining sales during fiscal 2009. In addition, we experienced an unfavorable product mix in our busbar businesses, as well as, increased shipping and distribution costs.
Gross Margins. Power Products segment gross margins decreased $7.1 million, or 56.0%, to $5.5 million for the fiscal year ended May 2, 2009 as compared to $12.6 million for the fiscal year ended May 3, 2008. Gross margins as a percentage of net sales decreased to 13.0% in fiscal 2009 from 27.5% in fiscal 2008. The decrease is due to a product that reached end-of-life at the end of fiscal 2008 and had higher gross margins than the remaining sales and gross margins during fiscal 2009. We also experienced an unfavorable product mix, and increases in labor costs, as well as, shipping and distribution costs.
25
Power Products Segment Results - Continued
Restructuring. On March 12, 2009, we announced several additional restructuring actions to consolidate manufacturing facilities in lower cost regions to reduce costs. During the fiscal year ended May 2, 2009, we recorded a restructuring charge of $0.5 million, which consisted of $0.4 million for impairment and accelerated depreciation for buildings and improvements and machinery and equipment and $0.1 million relating to professional services.
Impairment of Goodwill and Intangible Assets. Based on events and general business declines, we performed “step one” and “step two” of the goodwill impairment test in accordance with paragraph 19 of SFAS No. 142, on the reporting units that had goodwill during fiscal 2009. Based on these tests, we concluded that goodwill was impaired. We recorded a goodwill impairment charge of $5.4 million in our Power Products segment related to these assets. See Note 4 for more information.
Selling and Administrative Expenses. Selling and administrative expenses increased $1.0 million, or 25.4%, to $5.1 million for the fiscal year ended May 2, 2009 compared to $4.1 million for the fiscal year ended May 3, 2008. Selling and administrative expenses increased due to the Tribotek acquisition on March 30, 2008, partially offset by lower commission and bonus expenses in fiscal 2009. Selling and administrative expenses as a percentage of net sales increased to 12.0% in the fiscal 2009 from 9.0% in fiscal 2008.
Other, Net. Other, net was an expense of $0.2 million for the fiscal year ended May 2, 2009, compared to no other, net for the fiscal year ended May 3, 2008.
Income/(Loss) Before Income Taxes. Power Products segment income/(loss) before income taxes decreased by $14.2 million to a loss of $5.7 million for the fiscal year ended May 2, 2009 from a profit of $8.5 million for the fiscal year ended May 3, 2008 due to impairment of goodwill, decreased sales of products which became end-of-life at the end of fiscal year 2008, restructuring costs, higher material, labor and shipping costs, expenses related to Tribotek, partially offset by lower commission and bonus expenses.
Other Segment Results
Below is a table summarizing results for the years ended:(in millions)
May 2, May 3,2009 2008 Net Change Net Change
Net sales 8.2$ 6.9$ 1.3$ 18.8%
Cost of products sold 8.9 6.7 2.2 32.8%
Gross margins (0.7) 0.2 (0.9) 0.0%
Impairment of goodwill and intangible assets 1.6 - 1.6 0.0%Selling and administrative expenses 2.8 2.0 0.8 40.0%
Loss before income taxes (5.1)$ (1.8)$ (3.3)$ 183.3%
May 2, May 3,Percent of sales: 2009 2008Net sales 100.0% 100.0%Cost of products sold 108.5% 97.1%Gross margins -8.5% 2.9%Impairment of goodwill and intangible assets 19.5% 0.0%Selling and administrative expenses 34.1% 29.0%Loss before income taxes -62.2% -26.1%
10k.indd 25 7/16/09 1:18:13 PM
26 2726
Other Segment Results - Continued
Net Sales. The Other segment net sales increased $1.3 million to $8.2 million for the fiscal year ended May 2, 2009 as compared to $6.9 million for the fiscal year ended May 3, 2008. Net sales from our torque-sensing business increased 60.6% and net sales from our testing facilities increased 11.2% in fiscal 2009 as compared to fiscal 2008.
Cost of Products Sold. Other segment cost of products sold increased $2.2 million to $8.9 million for the fiscal year ended May 2, 2009 compared to $6.7 million for the fiscal year ended May 3, 2008. The increase is due to additional support staff in our U.S. testing facilities and a new testing facility that was opened in Shanghai, China during the second quarter of fiscal 2009.
Gross Margins . The Other segment gross margins was a loss of $0.7 million for fiscal 2009, compared to income $0.2 million for fiscal 2008. Gross margins declined in fiscal 2009 due to the increase in additional support staff in our U.S. testing facilities and the new testing facility in Shanghai, China.
Impairment of Goodwill and Intangible Assets. Based on events and general business declines, we performed “step one” and “step two” of the goodwill impairment test in accordance with paragraph 19 of SFAS No. 142, on the reporting units that had goodwill during fiscal 2009. Based on these tests, we concluded that goodwill was impaired. We recorded a goodwill impairment charge of $1.2 million in our Other segment related to these assets. See Note 4 for more information.
Also, in accordance with FASB Statement No. 144, “Accounting for the Impairment or Disposal of Long-Lived Assets”, during the fourth quarter of fiscal 2009, based on our future estimates of the undiscounted cash flows, it was determined that certain identifiable assets were impaired. We recorded an impairment charge of $0.4 million for these assets. See Note 4 for more information.
Selling and Administrative Expenses. Selling and administrative expenses increased $0.8 million to $2.8 million for the fiscal year ended May 2, 2009 compared to $2.0 million for the fiscal year ended May 3, 2008. The increase is primarily due to the new testing facility in Shanghai, China. Selling and administrative expenses as a percentage of net sales increased to 34.1% in fiscal 2009 from 29.0% in fiscal 2008.
Loss Before Income Taxes. The Other segment loss before income taxes was $5.1 million for the fiscal year ended May 2, 2009 compared to $1.8 million for the fiscal year ended May 3, 2008. The increase in the loss before income taxes is due the impairment of goodwill and intangible assets, additional support staff for our North American testing facilities as well as costs associated with the new testing facility in Shanghai, China.
27
Results of Operations for the Fiscal Year Ended May 3, 2008 (53 weeks) as Compared to the Fiscal Year Ended April 28, 2007 (52 weeks)
Consolidated Results Below is a table summarizing results for the years ended:(in millions)
May 3, April 28,2008 2007 Net Change Net Change
Net sales 551.1$ 448.4$ 102.7$ 22.9%Other income 1.9 1.6 0.3 18.8%
553.0 450.0 103.0 22.9%
Cost of products sold 428.4 359.9 68.5 19.0%
Gross margins (including other income) 124.6 90.1 34.5 38.3%
Restructuring 5.2 2.0 3.2 160.0%Selling and administrative expenses 61.5 50.2 11.3 22.5%Amortization of intangibles 6.0 4.7 1.3 27.7%Impairment of assets 1.5 0.4 1.1 290.5%Interest income, net 2.3 3.4 (1.1) -32.4%Other expense (3.2) (0.4) (2.8) 700.0%Income taxes 9.7 9.8 (0.1) -1.0%Cumulative effect of accounting change - 0.1 (0.1) -100.0%
Net income 39.8$ 26.1$ 13.7$ 52.5%
May 3, April 28,Percent of sales: 2008 2007Net sales 100.0% 100.0%Other income 0.3% 0.4%Cost of products sold 77.7% 80.3%Gross margins (including other income) 22.6% 20.1%Restructuring 0.9% 0.4%Selling and administrative expenses 11.2% 11.2%Amortization of intangibles 1.1% 1.0%Impairment of assets 0.3% 0.1%Interest income, net 0.4% 0.8%Other expense -0.6% -0.1%Income taxes 1.8% 2.2%Cumulative effect of accounting change 0.0% 0.0%Net income 7.2% 5.8%
Net Sales. Consolidated net sales increased $102.7 million, or 22.9%, to $551.1 million for the fiscal year ended May 3, 2008 from $448.4 million for the fiscal year ended April 28, 2007. Of the increase, $51.3 million relates to our TouchSensor and VEP acquisitions. The increase was also driven by strong organic growth from our European and Asian operations. Sales from those operations increased 36.1% during fiscal 2008 as compared to fiscal 2007. Automotive segment sales were also favorably impacted by price increases of $20.7 million on what were previously marginally profitable and unprofitable products, which we had decided to exit at the expiration of our manufacturing commitment, but, at the request of the customer, have agreed to continue to produce at higher prices. Excluding TouchSensor, the Interconnect segment sales increased 9.9% for fiscal 2008 due to strong sales from our Asian connector and European optical businesses. Excluding VEP, the Power Products segment sales decreased 3.6% for fiscal 2008 as compared to fiscal 2007. Translation of foreign operations net sales in fiscal 2008
10k.indd 26 7/16/09 1:18:14 PM
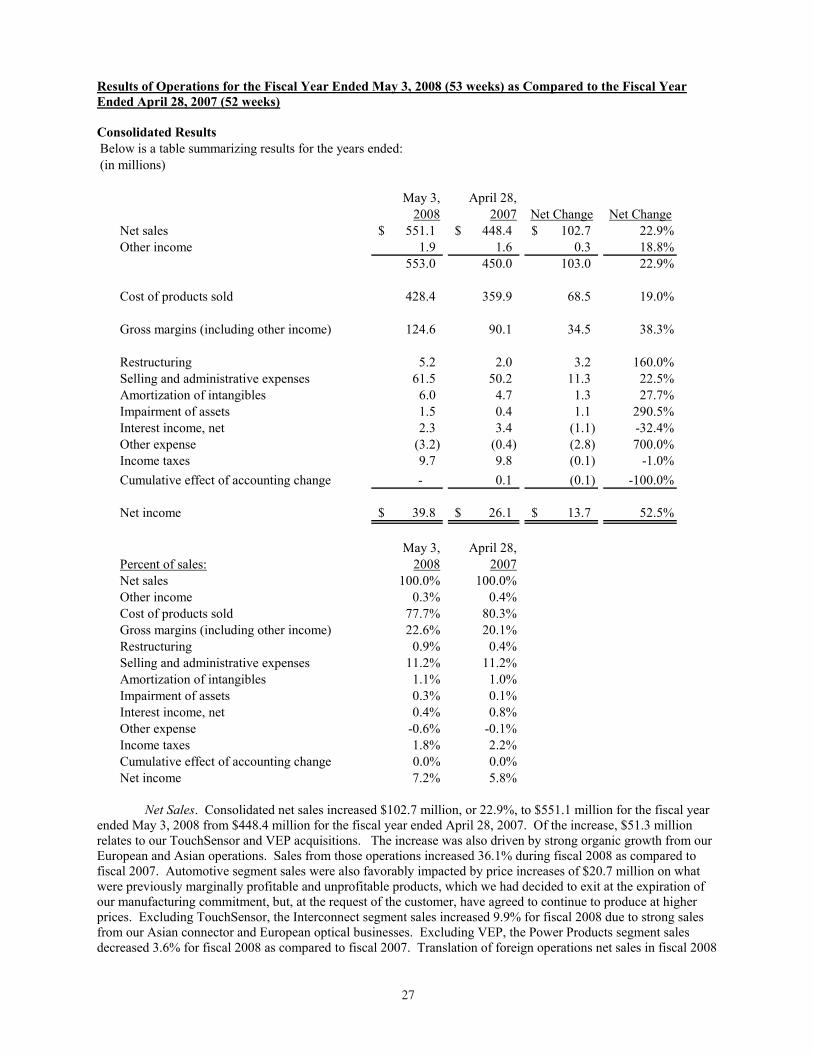
26 2726
Other Segment Results - Continued
Net Sales. The Other segment net sales increased $1.3 million to $8.2 million for the fiscal year ended May 2, 2009 as compared to $6.9 million for the fiscal year ended May 3, 2008. Net sales from our torque-sensing business increased 60.6% and net sales from our testing facilities increased 11.2% in fiscal 2009 as compared to fiscal 2008.
Cost of Products Sold. Other segment cost of products sold increased $2.2 million to $8.9 million for the fiscal year ended May 2, 2009 compared to $6.7 million for the fiscal year ended May 3, 2008. The increase is due to additional support staff in our U.S. testing facilities and a new testing facility that was opened in Shanghai, China during the second quarter of fiscal 2009.
Gross Margins . The Other segment gross margins was a loss of $0.7 million for fiscal 2009, compared to income $0.2 million for fiscal 2008. Gross margins declined in fiscal 2009 due to the increase in additional support staff in our U.S. testing facilities and the new testing facility in Shanghai, China.
Impairment of Goodwill and Intangible Assets. Based on events and general business declines, we performed “step one” and “step two” of the goodwill impairment test in accordance with paragraph 19 of SFAS No. 142, on the reporting units that had goodwill during fiscal 2009. Based on these tests, we concluded that goodwill was impaired. We recorded a goodwill impairment charge of $1.2 million in our Other segment related to these assets. See Note 4 for more information.
Also, in accordance with FASB Statement No. 144, “Accounting for the Impairment or Disposal of Long-Lived Assets”, during the fourth quarter of fiscal 2009, based on our future estimates of the undiscounted cash flows, it was determined that certain identifiable assets were impaired. We recorded an impairment charge of $0.4 million for these assets. See Note 4 for more information.
Selling and Administrative Expenses. Selling and administrative expenses increased $0.8 million to $2.8 million for the fiscal year ended May 2, 2009 compared to $2.0 million for the fiscal year ended May 3, 2008. The increase is primarily due to the new testing facility in Shanghai, China. Selling and administrative expenses as a percentage of net sales increased to 34.1% in fiscal 2009 from 29.0% in fiscal 2008.
Loss Before Income Taxes. The Other segment loss before income taxes was $5.1 million for the fiscal year ended May 2, 2009 compared to $1.8 million for the fiscal year ended May 3, 2008. The increase in the loss before income taxes is due the impairment of goodwill and intangible assets, additional support staff for our North American testing facilities as well as costs associated with the new testing facility in Shanghai, China.
27
Results of Operations for the Fiscal Year Ended May 3, 2008 (53 weeks) as Compared to the Fiscal Year Ended April 28, 2007 (52 weeks)
Consolidated Results Below is a table summarizing results for the years ended:(in millions)
May 3, April 28,2008 2007 Net Change Net Change
Net sales 551.1$ 448.4$ 102.7$ 22.9%Other income 1.9 1.6 0.3 18.8%
553.0 450.0 103.0 22.9%
Cost of products sold 428.4 359.9 68.5 19.0%
Gross margins (including other income) 124.6 90.1 34.5 38.3%
Restructuring 5.2 2.0 3.2 160.0%Selling and administrative expenses 61.5 50.2 11.3 22.5%Amortization of intangibles 6.0 4.7 1.3 27.7%Impairment of assets 1.5 0.4 1.1 290.5%Interest income, net 2.3 3.4 (1.1) -32.4%Other expense (3.2) (0.4) (2.8) 700.0%Income taxes 9.7 9.8 (0.1) -1.0%Cumulative effect of accounting change - 0.1 (0.1) -100.0%
Net income 39.8$ 26.1$ 13.7$ 52.5%
May 3, April 28,Percent of sales: 2008 2007Net sales 100.0% 100.0%Other income 0.3% 0.4%Cost of products sold 77.7% 80.3%Gross margins (including other income) 22.6% 20.1%Restructuring 0.9% 0.4%Selling and administrative expenses 11.2% 11.2%Amortization of intangibles 1.1% 1.0%Impairment of assets 0.3% 0.1%Interest income, net 0.4% 0.8%Other expense -0.6% -0.1%Income taxes 1.8% 2.2%Cumulative effect of accounting change 0.0% 0.0%Net income 7.2% 5.8%
Net Sales. Consolidated net sales increased $102.7 million, or 22.9%, to $551.1 million for the fiscal year ended May 3, 2008 from $448.4 million for the fiscal year ended April 28, 2007. Of the increase, $51.3 million relates to our TouchSensor and VEP acquisitions. The increase was also driven by strong organic growth from our European and Asian operations. Sales from those operations increased 36.1% during fiscal 2008 as compared to fiscal 2007. Automotive segment sales were also favorably impacted by price increases of $20.7 million on what were previously marginally profitable and unprofitable products, which we had decided to exit at the expiration of our manufacturing commitment, but, at the request of the customer, have agreed to continue to produce at higher prices. Excluding TouchSensor, the Interconnect segment sales increased 9.9% for fiscal 2008 due to strong sales from our Asian connector and European optical businesses. Excluding VEP, the Power Products segment sales decreased 3.6% for fiscal 2008 as compared to fiscal 2007. Translation of foreign operations net sales in fiscal 2008
10k.indd 27 7/16/09 1:18:14 PM
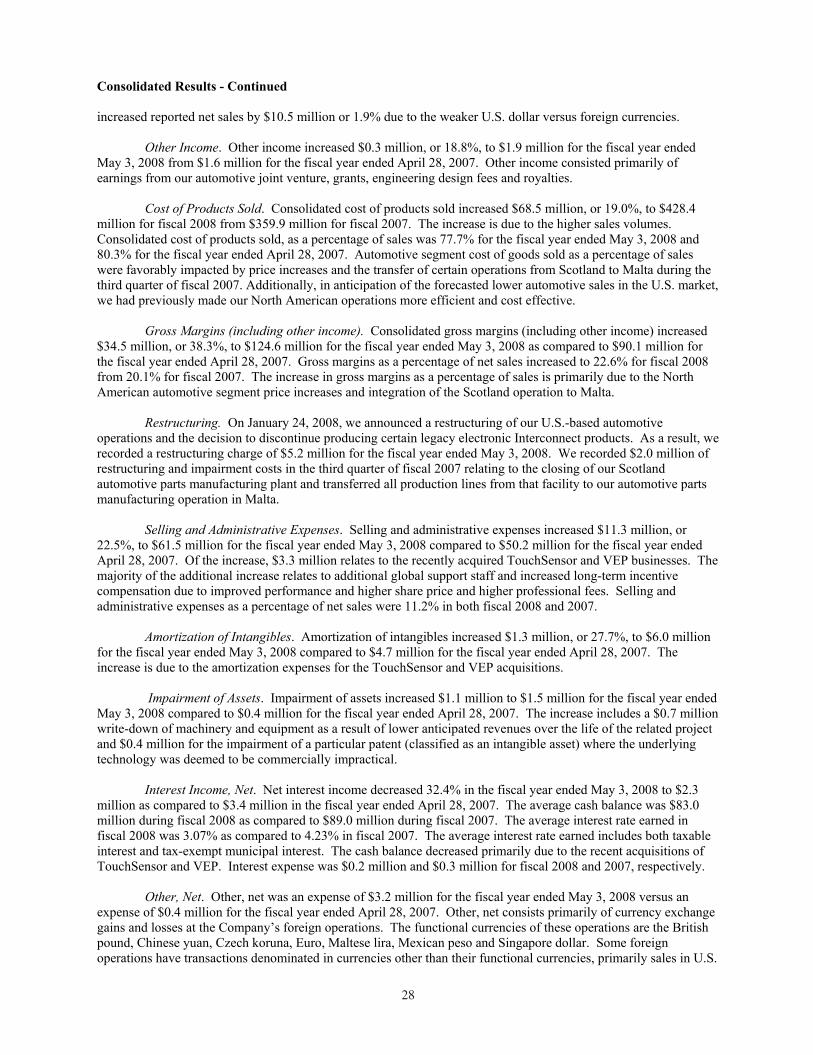
28 2928
Consolidated Results - Continued
increased reported net sales by $10.5 million or 1.9% due to the weaker U.S. dollar versus foreign currencies.
Other Income. Other income increased $0.3 million, or 18.8%, to $1.9 million for the fiscal year ended May 3, 2008 from $1.6 million for the fiscal year ended April 28, 2007. Other income consisted primarily of earnings from our automotive joint venture, grants, engineering design fees and royalties.
Cost of Products Sold. Consolidated cost of products sold increased $68.5 million, or 19.0%, to $428.4 million for fiscal 2008 from $359.9 million for fiscal 2007. The increase is due to the higher sales volumes. Consolidated cost of products sold, as a percentage of sales was 77.7% for the fiscal year ended May 3, 2008 and 80.3% for the fiscal year ended April 28, 2007. Automotive segment cost of goods sold as a percentage of sales were favorably impacted by price increases and the transfer of certain operations from Scotland to Malta during the third quarter of fiscal 2007. Additionally, in anticipation of the forecasted lower automotive sales in the U.S. market, we had previously made our North American operations more efficient and cost effective.
Gross Margins (including other income). Consolidated gross margins (including other income) increased $34.5 million, or 38.3%, to $124.6 million for the fiscal year ended May 3, 2008 as compared to $90.1 million for the fiscal year ended April 28, 2007. Gross margins as a percentage of net sales increased to 22.6% for fiscal 2008 from 20.1% for fiscal 2007. The increase in gross margins as a percentage of sales is primarily due to the North American automotive segment price increases and integration of the Scotland operation to Malta.
Restructuring. On January 24, 2008, we announced a restructuring of our U.S.-based automotive operations and the decision to discontinue producing certain legacy electronic Interconnect products. As a result, we recorded a restructuring charge of $5.2 million for the fiscal year ended May 3, 2008. We recorded $2.0 million of restructuring and impairment costs in the third quarter of fiscal 2007 relating to the closing of our Scotland automotive parts manufacturing plant and transferred all production lines from that facility to our automotive parts manufacturing operation in Malta.
Selling and Administrative Expenses. Selling and administrative expenses increased $11.3 million, or 22.5%, to $61.5 million for the fiscal year ended May 3, 2008 compared to $50.2 million for the fiscal year ended April 28, 2007. Of the increase, $3.3 million relates to the recently acquired TouchSensor and VEP businesses. The majority of the additional increase relates to additional global support staff and increased long-term incentive compensation due to improved performance and higher share price and higher professional fees. Selling and administrative expenses as a percentage of net sales were 11.2% in both fiscal 2008 and 2007.
Amortization of Intangibles. Amortization of intangibles increased $1.3 million, or 27.7%, to $6.0 million for the fiscal year ended May 3, 2008 compared to $4.7 million for the fiscal year ended April 28, 2007. The increase is due to the amortization expenses for the TouchSensor and VEP acquisitions.
Impairment of Assets. Impairment of assets increased $1.1 million to $1.5 million for the fiscal year ended May 3, 2008 compared to $0.4 million for the fiscal year ended April 28, 2007. The increase includes a $0.7 million write-down of machinery and equipment as a result of lower anticipated revenues over the life of the related project and $0.4 million for the impairment of a particular patent (classified as an intangible asset) where the underlying technology was deemed to be commercially impractical.
Interest Income, Net. Net interest income decreased 32.4% in the fiscal year ended May 3, 2008 to $2.3 million as compared to $3.4 million in the fiscal year ended April 28, 2007. The average cash balance was $83.0 million during fiscal 2008 as compared to $89.0 million during fiscal 2007. The average interest rate earned in fiscal 2008 was 3.07% as compared to 4.23% in fiscal 2007. The average interest rate earned includes both taxable interest and tax-exempt municipal interest. The cash balance decreased primarily due to the recent acquisitions of TouchSensor and VEP. Interest expense was $0.2 million and $0.3 million for fiscal 2008 and 2007, respectively.
Other, Net. Other, net was an expense of $3.2 million for the fiscal year ended May 3, 2008 versus an expense of $0.4 million for the fiscal year ended April 28, 2007. Other, net consists primarily of currency exchange gains and losses at the Company’s foreign operations. The functional currencies of these operations are the British pound, Chinese yuan, Czech koruna, Euro, Maltese lira, Mexican peso and Singapore dollar. Some foreign operations have transactions denominated in currencies other than their functional currencies, primarily sales in U.S.
29
Consolidated Results - Continued
dollars and Euros, creating exchange rate sensitivities. Effective January 1, 2008, the Euro replaced the Maltese lira as the functional currency of Malta.
During fiscal 2008, we recorded a charge of $0.5 million relating to a reduction of the net asset value (NAV) on a portion of our short-term investments which is an enhanced cash fund sold as an alternative to traditional money market funds. We have historically invested a portion of our cash in the fund. During the third quarter, the fund was overwhelmed with withdrawal requests and a restriction was placed on the redemption ability of the fund. Therefore, during the fiscal year, we recorded a realized loss of $0.1 million on partial redemptions and an unrealized loss of $0.4 million for the reduction in the NAV’s principal balance.
Income Taxes. The effective income tax rate was 19.7% for fiscal 2008 compared with 27.4% for the fiscal 2007. During fiscal 2008, we recognized a benefit of $0.3 million relating to the expiration of certain statute of limitations for tax positions that were not challenged by the taxing authorities. In addition, we recognized $1.5 million relating to tax return reconciliations compared to income tax provisions during the fiscal year ended May 3, 2008. The effective tax rates for both fiscal years 2008 and 2007 reflect utilization of foreign investment tax credits and the effect of lower tax rates on income of our foreign earnings and higher earnings at those operations.
Net Income. Net income increased $13.7 million, or 52.5%, to $39.8 million for the fiscal year ended May 3, 2008 as compared to $26.1 million for the fiscal year ended April 28, 2007 due to the automotive segment price increases, strong sales and increased efficiencies from our European and Asian operations, offset slightly by higher selling and administrative expenses. In addition, restructuring costs increased by $3.2 million and our effective tax rate was 19.7% during fiscal 2008. Net income as a percentage of sales increased to 7.2% for the fiscal year ended May 3, 2008 as compared to 5.8% for fiscal 2007.
10k.indd 28 7/16/09 1:18:15 PM
28 2928
Consolidated Results - Continued
increased reported net sales by $10.5 million or 1.9% due to the weaker U.S. dollar versus foreign currencies.
Other Income. Other income increased $0.3 million, or 18.8%, to $1.9 million for the fiscal year ended May 3, 2008 from $1.6 million for the fiscal year ended April 28, 2007. Other income consisted primarily of earnings from our automotive joint venture, grants, engineering design fees and royalties.
Cost of Products Sold. Consolidated cost of products sold increased $68.5 million, or 19.0%, to $428.4 million for fiscal 2008 from $359.9 million for fiscal 2007. The increase is due to the higher sales volumes. Consolidated cost of products sold, as a percentage of sales was 77.7% for the fiscal year ended May 3, 2008 and 80.3% for the fiscal year ended April 28, 2007. Automotive segment cost of goods sold as a percentage of sales were favorably impacted by price increases and the transfer of certain operations from Scotland to Malta during the third quarter of fiscal 2007. Additionally, in anticipation of the forecasted lower automotive sales in the U.S. market, we had previously made our North American operations more efficient and cost effective.
Gross Margins (including other income). Consolidated gross margins (including other income) increased $34.5 million, or 38.3%, to $124.6 million for the fiscal year ended May 3, 2008 as compared to $90.1 million for the fiscal year ended April 28, 2007. Gross margins as a percentage of net sales increased to 22.6% for fiscal 2008 from 20.1% for fiscal 2007. The increase in gross margins as a percentage of sales is primarily due to the North American automotive segment price increases and integration of the Scotland operation to Malta.
Restructuring. On January 24, 2008, we announced a restructuring of our U.S.-based automotive operations and the decision to discontinue producing certain legacy electronic Interconnect products. As a result, we recorded a restructuring charge of $5.2 million for the fiscal year ended May 3, 2008. We recorded $2.0 million of restructuring and impairment costs in the third quarter of fiscal 2007 relating to the closing of our Scotland automotive parts manufacturing plant and transferred all production lines from that facility to our automotive parts manufacturing operation in Malta.
Selling and Administrative Expenses. Selling and administrative expenses increased $11.3 million, or 22.5%, to $61.5 million for the fiscal year ended May 3, 2008 compared to $50.2 million for the fiscal year ended April 28, 2007. Of the increase, $3.3 million relates to the recently acquired TouchSensor and VEP businesses. The majority of the additional increase relates to additional global support staff and increased long-term incentive compensation due to improved performance and higher share price and higher professional fees. Selling and administrative expenses as a percentage of net sales were 11.2% in both fiscal 2008 and 2007.
Amortization of Intangibles. Amortization of intangibles increased $1.3 million, or 27.7%, to $6.0 million for the fiscal year ended May 3, 2008 compared to $4.7 million for the fiscal year ended April 28, 2007. The increase is due to the amortization expenses for the TouchSensor and VEP acquisitions.
Impairment of Assets. Impairment of assets increased $1.1 million to $1.5 million for the fiscal year ended May 3, 2008 compared to $0.4 million for the fiscal year ended April 28, 2007. The increase includes a $0.7 million write-down of machinery and equipment as a result of lower anticipated revenues over the life of the related project and $0.4 million for the impairment of a particular patent (classified as an intangible asset) where the underlying technology was deemed to be commercially impractical.
Interest Income, Net. Net interest income decreased 32.4% in the fiscal year ended May 3, 2008 to $2.3 million as compared to $3.4 million in the fiscal year ended April 28, 2007. The average cash balance was $83.0 million during fiscal 2008 as compared to $89.0 million during fiscal 2007. The average interest rate earned in fiscal 2008 was 3.07% as compared to 4.23% in fiscal 2007. The average interest rate earned includes both taxable interest and tax-exempt municipal interest. The cash balance decreased primarily due to the recent acquisitions of TouchSensor and VEP. Interest expense was $0.2 million and $0.3 million for fiscal 2008 and 2007, respectively.
Other, Net. Other, net was an expense of $3.2 million for the fiscal year ended May 3, 2008 versus an expense of $0.4 million for the fiscal year ended April 28, 2007. Other, net consists primarily of currency exchange gains and losses at the Company’s foreign operations. The functional currencies of these operations are the British pound, Chinese yuan, Czech koruna, Euro, Maltese lira, Mexican peso and Singapore dollar. Some foreign operations have transactions denominated in currencies other than their functional currencies, primarily sales in U.S.
29
Consolidated Results - Continued
dollars and Euros, creating exchange rate sensitivities. Effective January 1, 2008, the Euro replaced the Maltese lira as the functional currency of Malta.
During fiscal 2008, we recorded a charge of $0.5 million relating to a reduction of the net asset value (NAV) on a portion of our short-term investments which is an enhanced cash fund sold as an alternative to traditional money market funds. We have historically invested a portion of our cash in the fund. During the third quarter, the fund was overwhelmed with withdrawal requests and a restriction was placed on the redemption ability of the fund. Therefore, during the fiscal year, we recorded a realized loss of $0.1 million on partial redemptions and an unrealized loss of $0.4 million for the reduction in the NAV’s principal balance.
Income Taxes. The effective income tax rate was 19.7% for fiscal 2008 compared with 27.4% for the fiscal 2007. During fiscal 2008, we recognized a benefit of $0.3 million relating to the expiration of certain statute of limitations for tax positions that were not challenged by the taxing authorities. In addition, we recognized $1.5 million relating to tax return reconciliations compared to income tax provisions during the fiscal year ended May 3, 2008. The effective tax rates for both fiscal years 2008 and 2007 reflect utilization of foreign investment tax credits and the effect of lower tax rates on income of our foreign earnings and higher earnings at those operations.
Net Income. Net income increased $13.7 million, or 52.5%, to $39.8 million for the fiscal year ended May 3, 2008 as compared to $26.1 million for the fiscal year ended April 28, 2007 due to the automotive segment price increases, strong sales and increased efficiencies from our European and Asian operations, offset slightly by higher selling and administrative expenses. In addition, restructuring costs increased by $3.2 million and our effective tax rate was 19.7% during fiscal 2008. Net income as a percentage of sales increased to 7.2% for the fiscal year ended May 3, 2008 as compared to 5.8% for fiscal 2007.
10k.indd 29 7/16/09 1:18:15 PM
30 3130
Operating Segments
Automotive Segment Results
Below is a table summarizing results for the years ended:(in millions)
May 3, April 28,2008 2007 Net Change Net Change
Net sales 362.1$ 315.7$ 46.4$ 14.7%Other income 0.9 - 0.9 0.0%
363.0 315.7 47.3 15.0%
Cost of products sold 282.0 265.1 16.9 6.4%
Gross margins (including other income) 81.0 50.6 30.4 60.1%
Restructuring 4.5 2.0 2.5 125.0%Impairment of assets 1.5 0.4 1.1 275.0%Selling and administrative expenses 18.0 19.2 (1.2) -6.3%Interest, net - income/(expense) - (0.3) 0.3 0.0%Other, net - income/(expense) (1.7) (1.3) (0.4) 30.8%
Income before income taxes 55.3$ 27.4$ 27.9$ 101.8%
May 3, April 28,Percent of sales: 2008 2007Net sales 100.0% 100.0%Other income 0.2% 0.0%Cost of products sold 77.9% 84.0%Gross margins (including other income) 22.4% 16.0%Restructuring 1.2% 0.6%Impairment of assets 0.4% 0.1%Selling and administrative expenses 5.0% 6.1%Interest income, net 0.0% -0.1%Other, net -0.5% -0.4%Income before income taxes 15.3% 8.7%
Net Sales. Automotive segment net sales increased $46.4 million, or 14.7%, to $362.1 million for the fiscal year ended May 3, 2008 from $315.7 million for the fiscal year ended April 28, 2007. Sales were also favorably impacted by price increases of $20.7 million on what was previously marginally profitable and unprofitable products, which we had decided to exit at the expiration of our manufacturing commitment, but, at the request of the customer, have agreed to continue to produce at higher prices. Additionally, automotive segment net sales increased from organic growth from our European and Asian operations. Net sales from these operations increased 32.7% for fiscal 2008. We expect to discontinue producing these products during fiscal 2009. Excluding the price increases, North American automotive segment sales decreased 5.5% in fiscal 2008. Translation of foreign operations net sales in fiscal 2008 increased reported net sales by $9.2 million, or 2.5%, due to the weaker U.S. dollar versus foreign currencies.
Other Income. Other income was $0.9 million for the fiscal year ended May 3, 2008 from no other income for fiscal year ended April 28, 2007. Other income consisted primarily of earnings from engineering design fees and royalties.
Cost of Products Sold. Automotive segment cost of products sold increased $16.9 million to $282.0 million for the fiscal year ended May 3, 2008 from $265.1 for the fiscal year ended April 28, 2007. The increase
31
Automotive Segment Results - Continued
relates to higher sales volumes. Automotive segment costs of products sold as a percentage of sales decreased to 77.9% for fiscal 2008 from 84.0% for fiscal 2007. Automotive segment cost of goods sold as a percentage of sales was favorably impacted by the price increases. The integration of our Scotland operation to our Malta operation has increased efficiency in our European manufacturing processes. Additionally, in anticipation of the forecasted lower automotive sales in the U.S. market, we had previously made our North American operations more efficient and cost effective.
Gross Margins (including other income). Automotive segment gross margins (including other income) increased $30.4 million, or 60.1%, to $81.0 million for the fiscal year ended May 3, 2008 as compared to $50.6 million for the fiscal year ended April 28, 2007. The increase in gross profit as a percentage of sales is primarily due to the price increases and integration of the Scotland operation to Malta. Gross margins (including other income) as a percentage of net sales increased to 22.4% for fiscal 2008 from 16.0% for fiscal 2007.
Restructuring. On January 24, 2008, we announced a restructuring of our U.S.-based automotive operations. As a result, we recorded a restructuring charge of $4.5 million, $2.7 million relating to employee severance, $1.3 million relating to impairment and accelerated depreciation for assets and $0.5 million for professional fees. We recorded $2.0 million of restructuring and impairment costs in the third quarter of fiscal 2007 relating to the closing of our Scotland automotive parts manufacturing plant and transferred all production lines from that facility to our automotive parts manufacturing operation in Malta.
Impairment of Assets. Impairment of assets increased $1.1 million to $1.5 million for the fiscal year ended May 3, 2008 compared to $0.4 million for the fiscal year ended April 28, 2007. The increase includes a $0.7 million write-down of machinery and equipment as a result of lower anticipated revenues over the life of the related project and $0.4 million for the impairment of a particular patent (classified as an intangible asset) where the underlying technology was deemed to be commercially impractical.
Selling and Administrative Expenses. Selling and administrative expenses decreased $1.2 million, or 6.3%, to $18.0 million for the fiscal year ended May 3, 2008 compared to $19.2 million for the fiscal year ended April 28, 2007. The decrease is due the integration of the Scotland operation to Malta in the third quarter of fiscal 2007. Selling and administrative expenses as a percentage of net sales decreased to 5.0% in fiscal 2008 from 6.1% in fiscal 2007.
Interest Expense, Net. Net interest expense was zero for the fiscal year ended May 3, 2008, compared to an expense of $0.3 million for the fiscal year ended April 28, 2007.
Other Expense, Net. Other expense, net was $1.7 million for the fiscal year ended May 3, 2009, compared to $1.3 million for the fiscal year ended April 28, 2007. The increase is primarily due to the weakening of the U.S. dollar versus the Euro and Czech koruna during fiscal 2008 as compared to fiscal 2007. The functional currencies of these operations are the British pound, Chinese yuan, Czech koruna, Euro, Mexican peso and Singapore dollar. Some foreign operations have transactions denominated in currencies other than their functional currencies, primarily sales in U.S. dollars and Euros, creating exchange rate sensitivities.
Income Before Income Taxes. Automotive segment income before income taxes increased $27.9 million, or 101.8%, to $55.3 million for the fiscal year ended May 3, 2008 compared to $27.4 million for the fiscal year ended April 28, 2007 due to the price increases, strong sales in Europe and Asia and integration of our Scotland operation to our Malta operation, offset by restructuring costs.
10k.indd 30 7/16/09 1:18:16 PM

30 3130
Operating Segments
Automotive Segment Results
Below is a table summarizing results for the years ended:(in millions)
May 3, April 28,2008 2007 Net Change Net Change
Net sales 362.1$ 315.7$ 46.4$ 14.7%Other income 0.9 - 0.9 0.0%
363.0 315.7 47.3 15.0%
Cost of products sold 282.0 265.1 16.9 6.4%
Gross margins (including other income) 81.0 50.6 30.4 60.1%
Restructuring 4.5 2.0 2.5 125.0%Impairment of assets 1.5 0.4 1.1 275.0%Selling and administrative expenses 18.0 19.2 (1.2) -6.3%Interest, net - income/(expense) - (0.3) 0.3 0.0%Other, net - income/(expense) (1.7) (1.3) (0.4) 30.8%
Income before income taxes 55.3$ 27.4$ 27.9$ 101.8%
May 3, April 28,Percent of sales: 2008 2007Net sales 100.0% 100.0%Other income 0.2% 0.0%Cost of products sold 77.9% 84.0%Gross margins (including other income) 22.4% 16.0%Restructuring 1.2% 0.6%Impairment of assets 0.4% 0.1%Selling and administrative expenses 5.0% 6.1%Interest income, net 0.0% -0.1%Other, net -0.5% -0.4%Income before income taxes 15.3% 8.7%
Net Sales. Automotive segment net sales increased $46.4 million, or 14.7%, to $362.1 million for the fiscal year ended May 3, 2008 from $315.7 million for the fiscal year ended April 28, 2007. Sales were also favorably impacted by price increases of $20.7 million on what was previously marginally profitable and unprofitable products, which we had decided to exit at the expiration of our manufacturing commitment, but, at the request of the customer, have agreed to continue to produce at higher prices. Additionally, automotive segment net sales increased from organic growth from our European and Asian operations. Net sales from these operations increased 32.7% for fiscal 2008. We expect to discontinue producing these products during fiscal 2009. Excluding the price increases, North American automotive segment sales decreased 5.5% in fiscal 2008. Translation of foreign operations net sales in fiscal 2008 increased reported net sales by $9.2 million, or 2.5%, due to the weaker U.S. dollar versus foreign currencies.
Other Income. Other income was $0.9 million for the fiscal year ended May 3, 2008 from no other income for fiscal year ended April 28, 2007. Other income consisted primarily of earnings from engineering design fees and royalties.
Cost of Products Sold. Automotive segment cost of products sold increased $16.9 million to $282.0 million for the fiscal year ended May 3, 2008 from $265.1 for the fiscal year ended April 28, 2007. The increase
31
Automotive Segment Results - Continued
relates to higher sales volumes. Automotive segment costs of products sold as a percentage of sales decreased to 77.9% for fiscal 2008 from 84.0% for fiscal 2007. Automotive segment cost of goods sold as a percentage of sales was favorably impacted by the price increases. The integration of our Scotland operation to our Malta operation has increased efficiency in our European manufacturing processes. Additionally, in anticipation of the forecasted lower automotive sales in the U.S. market, we had previously made our North American operations more efficient and cost effective.
Gross Margins (including other income). Automotive segment gross margins (including other income) increased $30.4 million, or 60.1%, to $81.0 million for the fiscal year ended May 3, 2008 as compared to $50.6 million for the fiscal year ended April 28, 2007. The increase in gross profit as a percentage of sales is primarily due to the price increases and integration of the Scotland operation to Malta. Gross margins (including other income) as a percentage of net sales increased to 22.4% for fiscal 2008 from 16.0% for fiscal 2007.
Restructuring. On January 24, 2008, we announced a restructuring of our U.S.-based automotive operations. As a result, we recorded a restructuring charge of $4.5 million, $2.7 million relating to employee severance, $1.3 million relating to impairment and accelerated depreciation for assets and $0.5 million for professional fees. We recorded $2.0 million of restructuring and impairment costs in the third quarter of fiscal 2007 relating to the closing of our Scotland automotive parts manufacturing plant and transferred all production lines from that facility to our automotive parts manufacturing operation in Malta.
Impairment of Assets. Impairment of assets increased $1.1 million to $1.5 million for the fiscal year ended May 3, 2008 compared to $0.4 million for the fiscal year ended April 28, 2007. The increase includes a $0.7 million write-down of machinery and equipment as a result of lower anticipated revenues over the life of the related project and $0.4 million for the impairment of a particular patent (classified as an intangible asset) where the underlying technology was deemed to be commercially impractical.
Selling and Administrative Expenses. Selling and administrative expenses decreased $1.2 million, or 6.3%, to $18.0 million for the fiscal year ended May 3, 2008 compared to $19.2 million for the fiscal year ended April 28, 2007. The decrease is due the integration of the Scotland operation to Malta in the third quarter of fiscal 2007. Selling and administrative expenses as a percentage of net sales decreased to 5.0% in fiscal 2008 from 6.1% in fiscal 2007.
Interest Expense, Net. Net interest expense was zero for the fiscal year ended May 3, 2008, compared to an expense of $0.3 million for the fiscal year ended April 28, 2007.
Other Expense, Net. Other expense, net was $1.7 million for the fiscal year ended May 3, 2009, compared to $1.3 million for the fiscal year ended April 28, 2007. The increase is primarily due to the weakening of the U.S. dollar versus the Euro and Czech koruna during fiscal 2008 as compared to fiscal 2007. The functional currencies of these operations are the British pound, Chinese yuan, Czech koruna, Euro, Mexican peso and Singapore dollar. Some foreign operations have transactions denominated in currencies other than their functional currencies, primarily sales in U.S. dollars and Euros, creating exchange rate sensitivities.
Income Before Income Taxes. Automotive segment income before income taxes increased $27.9 million, or 101.8%, to $55.3 million for the fiscal year ended May 3, 2008 compared to $27.4 million for the fiscal year ended April 28, 2007 due to the price increases, strong sales in Europe and Asia and integration of our Scotland operation to our Malta operation, offset by restructuring costs.
10k.indd 31 7/16/09 1:18:17 PM
32 3332
Interconnect Segment Results
Below is a table summarizing results for the years ended:(in millions)
May 3, April 28,2008 2007 Net Change Net Change
Net sales 136.3$ 82.1$ 54.2$ 66.0%Other income 0.3 0.6 (0.3) -50.0%
136.6 82.7 53.9 65.2%
Cost of products sold 104.7 58.0 46.7 80.5%
Gross margins (including other income) 31.9 24.7 7.2 29.1%
Restructuring 0.7 - 0.7 0.0%Selling and administrative expenses 25.8 16.3 9.5 58.3%Interest, net - income/(expense) 0.4 0.4 - 0.0%Other, net - income/(expense) (1.2) 0.5 (1.7) -340.0%
Income before income taxes 4.6$ 9.3$ (4.7)$ -50.5%
May 3, April 28,Percent of sales: 2008 2007Net sales 100.0% 100.0%Other income 0.2% 0.7%Cost of products sold 76.8% 70.6%Gross margins (including other income) 23.4% 30.1%Restructuring 0.5% 0.0%Selling and administrative expenses 18.9% 19.9%Interest income, net 0.3% 0.5%Other, net -0.9% 0.6%Income before income taxes 3.4% 11.3%
Net Sales. Interconnect segment net sales increased $54.2 million, or 66.0%, to $136.3 million for the fiscal year ended May 3, 2008 from $82.1 million for the fiscal year ended April 28, 2007. A majority of the sales increase is due to the TouchSensor acquisition. Sales from our Asian connector business increased 73.3% for fiscal 2008. Excluding TouchSensor, the Interconnect segment sales increased 9.9% for fiscal 2008 due to the strong sales from our Asian connector business. In addition, sales increased from our European optical business, offset by lower sales in our domestic data installation business. Translation of foreign operations net sales in fiscal 2008 increased reported net sales by $1.3 million, or 0.9%, due to the weaker U.S. dollar versus foreign currencies.
Other Income. Other income was $0.3 million for the fiscal year ended May 3, 2008 and $0.6 million for the fiscal year ended April 28, 2007. Other income consisted primarily of earnings from engineering design fees and royalties.
Cost of Products Sold. Interconnect segment cost of products sold increased $46.7 million to $104.7 million for the fiscal year ended May 3, 2008 compared to $58.0 million for the fiscal year ended April 28, 2007. The majority of the increase is due to cost of products sold from our TouchSensor acquisition. Interconnect segment cost of products sold as a percentage of net sales increased to 76.8% for fiscal 2008 compared to 70.6% for fiscal 2007. The increase is primarily due to the TouchSensor business, which has higher cost of products sold as a percentage of sales as compared to the other businesses in the Interconnect segment. We experienced lower sales in our domestic data center installation business and higher costs related to PC card adapters during fiscal 2008. In addition, we experienced increased costs due to overall lower sales volumes in our North American operations (excluding TouchSensor).
33
Interconnect Segment Results - Continued
Gross Margins (including other income). Interconnect segment gross margins (including other income) increased $7.2 million, or 29.1%, to $31.9 million for the fiscal year ended May 3, 2008 as compared to $24.7 million for the fiscal year ended April 28, 2007. The majority of the increase is due to the TouchSensor acquisition. In addition, gross margins increased in our Asian connector business and European optical business, partially offset by increased cost of products sold in our PC card adapter and data installation businesses. Gross margins (including other income) as a percentage of net sales decreased to 23.4% for fiscal 2008 from 30.1% for fiscal 2007.
Restructuring. On January 24, 2008, we announced our decision to discontinue producing certain legacy electronic Interconnect products. As a result, we recorded a restructuring charge of $0.7 million, $0.6 million for employee severance and $0.1 million for professional fees.
Selling and Administrative Expenses. Selling and administrative expenses increased $9.5 million, or 58.3%, to $25.8 million for the fiscal year ended May 3, 2008 compared to $16.3 million for the fiscal year ended April 28, 2007. Selling and administrative expenses are higher due to the TouchSensor acquisition and higher amortization expense in fiscal 2008 as compared to fiscal 2007. Selling and administrative expenses as a percentage of net sales decreased to 18.9% in fiscal 2008 from 19.9% in fiscal 2007.
Interest Income, Net. Net interest income was $0.4 million for both the fiscal years ended May 3, 2008 and April 28, 2007.
Other, Net. Other, net was expense of $1.2 million for the fiscal year ended May 3, 2008, compared to income of $0.5 million for the fiscal year ended April 28, 2007. The increase is primarily due to the weakening of the U.S. dollar versus the Euro and Czech koruna during fiscal 2008 as compared to fiscal 2007. The functional currencies of these operations are the British pound, Chinese yuan, Czech koruna, Euro, Mexican peso and Singapore dollar. Some foreign operations have transactions denominated in currencies other than their functional currencies, primarily sales in U.S. dollars and Euros, creating exchange rate sensitivities.
Income Before Income Taxes. Interconnect income before income taxes decreased $4.7 million, or 50.5%, to $4.6 million for the fiscal year ended May 3, 2008 compared to $9.3 million for the fiscal year ended April 28, 2007 due to the gross margin declines in our PC card adapter and data installation businesses, partially offset with increases from the TouchSensor business.
10k.indd 32 7/16/09 1:18:18 PM

32 3332
Interconnect Segment Results
Below is a table summarizing results for the years ended:(in millions)
May 3, April 28,2008 2007 Net Change Net Change
Net sales 136.3$ 82.1$ 54.2$ 66.0%Other income 0.3 0.6 (0.3) -50.0%
136.6 82.7 53.9 65.2%
Cost of products sold 104.7 58.0 46.7 80.5%
Gross margins (including other income) 31.9 24.7 7.2 29.1%
Restructuring 0.7 - 0.7 0.0%Selling and administrative expenses 25.8 16.3 9.5 58.3%Interest, net - income/(expense) 0.4 0.4 - 0.0%Other, net - income/(expense) (1.2) 0.5 (1.7) -340.0%
Income before income taxes 4.6$ 9.3$ (4.7)$ -50.5%
May 3, April 28,Percent of sales: 2008 2007Net sales 100.0% 100.0%Other income 0.2% 0.7%Cost of products sold 76.8% 70.6%Gross margins (including other income) 23.4% 30.1%Restructuring 0.5% 0.0%Selling and administrative expenses 18.9% 19.9%Interest income, net 0.3% 0.5%Other, net -0.9% 0.6%Income before income taxes 3.4% 11.3%
Net Sales. Interconnect segment net sales increased $54.2 million, or 66.0%, to $136.3 million for the fiscal year ended May 3, 2008 from $82.1 million for the fiscal year ended April 28, 2007. A majority of the sales increase is due to the TouchSensor acquisition. Sales from our Asian connector business increased 73.3% for fiscal 2008. Excluding TouchSensor, the Interconnect segment sales increased 9.9% for fiscal 2008 due to the strong sales from our Asian connector business. In addition, sales increased from our European optical business, offset by lower sales in our domestic data installation business. Translation of foreign operations net sales in fiscal 2008 increased reported net sales by $1.3 million, or 0.9%, due to the weaker U.S. dollar versus foreign currencies.
Other Income. Other income was $0.3 million for the fiscal year ended May 3, 2008 and $0.6 million for the fiscal year ended April 28, 2007. Other income consisted primarily of earnings from engineering design fees and royalties.
Cost of Products Sold. Interconnect segment cost of products sold increased $46.7 million to $104.7 million for the fiscal year ended May 3, 2008 compared to $58.0 million for the fiscal year ended April 28, 2007. The majority of the increase is due to cost of products sold from our TouchSensor acquisition. Interconnect segment cost of products sold as a percentage of net sales increased to 76.8% for fiscal 2008 compared to 70.6% for fiscal 2007. The increase is primarily due to the TouchSensor business, which has higher cost of products sold as a percentage of sales as compared to the other businesses in the Interconnect segment. We experienced lower sales in our domestic data center installation business and higher costs related to PC card adapters during fiscal 2008. In addition, we experienced increased costs due to overall lower sales volumes in our North American operations (excluding TouchSensor).
33
Interconnect Segment Results - Continued
Gross Margins (including other income). Interconnect segment gross margins (including other income) increased $7.2 million, or 29.1%, to $31.9 million for the fiscal year ended May 3, 2008 as compared to $24.7 million for the fiscal year ended April 28, 2007. The majority of the increase is due to the TouchSensor acquisition. In addition, gross margins increased in our Asian connector business and European optical business, partially offset by increased cost of products sold in our PC card adapter and data installation businesses. Gross margins (including other income) as a percentage of net sales decreased to 23.4% for fiscal 2008 from 30.1% for fiscal 2007.
Restructuring. On January 24, 2008, we announced our decision to discontinue producing certain legacy electronic Interconnect products. As a result, we recorded a restructuring charge of $0.7 million, $0.6 million for employee severance and $0.1 million for professional fees.
Selling and Administrative Expenses. Selling and administrative expenses increased $9.5 million, or 58.3%, to $25.8 million for the fiscal year ended May 3, 2008 compared to $16.3 million for the fiscal year ended April 28, 2007. Selling and administrative expenses are higher due to the TouchSensor acquisition and higher amortization expense in fiscal 2008 as compared to fiscal 2007. Selling and administrative expenses as a percentage of net sales decreased to 18.9% in fiscal 2008 from 19.9% in fiscal 2007.
Interest Income, Net. Net interest income was $0.4 million for both the fiscal years ended May 3, 2008 and April 28, 2007.
Other, Net. Other, net was expense of $1.2 million for the fiscal year ended May 3, 2008, compared to income of $0.5 million for the fiscal year ended April 28, 2007. The increase is primarily due to the weakening of the U.S. dollar versus the Euro and Czech koruna during fiscal 2008 as compared to fiscal 2007. The functional currencies of these operations are the British pound, Chinese yuan, Czech koruna, Euro, Mexican peso and Singapore dollar. Some foreign operations have transactions denominated in currencies other than their functional currencies, primarily sales in U.S. dollars and Euros, creating exchange rate sensitivities.
Income Before Income Taxes. Interconnect income before income taxes decreased $4.7 million, or 50.5%, to $4.6 million for the fiscal year ended May 3, 2008 compared to $9.3 million for the fiscal year ended April 28, 2007 due to the gross margin declines in our PC card adapter and data installation businesses, partially offset with increases from the TouchSensor business.
10k.indd 33 7/16/09 1:18:18 PM

34 3534
Power Products Segment Results
Below is a table summarizing results for the years ended:(in millions)
May 3, April 28,2008 2007 Net Change Net Change
Net sales 45.8$ 43.0$ 2.8$ 6.5%
Cost of products sold 33.2 30.8 2.4 7.8%
Gross margins 12.6 12.2 0.4 3.3%
Selling and administrative expenses 4.1 3.4 0.7 20.6%
Income before income taxes 8.5$ 8.8$ (0.3)$ -3.4%
May 3, April 28,Percent of sales: 2008 2007Net sales 100.0% 100.0%Cost of products sold 72.5% 71.6%Gross margins (including other income) 27.5% 28.4%Selling and administrative expenses 9.0% 7.9%Income before income taxes 18.6% 20.5%
Net Sales. Power Products segment net sales increased $2.8 million to $45.8 million for the fiscal year ended May 3, 2008 from $43.0 million for the fiscal year ended April 28, 2007. Net sales increased due to the VEP acquisition and were more than offset by lower sales from our bus bar business. Excluding VEP, the Power Products segment sales decreased 3.6% in fiscal 2008. The majority of the decrease relates to certain projects for a customer, which reached end of life at the end of fiscal 2007. In addition, effective at the beginning of fiscal 2008, we are no longer the sole supplier for another customer.
Cost of Products Sold. Power Products segment cost of products sold increased $2.4 million, or 7.8%, to $33.2 million for the fiscal year ended May 3, 2008 compared to $30.8 million for the fiscal year ended April 28, 2007. The Power Products segment cost of products sold as a percentage of sales increased to 72.5% for fiscal 2008 from 71.6% for fiscal 2007. The increase is primarily due to higher material costs and price erosion at our North American operations, partially offset by margin improvement at our Shanghai, China operation.
Gross Margins. Power Products segment gross margins increased $0.4 million, or 3.3%, to $12.6 million for the fiscal year ended May 3, 2008 as compared to $12.2 million for the fiscal year ended April 28, 2007. Gross margins as a percentage of net sales decreased to 27.5% for fiscal 2008 from 28.4% for fiscal 2007. The increase is primarily due to the VEP business, offset by higher material costs from our bus bar business.
Selling and Administrative Expenses. Selling and administrative expenses increased $0.7 million, or 20.6%, to $4.1 million for the fiscal year ended May 3, 2008 compared to $3.4 million for the fiscal year ended April 28, 2007. Selling and administrative expenses increased due to the VEP and Tribotek acquisitions during fiscal 2008. Selling and administrative expenses as a percentage of net sales increased to 9.0% in fiscal 2008 from 7.9% in fiscal 2007.
Income Before Income Taxes. Power Products segment income before income taxes decreased $0.3 million to $8.5 million for the fiscal year ended May 3, 2008 compared to $8.8 million for the fiscal year ended April 28, 2007, due to certain projects ending at the end of fiscal 2007, no longer being the sole supplier for another customer and higher material costs and customer price erosion at our North American operation.
35
Other Segment Results
Below is a table summarizing results for the years ended:(in millions)
May 3, April 28,2008 2007 Net Change Net Change
Net sales 6.9$ 7.6$ (0.7)$ -9.2%
Cost of products sold 6.7 5.8 0.9 15.5%
Gross margins 0.2 1.8 (1.6) -88.9%
Selling and administrative expenses 2.0 2.1 (0.1) -4.8%
Loss before income taxes (1.8)$ (0.3)$ (1.5)$ 500.0%
May 3, April 28,Percent of sales: 2008 2007Net sales 100.0% 100.0%Cost of products sold 97.1% 76.3%Gross margins 2.9% 23.7%Selling and administrative expenses 29.0% 27.6%Loss before income taxes -26.1% -3.9%
Net Sales. The Other segment net sales decreased $0.7 million to $6.9 million for the fiscal year ended May 3, 2008 as compared to $7.6 million for the fiscal year ended April 28, 2007. Sales from our testing facilities decreased 11.9% during the fiscal year ended May 3, 2008 compared to the fiscal year ended April 28, 2007 primarily due to lower demand for vibration testing.
Cost of Products Sold. Other segment cost of products sold increased $0.9 million to $6.7 million for the fiscal year ended May 3, 2008 compared to $5.8 million for the fiscal year ended April 28, 2007. The majority of the increase is due to increased initiatives in our torque-sensing business.
Gross Margins. The Other segment gross margins decreased $1.6 million to $0.2 million for the fiscal year ended May 3, 2008 as compared to $1.8 million for the fiscal year ended April 28, 2007. The majority of the decrease is due to increased cost initiatives in our torque-sensing business and the decrease in net sales in our test facilities.
Selling and Administrative Expenses. Selling and administrative expenses decreased $0.1 million to $2.0 million for the fiscal year ended May 3, 2009 compared to $2.1 million for the fiscal year ended April 28, 2007. Selling and administrative expenses as a percentage of net sales increased to 29.0% in fiscal 2008 from 27.6% in fiscal 2007.
Loss Before Income Taxes. The Other segment loss before income taxes was $1.8 million for the fiscal year ended May 3, 2008 compared to a loss of $0.3 million for the fiscal year ended April 28, 2007 due to the increased initiatives in our torque-sensing business and lower sales volumes in our test facilities.
Financial Condition, Liquidity and Capital Resources
We have historically financed our cash requirements through cash flows from operations. Our future capital requirements will depend on a number of factors, including our future net sales and the timing and rate of expansion of our business. We believe our current cash balances together with the cash flow expected to be generated from future domestic and foreign operations will be sufficient to support current operations.
10k.indd 34 7/16/09 1:18:19 PM

34 3534
Power Products Segment Results
Below is a table summarizing results for the years ended:(in millions)
May 3, April 28,2008 2007 Net Change Net Change
Net sales 45.8$ 43.0$ 2.8$ 6.5%
Cost of products sold 33.2 30.8 2.4 7.8%
Gross margins 12.6 12.2 0.4 3.3%
Selling and administrative expenses 4.1 3.4 0.7 20.6%
Income before income taxes 8.5$ 8.8$ (0.3)$ -3.4%
May 3, April 28,Percent of sales: 2008 2007Net sales 100.0% 100.0%Cost of products sold 72.5% 71.6%Gross margins (including other income) 27.5% 28.4%Selling and administrative expenses 9.0% 7.9%Income before income taxes 18.6% 20.5%
Net Sales. Power Products segment net sales increased $2.8 million to $45.8 million for the fiscal year ended May 3, 2008 from $43.0 million for the fiscal year ended April 28, 2007. Net sales increased due to the VEP acquisition and were more than offset by lower sales from our bus bar business. Excluding VEP, the Power Products segment sales decreased 3.6% in fiscal 2008. The majority of the decrease relates to certain projects for a customer, which reached end of life at the end of fiscal 2007. In addition, effective at the beginning of fiscal 2008, we are no longer the sole supplier for another customer.
Cost of Products Sold. Power Products segment cost of products sold increased $2.4 million, or 7.8%, to $33.2 million for the fiscal year ended May 3, 2008 compared to $30.8 million for the fiscal year ended April 28, 2007. The Power Products segment cost of products sold as a percentage of sales increased to 72.5% for fiscal 2008 from 71.6% for fiscal 2007. The increase is primarily due to higher material costs and price erosion at our North American operations, partially offset by margin improvement at our Shanghai, China operation.
Gross Margins. Power Products segment gross margins increased $0.4 million, or 3.3%, to $12.6 million for the fiscal year ended May 3, 2008 as compared to $12.2 million for the fiscal year ended April 28, 2007. Gross margins as a percentage of net sales decreased to 27.5% for fiscal 2008 from 28.4% for fiscal 2007. The increase is primarily due to the VEP business, offset by higher material costs from our bus bar business.
Selling and Administrative Expenses. Selling and administrative expenses increased $0.7 million, or 20.6%, to $4.1 million for the fiscal year ended May 3, 2008 compared to $3.4 million for the fiscal year ended April 28, 2007. Selling and administrative expenses increased due to the VEP and Tribotek acquisitions during fiscal 2008. Selling and administrative expenses as a percentage of net sales increased to 9.0% in fiscal 2008 from 7.9% in fiscal 2007.
Income Before Income Taxes. Power Products segment income before income taxes decreased $0.3 million to $8.5 million for the fiscal year ended May 3, 2008 compared to $8.8 million for the fiscal year ended April 28, 2007, due to certain projects ending at the end of fiscal 2007, no longer being the sole supplier for another customer and higher material costs and customer price erosion at our North American operation.
35
Other Segment Results
Below is a table summarizing results for the years ended:(in millions)
May 3, April 28,2008 2007 Net Change Net Change
Net sales 6.9$ 7.6$ (0.7)$ -9.2%
Cost of products sold 6.7 5.8 0.9 15.5%
Gross margins 0.2 1.8 (1.6) -88.9%
Selling and administrative expenses 2.0 2.1 (0.1) -4.8%
Loss before income taxes (1.8)$ (0.3)$ (1.5)$ 500.0%
May 3, April 28,Percent of sales: 2008 2007Net sales 100.0% 100.0%Cost of products sold 97.1% 76.3%Gross margins 2.9% 23.7%Selling and administrative expenses 29.0% 27.6%Loss before income taxes -26.1% -3.9%
Net Sales. The Other segment net sales decreased $0.7 million to $6.9 million for the fiscal year ended May 3, 2008 as compared to $7.6 million for the fiscal year ended April 28, 2007. Sales from our testing facilities decreased 11.9% during the fiscal year ended May 3, 2008 compared to the fiscal year ended April 28, 2007 primarily due to lower demand for vibration testing.
Cost of Products Sold. Other segment cost of products sold increased $0.9 million to $6.7 million for the fiscal year ended May 3, 2008 compared to $5.8 million for the fiscal year ended April 28, 2007. The majority of the increase is due to increased initiatives in our torque-sensing business.
Gross Margins. The Other segment gross margins decreased $1.6 million to $0.2 million for the fiscal year ended May 3, 2008 as compared to $1.8 million for the fiscal year ended April 28, 2007. The majority of the decrease is due to increased cost initiatives in our torque-sensing business and the decrease in net sales in our test facilities.
Selling and Administrative Expenses. Selling and administrative expenses decreased $0.1 million to $2.0 million for the fiscal year ended May 3, 2009 compared to $2.1 million for the fiscal year ended April 28, 2007. Selling and administrative expenses as a percentage of net sales increased to 29.0% in fiscal 2008 from 27.6% in fiscal 2007.
Loss Before Income Taxes. The Other segment loss before income taxes was $1.8 million for the fiscal year ended May 3, 2008 compared to a loss of $0.3 million for the fiscal year ended April 28, 2007 due to the increased initiatives in our torque-sensing business and lower sales volumes in our test facilities.
Financial Condition, Liquidity and Capital Resources
We have historically financed our cash requirements through cash flows from operations. Our future capital requirements will depend on a number of factors, including our future net sales and the timing and rate of expansion of our business. We believe our current cash balances together with the cash flow expected to be generated from future domestic and foreign operations will be sufficient to support current operations.
10k.indd 35 7/16/09 1:18:20 PM
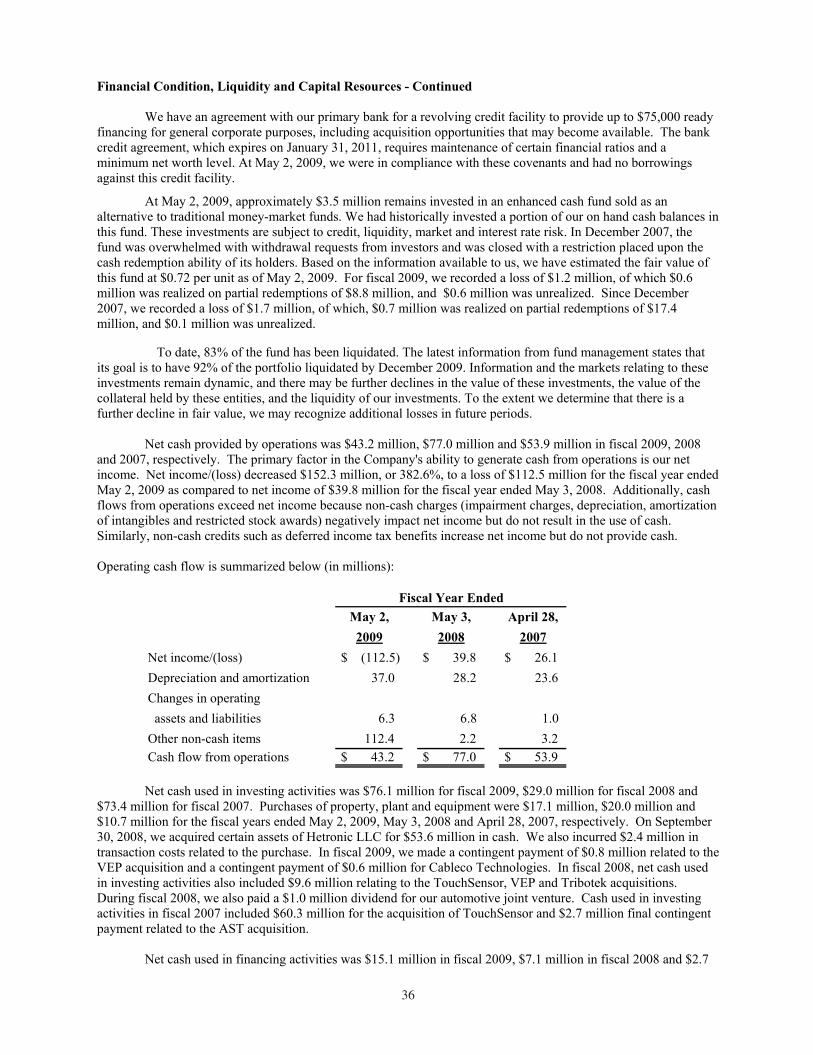
36 3736
Financial Condition, Liquidity and Capital Resources - Continued
We have an agreement with our primary bank for a revolving credit facility to provide up to $75,000 ready financing for general corporate purposes, including acquisition opportunities that may become available. The bank credit agreement, which expires on January 31, 2011, requires maintenance of certain financial ratios and a minimum net worth level. At May 2, 2009, we were in compliance with these covenants and had no borrowings against this credit facility.
At May 2, 2009, approximately $3.5 million remains invested in an enhanced cash fund sold as an alternative to traditional money-market funds. We had historically invested a portion of our on hand cash balances in this fund. These investments are subject to credit, liquidity, market and interest rate risk. In December 2007, thefund was overwhelmed with withdrawal requests from investors and was closed with a restriction placed upon the cash redemption ability of its holders. Based on the information available to us, we have estimated the fair value of this fund at $0.72 per unit as of May 2, 2009. For fiscal 2009, we recorded a loss of $1.2 million, of which $0.6 million was realized on partial redemptions of $8.8 million, and $0.6 million was unrealized. Since December 2007, we recorded a loss of $1.7 million, of which, $0.7 million was realized on partial redemptions of $17.4 million, and $0.1 million was unrealized.
To date, 83% of the fund has been liquidated. The latest information from fund management states that its goal is to have 92% of the portfolio liquidated by December 2009. Information and the markets relating to these investments remain dynamic, and there may be further declines in the value of these investments, the value of the collateral held by these entities, and the liquidity of our investments. To the extent we determine that there is a further decline in fair value, we may recognize additional losses in future periods.
Net cash provided by operations was $43.2 million, $77.0 million and $53.9 million in fiscal 2009, 2008 and 2007, respectively. The primary factor in the Company's ability to generate cash from operations is our net income. Net income/(loss) decreased $152.3 million, or 382.6%, to a loss of $112.5 million for the fiscal year ended May 2, 2009 as compared to net income of $39.8 million for the fiscal year ended May 3, 2008. Additionally, cash flows from operations exceed net income because non-cash charges (impairment charges, depreciation, amortization of intangibles and restricted stock awards) negatively impact net income but do not result in the use of cash. Similarly, non-cash credits such as deferred income tax benefits increase net income but do not provide cash.
Operating cash flow is summarized below (in millions):
May 2, May 3, April 28,2009 2008 2007
Net income/(loss) $ (112.5) $ 39.8 $ 26.1 Depreciation and amortization 37.0 28.2 23.6 Changes in operating assets and liabilities 6.3 6.8 1.0 Other non-cash items 112.4 2.2 3.2 Cash flow from operations $ 43.2 $ 77.0 $ 53.9
Fiscal Year Ended
Net cash used in investing activities was $76.1 million for fiscal 2009, $29.0 million for fiscal 2008 and $73.4 million for fiscal 2007. Purchases of property, plant and equipment were $17.1 million, $20.0 million and $10.7 million for the fiscal years ended May 2, 2009, May 3, 2008 and April 28, 2007, respectively. On September 30, 2008, we acquired certain assets of Hetronic LLC for $53.6 million in cash. We also incurred $2.4 million in transaction costs related to the purchase. In fiscal 2009, we made a contingent payment of $0.8 million related to the VEP acquisition and a contingent payment of $0.6 million for Cableco Technologies. In fiscal 2008, net cash used in investing activities also included $9.6 million relating to the TouchSensor, VEP and Tribotek acquisitions. During fiscal 2008, we also paid a $1.0 million dividend for our automotive joint venture. Cash used in investing activities in fiscal 2007 included $60.3 million for the acquisition of TouchSensor and $2.7 million final contingent payment related to the AST acquisition.
Net cash used in financing activities was $15.1 million in fiscal 2009, $7.1 million in fiscal 2008 and $2.7
37
Financial Condition, Liquidity and Capital Resources - Continued
million in fiscal 2007. We paid cash dividends of $9.8 million, $7.6 million and $7.5 million in fiscal 2009, 2008 and 2007, respectively. We repurchased 53,012 shares, 95,420 shares and 134,807 shares in fiscal 2009, 2008 and 2007, respectively, of our common stock from the former owners of Cableco in accordance with the terms of the earn-out provision of the Cableco purchase agreement. Our board of directors approved a stock repurchase plan in September 2009, which expires May 1, 2010. We repurchased 669,480 shares of common stock at an average price of $7.85 in fiscal 2009 on the open market.
Contractual Obligations
The following table summarizes contractual obligations and commitments, as of May 2, 2009 (in thousands):
Less than More thanTotal 1 year 1-3 years 4-5 years 5 years
Operating leases $ 7,820 $ 3,685 $ 3,042 $ 993 $ 100 Purchase obligations 34,550 34,550 - - - Deferred compensation 4,884 1,023 1,132 291 2,438 Other obligations 1,250 1,250 - - -
Total $ 48,504 $ 40,508 $ 4,174 $ 1,284 $ 2,538
Payments Due By Period
Off-Balance Sheet Arrangements
We do not have any off-balance sheet arrangements, other than the operating leases and purchase obligations noted in the preceding table.
Critical Accounting Policies and Estimates
Management’s discussion and analysis of financial condition and results of operations is based upon our consolidated financial statements, which have been prepared in accordance with accounting principles generally accepted in the United States. The preparation of these financial statements requires us to make estimates and judgments that affect the reported amounts of assets, liabilities, revenues and expenses and related disclosure of contingent assets and liabilities. Actual results may differ from these estimates under different assumptions or conditions; however, we do not believe that it is reasonably likely that changes will occur. We believe the following critical accounting policies affect our more significant judgments and estimates used in the preparation of our consolidated financial statements.
Revenue Recognition. We recognize revenue on product sales when i) persuasive evidence of an agreement exists, ii) the price is fixed or determinable, iii) delivery has occurred or services have been rendered, and iv) collection of the sales proceeds is reasonably assured. Revenue from our product sales not requiring installation, net of trade discounts and estimated sales allowances, is recognized when title passes, which is generally upon shipment. We do not have any additional obligations or customer acceptance provisions after shipment of such products. We handle returns by replacing, repairing or issuing credit for defective products when returned. Revenue from cabling infrastructure systems installations is recognized when the installation is completed, tested and accepted by the customer.
Allowance for Doubtful Accounts. We maintain an allowance for doubtful accounts for estimated losses resulting from the inability of customers to make required payments. The amount of the allowance is based on the age of unpaid amounts, information about the creditworthiness of customers, and other relevant information. Estimates of uncollectible amounts are revised each period, and changes are recorded in the period they become known. If the financial condition of our customers were to deteriorate, resulting in an impairment of their ability to make payments, additional allowances may be required.
In addition, our revenues and accounts receivable are concentrated in a relatively small number of
10k.indd 36 7/16/09 1:18:20 PM

36 3736
Financial Condition, Liquidity and Capital Resources - Continued
We have an agreement with our primary bank for a revolving credit facility to provide up to $75,000 ready financing for general corporate purposes, including acquisition opportunities that may become available. The bank credit agreement, which expires on January 31, 2011, requires maintenance of certain financial ratios and a minimum net worth level. At May 2, 2009, we were in compliance with these covenants and had no borrowings against this credit facility.
At May 2, 2009, approximately $3.5 million remains invested in an enhanced cash fund sold as an alternative to traditional money-market funds. We had historically invested a portion of our on hand cash balances in this fund. These investments are subject to credit, liquidity, market and interest rate risk. In December 2007, thefund was overwhelmed with withdrawal requests from investors and was closed with a restriction placed upon the cash redemption ability of its holders. Based on the information available to us, we have estimated the fair value of this fund at $0.72 per unit as of May 2, 2009. For fiscal 2009, we recorded a loss of $1.2 million, of which $0.6 million was realized on partial redemptions of $8.8 million, and $0.6 million was unrealized. Since December 2007, we recorded a loss of $1.7 million, of which, $0.7 million was realized on partial redemptions of $17.4 million, and $0.1 million was unrealized.
To date, 83% of the fund has been liquidated. The latest information from fund management states that its goal is to have 92% of the portfolio liquidated by December 2009. Information and the markets relating to these investments remain dynamic, and there may be further declines in the value of these investments, the value of the collateral held by these entities, and the liquidity of our investments. To the extent we determine that there is a further decline in fair value, we may recognize additional losses in future periods.
Net cash provided by operations was $43.2 million, $77.0 million and $53.9 million in fiscal 2009, 2008 and 2007, respectively. The primary factor in the Company's ability to generate cash from operations is our net income. Net income/(loss) decreased $152.3 million, or 382.6%, to a loss of $112.5 million for the fiscal year ended May 2, 2009 as compared to net income of $39.8 million for the fiscal year ended May 3, 2008. Additionally, cash flows from operations exceed net income because non-cash charges (impairment charges, depreciation, amortization of intangibles and restricted stock awards) negatively impact net income but do not result in the use of cash. Similarly, non-cash credits such as deferred income tax benefits increase net income but do not provide cash.
Operating cash flow is summarized below (in millions):
May 2, May 3, April 28,2009 2008 2007
Net income/(loss) $ (112.5) $ 39.8 $ 26.1 Depreciation and amortization 37.0 28.2 23.6 Changes in operating assets and liabilities 6.3 6.8 1.0 Other non-cash items 112.4 2.2 3.2 Cash flow from operations $ 43.2 $ 77.0 $ 53.9
Fiscal Year Ended
Net cash used in investing activities was $76.1 million for fiscal 2009, $29.0 million for fiscal 2008 and $73.4 million for fiscal 2007. Purchases of property, plant and equipment were $17.1 million, $20.0 million and $10.7 million for the fiscal years ended May 2, 2009, May 3, 2008 and April 28, 2007, respectively. On September 30, 2008, we acquired certain assets of Hetronic LLC for $53.6 million in cash. We also incurred $2.4 million in transaction costs related to the purchase. In fiscal 2009, we made a contingent payment of $0.8 million related to the VEP acquisition and a contingent payment of $0.6 million for Cableco Technologies. In fiscal 2008, net cash used in investing activities also included $9.6 million relating to the TouchSensor, VEP and Tribotek acquisitions. During fiscal 2008, we also paid a $1.0 million dividend for our automotive joint venture. Cash used in investing activities in fiscal 2007 included $60.3 million for the acquisition of TouchSensor and $2.7 million final contingent payment related to the AST acquisition.
Net cash used in financing activities was $15.1 million in fiscal 2009, $7.1 million in fiscal 2008 and $2.7
37
Financial Condition, Liquidity and Capital Resources - Continued
million in fiscal 2007. We paid cash dividends of $9.8 million, $7.6 million and $7.5 million in fiscal 2009, 2008 and 2007, respectively. We repurchased 53,012 shares, 95,420 shares and 134,807 shares in fiscal 2009, 2008 and 2007, respectively, of our common stock from the former owners of Cableco in accordance with the terms of the earn-out provision of the Cableco purchase agreement. Our board of directors approved a stock repurchase plan in September 2009, which expires May 1, 2010. We repurchased 669,480 shares of common stock at an average price of $7.85 in fiscal 2009 on the open market.
Contractual Obligations
The following table summarizes contractual obligations and commitments, as of May 2, 2009 (in thousands):
Less than More thanTotal 1 year 1-3 years 4-5 years 5 years
Operating leases $ 7,820 $ 3,685 $ 3,042 $ 993 $ 100 Purchase obligations 34,550 34,550 - - - Deferred compensation 4,884 1,023 1,132 291 2,438 Other obligations 1,250 1,250 - - -
Total $ 48,504 $ 40,508 $ 4,174 $ 1,284 $ 2,538
Payments Due By Period
Off-Balance Sheet Arrangements
We do not have any off-balance sheet arrangements, other than the operating leases and purchase obligations noted in the preceding table.
Critical Accounting Policies and Estimates
Management’s discussion and analysis of financial condition and results of operations is based upon our consolidated financial statements, which have been prepared in accordance with accounting principles generally accepted in the United States. The preparation of these financial statements requires us to make estimates and judgments that affect the reported amounts of assets, liabilities, revenues and expenses and related disclosure of contingent assets and liabilities. Actual results may differ from these estimates under different assumptions or conditions; however, we do not believe that it is reasonably likely that changes will occur. We believe the following critical accounting policies affect our more significant judgments and estimates used in the preparation of our consolidated financial statements.
Revenue Recognition. We recognize revenue on product sales when i) persuasive evidence of an agreement exists, ii) the price is fixed or determinable, iii) delivery has occurred or services have been rendered, and iv) collection of the sales proceeds is reasonably assured. Revenue from our product sales not requiring installation, net of trade discounts and estimated sales allowances, is recognized when title passes, which is generally upon shipment. We do not have any additional obligations or customer acceptance provisions after shipment of such products. We handle returns by replacing, repairing or issuing credit for defective products when returned. Revenue from cabling infrastructure systems installations is recognized when the installation is completed, tested and accepted by the customer.
Allowance for Doubtful Accounts. We maintain an allowance for doubtful accounts for estimated losses resulting from the inability of customers to make required payments. The amount of the allowance is based on the age of unpaid amounts, information about the creditworthiness of customers, and other relevant information. Estimates of uncollectible amounts are revised each period, and changes are recorded in the period they become known. If the financial condition of our customers were to deteriorate, resulting in an impairment of their ability to make payments, additional allowances may be required.
In addition, our revenues and accounts receivable are concentrated in a relatively small number of
10k.indd 37 7/16/09 1:18:21 PM

38 3938
Critical Accounting Policies and Estimates - Continued
customers. A significant change in the liquidity or financial position of any one of these customers or a deterioration in the economic environment or automotive industry, in general, could have a material adverse impact on the collectability of our accounts receivable and our future operating results, including a reduction in future revenues and additional allowances for doubtful accounts.
Allowance for Excess and Obsolete Inventory. Inventories are valued at the lower-of-cost-or-market value and have been reduced by allowances for excess and obsolete inventories. The estimated allowances are based on our review of inventories on hand compared to estimated future usage and sales, using assumptions about future product life cycles, product demand and market conditions. If actual product life cycles, product demand and market conditions are less favorable than those projected by us, additional inventory write-downs may be required.
Intangible Assets. We have significant intangible assets related to goodwill and other acquired intangibles. The determination of related estimated useful lives and whether these assets are impaired involves significant judgment. In assessing the recoverability of our intangibles, we must make assumptions regarding estimated future cash flows and other factors to determine the fair value of the respective assets. If these estimates or their related assumptions change in the future, we may be required to record impairment charges for these assets. In accordance with SFAS No. 142, “Goodwill and Other Intangible Assets,” on May 1, 2002, we ceased amortizing goodwill. In lieu of amortization, we are required to perform an annual impairment review (see Note 4 to the Consolidated Financial Statements).
Income Taxes. As part of the process of preparing our Consolidated Financial Statements, we are required to estimate income taxes in each of the jurisdictions in which we operate. The process involves estimating actual current tax expense along with assessing temporary differences resulting from differing treatment of items for book and tax purposes. These temporary differences result in deferred tax assets and liabilities, which are included in our consolidated balance sheet. We record a valuation allowance to reduce our deferred tax assets to the amount that is more likely than not to be realized. We have considered future taxable income and ongoing tax planning strategies in assessing the need for the valuation allowance. The tax laws of Malta provide for investment tax credits of 50% of certain qualified expenditures. Unused credits can be carried forward indefinitely. We have accumulated investment tax credits in excess of amounts more likely than not to be realized based upon projections of taxable income to be generated within a reasonable time period. Valuation allowances have been provided for this excess.
Contingencies. We are subject to various investigations, claims, legal and administrative proceedings covering a wide range of matters that arise in the ordinary course of business activities. A significant amount of judgment and use of estimates is required to quantify our ultimate exposure in these matters. For those matters that we can estimate a range of loss, we have established reserves at levels within that range to provide for the most likely scenario based upon available information. The valuation of reserves for contingencies is reviewed on a quarterly basis to assure that the Company is properly reserved. Reserve balances are adjusted to account for changes in circumstances for ongoing issues and the establishment of additional reserves for emerging issues. While we believe that the current level of reserves is adequate, changes in the future could impact these determinations.
Item 7A. Quantitative and Qualitative Disclosures About Market Risk
Certain of our foreign operations enter into transactions in currencies other than their functional currency, primarily the U.S. dollar and the Euro. A 10% change in foreign currency exchange rates from balance sheet date levels could impact our income before income taxes by $2.8 million and $1.1 million at May 2, 2009 and May 3, 2008, respectively. We also have foreign currency exposure arising from the translation of our net equity investment in our foreign operations to U.S. dollars. We generally view our investments in foreign operations with functional currencies other than the U.S. dollar as long-term. The currencies to which we are exposed are the British pound, Chinese yuan, Czech koruna, Euro, Mexican peso and Singapore dollar. A 10% change in foreign currency exchange rates from balance sheet date levels could impact our net foreign investments by $10.8 million at May 2, 2009 and $15.1 million at May 3, 2008.
Item 8. Financial Statements and Supplementary Data
See Item 15 for an Index to Financial Statements and Financial Statement Schedule. Such Financial Statements and Schedule are incorporated herein by reference.
39
Item 9A. Controls and Procedures
Evaluation of Disclosure Controls and Procedures
As of the end of the period covered by this annual report on Form 10-K, we performed an evaluation under the supervision and with the participation of our management, including our Chief Executive Officer and our Chief Financial Officer, of our “disclosure controls and procedures” (as defined in Rules 13a-15(e) and 15d-15(e) of the Securities Exchange Act of 1934 (the “Exchange Act”). Our disclosure controls and procedures are designed to ensure that the information required to be disclosed by us in the reports that we file or submit under the Exchange Act is recorded, processed, summarized and reported within the time periods specified in the Securities and Exchange Commission’s applicable rules and forms. As a result of this evaluation, our Chief Executive Officer and Chief Financial Officer have concluded that, as of the end of the period covered by this report, our disclosure controls and procedures were effective.
Management’s Report on Internal Control over Financial Reporting
Our management is responsible for establishing and maintaining adequate internal control over financial reporting, as such term is defined in Exchange Act Rules 13a-15(f) and 15d-15(f). Under the supervision and with the participation of our management, including our Chief Executive Officer and Chief Financial Officer, we conducted an evaluation of the effectiveness of our internal control over financial reporting as of May 2, 2009 based on the guidelines established in Internal Control — Integrated Framework issued by the Committee of Sponsoring Organizations of the Treadway Commission (COSO). Our internal control over financial reporting includes policies and procedures that provide reasonable assurance regarding the reliability of financial reporting and the preparation of financial statements for external reporting purposes in accordance with U.S. generally accepted accounting principles.
Management’s assessment of and conclusion on the effectiveness of internal control over financial reporting did not include the internal controls of Hetronic LLC, acquired on September 30, 2008, which is included in our fiscal 2009 consolidated financial statements and constituted $21.9 million and $20.0 million of total and net assets, respectively, as of May 2, 2009 and $14.4 million of revenue and a net loss of $36.1 million as of May 2, 2009.
Based on the results of our evaluation, with the exception of Hetronic LLC mentioned above, our management concluded that our internal control over financial reporting was effective as of May 2, 2009. Management reviewed the results of its assessment with the Audit Committee. Our independent registered public accounting firm, Ernst and Young, LLP, has issued an attestation report on our internal control over financial reporting. This report is included on page F-2 of this report on Form 10-K.
Changes in Internal Control over Financial Reporting
There were no changes in our internal control over financial reporting identified in connection with the evaluation required by paragraph (d) of Exchange Act Rules 13a-15 or 15d-15 that was conducted during the last fiscal quarter that have materially affected, or are reasonably likely to materially affect, our internal control over financial reporting.
Inherent Limitations on Effectiveness of Controls
Our management, including our Chief Executive Officer and Chief Financial Officer, do not expect that our disclosure controls or our internal control over financial reporting will prevent all errors and all fraud. A control system, no matter how well conceived and operated, can provide only reasonable, not absolute, assurance that the objectives of the control system are met. Further, the design of a control system must reflect the fact that there are resource constraints, and the benefits of controls must be considered relative to their costs. Because of the inherent limitations in all control systems, no evaluation of controls can provide absolute assurance that all control issues and instances of fraud, if any, within the Company have been detected. These inherent limitations include the realities that judgments in decision-making can be faulty, and that breakdowns can occur because of a simple error or mistake. Additionally, controls can be circumvented by the individual acts of some persons, by collusion of two or more people or by management override of the controls. The design of any system of controls also is based in part upon certain assumptions about the likelihood of future events, and there can be no assurance that any design will
10k.indd 38 7/16/09 1:18:22 PM

38 3938
Critical Accounting Policies and Estimates - Continued
customers. A significant change in the liquidity or financial position of any one of these customers or a deterioration in the economic environment or automotive industry, in general, could have a material adverse impact on the collectability of our accounts receivable and our future operating results, including a reduction in future revenues and additional allowances for doubtful accounts.
Allowance for Excess and Obsolete Inventory. Inventories are valued at the lower-of-cost-or-market value and have been reduced by allowances for excess and obsolete inventories. The estimated allowances are based on our review of inventories on hand compared to estimated future usage and sales, using assumptions about future product life cycles, product demand and market conditions. If actual product life cycles, product demand and market conditions are less favorable than those projected by us, additional inventory write-downs may be required.
Intangible Assets. We have significant intangible assets related to goodwill and other acquired intangibles. The determination of related estimated useful lives and whether these assets are impaired involves significant judgment. In assessing the recoverability of our intangibles, we must make assumptions regarding estimated future cash flows and other factors to determine the fair value of the respective assets. If these estimates or their related assumptions change in the future, we may be required to record impairment charges for these assets. In accordance with SFAS No. 142, “Goodwill and Other Intangible Assets,” on May 1, 2002, we ceased amortizing goodwill. In lieu of amortization, we are required to perform an annual impairment review (see Note 4 to the Consolidated Financial Statements).
Income Taxes. As part of the process of preparing our Consolidated Financial Statements, we are required to estimate income taxes in each of the jurisdictions in which we operate. The process involves estimating actual current tax expense along with assessing temporary differences resulting from differing treatment of items for book and tax purposes. These temporary differences result in deferred tax assets and liabilities, which are included in our consolidated balance sheet. We record a valuation allowance to reduce our deferred tax assets to the amount that is more likely than not to be realized. We have considered future taxable income and ongoing tax planning strategies in assessing the need for the valuation allowance. The tax laws of Malta provide for investment tax credits of 50% of certain qualified expenditures. Unused credits can be carried forward indefinitely. We have accumulated investment tax credits in excess of amounts more likely than not to be realized based upon projections of taxable income to be generated within a reasonable time period. Valuation allowances have been provided for this excess.
Contingencies. We are subject to various investigations, claims, legal and administrative proceedings covering a wide range of matters that arise in the ordinary course of business activities. A significant amount of judgment and use of estimates is required to quantify our ultimate exposure in these matters. For those matters that we can estimate a range of loss, we have established reserves at levels within that range to provide for the most likely scenario based upon available information. The valuation of reserves for contingencies is reviewed on a quarterly basis to assure that the Company is properly reserved. Reserve balances are adjusted to account for changes in circumstances for ongoing issues and the establishment of additional reserves for emerging issues. While we believe that the current level of reserves is adequate, changes in the future could impact these determinations.
Item 7A. Quantitative and Qualitative Disclosures About Market Risk
Certain of our foreign operations enter into transactions in currencies other than their functional currency, primarily the U.S. dollar and the Euro. A 10% change in foreign currency exchange rates from balance sheet date levels could impact our income before income taxes by $2.8 million and $1.1 million at May 2, 2009 and May 3, 2008, respectively. We also have foreign currency exposure arising from the translation of our net equity investment in our foreign operations to U.S. dollars. We generally view our investments in foreign operations with functional currencies other than the U.S. dollar as long-term. The currencies to which we are exposed are the British pound, Chinese yuan, Czech koruna, Euro, Mexican peso and Singapore dollar. A 10% change in foreign currency exchange rates from balance sheet date levels could impact our net foreign investments by $10.8 million at May 2, 2009 and $15.1 million at May 3, 2008.
Item 8. Financial Statements and Supplementary Data
See Item 15 for an Index to Financial Statements and Financial Statement Schedule. Such Financial Statements and Schedule are incorporated herein by reference.
39
Item 9A. Controls and Procedures
Evaluation of Disclosure Controls and Procedures
As of the end of the period covered by this annual report on Form 10-K, we performed an evaluation under the supervision and with the participation of our management, including our Chief Executive Officer and our Chief Financial Officer, of our “disclosure controls and procedures” (as defined in Rules 13a-15(e) and 15d-15(e) of the Securities Exchange Act of 1934 (the “Exchange Act”). Our disclosure controls and procedures are designed to ensure that the information required to be disclosed by us in the reports that we file or submit under the Exchange Act is recorded, processed, summarized and reported within the time periods specified in the Securities and Exchange Commission’s applicable rules and forms. As a result of this evaluation, our Chief Executive Officer and Chief Financial Officer have concluded that, as of the end of the period covered by this report, our disclosure controls and procedures were effective.
Management’s Report on Internal Control over Financial Reporting
Our management is responsible for establishing and maintaining adequate internal control over financial reporting, as such term is defined in Exchange Act Rules 13a-15(f) and 15d-15(f). Under the supervision and with the participation of our management, including our Chief Executive Officer and Chief Financial Officer, we conducted an evaluation of the effectiveness of our internal control over financial reporting as of May 2, 2009 based on the guidelines established in Internal Control — Integrated Framework issued by the Committee of Sponsoring Organizations of the Treadway Commission (COSO). Our internal control over financial reporting includes policies and procedures that provide reasonable assurance regarding the reliability of financial reporting and the preparation of financial statements for external reporting purposes in accordance with U.S. generally accepted accounting principles.
Management’s assessment of and conclusion on the effectiveness of internal control over financial reporting did not include the internal controls of Hetronic LLC, acquired on September 30, 2008, which is included in our fiscal 2009 consolidated financial statements and constituted $21.9 million and $20.0 million of total and net assets, respectively, as of May 2, 2009 and $14.4 million of revenue and a net loss of $36.1 million as of May 2, 2009.
Based on the results of our evaluation, with the exception of Hetronic LLC mentioned above, our management concluded that our internal control over financial reporting was effective as of May 2, 2009. Management reviewed the results of its assessment with the Audit Committee. Our independent registered public accounting firm, Ernst and Young, LLP, has issued an attestation report on our internal control over financial reporting. This report is included on page F-2 of this report on Form 10-K.
Changes in Internal Control over Financial Reporting
There were no changes in our internal control over financial reporting identified in connection with the evaluation required by paragraph (d) of Exchange Act Rules 13a-15 or 15d-15 that was conducted during the last fiscal quarter that have materially affected, or are reasonably likely to materially affect, our internal control over financial reporting.
Inherent Limitations on Effectiveness of Controls
Our management, including our Chief Executive Officer and Chief Financial Officer, do not expect that our disclosure controls or our internal control over financial reporting will prevent all errors and all fraud. A control system, no matter how well conceived and operated, can provide only reasonable, not absolute, assurance that the objectives of the control system are met. Further, the design of a control system must reflect the fact that there are resource constraints, and the benefits of controls must be considered relative to their costs. Because of the inherent limitations in all control systems, no evaluation of controls can provide absolute assurance that all control issues and instances of fraud, if any, within the Company have been detected. These inherent limitations include the realities that judgments in decision-making can be faulty, and that breakdowns can occur because of a simple error or mistake. Additionally, controls can be circumvented by the individual acts of some persons, by collusion of two or more people or by management override of the controls. The design of any system of controls also is based in part upon certain assumptions about the likelihood of future events, and there can be no assurance that any design will
10k.indd 39 7/16/09 1:18:23 PM
40 4140
Inherent Limitations on Effectiveness of Controls - Continued
succeed in achieving its stated goals under all potential future conditions; over time, controls may become inadequate because of changes in conditions, or the degree of compliance with policies or procedures may deteriorate. Because of the inherent limitations in a cost-effective control system, misstatements due to error or fraud may occur and not be detected.
PART III
Item 10. Directors, Executive Officers and Corporate Governance
Information regarding our directors will be included under the caption “Proposal One: Election of Directors” and “Corporate Governance” in the definitive proxy statement for our 2009 annual meeting to be held on September 17, 2009, and is incorporated herein by reference. Information regarding our executive officers is included under a separate caption in Part I hereof, and is incorporated herein by reference, in accordance with General Instruction G(3) to Form 10-K and Instruction 3 to Item 401(b) of Regulation S-K. Information regarding compliance with Section 16(a) of the Exchange Act is included under the caption “Section 16(a) Beneficial Ownership Reporting Compliance” and “Audit Committee Matters” in the definitive proxy statement for our 2009 annual meeting and is incorporated herein by reference.
We have adopted a Code of Business Conduct (the “Code”) that applies to our directors, our principal executive officer, principal financial officer, principal accounting officer or controller and persons performing similar functions, as well as other employees. The Code of Business Conduct is publicly available on our website at www.methode.com. If we make any substantive amendments to the Code or grant any waiver, including any implicit waiver, from a provision of the Code to our principal executive officer, principal financial officer, principal accounting officer or controller or persons performing similar functions, we will disclose the nature of such amendment or waiver on our website or in a report on Form 8-K in accordance with applicable rules and regulations.
Item 11. Executive Compensation
Information regarding the above will be included under the caption “ Compensation Discussion and Analysis,” “Compensation Committee Report,” “Executive Compensation Tables” and “Director Compensation” in the definitive proxy statement for our 2009 annual meeting to be held on September 17, 2009, and is incorporated herein by reference.
Item 12. Security Ownership of Certain Beneficial Owners and Management and Related Stockholder Matters
Information regarding the above will be included under the caption “Security Ownership” and “Executive Compensation Discussion and Analysis” and in subsequent compensation tables in the definitive proxy statement for our 2009 annual meeting to be held on September 17, 2009, and is incorporated herein by reference.
Item 13. Certain Relationships and Related Transactions, and Director Independence
Information regarding the above will be included under the caption “Corporate Governance” in the definitive proxy statement for our 2009 annual meeting to be held on September 17, 2009, and is incorporated herein by reference.
Item 14. Principal Accounting Fees and Services
Information regarding the above will be included under the caption “Audit Committee Matters” in the definitive proxy statement for our 2009 annual meeting to be held on September 17, 2009, and is incorporated herein by reference.
41
PART IV
Item 15. Exhibits and Financial Statement Schedule
(a) The documents included in the following indexes are filed as part of this annual report on Form 10-K.
(1) (2) The response to this portion of Item 15 is included in this report under the caption “Financial Statements” and “Financial Statement Schedule” below, which is incorporated herein by reference.
(3) See “Index to Exhibits” immediately following the financial statement schedule.
(a) See “Index to Exhibits” immediately following the financial statement schedule.
(b) See “Financial Statements” and “Financial Statement Schedule.”
10k.indd 40 7/16/09 1:18:23 PM

40 4140
Inherent Limitations on Effectiveness of Controls - Continued
succeed in achieving its stated goals under all potential future conditions; over time, controls may become inadequate because of changes in conditions, or the degree of compliance with policies or procedures may deteriorate. Because of the inherent limitations in a cost-effective control system, misstatements due to error or fraud may occur and not be detected.
PART III
Item 10. Directors, Executive Officers and Corporate Governance
Information regarding our directors will be included under the caption “Proposal One: Election of Directors” and “Corporate Governance” in the definitive proxy statement for our 2009 annual meeting to be held on September 17, 2009, and is incorporated herein by reference. Information regarding our executive officers is included under a separate caption in Part I hereof, and is incorporated herein by reference, in accordance with General Instruction G(3) to Form 10-K and Instruction 3 to Item 401(b) of Regulation S-K. Information regarding compliance with Section 16(a) of the Exchange Act is included under the caption “Section 16(a) Beneficial Ownership Reporting Compliance” and “Audit Committee Matters” in the definitive proxy statement for our 2009 annual meeting and is incorporated herein by reference.
We have adopted a Code of Business Conduct (the “Code”) that applies to our directors, our principal executive officer, principal financial officer, principal accounting officer or controller and persons performing similar functions, as well as other employees. The Code of Business Conduct is publicly available on our website at www.methode.com. If we make any substantive amendments to the Code or grant any waiver, including any implicit waiver, from a provision of the Code to our principal executive officer, principal financial officer, principal accounting officer or controller or persons performing similar functions, we will disclose the nature of such amendment or waiver on our website or in a report on Form 8-K in accordance with applicable rules and regulations.
Item 11. Executive Compensation
Information regarding the above will be included under the caption “ Compensation Discussion and Analysis,” “Compensation Committee Report,” “Executive Compensation Tables” and “Director Compensation” in the definitive proxy statement for our 2009 annual meeting to be held on September 17, 2009, and is incorporated herein by reference.
Item 12. Security Ownership of Certain Beneficial Owners and Management and Related Stockholder Matters
Information regarding the above will be included under the caption “Security Ownership” and “Executive Compensation Discussion and Analysis” and in subsequent compensation tables in the definitive proxy statement for our 2009 annual meeting to be held on September 17, 2009, and is incorporated herein by reference.
Item 13. Certain Relationships and Related Transactions, and Director Independence
Information regarding the above will be included under the caption “Corporate Governance” in the definitive proxy statement for our 2009 annual meeting to be held on September 17, 2009, and is incorporated herein by reference.
Item 14. Principal Accounting Fees and Services
Information regarding the above will be included under the caption “Audit Committee Matters” in the definitive proxy statement for our 2009 annual meeting to be held on September 17, 2009, and is incorporated herein by reference.
41
PART IV
Item 15. Exhibits and Financial Statement Schedule
(a) The documents included in the following indexes are filed as part of this annual report on Form 10-K.
(1) (2) The response to this portion of Item 15 is included in this report under the caption “Financial Statements” and “Financial Statement Schedule” below, which is incorporated herein by reference.
(3) See “Index to Exhibits” immediately following the financial statement schedule.
(a) See “Index to Exhibits” immediately following the financial statement schedule.
(b) See “Financial Statements” and “Financial Statement Schedule.”
10k.indd 41 7/16/09 1:18:24 PM
42 4342
SIGNATURES
Pursuant to the requirements of Section 13 or 15 (d) of the Securities Exchange Act of 1934, the Registrant has duly caused this report to be signed on its behalf by the undersigned, thereunto duly authorized.
METHODE ELECTRONICS, INC. (Registrant)
By: /s/ DOUGLAS A. KOMAN Douglas A. Koman Chief Financial Officer (Principal Accounting and Financial Officer)
Dated: July 2, 2009
Pursuant to the requirements of the Securities Exchange Act of 1934, this report has been signed below by the following persons on behalf of the Registrant and in the capacities and on the dates indicated.
Signature Title Date
/s / WARREN L. BATTS Chairman of the Board July 2, 2009Warren L. Batts
/s/ DONALD W. DUDA Chief Executive Officer, President & Director July 2, 2009Donald W. Duda (Principal Executive Officer)
/s / DOUGLAS A. KOMAN Chief Financial Officer July 2, 2009Douglas A. Koman /s / WALTER J. ASPATORE Director July 2, 2009Walter J. Aspatore
/s/ J. EDWARD COLGATE Director July 2, 2009J. Edward Colgate
/s/ DARREN M. DAWSON Director July 2, 2009Darren M. Dawson
/s / ISABELLE C. GOOSSEN Director July 2, 2009Isabelle C. Goossen
/s / CHRISTOPHER J. HORNUNG Director July 2, 2009Christopher J. Hornung
/s / LAWRENCE B. SKATOFF Director July 2, 2009Lawrence B. Skatoff
/s / PAUL G. SHELTON Director July 2, 2009Paul G. Shelton
43
METHODE ELECTRONICS, INC. AND SUBSIDIARIES
FORM 10-K
ITEM 15 (a) (1) and (2)
(1) Financial Statements
The following consolidated financial statements of Methode Electronics, Inc. and subsidiaries are included in Item 8:
Report of Independent Registered Public Accounting Firm ……………………….. F1
Report of Independent Registered Public Accounting Firm on Internal Control over Financial Reporting….………………………………………………… F2
Consolidated Balance Sheets - - May 2, 2009 and May 3, 2008……………………. F3
Consolidated Statements of Operations - - Years Ended May 2, 2009, May 3, 2008 and April 28, 2007…………………………………………………….. F4
Consolidated Statements of Shareholders’ Equity - - Years Ended May 2, 2009, May 3, 2008 and April 28, 2007…………………………………….. F5
Consolidated Statements of Cash Flows - - Years Ended May 2, 2009, May 3, 2008 and April 28, 2007……….…………………………………………… F6
Notes to Consolidated Financial Statements…….…………………………………. F7
(2) Financial Statement Schedule
Schedule II - - Valuation and Qualifying Accounts…………………………………. F34
All other schedules for which provision is made in the applicable accounting regulation of the Securities and Exchange Commission are not required under the related instructions or are immaterial and, therefore, have been omitted.
10k.indd 42 7/16/09 1:18:25 PM
42 4342
SIGNATURES
Pursuant to the requirements of Section 13 or 15 (d) of the Securities Exchange Act of 1934, the Registrant has duly caused this report to be signed on its behalf by the undersigned, thereunto duly authorized.
METHODE ELECTRONICS, INC. (Registrant)
By: /s/ DOUGLAS A. KOMAN Douglas A. Koman Chief Financial Officer (Principal Accounting and Financial Officer)
Dated: July 2, 2009
Pursuant to the requirements of the Securities Exchange Act of 1934, this report has been signed below by the following persons on behalf of the Registrant and in the capacities and on the dates indicated.
Signature Title Date
/s / WARREN L. BATTS Chairman of the Board July 2, 2009Warren L. Batts
/s/ DONALD W. DUDA Chief Executive Officer, President & Director July 2, 2009Donald W. Duda (Principal Executive Officer)
/s / DOUGLAS A. KOMAN Chief Financial Officer July 2, 2009Douglas A. Koman /s / WALTER J. ASPATORE Director July 2, 2009Walter J. Aspatore
/s/ J. EDWARD COLGATE Director July 2, 2009J. Edward Colgate
/s/ DARREN M. DAWSON Director July 2, 2009Darren M. Dawson
/s / ISABELLE C. GOOSSEN Director July 2, 2009Isabelle C. Goossen
/s / CHRISTOPHER J. HORNUNG Director July 2, 2009Christopher J. Hornung
/s / LAWRENCE B. SKATOFF Director July 2, 2009Lawrence B. Skatoff
/s / PAUL G. SHELTON Director July 2, 2009Paul G. Shelton
43
METHODE ELECTRONICS, INC. AND SUBSIDIARIES
FORM 10-K
ITEM 15 (a) (1) and (2)
(1) Financial Statements
The following consolidated financial statements of Methode Electronics, Inc. and subsidiaries are included in Item 8:
Report of Independent Registered Public Accounting Firm ……………………….. F1
Report of Independent Registered Public Accounting Firm on Internal Control over Financial Reporting….………………………………………………… F2
Consolidated Balance Sheets - - May 2, 2009 and May 3, 2008……………………. F3
Consolidated Statements of Operations - - Years Ended May 2, 2009, May 3, 2008 and April 28, 2007…………………………………………………….. F4
Consolidated Statements of Shareholders’ Equity - - Years Ended May 2, 2009, May 3, 2008 and April 28, 2007…………………………………….. F5
Consolidated Statements of Cash Flows - - Years Ended May 2, 2009, May 3, 2008 and April 28, 2007……….…………………………………………… F6
Notes to Consolidated Financial Statements…….…………………………………. F7
(2) Financial Statement Schedule
Schedule II - - Valuation and Qualifying Accounts…………………………………. F34
All other schedules for which provision is made in the applicable accounting regulation of the Securities and Exchange Commission are not required under the related instructions or are immaterial and, therefore, have been omitted.
10k.indd 43 7/16/09 1:18:25 PM

F-1F-1
REPORT OF INDEPENDENT REGISTERED PUBLIC ACCOUNTING FIRM
Board of Directors and Shareholders Methode Electronics, Inc.
We have audited the accompanying consolidated balance sheets of Methode Electronics, Inc. and subsidiaries as of May 2, 2009 and May 3, 2008, and the related consolidated statements of operations, shareholders' equity and cash flows for each of the three years in the period ended May 2, 2009. Our audits also included the financial statement schedule listed in the Index at Item 15(a)(2). These financial statements and schedule are the responsibility of the Company's management. Our responsibility is to express an opinion on these financial statements and schedule based on our audits.
We conducted our audits in accordance with the standards of the Public Company Accounting Oversight Board (United States). Those standards require that we plan and perform the audit to obtain reasonable assurance about whether the financial statements are free of material misstatement. An audit includes examining, on a test basis, evidence supporting the amounts and disclosures in the financial statements. An audit also includes assessing the accounting principles used and significant estimates made by management, as well as evaluating the overall financial statement presentation. We believe that our audits provide a reasonable basis for our opinion.
In our opinion, the financial statements referred to above present fairly, in all material respects, the consolidated financial position of Methode Electronics, Inc. and subsidiaries at May 2, 2009 and May 3, 2008, and the consolidated results of their operations and their cash flows for each of the three years in the period ended May 2, 2009, in conformity with U.S. generally accepted accounting principles. Also, in our opinion, the related financial statement schedule, when considered in relation to the basic financial statements taken as a whole, presents fairly in all material respects the information set forth therein.
As discussed in Note 7 to the consolidated financial statements, effective April 29, 2007, the Company adopted Financial Accounting Standards Board Interpretation No. 48, “Accounting for Uncertainty in Income Taxes”.
We also have audited, in accordance with the standards of the Public Company Accounting Oversight Board (United States), the effectiveness of Methode Electronics, Inc.’s internal control over financial reporting as of May 2, 2009, based on criteria established in Internal Control – Integrated Framework issued by the Committee of Sponsoring Organizations of the Treadway Commission and our report dated July 1, 2009 expressed an unqualified opinion thereon.
/s/ ERNST & YOUNG LLP
Chicago, Illinois July 1, 2009
10k.indd 1 7/16/09 1:18:25 PM

F-2 F-3F-3
ASSETS May 2, 2009 May 3, 2008
CURRENT ASSETS Cash and cash equivalents 54,030$ 104,305$ Accounts receivable, net, less allowance (2009 -- $1,444; 2008 --$2,309) 60,406 85,805 Inventories: Finished products 11,865 15,384 Work in process 10,765 20,715 Materials 17,796 19,850
40,426 55,949 Deferred income taxes 4,928 8,730 Refundable income taxes 14,764 - Prepaid expenses and other current assets 6,692 6,028 TOTAL CURRENT ASSETS 181,246 260,817
PROPERTY, PLANT AND EQUIPMENT Land 3,236 3,205 Buildings and building improvements 54,378 44,894 Machinery and equipment 231,470 260,165
289,084 308,264 Less allowances for depreciation 219,167 217,984
69,917 90,280OTHER ASSETS Goodwill 11,771 54,476 Other intangibles, less accumulated amortization 20,501 41,282 Cash surrender value of life insurance 11,177 10,345 Deferred income taxes 4,993 10,099 Other 5,683 2,921
54,125 119,123305,288$ 470,220$
LIABILITIES AND SHAREHOLDERS' EQUITY
CURRENT LIABILITIES Accounts payable 24,495$ 42,810$ Salaries, wages and payroll taxes 7,918 13,317 Other accrued expenses 19,921 19,207 Income taxes 1,184 1,378 TOTAL CURRENT LIABILITIES 53,518 76,712
OTHER LIABILITIES 16,686 13,833DEFERRED COMPENSATION 3,308 6,890SHAREHOLDERS' EQUITY Common stock, $0.50 par value, 100,000,000 shares authorized, 38,290,776 and 38,225,379 shares issued as of May 2, 2009 and May 3, 2008, respectively 19,145 19,113 Unearned common stock issuances (3,632) (4,257) Additional paid-in capital 68,506 69,953 Retained earnings 143,577 265,838 Accumulated other comprehensive income 15,675 28,381 Treasury stock, 1,372,188 and 702,708 shares as of May 2, 2009 and May 3, 2008, respectively (11,495) (6,243)
231,776 372,785305,288$ 470,220$
METHODE ELECTRONICS, INC AND SUBSIDIARIES
(in thousands, except share data)
See notes to consolidated financial statements.
CONSOLIDATED BALANCE SHEETS
F-2
REPORT OF INDEPENDENT REGISTERED PUBLIC ACCOUNTING FIRM ON INTERNAL CONTROL OVER FINANCIAL REPORTING
Board of Directors and Shareholders Methode Electronics, Inc.
We have audited Methode Electronics, Inc.’s internal control over financial reporting as of May 2, 2009, based on criteria established in Internal Control—Integrated Framework issued by the Committee of Sponsoring Organizations of the Treadway Commission (the COSO criteria). Methode Electronics, Inc.’s management is responsible for maintaining effective internal control over financial reporting, and for its assessment of the effectiveness of internal control over financial reporting included in the accompanying Report on Internal Control Over Financial Reporting. Our responsibility is to express an opinion on the Company’s internal control over financial reporting based on our audit.
We conducted our audit in accordance with the standards of the Public Company Accounting Oversight Board (United States). Those standards require that we plan and perform the audit to obtain reasonable assurance about whether effective internal control over financial reporting was maintained in all material respects. Our audit included obtaining an understanding of internal control over financial reporting, assessing the risk that a material weakness exists, testing and evaluating the design and operating effectiveness of internal control, and performing such other procedures as we considered necessary in the circumstances. We believe that our audit provides a reasonable basis for our opinion.
A company’s internal control over financial reporting is a process designed to provide reasonable assurance regarding the reliability of financial reporting and the preparation of financial statements for external purposes in accordance with generally accepted accounting principles. A company’s internal control over financial reporting includes those policies and procedures that (1) pertain to the maintenance of records that, in reasonable detail, accurately and fairly reflect the transactions and dispositions of the assets of the company; (2) provide reasonable assurance that transactions are recorded as necessary to permit preparation of financial statements in accordance with generally accepted accounting principles, and that receipts and expenditures of the company are being made only in accordance with authorizations of management and directors of the company; and (3) provide reasonable assurance regarding prevention or timely detection of unauthorized acquisition, use, or disposition of the company’s assets that could have a material effect on the financial statements.
Because of its inherent limitations, internal control over financial reporting may not prevent or detect misstatements. Also, projections of any evaluation of effectiveness to future periods are subject to the risk that controls may become inadequate because of changes in conditions, or that the degree of compliance with the policies or procedures may deteriorate.
As indicated in the accompanying Report on Internal Control over Financial Reporting, management’s assessment of and conclusion on the effectiveness of internal control over financial reporting did not include the internal controls of Hetronic LLC, which is included in the May 2, 2009 consolidated financial statements of Methode Electronics, Inc. and constituted $21.9 million and $20.0 million of total and net assets, respectively, as of May 2, 2009 and $14.4 million and $36.1 million of revenues and net loss, respectively, for the year then ended. Our audit of internal control over financial reporting of Methode Electronics, Inc. also did not include an evaluation of the internal control over financial reporting of Hetronic LLC.
In our opinion, Methode Electronics, Inc. maintained effective internal control over financial reporting as of May 2, 2009, based on the COSO criteria.
We also have audited, in accordance with the standards of the Public Company Accounting Oversight Board (United States), the consolidated balance sheets of Methode Electronics, Inc. as of May 2, 2009 and May 3, 2008, and the related consolidated statements of operations, shareholders’ equity, and cash flows for each of the three years in the period ended May 2, 2009 and our report dated July 1, 2009 expressed an unqualified opinion thereon. /s/ ERNST & YOUNG LLP
Chicago, Illinois July 1, 2009
10k.indd 2 7/16/09 1:18:26 PM
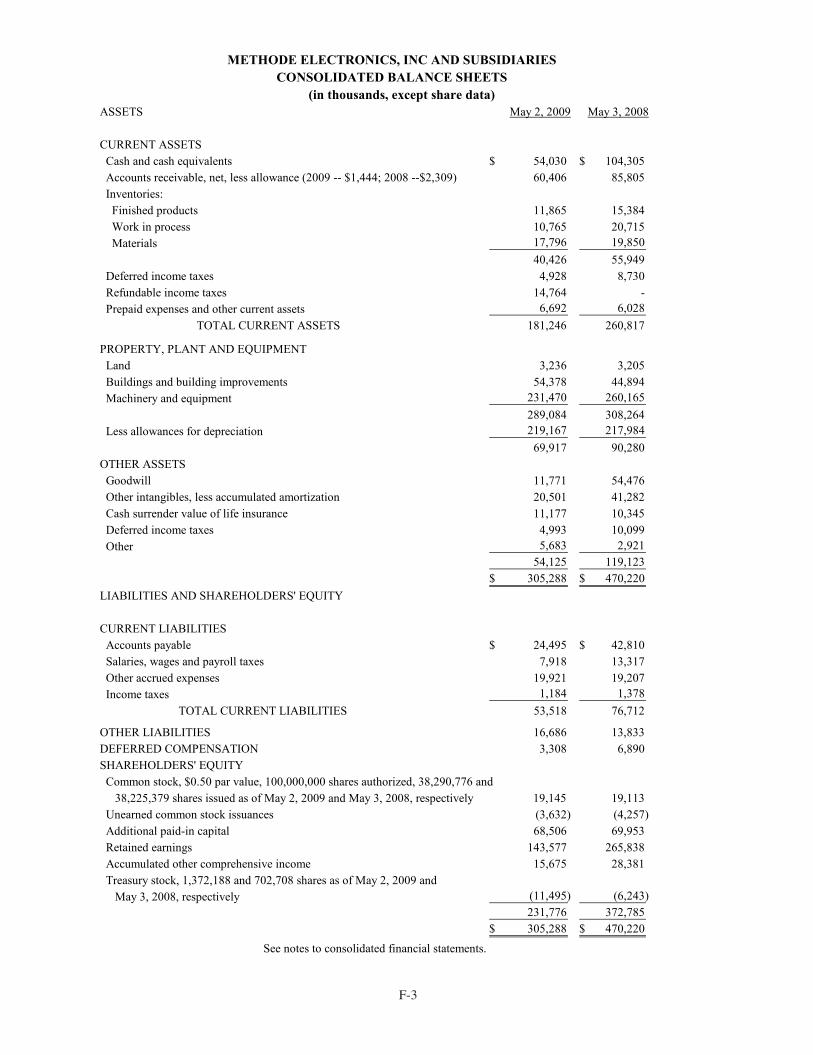
F-2 F-3F-3
ASSETS May 2, 2009 May 3, 2008
CURRENT ASSETS Cash and cash equivalents 54,030$ 104,305$ Accounts receivable, net, less allowance (2009 -- $1,444; 2008 --$2,309) 60,406 85,805 Inventories: Finished products 11,865 15,384 Work in process 10,765 20,715 Materials 17,796 19,850
40,426 55,949 Deferred income taxes 4,928 8,730 Refundable income taxes 14,764 - Prepaid expenses and other current assets 6,692 6,028 TOTAL CURRENT ASSETS 181,246 260,817
PROPERTY, PLANT AND EQUIPMENT Land 3,236 3,205 Buildings and building improvements 54,378 44,894 Machinery and equipment 231,470 260,165
289,084 308,264 Less allowances for depreciation 219,167 217,984
69,917 90,280OTHER ASSETS Goodwill 11,771 54,476 Other intangibles, less accumulated amortization 20,501 41,282 Cash surrender value of life insurance 11,177 10,345 Deferred income taxes 4,993 10,099 Other 5,683 2,921
54,125 119,123305,288$ 470,220$
LIABILITIES AND SHAREHOLDERS' EQUITY
CURRENT LIABILITIES Accounts payable 24,495$ 42,810$ Salaries, wages and payroll taxes 7,918 13,317 Other accrued expenses 19,921 19,207 Income taxes 1,184 1,378 TOTAL CURRENT LIABILITIES 53,518 76,712
OTHER LIABILITIES 16,686 13,833DEFERRED COMPENSATION 3,308 6,890SHAREHOLDERS' EQUITY Common stock, $0.50 par value, 100,000,000 shares authorized, 38,290,776 and 38,225,379 shares issued as of May 2, 2009 and May 3, 2008, respectively 19,145 19,113 Unearned common stock issuances (3,632) (4,257) Additional paid-in capital 68,506 69,953 Retained earnings 143,577 265,838 Accumulated other comprehensive income 15,675 28,381 Treasury stock, 1,372,188 and 702,708 shares as of May 2, 2009 and May 3, 2008, respectively (11,495) (6,243)
231,776 372,785305,288$ 470,220$
METHODE ELECTRONICS, INC AND SUBSIDIARIES
(in thousands, except share data)
See notes to consolidated financial statements.
CONSOLIDATED BALANCE SHEETS
F-2
REPORT OF INDEPENDENT REGISTERED PUBLIC ACCOUNTING FIRM ON INTERNAL CONTROL OVER FINANCIAL REPORTING
Board of Directors and Shareholders Methode Electronics, Inc.
We have audited Methode Electronics, Inc.’s internal control over financial reporting as of May 2, 2009, based on criteria established in Internal Control—Integrated Framework issued by the Committee of Sponsoring Organizations of the Treadway Commission (the COSO criteria). Methode Electronics, Inc.’s management is responsible for maintaining effective internal control over financial reporting, and for its assessment of the effectiveness of internal control over financial reporting included in the accompanying Report on Internal Control Over Financial Reporting. Our responsibility is to express an opinion on the Company’s internal control over financial reporting based on our audit.
We conducted our audit in accordance with the standards of the Public Company Accounting Oversight Board (United States). Those standards require that we plan and perform the audit to obtain reasonable assurance about whether effective internal control over financial reporting was maintained in all material respects. Our audit included obtaining an understanding of internal control over financial reporting, assessing the risk that a material weakness exists, testing and evaluating the design and operating effectiveness of internal control, and performing such other procedures as we considered necessary in the circumstances. We believe that our audit provides a reasonable basis for our opinion.
A company’s internal control over financial reporting is a process designed to provide reasonable assurance regarding the reliability of financial reporting and the preparation of financial statements for external purposes in accordance with generally accepted accounting principles. A company’s internal control over financial reporting includes those policies and procedures that (1) pertain to the maintenance of records that, in reasonable detail, accurately and fairly reflect the transactions and dispositions of the assets of the company; (2) provide reasonable assurance that transactions are recorded as necessary to permit preparation of financial statements in accordance with generally accepted accounting principles, and that receipts and expenditures of the company are being made only in accordance with authorizations of management and directors of the company; and (3) provide reasonable assurance regarding prevention or timely detection of unauthorized acquisition, use, or disposition of the company’s assets that could have a material effect on the financial statements.
Because of its inherent limitations, internal control over financial reporting may not prevent or detect misstatements. Also, projections of any evaluation of effectiveness to future periods are subject to the risk that controls may become inadequate because of changes in conditions, or that the degree of compliance with the policies or procedures may deteriorate.
As indicated in the accompanying Report on Internal Control over Financial Reporting, management’s assessment of and conclusion on the effectiveness of internal control over financial reporting did not include the internal controls of Hetronic LLC, which is included in the May 2, 2009 consolidated financial statements of Methode Electronics, Inc. and constituted $21.9 million and $20.0 million of total and net assets, respectively, as of May 2, 2009 and $14.4 million and $36.1 million of revenues and net loss, respectively, for the year then ended. Our audit of internal control over financial reporting of Methode Electronics, Inc. also did not include an evaluation of the internal control over financial reporting of Hetronic LLC.
In our opinion, Methode Electronics, Inc. maintained effective internal control over financial reporting as of May 2, 2009, based on the COSO criteria.
We also have audited, in accordance with the standards of the Public Company Accounting Oversight Board (United States), the consolidated balance sheets of Methode Electronics, Inc. as of May 2, 2009 and May 3, 2008, and the related consolidated statements of operations, shareholders’ equity, and cash flows for each of the three years in the period ended May 2, 2009 and our report dated July 1, 2009 expressed an unqualified opinion thereon. /s/ ERNST & YOUNG LLP
Chicago, Illinois July 1, 2009
10k.indd 3 7/16/09 1:18:27 PM
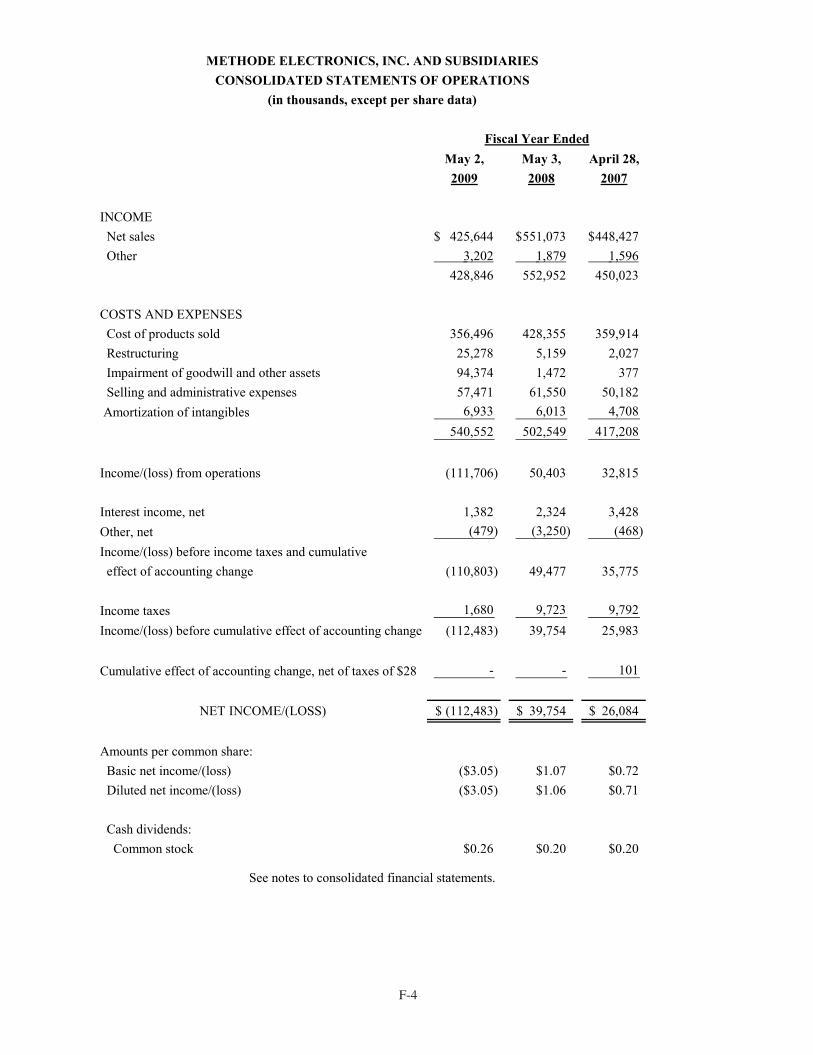
F-4 F-5
F-5
Une
arne
dC
omm
onC
omm
onC
omm
onA
dditi
onal
Cur
renc
yT
otal
Com
pre-
Stoc
kSt
ock
Stoc
kPa
id-in
Ret
aine
dT
rans
latio
nT
reas
ury
Shar
ehol
ders
'he
nsiv
eSh
ares
$Is
suan
ces
Cap
ital
Ear
ning
sA
djus
tmen
tsSt
ock
Equ
ityIn
com
e/(lo
ss)
Bal
ance
at A
pril
29, 2
006
37,7
00,4
84
18
,850
$
(9
,132
)$
59,4
11$
21
5,07
2$
11
,039
$
(3
,531
)$
291,
709
$R
elea
se o
f res
trict
ion
purs
uant
to a
cqui
sitio
n ea
rn-o
ut-
-
1,23
3
-
-
-
-
1,23
3
Purc
hase
and
can
cella
tion
of sh
ares
rela
ted
to a
cqui
sitio
n ea
rn-o
ut(9
5,42
0)
(4
8)
-
(1,0
77)
-
-
-
(1
,125
)
R
ever
sal o
f unv
este
d st
ock
awar
ds fo
r ado
ptio
n of
SFA
S 12
3R(4
63,9
57)
(2
32)
3,38
2
(3
,150
)
-
-
-
-
C
umul
ativ
e ef
fect
of a
ccou
ntin
g ch
ange
-
-
-
(1
29)
-
-
-
(129
)
Earn
ed p
ortio
n of
rest
ricte
d st
ock
awar
ds14
5,76
5
73
-
(7
3)
-
-
-
-
Stoc
k aw
ard
and
stoc
k op
tion
amor
tizat
ion
expe
nse
-
-
-
3,
026
-
-
-
3,
026
V
este
d st
ock
awar
ds w
ithhe
ld fo
r pay
roll
taxe
s(3
5,06
0)
(1
8)
-
(529
)
-
-
-
(5
47)
Ex
erci
se o
f opt
ions
699,
017
350
-
6,85
8
-
-
-
7,20
8
Com
mon
stoc
k re
purc
hase
d-
-
-
-
-
-
(1
,924
)
(1,9
24)
Tax
bene
fit fr
om st
ock
optio
ns-
-
-
1,17
5
-
-
-
1,17
5
Fore
ign
curre
ncy
trans
latio
n ad
just
men
ts-
-
-
-
-
4,
971
-
4,97
1
4,97
1$
N
et in
com
e fo
r yea
r-
-
-
-
26,0
84
-
-
26
,084
26,0
84C
ash
divi
dend
s on
com
mon
stoc
k-
-
-
-
(7,4
72)
-
-
(7,4
72)
31,0
55$
Bal
ance
at A
pril
28, 2
007
37,9
50,8
29
18
,975
$
(4
,517
)$
65,5
12$
23
3,68
4$
16
,010
$
(5
,455
)$
324,
209
$C
umul
ativ
e im
pact
of c
hang
e in
acc
ount
ing
for
unc
erta
intie
s in
inco
me
taxe
s (FI
N 4
8 ad
optio
n)-
-
-
-
(25)
-
-
(25)
Rel
ease
of r
estri
ctio
n pu
rsua
nt to
acq
uisi
tion
earn
-out
-
-
26
0
-
-
-
-
26
0
Ea
rned
por
tion
of re
stric
ted
stoc
k aw
ards
188,
982
94
-
(94)
-
-
-
-
St
ock
awar
d an
d st
ock
optio
n am
ortiz
atio
n ex
pens
e-
-
-
3,35
9
-
-
-
3,35
9
Ves
ted
stoc
k aw
ards
with
held
for p
ayro
ll ta
xes
(40,
140)
(20)
-
(4
41)
-
-
-
(461
)
Exer
cise
of o
ptio
ns12
5,70
8
64
-
1,
234
-
-
-
1,
298
C
omm
on st
ock
repu
rcha
sed
-
-
-
-
-
-
(788
)
(7
88)
Ta
x be
nefit
from
stoc
k op
tions
-
-
-
38
3
-
-
-
38
3
Fo
reig
n cu
rrenc
y tra
nsla
tion
adju
stm
ents
-
-
-
-
-
12,3
71
-
12,3
71
12
,371
$N
et in
com
e fo
r yea
r-
-
-
-
39,7
54
-
-
39
,754
39,7
54C
ash
divi
dend
s on
com
mon
stoc
k-
-
-
-
(7,5
75)
-
-
(7,5
75)
52,1
25$
Bal
ance
at M
ay 3
, 200
838
,225
,379
19,1
13$
(4,2
57)
$
69
,953
$
265,
838
$
28,3
81$
(6,2
43)
$
37
2,78
5$
Rel
ease
of r
estri
ctio
n pu
rsua
nt to
acq
uisi
tion
earn
-out
(53,
012)
(27)
62
5
(598
)
-
-
-
-
Earn
ed p
ortio
n of
rest
ricte
d st
ock
awar
ds12
0,04
1
60
-
(6
0)
-
-
-
-
Stoc
k aw
ard
and
stoc
k op
tion
amor
tizat
ion
expe
nse
-
-
-
(5
53)
-
-
-
(553
)
Ves
ted
stoc
k aw
ards
with
held
for p
ayro
ll ta
xes
(20,
721)
(11)
-
(1
30)
-
-
-
(141
)
Exer
cise
of o
ptio
ns19
,089
10
-
103
-
-
-
113
Com
mon
stoc
k re
purc
hase
d-
-
-
-
-
-
(5
,252
)
(5,2
52)
Tax
expe
nse
from
stoc
k op
tions
-
-
-
(2
09)
-
-
-
(209
)
Fore
ign
curre
ncy
trans
latio
n ad
just
men
ts-
-
-
-
-
(1
2,70
6)
-
(12,
706)
(1
2,70
6)$
Net
inco
me/
(loss
) for
yea
r-
-
-
-
(112
,483
)
-
-
(112
,483
)
(112
,483
)C
ash
divi
dend
s on
com
mon
stoc
k-
-
-
-
(9,7
78)
-
-
(9,7
78)
(125
,189
)$
Bal
ance
at M
ay 2
, 200
938
,290
,776
19,1
45$
(3,6
32)
$
68
,506
$
143,
577
$
15,6
75$
(11,
495)
$
23
1,77
6$
See
note
s to
cons
olid
ated
fina
ncia
l sta
tem
ents
ME
TH
OD
E E
LE
CT
RO
NIC
S, IN
C A
ND
SU
BSI
DIA
RIE
SC
ON
SOL
IDA
TE
D S
TA
TEM
EN
TS
OF
SHA
RE
HO
LD
ER
S' E
QU
ITY
Yea
rs E
nded
May
2, 2
009,
May
3, 2
008
and
Apr
il 28
, 200
7(D
olla
r am
ount
s in
thou
sand
s, ex
cept
shar
e da
ta)
F-4
May 2, May 3, April 28,2009 2008 2007
INCOME Net sales 425,644$ 551,073$ 448,427$ Other 3,202 1,879 1,596
428,846 552,952 450,023
COSTS AND EXPENSES Cost of products sold 356,496 428,355 359,914 Restructuring 25,278 5,159 2,027 Impairment of goodwill and other assets 94,374 1,472 377 Selling and administrative expenses 57,471 61,550 50,182 Amortization of intangibles 6,933 6,013 4,708
540,552 502,549 417,208
Income/(loss) from operations (111,706) 50,403 32,815
Interest income, net 1,382 2,324 3,428Other, net (479) (3,250) (468)Income/(loss) before income taxes and cumulative effect of accounting change (110,803) 49,477 35,775
Income taxes 1,680 9,723 9,792Income/(loss) before cumulative effect of accounting change (112,483) 39,754 25,983
Cumulative effect of accounting change, net of taxes of $28 - - 101
NET INCOME/(LOSS) (112,483)$ 39,754$ 26,084$
Amounts per common share: Basic net income/(loss) ($3.05) $1.07 $0.72 Diluted net income/(loss) ($3.05) $1.06 $0.71
Cash dividends: Common stock $0.26 $0.20 $0.20
See notes to consolidated financial statements.
Fiscal Year Ended
METHODE ELECTRONICS, INC. AND SUBSIDIARIESCONSOLIDATED STATEMENTS OF OPERATIONS
(in thousands, except per share data)
10k.indd 4 7/16/09 1:18:27 PM
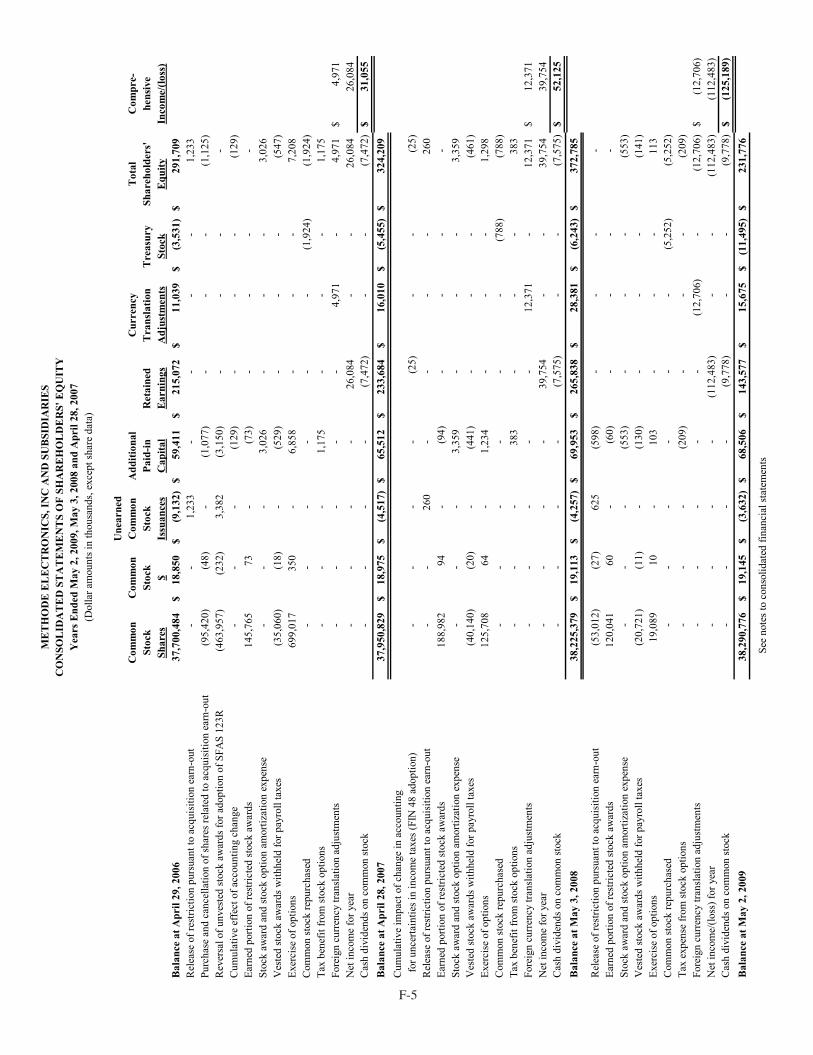
F-4 F-5
F-5
Une
arne
dC
omm
onC
omm
onC
omm
onA
dditi
onal
Cur
renc
yT
otal
Com
pre-
Stoc
kSt
ock
Stoc
kPa
id-in
Ret
aine
dT
rans
latio
nT
reas
ury
Shar
ehol
ders
'he
nsiv
eSh
ares
$Is
suan
ces
Cap
ital
Ear
ning
sA
djus
tmen
tsSt
ock
Equ
ityIn
com
e/(lo
ss)
Bal
ance
at A
pril
29, 2
006
37,7
00,4
84
18
,850
$
(9
,132
)$
59,4
11$
21
5,07
2$
11
,039
$
(3
,531
)$
291,
709
$R
elea
se o
f res
trict
ion
purs
uant
to a
cqui
sitio
n ea
rn-o
ut-
-
1,23
3
-
-
-
-
1,23
3
Purc
hase
and
can
cella
tion
of sh
ares
rela
ted
to a
cqui
sitio
n ea
rn-o
ut(9
5,42
0)
(4
8)
-
(1,0
77)
-
-
-
(1
,125
)
R
ever
sal o
f unv
este
d st
ock
awar
ds fo
r ado
ptio
n of
SFA
S 12
3R(4
63,9
57)
(2
32)
3,38
2
(3
,150
)
-
-
-
-
C
umul
ativ
e ef
fect
of a
ccou
ntin
g ch
ange
-
-
-
(1
29)
-
-
-
(129
)
Earn
ed p
ortio
n of
rest
ricte
d st
ock
awar
ds14
5,76
5
73
-
(7
3)
-
-
-
-
Stoc
k aw
ard
and
stoc
k op
tion
amor
tizat
ion
expe
nse
-
-
-
3,
026
-
-
-
3,
026
V
este
d st
ock
awar
ds w
ithhe
ld fo
r pay
roll
taxe
s(3
5,06
0)
(1
8)
-
(529
)
-
-
-
(5
47)
Ex
erci
se o
f opt
ions
699,
017
350
-
6,85
8
-
-
-
7,20
8
Com
mon
stoc
k re
purc
hase
d-
-
-
-
-
-
(1
,924
)
(1,9
24)
Tax
bene
fit fr
om st
ock
optio
ns-
-
-
1,17
5
-
-
-
1,17
5
Fore
ign
curre
ncy
trans
latio
n ad
just
men
ts-
-
-
-
-
4,
971
-
4,97
1
4,97
1$
N
et in
com
e fo
r yea
r-
-
-
-
26,0
84
-
-
26
,084
26,0
84C
ash
divi
dend
s on
com
mon
stoc
k-
-
-
-
(7,4
72)
-
-
(7,4
72)
31,0
55$
Bal
ance
at A
pril
28, 2
007
37,9
50,8
29
18
,975
$
(4
,517
)$
65,5
12$
23
3,68
4$
16
,010
$
(5
,455
)$
324,
209
$C
umul
ativ
e im
pact
of c
hang
e in
acc
ount
ing
for
unc
erta
intie
s in
inco
me
taxe
s (FI
N 4
8 ad
optio
n)-
-
-
-
(25)
-
-
(25)
Rel
ease
of r
estri
ctio
n pu
rsua
nt to
acq
uisi
tion
earn
-out
-
-
26
0
-
-
-
-
26
0
Ea
rned
por
tion
of re
stric
ted
stoc
k aw
ards
188,
982
94
-
(94)
-
-
-
-
St
ock
awar
d an
d st
ock
optio
n am
ortiz
atio
n ex
pens
e-
-
-
3,35
9
-
-
-
3,35
9
Ves
ted
stoc
k aw
ards
with
held
for p
ayro
ll ta
xes
(40,
140)
(20)
-
(4
41)
-
-
-
(461
)
Exer
cise
of o
ptio
ns12
5,70
8
64
-
1,
234
-
-
-
1,
298
C
omm
on st
ock
repu
rcha
sed
-
-
-
-
-
-
(788
)
(7
88)
Ta
x be
nefit
from
stoc
k op
tions
-
-
-
38
3
-
-
-
38
3
Fo
reig
n cu
rrenc
y tra
nsla
tion
adju
stm
ents
-
-
-
-
-
12,3
71
-
12,3
71
12
,371
$N
et in
com
e fo
r yea
r-
-
-
-
39,7
54
-
-
39
,754
39,7
54C
ash
divi
dend
s on
com
mon
stoc
k-
-
-
-
(7,5
75)
-
-
(7,5
75)
52,1
25$
Bal
ance
at M
ay 3
, 200
838
,225
,379
19,1
13$
(4,2
57)
$
69
,953
$
265,
838
$
28,3
81$
(6,2
43)
$
37
2,78
5$
Rel
ease
of r
estri
ctio
n pu
rsua
nt to
acq
uisi
tion
earn
-out
(53,
012)
(27)
62
5
(598
)
-
-
-
-
Earn
ed p
ortio
n of
rest
ricte
d st
ock
awar
ds12
0,04
1
60
-
(6
0)
-
-
-
-
Stoc
k aw
ard
and
stoc
k op
tion
amor
tizat
ion
expe
nse
-
-
-
(5
53)
-
-
-
(553
)
Ves
ted
stoc
k aw
ards
with
held
for p
ayro
ll ta
xes
(20,
721)
(11)
-
(1
30)
-
-
-
(141
)
Exer
cise
of o
ptio
ns19
,089
10
-
103
-
-
-
113
Com
mon
stoc
k re
purc
hase
d-
-
-
-
-
-
(5
,252
)
(5,2
52)
Tax
expe
nse
from
stoc
k op
tions
-
-
-
(2
09)
-
-
-
(209
)
Fore
ign
curre
ncy
trans
latio
n ad
just
men
ts-
-
-
-
-
(1
2,70
6)
-
(12,
706)
(1
2,70
6)$
Net
inco
me/
(loss
) for
yea
r-
-
-
-
(112
,483
)
-
-
(112
,483
)
(112
,483
)C
ash
divi
dend
s on
com
mon
stoc
k-
-
-
-
(9,7
78)
-
-
(9,7
78)
(125
,189
)$
Bal
ance
at M
ay 2
, 200
938
,290
,776
19,1
45$
(3,6
32)
$
68
,506
$
143,
577
$
15,6
75$
(11,
495)
$
23
1,77
6$
See
note
s to
cons
olid
ated
fina
ncia
l sta
tem
ents
ME
TH
OD
E E
LE
CT
RO
NIC
S, IN
C A
ND
SU
BSI
DIA
RIE
SC
ON
SOL
IDA
TE
D S
TA
TEM
EN
TS
OF
SHA
RE
HO
LD
ER
S' E
QU
ITY
Yea
rs E
nded
May
2, 2
009,
May
3, 2
008
and
Apr
il 28
, 200
7(D
olla
r am
ount
s in
thou
sand
s, ex
cept
shar
e da
ta)
F-4
May 2, May 3, April 28,2009 2008 2007
INCOME Net sales 425,644$ 551,073$ 448,427$ Other 3,202 1,879 1,596
428,846 552,952 450,023
COSTS AND EXPENSES Cost of products sold 356,496 428,355 359,914 Restructuring 25,278 5,159 2,027 Impairment of goodwill and other assets 94,374 1,472 377 Selling and administrative expenses 57,471 61,550 50,182 Amortization of intangibles 6,933 6,013 4,708
540,552 502,549 417,208
Income/(loss) from operations (111,706) 50,403 32,815
Interest income, net 1,382 2,324 3,428Other, net (479) (3,250) (468)Income/(loss) before income taxes and cumulative effect of accounting change (110,803) 49,477 35,775
Income taxes 1,680 9,723 9,792Income/(loss) before cumulative effect of accounting change (112,483) 39,754 25,983
Cumulative effect of accounting change, net of taxes of $28 - - 101
NET INCOME/(LOSS) (112,483)$ 39,754$ 26,084$
Amounts per common share: Basic net income/(loss) ($3.05) $1.07 $0.72 Diluted net income/(loss) ($3.05) $1.06 $0.71
Cash dividends: Common stock $0.26 $0.20 $0.20
See notes to consolidated financial statements.
Fiscal Year Ended
METHODE ELECTRONICS, INC. AND SUBSIDIARIESCONSOLIDATED STATEMENTS OF OPERATIONS
(in thousands, except per share data)
10k.indd 5 7/16/09 1:18:28 PM

F-6 F-7
METHODE ELECTRONICS, INC. AND SUBSIDIARIES
NOTES TO CONSOLIDATED FINANCIAL STATEMENTS (Continued)
(Dollar amounts in thousands, except number of shares and per share data)
F-7
1. Significant Accounting Policies
Principles of Consolidation. The consolidated financial statements include the accounts and operations of Methode Electronics, Inc. (“the Company”) and its subsidiaries. As used herein, “we,” “us,” “our,” the “Company” or “Methode” means Methode Electronics, Inc. and its subsidiaries.
Financial Reporting Periods. We maintain our financial records on the basis of a fifty-two or fifty-three week fiscal year ending on the Saturday closest to April 30. Due to the timing of our fiscal calendar, the fiscal year ended May 2, 2009 and the fiscal year ended April 28, 2007 represent 52 weeks of results and the fiscal year ended May 3, 2008 represents 53 weeks of results.
Cash Equivalents. Generally, all highly liquid investments with a maturity of three months or less when purchased are carried at their approximate fair value and classified in the consolidated balance sheets as cash equivalents.
Accounts Receivable and Allowance for Doubtful Accounts. We carry accounts receivable at their face amounts less an allowance for doubtful accounts. On a regular basis, we record an allowance for uncollectible receivables based upon past transaction history with customers, customer payment practices and economic conditions. Actual collection experience may differ from the current estimate of net receivables. A change to the allowance for uncollectible amounts may be required if a future event or other change in circumstances results in a change in the estimate of the ultimate collectability of a specific account. We do not require collateral for our accounts receivable balances. Accounts are written off against the allowance account when they are determined to be no longer collectible.
Inventories. Inventories are stated at the lower-of-cost (first-in, first-out method)-or-market.
Property, Plant and Equipment. Properties are stated on the basis of cost. We amortize such costs by annual charges to income, computed on the straight-line method using estimated useful lives of 5 to 40 years for buildings and improvements and 3 to 15 years for machinery and equipment for financial reporting purposes. Accelerated methods are generally used for income tax purposes.
Income Taxes. Deferred tax assets and liabilities are determined based on differences between financial reporting and tax bases of assets and liabilities and are measured using the enacted tax rates and laws that will be in effect when the differences are expected to reverse.
Revenue Recognition. We recognize revenue on product sales when i) persuasive evidence of an agreement exists, ii) the price is fixed or determinable, iii) delivery has occurred or services have been rendered, and iv) collection of the sales proceeds is reasonably assured. Revenue from our product sales not requiring installation, net of trade discounts and estimated sales allowances, is recognized when title passes, which is generally upon shipment. We do not have any additional obligations or customer acceptance provisions after shipment of such products. We handle returns by replacing, repairing or issuing credit for defective products when returned. Return costs were not significant in fiscal 2009, 2008 and 2007. Revenue from cabling infrastructure systems installations is recognized when the installation is completed, tested and accepted by the customer.
Shipping and Handling Fees and Costs. Shipping and handling fees billed to customers are included in net sales, and the related costs are included in cost of products sold.
Foreign Currency Translation. The functional currencies of the majority of our foreign subsidiaries are in their local currencies. Accordingly, the results of operations of these foreign subsidiaries are translated into U.S. dollars using average exchange rates during the year, while the assets and liabilities are translated using period end exchange rates. Adjustments from the translation process are classified as a component of shareholders’ equity. Exchange gains and losses arising from transactions denominated in a currency other than the functional currency of the foreign subsidiary are included in the Consolidated Statements of Operations in other, net. In fiscal 2009, 2008 and 2007, we had foreign exchange losses of $479, $3,250 and $468, respectively.
F-6
May 2, May 3, April 28,2009 2008 2007
OPERATING ACTIVITIES Net income/(loss) (112,483)$ 39,754$ 26,084$ Adjustments to reconcile net income/(loss) to net cash provided by operating activities: Provision for minority interest 343 329 241 (Gain)/loss of sale of fixed assets (407) (120) 268 Provision for depreciation 30,103 22,146 18,915 Amortization of intangible assets 6,933 6,013 4,708 Impairment of tangible assets 10,313 1,472 377 Impairment of goodwill and other assets 94,374 - - Stock-based compensation (553) 3,359 2,897 Provision for bad debt 120 195 372 Deferred income taxes 8,078 (2,948) (1,012) Changes in operating assets and liabilities: Accounts receivable 33,347 (793) 4,942 Inventories 19,918 (482) 1,875 Prepaid expenses and other current assets (16,086) 7,989 2,478 Accounts payable and accrued expenses (30,832) 107 (8,230) NET CASH PROVIDED BY OPERATING ACTIVITIES 43,168 77,021 53,915
INVESTING ACTIVITIES Purchases of property, plant and equipment (17,064) (20,018) (10,667) Acquisition of businesses (57,469) (9,647) (63,168) Acquisition of technology licenses (1,575) - (113) Proceeds from the sale of property and equipment - 1,706 800 Joint venture dividend - (1,000) - Other (14) (27) (218) NET CASH USED IN INVESTING ACTIVITIES (76,122) (28,986) (73,366)
FINANCING ACTIVITIES Purchase of common stock (5,252) (1,249) (3,596) Proceeds from exercise of stock options 113 1,298 7,208 Tax (expense)/benefit from stock options and awards (209) 383 1,175 Cash dividends (9,778) (7,575) (7,472) NET CASH USED IN FINANCING ACTIVITIES (15,126) (7,143) (2,685)
Effect of foreign currency exchange rate changes on cash (2,195) 3,322 581
INCREASE (DECREASE) IN CASH AND CASH EQUIVALENTS (50,275) 44,214 (21,555)
Cash and cash equivalents at beginning of year 104,305 60,091 81,646
CASH AND CASH EQUIVALENTS AT END OF YEAR 54,030$ 104,305$ 60,091$
See notes to condensed consolidated financial statements.
Fiscal Year Ended
METHODE ELECTRONICS, INC. AND SUBSIDIARIESCONSOLIDATED STATEMENTS OF CASH FLOWS
(in thousands)
10k.indd 6 7/16/09 1:18:29 PM
F-6 F-7
METHODE ELECTRONICS, INC. AND SUBSIDIARIES
NOTES TO CONSOLIDATED FINANCIAL STATEMENTS (Continued)
(Dollar amounts in thousands, except number of shares and per share data)
F-7
1. Significant Accounting Policies
Principles of Consolidation. The consolidated financial statements include the accounts and operations of Methode Electronics, Inc. (“the Company”) and its subsidiaries. As used herein, “we,” “us,” “our,” the “Company” or “Methode” means Methode Electronics, Inc. and its subsidiaries.
Financial Reporting Periods. We maintain our financial records on the basis of a fifty-two or fifty-three week fiscal year ending on the Saturday closest to April 30. Due to the timing of our fiscal calendar, the fiscal year ended May 2, 2009 and the fiscal year ended April 28, 2007 represent 52 weeks of results and the fiscal year ended May 3, 2008 represents 53 weeks of results.
Cash Equivalents. Generally, all highly liquid investments with a maturity of three months or less when purchased are carried at their approximate fair value and classified in the consolidated balance sheets as cash equivalents.
Accounts Receivable and Allowance for Doubtful Accounts. We carry accounts receivable at their face amounts less an allowance for doubtful accounts. On a regular basis, we record an allowance for uncollectible receivables based upon past transaction history with customers, customer payment practices and economic conditions. Actual collection experience may differ from the current estimate of net receivables. A change to the allowance for uncollectible amounts may be required if a future event or other change in circumstances results in a change in the estimate of the ultimate collectability of a specific account. We do not require collateral for our accounts receivable balances. Accounts are written off against the allowance account when they are determined to be no longer collectible.
Inventories. Inventories are stated at the lower-of-cost (first-in, first-out method)-or-market.
Property, Plant and Equipment. Properties are stated on the basis of cost. We amortize such costs by annual charges to income, computed on the straight-line method using estimated useful lives of 5 to 40 years for buildings and improvements and 3 to 15 years for machinery and equipment for financial reporting purposes. Accelerated methods are generally used for income tax purposes.
Income Taxes. Deferred tax assets and liabilities are determined based on differences between financial reporting and tax bases of assets and liabilities and are measured using the enacted tax rates and laws that will be in effect when the differences are expected to reverse.
Revenue Recognition. We recognize revenue on product sales when i) persuasive evidence of an agreement exists, ii) the price is fixed or determinable, iii) delivery has occurred or services have been rendered, and iv) collection of the sales proceeds is reasonably assured. Revenue from our product sales not requiring installation, net of trade discounts and estimated sales allowances, is recognized when title passes, which is generally upon shipment. We do not have any additional obligations or customer acceptance provisions after shipment of such products. We handle returns by replacing, repairing or issuing credit for defective products when returned. Return costs were not significant in fiscal 2009, 2008 and 2007. Revenue from cabling infrastructure systems installations is recognized when the installation is completed, tested and accepted by the customer.
Shipping and Handling Fees and Costs. Shipping and handling fees billed to customers are included in net sales, and the related costs are included in cost of products sold.
Foreign Currency Translation. The functional currencies of the majority of our foreign subsidiaries are in their local currencies. Accordingly, the results of operations of these foreign subsidiaries are translated into U.S. dollars using average exchange rates during the year, while the assets and liabilities are translated using period end exchange rates. Adjustments from the translation process are classified as a component of shareholders’ equity. Exchange gains and losses arising from transactions denominated in a currency other than the functional currency of the foreign subsidiary are included in the Consolidated Statements of Operations in other, net. In fiscal 2009, 2008 and 2007, we had foreign exchange losses of $479, $3,250 and $468, respectively.
F-6
May 2, May 3, April 28,2009 2008 2007
OPERATING ACTIVITIES Net income/(loss) (112,483)$ 39,754$ 26,084$ Adjustments to reconcile net income/(loss) to net cash provided by operating activities: Provision for minority interest 343 329 241 (Gain)/loss of sale of fixed assets (407) (120) 268 Provision for depreciation 30,103 22,146 18,915 Amortization of intangible assets 6,933 6,013 4,708 Impairment of tangible assets 10,313 1,472 377 Impairment of goodwill and other assets 94,374 - - Stock-based compensation (553) 3,359 2,897 Provision for bad debt 120 195 372 Deferred income taxes 8,078 (2,948) (1,012) Changes in operating assets and liabilities: Accounts receivable 33,347 (793) 4,942 Inventories 19,918 (482) 1,875 Prepaid expenses and other current assets (16,086) 7,989 2,478 Accounts payable and accrued expenses (30,832) 107 (8,230) NET CASH PROVIDED BY OPERATING ACTIVITIES 43,168 77,021 53,915
INVESTING ACTIVITIES Purchases of property, plant and equipment (17,064) (20,018) (10,667) Acquisition of businesses (57,469) (9,647) (63,168) Acquisition of technology licenses (1,575) - (113) Proceeds from the sale of property and equipment - 1,706 800 Joint venture dividend - (1,000) - Other (14) (27) (218) NET CASH USED IN INVESTING ACTIVITIES (76,122) (28,986) (73,366)
FINANCING ACTIVITIES Purchase of common stock (5,252) (1,249) (3,596) Proceeds from exercise of stock options 113 1,298 7,208 Tax (expense)/benefit from stock options and awards (209) 383 1,175 Cash dividends (9,778) (7,575) (7,472) NET CASH USED IN FINANCING ACTIVITIES (15,126) (7,143) (2,685)
Effect of foreign currency exchange rate changes on cash (2,195) 3,322 581
INCREASE (DECREASE) IN CASH AND CASH EQUIVALENTS (50,275) 44,214 (21,555)
Cash and cash equivalents at beginning of year 104,305 60,091 81,646
CASH AND CASH EQUIVALENTS AT END OF YEAR 54,030$ 104,305$ 60,091$
See notes to condensed consolidated financial statements.
Fiscal Year Ended
METHODE ELECTRONICS, INC. AND SUBSIDIARIESCONSOLIDATED STATEMENTS OF CASH FLOWS
(in thousands)
10k.indd 7 7/16/09 1:18:30 PM
F-8 F-9
METHODE ELECTRONICS, INC. AND SUBSIDIARIES
NOTES TO CONSOLIDATED FINANCIAL STATEMENTS (Continued)
(Dollar amounts in thousands, except number of shares and per share data)
F-9
1. Significant Accounting Policies - Continued
generally accepted in the United States requires management to make estimates and assumptions that affect the amounts reported in the financial statements and accompanying notes. Actual results could differ from those estimates.
Fair Value of Other Financial Instruments. The carrying values of our short-term financial instruments, including cash and cash equivalents, accounts receivable and accounts payable approximate their fair values because of the short maturity of these instruments.
Comprehensive Income. SFAS No. 130, “Reporting Comprehensive Income,” requires companies to report all changes in equity during a period, except those resulting from investment by owners and distribution to owners, in a financial statement for the period in which they were recognized. We chose to disclose comprehensive income, which encompasses net income and foreign currency translation adjustments, in the Consolidated Statement of Shareholders’ Equity.
Recent Accounting Pronouncements
We adopted Financial Accounting Standards Board (“FASB”) SFAS No. 157, “Fair Value Measurements” (“SFAS No. 157”) as of May 4, 2008 for financial assets and liabilities, and non-financial assets and liabilities that are recognized or disclosed at fair value in the financial statements on a recurring basis. SFAS No. 157 defines fair value, establishes a framework for measuring fair value as required by other accounting pronouncements and expands fair value measurement disclosures. The provisions of SFAS No. 157 are applied prospectively upon adoption and did not have a material impact on our Consolidated Financial Statements. The disclosures required by SFAS No. 157 are included in Note 15, “Fair Value Measurements,” to our Consolidated Financial Statements.
In February 2008, the FASB issued FASB Staff Position No. 157-2, which delays the effective date of SFAS No. 157 for non-financial assets and liabilities, which are not measured at fair value on a recurring basis (at least annually) until fiscal years beginning after November 15, 2008, which is our fiscal year 2010 that began May 3, 2009. We are currently assessing the impact of adopting SFAS No. 157 for non-financial assets and liabilities on our Consolidated Financial Statements.
We adopted SFAS No. 159, “The Fair Value Option for Financial Assets and Financial Liabilities—Including an Amendment of FASB Statement No. 115” (“SFAS No. 159”) as of May 4, 2008. SFAS No. 159 permits entities to elect to measure many financial instruments and certain other items at fair value. We did not elect the fair value option for any assets or liabilities that were not previously carried at fair value. Accordingly, the adoption of SFAS No. 159 had no impact on our Consolidated Financial Statements.
We adopted Emerging Issues Task Force (EITF) No. 06-4, “Accounting for Deferred Compensation and Postretirement Benefit Aspects of Endorsement Split-Dollar Life Insurance Arrangements” (“EITF No. 06-4”) as of May 4, 2008. EITF No. 06-4 requires that endorsement split-dollar life insurance arrangements, which provide a benefit to an employee beyond the postretirement period be recorded in accordance with SFAS No. 106, “Employer’s Accounting for Postretirement Benefits Other Than Pensions” or Accounting Principle Board (“APB”) Opinion No. 12, “Omnibus Opinion—1967” based on the substance of the agreement with the employee. The adoption of EITF No. 06-4 had no impact on our Consolidated Financial Statements.
In December 2007, the FASB issued SFAS No. 141 (revised 2007) (“SFAS No. 141R”), a revision of SFAS No. 141, “Business Combinations.” SFAS No. 141R establishes requirements for the recognition and measurement of acquired assets, liabilities, goodwill and non-controlling interests. SFAS No. 141R also provides disclosure requirements related to business combinations. SFAS No. 141R is effective for fiscal years beginning after December 15, 2008, which is our fiscal year 2010 that began May 3, 2009. SFAS No. 141R will be applied prospectively to business combinations with an acquisition date on or after the effective date. This statement will generally affect acquisitions occurring after the adoption date.
METHODE ELECTRONICS, INC. AND SUBSIDIARIES
NOTES TO CONSOLIDATED FINANCIAL STATEMENTS (Continued)
(Dollar amounts in thousands, except number of shares and per share data)
F-8
1. Significant Accounting Policies - Continued
Long-Lived Assets. In accordance with Statement of Financial Accounting Standards (“SFAS”) No. 144, “Accounting for the Impairment or Disposal of Long-Lived Assets,” we continually evaluate whether events and circumstances have occurred which indicate that the remaining estimated useful lives of our intangible assets, excluding goodwill, and other long-lived assets, may warrant revision or that the remaining balance of such assets may not be recoverable. In the event that the undiscounted cash flows resulting from the use of the asset group is less than the carrying amount, an impairment loss equal to the excess of the asset’s carrying amount over its fair value is recorded.
In accordance with SFAS No. 144, “Accounting for the Impairment or Disposal of Long-Lived Assets”, we record impairment losses on long-lived assets used in operations when events and circumstances indicate that long-lived assets might be impaired and the undiscounted cash flows estimated to be generated by those assets are less than the carrying amounts of those assets. During fiscal 2009, based on our future estimates of the undiscounted cash flows, it was determined that certain identifiable intangible assets of our TouchSensor and Hetronic businesses in the Interconnect segment, the Automotive Safety Technologies business in our Automotive segment and Magna-Lastic Devices, Inc from our Other segment were impaired. Therefore, we recorded an impairment charge of $26.2 million in the Interconnect segment, $4.6 million in the Automotive segment and $0.4 million in the Other segment for a total of $31.2 million for these assets.
Goodwill and Intangibles. Costs assigned to the fair value of intangible assets acquired with finite lives are being amortized over periods ranging from 3 to 20 years, generally on a straight-line basis or accelerated basis, depending on the nature of the intangible asset. The fair value of certain intangible assets is being amortized over projected revenues used to initially value such intangible assets. Goodwill represents the excess of purchase price over the estimated fair value of net assets of acquired companies, which has not been allocated to other intangible assets.
The Company evaluates goodwill for impairment at the reporting unit level, which is one level below the operating segment level (herein referred to as the reporting unit). The impairment test for goodwill is a two-step process. The first step is to identify when goodwill impairment has occurred by comparing the fair value of a reporting unit with its carrying amount, including goodwill. If the fair value of a reporting unit exceeds its carrying amount, goodwill of the reporting unit is not considered impaired. If the carrying amount of the reporting unit exceeds its fair value, the second step of the goodwill test is performed to measure the amount of the impairment loss, if any. In this second step, the implied fair value of the reporting unit’s goodwill is compared with the carrying amount of the goodwill. If the carrying amount of the reporting unit’s goodwill exceeds the implied fair value of that goodwill, an impairment loss is recognized in an amount equal to that excess, not to exceed the carrying amount of the goodwill. Based on events and general business declines, we performed “step one” of the goodwill impairment test in accordance with paragraph 19 of SFAS No. 142, “Goodwill and Other Intangible Assets”, on the reporting units that have goodwill during fiscal 2009. Based on this test, we determined that the fair value was less than the carrying value of the net assets for certain reporting units. We completed “step two” of the goodwill test and concluded that goodwill was impaired. During fiscal 2009, we recorded a goodwill impairment charge of $25,840 in our Automotive segment, $30,750 in our Interconnect segment, $5,358 in our Power Products segment and $1,203 in our Other segment for a total of $63,151 related to these assets.
Research and Development Costs. Costs associated with the development of new products are charged to expense when incurred. Research and development costs for the fiscal years ended May 2, 2009, May 3, 2008 and April 28, 2007 amounted to $21,995, $25,595 and $21,336, respectively.
Stock-Based Compensation. See Note 5, Shareholders’ Equity for a description of our stock-based compensation plans. In the first quarter of fiscal 2007, we adopted SFAS No. 123(R), “Share Based Payments,” which revises SFAS No. 123, “Accounting for Stock Based Compensation.” SFAS No. 123(R) requires us to record compensation expense for all share-based payments, including employee stock options, at fair value.
Use of Estimates. The preparation of financial statements in conformity with accounting principles
10k.indd 8 7/16/09 1:18:30 PM

F-8 F-9
METHODE ELECTRONICS, INC. AND SUBSIDIARIES
NOTES TO CONSOLIDATED FINANCIAL STATEMENTS (Continued)
(Dollar amounts in thousands, except number of shares and per share data)
F-9
1. Significant Accounting Policies - Continued
generally accepted in the United States requires management to make estimates and assumptions that affect the amounts reported in the financial statements and accompanying notes. Actual results could differ from those estimates.
Fair Value of Other Financial Instruments. The carrying values of our short-term financial instruments, including cash and cash equivalents, accounts receivable and accounts payable approximate their fair values because of the short maturity of these instruments.
Comprehensive Income. SFAS No. 130, “Reporting Comprehensive Income,” requires companies to report all changes in equity during a period, except those resulting from investment by owners and distribution to owners, in a financial statement for the period in which they were recognized. We chose to disclose comprehensive income, which encompasses net income and foreign currency translation adjustments, in the Consolidated Statement of Shareholders’ Equity.
Recent Accounting Pronouncements
We adopted Financial Accounting Standards Board (“FASB”) SFAS No. 157, “Fair Value Measurements” (“SFAS No. 157”) as of May 4, 2008 for financial assets and liabilities, and non-financial assets and liabilities that are recognized or disclosed at fair value in the financial statements on a recurring basis. SFAS No. 157 defines fair value, establishes a framework for measuring fair value as required by other accounting pronouncements and expands fair value measurement disclosures. The provisions of SFAS No. 157 are applied prospectively upon adoption and did not have a material impact on our Consolidated Financial Statements. The disclosures required by SFAS No. 157 are included in Note 15, “Fair Value Measurements,” to our Consolidated Financial Statements.
In February 2008, the FASB issued FASB Staff Position No. 157-2, which delays the effective date of SFAS No. 157 for non-financial assets and liabilities, which are not measured at fair value on a recurring basis (at least annually) until fiscal years beginning after November 15, 2008, which is our fiscal year 2010 that began May 3, 2009. We are currently assessing the impact of adopting SFAS No. 157 for non-financial assets and liabilities on our Consolidated Financial Statements.
We adopted SFAS No. 159, “The Fair Value Option for Financial Assets and Financial Liabilities—Including an Amendment of FASB Statement No. 115” (“SFAS No. 159”) as of May 4, 2008. SFAS No. 159 permits entities to elect to measure many financial instruments and certain other items at fair value. We did not elect the fair value option for any assets or liabilities that were not previously carried at fair value. Accordingly, the adoption of SFAS No. 159 had no impact on our Consolidated Financial Statements.
We adopted Emerging Issues Task Force (EITF) No. 06-4, “Accounting for Deferred Compensation and Postretirement Benefit Aspects of Endorsement Split-Dollar Life Insurance Arrangements” (“EITF No. 06-4”) as of May 4, 2008. EITF No. 06-4 requires that endorsement split-dollar life insurance arrangements, which provide a benefit to an employee beyond the postretirement period be recorded in accordance with SFAS No. 106, “Employer’s Accounting for Postretirement Benefits Other Than Pensions” or Accounting Principle Board (“APB”) Opinion No. 12, “Omnibus Opinion—1967” based on the substance of the agreement with the employee. The adoption of EITF No. 06-4 had no impact on our Consolidated Financial Statements.
In December 2007, the FASB issued SFAS No. 141 (revised 2007) (“SFAS No. 141R”), a revision of SFAS No. 141, “Business Combinations.” SFAS No. 141R establishes requirements for the recognition and measurement of acquired assets, liabilities, goodwill and non-controlling interests. SFAS No. 141R also provides disclosure requirements related to business combinations. SFAS No. 141R is effective for fiscal years beginning after December 15, 2008, which is our fiscal year 2010 that began May 3, 2009. SFAS No. 141R will be applied prospectively to business combinations with an acquisition date on or after the effective date. This statement will generally affect acquisitions occurring after the adoption date.
METHODE ELECTRONICS, INC. AND SUBSIDIARIES
NOTES TO CONSOLIDATED FINANCIAL STATEMENTS (Continued)
(Dollar amounts in thousands, except number of shares and per share data)
F-8
1. Significant Accounting Policies - Continued
Long-Lived Assets. In accordance with Statement of Financial Accounting Standards (“SFAS”) No. 144, “Accounting for the Impairment or Disposal of Long-Lived Assets,” we continually evaluate whether events and circumstances have occurred which indicate that the remaining estimated useful lives of our intangible assets, excluding goodwill, and other long-lived assets, may warrant revision or that the remaining balance of such assets may not be recoverable. In the event that the undiscounted cash flows resulting from the use of the asset group is less than the carrying amount, an impairment loss equal to the excess of the asset’s carrying amount over its fair value is recorded.
In accordance with SFAS No. 144, “Accounting for the Impairment or Disposal of Long-Lived Assets”, we record impairment losses on long-lived assets used in operations when events and circumstances indicate that long-lived assets might be impaired and the undiscounted cash flows estimated to be generated by those assets are less than the carrying amounts of those assets. During fiscal 2009, based on our future estimates of the undiscounted cash flows, it was determined that certain identifiable intangible assets of our TouchSensor and Hetronic businesses in the Interconnect segment, the Automotive Safety Technologies business in our Automotive segment and Magna-Lastic Devices, Inc from our Other segment were impaired. Therefore, we recorded an impairment charge of $26.2 million in the Interconnect segment, $4.6 million in the Automotive segment and $0.4 million in the Other segment for a total of $31.2 million for these assets.
Goodwill and Intangibles. Costs assigned to the fair value of intangible assets acquired with finite lives are being amortized over periods ranging from 3 to 20 years, generally on a straight-line basis or accelerated basis, depending on the nature of the intangible asset. The fair value of certain intangible assets is being amortized over projected revenues used to initially value such intangible assets. Goodwill represents the excess of purchase price over the estimated fair value of net assets of acquired companies, which has not been allocated to other intangible assets.
The Company evaluates goodwill for impairment at the reporting unit level, which is one level below the operating segment level (herein referred to as the reporting unit). The impairment test for goodwill is a two-step process. The first step is to identify when goodwill impairment has occurred by comparing the fair value of a reporting unit with its carrying amount, including goodwill. If the fair value of a reporting unit exceeds its carrying amount, goodwill of the reporting unit is not considered impaired. If the carrying amount of the reporting unit exceeds its fair value, the second step of the goodwill test is performed to measure the amount of the impairment loss, if any. In this second step, the implied fair value of the reporting unit’s goodwill is compared with the carrying amount of the goodwill. If the carrying amount of the reporting unit’s goodwill exceeds the implied fair value of that goodwill, an impairment loss is recognized in an amount equal to that excess, not to exceed the carrying amount of the goodwill. Based on events and general business declines, we performed “step one” of the goodwill impairment test in accordance with paragraph 19 of SFAS No. 142, “Goodwill and Other Intangible Assets”, on the reporting units that have goodwill during fiscal 2009. Based on this test, we determined that the fair value was less than the carrying value of the net assets for certain reporting units. We completed “step two” of the goodwill test and concluded that goodwill was impaired. During fiscal 2009, we recorded a goodwill impairment charge of $25,840 in our Automotive segment, $30,750 in our Interconnect segment, $5,358 in our Power Products segment and $1,203 in our Other segment for a total of $63,151 related to these assets.
Research and Development Costs. Costs associated with the development of new products are charged to expense when incurred. Research and development costs for the fiscal years ended May 2, 2009, May 3, 2008 and April 28, 2007 amounted to $21,995, $25,595 and $21,336, respectively.
Stock-Based Compensation. See Note 5, Shareholders’ Equity for a description of our stock-based compensation plans. In the first quarter of fiscal 2007, we adopted SFAS No. 123(R), “Share Based Payments,” which revises SFAS No. 123, “Accounting for Stock Based Compensation.” SFAS No. 123(R) requires us to record compensation expense for all share-based payments, including employee stock options, at fair value.
Use of Estimates. The preparation of financial statements in conformity with accounting principles
10k.indd 9 7/16/09 1:18:31 PM

F-10 F-11
METHODE ELECTRONICS, INC. AND SUBSIDIARIES
NOTES TO CONSOLIDATED FINANCIAL STATEMENTS (Continued)
(Dollar amounts in thousands, except number of shares and per share data)
F-11
2. Restructurings
March 2009 Restructuring
On March 12, 2009, we announced several additional restructuring actions to further reduce our exposure to the North American automotive industry and to consolidate manufacturing facilities in lower cost regions to reduce costs. After these actions our principal manufacturing operations will be in Mexico, Malta and China. In addition, we have decided to transfer certain new GM business to other suppliers. This business was scheduled to be produced in our Shanghai, China automotive facility.
All Ford Motor Company production at Methode's Reynosa, Mexico, facility will be moved to another supplier. TouchSensor manufacturing currently in west suburban Chicago, Illinois, will be moved to Monterrey, Mexico. Additionally, our operations in Shanghai, China, will be consolidated to two facilities from three.
In total, this additional restructuring will affect approximately 850 employees worldwide. We estimate that we will record a pre-tax charge between $16,000 and $25,000, during fiscal years 2009 and 2010. The cash portion of this charge is estimated between $7,000 and $8,000.
During the fiscal year ended May 2, 2009, we recorded a restructuring charge of $7,263, which consisted of $100 for employee severance, $1,373 in impairment for buildings and improvements and machinery and equipment, $5,418 for impairment of customer funded tooling and $133 in forfeited security deposits related to the transfer of the new GM business and $239 relating to professional fees. We estimate that we will record pre-tax restructuring charges in fiscal 2010 between $8,700 and $17,700.
As of May 2, 2009, we had an accrued restructuring liability of $141 reflected in the current liabilities section of our consolidated balance sheet. We expect this liability to be paid out during fiscal 2010.
The table below reflects the activity related to the March 2009 restructuring as of May 2, 2009:
One-TimeEmployee Asset OtherSeverance Write-Downs Costs Total
Accrued balance at May 3, 2008 -$ -$ -$ -$FY 2009 restructuring charges 100 6,924 239 7,263Payments and asset write-downs - (6,924) (198) (7,122)Accrued balance at May 2, 2009 100$ -$ 41$ 141$
January 2008 Restructuring
On January 24, 2008, we announced a restructuring of our U.S.-based automotive operations and a decision to discontinue producing certain legacy products in the Interconnect segment. The Automotive and Interconnect restructuring is expected to be completed during fiscal 2010. We record the expense in the restructuring section of our Consolidated Statement of Operations. On January 24, 2008, the total pre-tax charges were estimated between $19,000 and $25,000. As of May 2, 2009, we have recorded $23,174 of the charges. We estimate that we will record pre-tax restructuring charges in fiscal 2010 between $500 and $1,500, of which $500 will relate to the termination of approximately 225 employees and the cost of one-time employee benefits, retention, COBRA and outplacement services. We continue to perform periodic impairment testing, if indicators exist, and will record any charges incurred as per SFAS No. 144, ”Accounting for the Impairment or Disposal of Long-Lived Assets”, (“SFAS No. 144”) in the period when impairment is incurred.
During the fiscal year ended May 3, 2008, we recorded a restructuring charge of $5,159, which consisted of
METHODE ELECTRONICS, INC. AND SUBSIDIARIES
NOTES TO CONSOLIDATED FINANCIAL STATEMENTS (Continued)
(Dollar amounts in thousands, except number of shares and per share data)
F-10
1. Significant Accounting Policies - Continued
In December 2007, the FASB issued SFAS No. 160, “Non-Controlling Interests in Consolidated Financial Statements, an amendment of ARB No. 51” (“SFAS No. 160”). SFAS No. 160 establishes new standards for the accounting for and reporting of non-controlling interests (formerly minority interests) and for the loss of control of partially owned and consolidated subsidiaries. SFAS No. 160 does not change the criteria for consolidating a partially owned entity. SFAS No. 160 is effective for fiscal years beginning after December 15, 2008, which is our fiscal year 2010 that began May 3, 2009. The provisions of SFAS No. 160 will be applied prospectively upon adoption except for the presentation and disclosure requirements, which will be applied retrospectively. We do not expect the adoption of SFAS No. 160 to have a material impact on our Consolidated Financial Statements.
In March 2008, the FASB issued SFAS No. 161, “Disclosures about Derivative Instruments and Hedging Activities, an amendment of SFAS No. 133” (“SFAS No. 161”). SFAS No. 161 requires enhanced disclosures about an entity’s derivative and hedging activities and is effective for fiscal years and interim periods beginning after November 15, 2008, which is our fiscal year 2010 that began May 3, 2009. We do not believe the adoption of SFAS No. 161 will have a material impact on our Consolidated Financial Statements.
In April 2008, the FASB issued FASB Staff Position No. FAS 142-3, “Determination of the Useful Life of Intangible Assets” (“FSP 142-3”). FSP 142-3 amends the factors that should be considered in developing renewal or extension assumptions used to determine the useful life of a recognized intangible asset under FASB Statement No. 142, “Goodwill and Other Intangible Assets.” The provision of FSP 142-3 will be effective for financial statements issued for fiscal years beginning after December 15, 2008, which is our fiscal year 2010 that began May 3, 2009. Since this guidance will be applied prospectively, upon adoption, there will be no impact to our financial position, results of operations or cash flows.
In May 2008, the FASB issued SFAS No. 162, “The Hierarchy of Generally Accepted Accounting Principles” (“SFAS No 162”). SFAS No. 162 identifies the sources of accounting principles and the framework for selecting the principles to be used in the preparation of financial statements. SFAS No. 162 is effective 60 days following the SEC’s approval of the Public Company Accounting Oversight Board (“PCAOB”) amendments to AU Section 411, "The Meaning of ‘Present Fairly in Conformity With Generally Accepted Accounting Principles ". We do not believe the adoption of this standard will have a material impact on our Consolidated Financial Statements.
In April 2009, the Financial Accounting Standards Board (FASB) issued three FSPs related to fair value measurements. The first, FSP FAS 157-4, Determining Fair Value When the Volume and Level of Activity for the Asset or Liability Have Significantly Decreased and Identifying Transactions That Are Not Orderly, provides guidance on determining whether a market is inactive and whether transactions in that market are distressed. The second FSP issued, FSP FAS 115-2, FAS 124-2, and EITF 99-20-2, Recognition and Presentation of Other-Than-Temporary Impairments, provides guidance on how to assess whether an asset has experienced an other-than-temporary impairment and, if so, where the impairment should be recorded in the financial statements. The third FSP issued, FSP FAS 107-1 and APB 28-1, Interim Disclosures About Fair Value of Financial Instruments, requires that disclosures currently required under SFAS No. 107, Disclosures about Fair Value of Financial Instruments, be presented for interim periods as well as annual periods. These FSPs are first effective for interim periods ending after June 15, 2009 and are not expected to have a material impact on our Consolidated Financial Statements.
In June 2008, the FASB issued EITF Issue No. 03-6-1, “Determining Whether Instruments Granted in Share-Based Payment Transactions Are Participating Securities”; (“EITF 03-6-1”). EITF 03-6-1 addresses whether instruments granted in share-based payment transactions are participating securities prior to vesting and, therefore, need to be included in the earnings allocation in computing earnings per share (EPS) under the two-class method described in paragraphs 60 and 61 of FASB No. 128, “Earnings per Share”. EITF 03-6-1 is effective for fiscal years beginning after December 15, 2008 and is to be applied retrospectively. The adoption of EITF 03-6-1 is not expected to have a material impact on the Company's consolidated financial position and results of operations.
10k.indd 10 7/16/09 1:18:32 PM

F-10 F-11
METHODE ELECTRONICS, INC. AND SUBSIDIARIES
NOTES TO CONSOLIDATED FINANCIAL STATEMENTS (Continued)
(Dollar amounts in thousands, except number of shares and per share data)
F-11
2. Restructurings
March 2009 Restructuring
On March 12, 2009, we announced several additional restructuring actions to further reduce our exposure to the North American automotive industry and to consolidate manufacturing facilities in lower cost regions to reduce costs. After these actions our principal manufacturing operations will be in Mexico, Malta and China. In addition, we have decided to transfer certain new GM business to other suppliers. This business was scheduled to be produced in our Shanghai, China automotive facility.
All Ford Motor Company production at Methode's Reynosa, Mexico, facility will be moved to another supplier. TouchSensor manufacturing currently in west suburban Chicago, Illinois, will be moved to Monterrey, Mexico. Additionally, our operations in Shanghai, China, will be consolidated to two facilities from three.
In total, this additional restructuring will affect approximately 850 employees worldwide. We estimate that we will record a pre-tax charge between $16,000 and $25,000, during fiscal years 2009 and 2010. The cash portion of this charge is estimated between $7,000 and $8,000.
During the fiscal year ended May 2, 2009, we recorded a restructuring charge of $7,263, which consisted of $100 for employee severance, $1,373 in impairment for buildings and improvements and machinery and equipment, $5,418 for impairment of customer funded tooling and $133 in forfeited security deposits related to the transfer of the new GM business and $239 relating to professional fees. We estimate that we will record pre-tax restructuring charges in fiscal 2010 between $8,700 and $17,700.
As of May 2, 2009, we had an accrued restructuring liability of $141 reflected in the current liabilities section of our consolidated balance sheet. We expect this liability to be paid out during fiscal 2010.
The table below reflects the activity related to the March 2009 restructuring as of May 2, 2009:
One-TimeEmployee Asset OtherSeverance Write-Downs Costs Total
Accrued balance at May 3, 2008 -$ -$ -$ -$FY 2009 restructuring charges 100 6,924 239 7,263Payments and asset write-downs - (6,924) (198) (7,122)Accrued balance at May 2, 2009 100$ -$ 41$ 141$
January 2008 Restructuring
On January 24, 2008, we announced a restructuring of our U.S.-based automotive operations and a decision to discontinue producing certain legacy products in the Interconnect segment. The Automotive and Interconnect restructuring is expected to be completed during fiscal 2010. We record the expense in the restructuring section of our Consolidated Statement of Operations. On January 24, 2008, the total pre-tax charges were estimated between $19,000 and $25,000. As of May 2, 2009, we have recorded $23,174 of the charges. We estimate that we will record pre-tax restructuring charges in fiscal 2010 between $500 and $1,500, of which $500 will relate to the termination of approximately 225 employees and the cost of one-time employee benefits, retention, COBRA and outplacement services. We continue to perform periodic impairment testing, if indicators exist, and will record any charges incurred as per SFAS No. 144, ”Accounting for the Impairment or Disposal of Long-Lived Assets”, (“SFAS No. 144”) in the period when impairment is incurred.
During the fiscal year ended May 3, 2008, we recorded a restructuring charge of $5,159, which consisted of
METHODE ELECTRONICS, INC. AND SUBSIDIARIES
NOTES TO CONSOLIDATED FINANCIAL STATEMENTS (Continued)
(Dollar amounts in thousands, except number of shares and per share data)
F-10
1. Significant Accounting Policies - Continued
In December 2007, the FASB issued SFAS No. 160, “Non-Controlling Interests in Consolidated Financial Statements, an amendment of ARB No. 51” (“SFAS No. 160”). SFAS No. 160 establishes new standards for the accounting for and reporting of non-controlling interests (formerly minority interests) and for the loss of control of partially owned and consolidated subsidiaries. SFAS No. 160 does not change the criteria for consolidating a partially owned entity. SFAS No. 160 is effective for fiscal years beginning after December 15, 2008, which is our fiscal year 2010 that began May 3, 2009. The provisions of SFAS No. 160 will be applied prospectively upon adoption except for the presentation and disclosure requirements, which will be applied retrospectively. We do not expect the adoption of SFAS No. 160 to have a material impact on our Consolidated Financial Statements.
In March 2008, the FASB issued SFAS No. 161, “Disclosures about Derivative Instruments and Hedging Activities, an amendment of SFAS No. 133” (“SFAS No. 161”). SFAS No. 161 requires enhanced disclosures about an entity’s derivative and hedging activities and is effective for fiscal years and interim periods beginning after November 15, 2008, which is our fiscal year 2010 that began May 3, 2009. We do not believe the adoption of SFAS No. 161 will have a material impact on our Consolidated Financial Statements.
In April 2008, the FASB issued FASB Staff Position No. FAS 142-3, “Determination of the Useful Life of Intangible Assets” (“FSP 142-3”). FSP 142-3 amends the factors that should be considered in developing renewal or extension assumptions used to determine the useful life of a recognized intangible asset under FASB Statement No. 142, “Goodwill and Other Intangible Assets.” The provision of FSP 142-3 will be effective for financial statements issued for fiscal years beginning after December 15, 2008, which is our fiscal year 2010 that began May 3, 2009. Since this guidance will be applied prospectively, upon adoption, there will be no impact to our financial position, results of operations or cash flows.
In May 2008, the FASB issued SFAS No. 162, “The Hierarchy of Generally Accepted Accounting Principles” (“SFAS No 162”). SFAS No. 162 identifies the sources of accounting principles and the framework for selecting the principles to be used in the preparation of financial statements. SFAS No. 162 is effective 60 days following the SEC’s approval of the Public Company Accounting Oversight Board (“PCAOB”) amendments to AU Section 411, "The Meaning of ‘Present Fairly in Conformity With Generally Accepted Accounting Principles ". We do not believe the adoption of this standard will have a material impact on our Consolidated Financial Statements.
In April 2009, the Financial Accounting Standards Board (FASB) issued three FSPs related to fair value measurements. The first, FSP FAS 157-4, Determining Fair Value When the Volume and Level of Activity for the Asset or Liability Have Significantly Decreased and Identifying Transactions That Are Not Orderly, provides guidance on determining whether a market is inactive and whether transactions in that market are distressed. The second FSP issued, FSP FAS 115-2, FAS 124-2, and EITF 99-20-2, Recognition and Presentation of Other-Than-Temporary Impairments, provides guidance on how to assess whether an asset has experienced an other-than-temporary impairment and, if so, where the impairment should be recorded in the financial statements. The third FSP issued, FSP FAS 107-1 and APB 28-1, Interim Disclosures About Fair Value of Financial Instruments, requires that disclosures currently required under SFAS No. 107, Disclosures about Fair Value of Financial Instruments, be presented for interim periods as well as annual periods. These FSPs are first effective for interim periods ending after June 15, 2009 and are not expected to have a material impact on our Consolidated Financial Statements.
In June 2008, the FASB issued EITF Issue No. 03-6-1, “Determining Whether Instruments Granted in Share-Based Payment Transactions Are Participating Securities”; (“EITF 03-6-1”). EITF 03-6-1 addresses whether instruments granted in share-based payment transactions are participating securities prior to vesting and, therefore, need to be included in the earnings allocation in computing earnings per share (EPS) under the two-class method described in paragraphs 60 and 61 of FASB No. 128, “Earnings per Share”. EITF 03-6-1 is effective for fiscal years beginning after December 15, 2008 and is to be applied retrospectively. The adoption of EITF 03-6-1 is not expected to have a material impact on the Company's consolidated financial position and results of operations.
10k.indd 11 7/16/09 1:18:33 PM
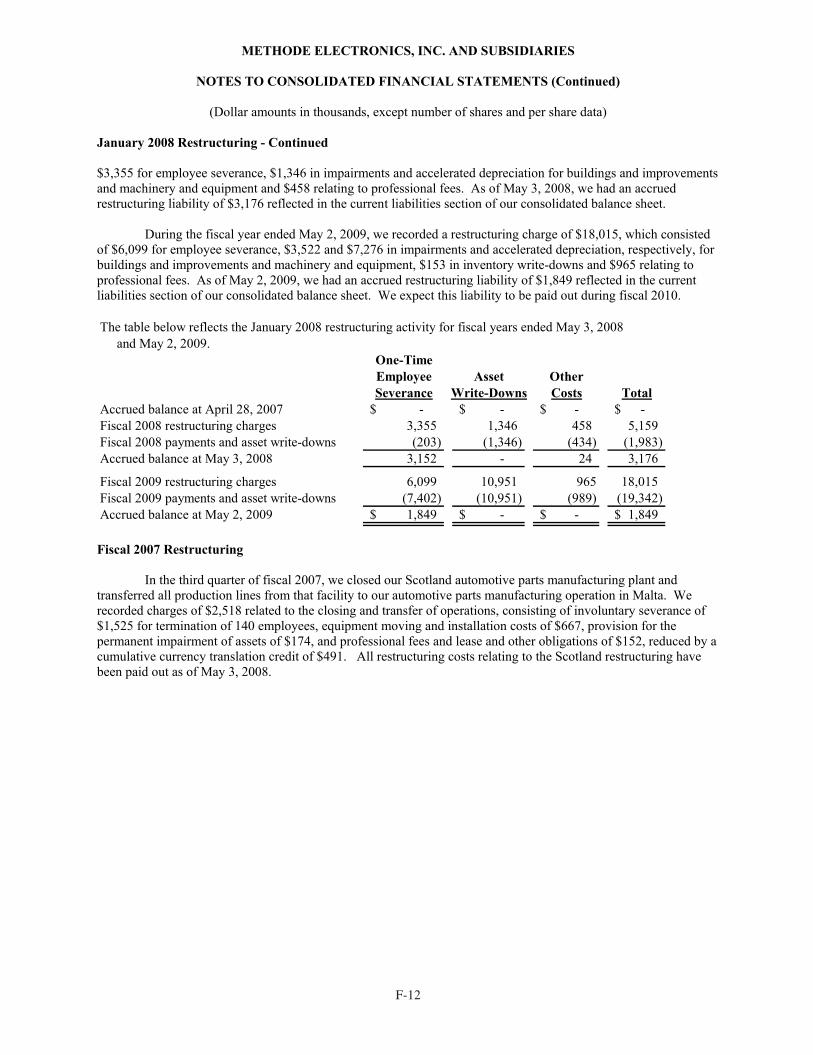
F-12 F-13
METHODE ELECTRONICS, INC. AND SUBSIDIARIES
NOTES TO CONSOLIDATED FINANCIAL STATEMENTS (Continued)
(Dollar amounts in thousands, except number of shares and per share data)
F-13
3. Acquisitions
Fiscal 2009 Acquisitions
On September 30, 2008, we acquired certain assets of Hetronic LLC (Hetronic) for $53,639 in cash. We also incurred $2,447 in transaction costs related to the purchase. Hetronic is a global leader in industrial safety radio remote controls with locations in the U.S., Malta, the Philippines and Germany. Hetronic is represented in 45 countries by direct sales associates, licensed partners, distributors and representatives. Hetronic provides application specific and standard controls to many different industries, such as material handling, transportation, mining, military, agriculture and construction.
Based on a third-party valuation report, the tangible net assets acquired had a fair value of $20,533. The fair values assigned to intangible assets acquired were $12,170 for customer relationships, $2,700 for the trade name and trademarks, $1,450 for technology valuation, and $170 for non-competes, resulting in $19,063 of goodwill. The customer relationships, technology valuation and non-competes are being amortized over 5 to approximately 12 years. The trade name and trademarks are not subject to amortization but are subject to periodic impairment testing. The accounts and transactions of Hetronic have been included in the Interconnect segment in the consolidated financial statements from the effective date of the acquisition.
Fiscal 2008 Acquisitions
On August 31, 2007, we acquired 100% of the assets of Value Engineered Products, Inc. (VEP) for $5,750 in cash. We also incurred $79 in transaction costs related to the purchase. VEP is a thermal management solutions provider, manufacturing heat sinks and related products for high-powered applications. These components complement our Power Product offerings and, in some instances, are joined with bus bars to aid thermal management of power systems. The terms of the acquisition provide for an additional payment of up to a maximum of $1,000 if sales reach specified targets during the twelve-month period following the closing. The final payout was $758 and was recorded in the second quarter of fiscal 2009.
Based on a third-party valuation report, the tangible net assets acquired in the VEP transaction had a fair value of $915. The fair values assigned to intangible assets acquired were $2,900 for customer relationships and $600 for trademarks, resulting in $2,172 of goodwill. The customer relationships acquired are being amortized over a period of approximately 16 years, which began in September 2007. The trademark intangible assets are not subject to amortization but are subject to periodic impairment testing. The accounts and transactions of the acquired business have been included in the Power Products segment in the consolidated financial statements from the effective date of the acquisition.
On March 30, 2008, we acquired 100% of the assets of Tribotek, Inc for $1,750 in cash. We also incurred $61 in transaction costs related to the purchase. Tribotek designs, develops and manufactures high current power connectors and power product systems for products such as power supplies, servers, rectifiers, inverters, robotics and automated test equipment, in addition to various military and telecommunication applications.
The tangible net assets acquired in the Tribotek transaction had a fair value of $1,445. The fair values assigned to intangible assets acquired were $366 for patents that are being amortized over a period of approximately 18 years beginning March 2008. There was no goodwill recorded for this acquisition. The accounts and transactions of the acquired business have been included in the Power Products segment in the consolidated financial statements from the effective date of the acquisition.
Fiscal 2007 Acquisition
As of March 1, 2007, we acquired 100% of the member interest of TouchSensor Technologies, LLC from Gemtron Corporation for $58,474 in cash and assumed liabilities of $7,061. We also incurred $2,239 in transaction costs related to the purchase. TouchSensor is a North American market leader in solid-state, field-effect switching. Using its patented technology, TouchSensor designs and manufactures touch-sensitive user interface panels found
METHODE ELECTRONICS, INC. AND SUBSIDIARIES
NOTES TO CONSOLIDATED FINANCIAL STATEMENTS (Continued)
(Dollar amounts in thousands, except number of shares and per share data)
F-12
January 2008 Restructuring - Continued
$3,355 for employee severance, $1,346 in impairments and accelerated depreciation for buildings and improvements and machinery and equipment and $458 relating to professional fees. As of May 3, 2008, we had an accrued restructuring liability of $3,176 reflected in the current liabilities section of our consolidated balance sheet.
During the fiscal year ended May 2, 2009, we recorded a restructuring charge of $18,015, which consisted of $6,099 for employee severance, $3,522 and $7,276 in impairments and accelerated depreciation, respectively, for buildings and improvements and machinery and equipment, $153 in inventory write-downs and $965 relating to professional fees. As of May 2, 2009, we had an accrued restructuring liability of $1,849 reflected in the current liabilities section of our consolidated balance sheet. We expect this liability to be paid out during fiscal 2010.
The table below reflects the January 2008 restructuring activity for fiscal years ended May 3, 2008 and May 2, 2009.
One-TimeEmployee Asset OtherSeverance Write-Downs Costs Total
Accrued balance at April 28, 2007 -$ -$ -$ -$Fiscal 2008 restructuring charges 3,355 1,346 458 5,159Fiscal 2008 payments and asset write-downs (203) (1,346) (434) (1,983)Accrued balance at May 3, 2008 3,152 - 24 3,176
Fiscal 2009 restructuring charges 6,099 10,951 965 18,015Fiscal 2009 payments and asset write-downs (7,402) (10,951) (989) (19,342)Accrued balance at May 2, 2009 1,849$ -$ -$ 1,849$
Fiscal 2007 Restructuring
In the third quarter of fiscal 2007, we closed our Scotland automotive parts manufacturing plant and transferred all production lines from that facility to our automotive parts manufacturing operation in Malta. We recorded charges of $2,518 related to the closing and transfer of operations, consisting of involuntary severance of $1,525 for termination of 140 employees, equipment moving and installation costs of $667, provision for the permanent impairment of assets of $174, and professional fees and lease and other obligations of $152, reduced by a cumulative currency translation credit of $491. All restructuring costs relating to the Scotland restructuring have been paid out as of May 3, 2008.
10k.indd 12 7/16/09 1:18:33 PM

F-12 F-13
METHODE ELECTRONICS, INC. AND SUBSIDIARIES
NOTES TO CONSOLIDATED FINANCIAL STATEMENTS (Continued)
(Dollar amounts in thousands, except number of shares and per share data)
F-13
3. Acquisitions
Fiscal 2009 Acquisitions
On September 30, 2008, we acquired certain assets of Hetronic LLC (Hetronic) for $53,639 in cash. We also incurred $2,447 in transaction costs related to the purchase. Hetronic is a global leader in industrial safety radio remote controls with locations in the U.S., Malta, the Philippines and Germany. Hetronic is represented in 45 countries by direct sales associates, licensed partners, distributors and representatives. Hetronic provides application specific and standard controls to many different industries, such as material handling, transportation, mining, military, agriculture and construction.
Based on a third-party valuation report, the tangible net assets acquired had a fair value of $20,533. The fair values assigned to intangible assets acquired were $12,170 for customer relationships, $2,700 for the trade name and trademarks, $1,450 for technology valuation, and $170 for non-competes, resulting in $19,063 of goodwill. The customer relationships, technology valuation and non-competes are being amortized over 5 to approximately 12 years. The trade name and trademarks are not subject to amortization but are subject to periodic impairment testing. The accounts and transactions of Hetronic have been included in the Interconnect segment in the consolidated financial statements from the effective date of the acquisition.
Fiscal 2008 Acquisitions
On August 31, 2007, we acquired 100% of the assets of Value Engineered Products, Inc. (VEP) for $5,750 in cash. We also incurred $79 in transaction costs related to the purchase. VEP is a thermal management solutions provider, manufacturing heat sinks and related products for high-powered applications. These components complement our Power Product offerings and, in some instances, are joined with bus bars to aid thermal management of power systems. The terms of the acquisition provide for an additional payment of up to a maximum of $1,000 if sales reach specified targets during the twelve-month period following the closing. The final payout was $758 and was recorded in the second quarter of fiscal 2009.
Based on a third-party valuation report, the tangible net assets acquired in the VEP transaction had a fair value of $915. The fair values assigned to intangible assets acquired were $2,900 for customer relationships and $600 for trademarks, resulting in $2,172 of goodwill. The customer relationships acquired are being amortized over a period of approximately 16 years, which began in September 2007. The trademark intangible assets are not subject to amortization but are subject to periodic impairment testing. The accounts and transactions of the acquired business have been included in the Power Products segment in the consolidated financial statements from the effective date of the acquisition.
On March 30, 2008, we acquired 100% of the assets of Tribotek, Inc for $1,750 in cash. We also incurred $61 in transaction costs related to the purchase. Tribotek designs, develops and manufactures high current power connectors and power product systems for products such as power supplies, servers, rectifiers, inverters, robotics and automated test equipment, in addition to various military and telecommunication applications.
The tangible net assets acquired in the Tribotek transaction had a fair value of $1,445. The fair values assigned to intangible assets acquired were $366 for patents that are being amortized over a period of approximately 18 years beginning March 2008. There was no goodwill recorded for this acquisition. The accounts and transactions of the acquired business have been included in the Power Products segment in the consolidated financial statements from the effective date of the acquisition.
Fiscal 2007 Acquisition
As of March 1, 2007, we acquired 100% of the member interest of TouchSensor Technologies, LLC from Gemtron Corporation for $58,474 in cash and assumed liabilities of $7,061. We also incurred $2,239 in transaction costs related to the purchase. TouchSensor is a North American market leader in solid-state, field-effect switching. Using its patented technology, TouchSensor designs and manufactures touch-sensitive user interface panels found
METHODE ELECTRONICS, INC. AND SUBSIDIARIES
NOTES TO CONSOLIDATED FINANCIAL STATEMENTS (Continued)
(Dollar amounts in thousands, except number of shares and per share data)
F-12
January 2008 Restructuring - Continued
$3,355 for employee severance, $1,346 in impairments and accelerated depreciation for buildings and improvements and machinery and equipment and $458 relating to professional fees. As of May 3, 2008, we had an accrued restructuring liability of $3,176 reflected in the current liabilities section of our consolidated balance sheet.
During the fiscal year ended May 2, 2009, we recorded a restructuring charge of $18,015, which consisted of $6,099 for employee severance, $3,522 and $7,276 in impairments and accelerated depreciation, respectively, for buildings and improvements and machinery and equipment, $153 in inventory write-downs and $965 relating to professional fees. As of May 2, 2009, we had an accrued restructuring liability of $1,849 reflected in the current liabilities section of our consolidated balance sheet. We expect this liability to be paid out during fiscal 2010.
The table below reflects the January 2008 restructuring activity for fiscal years ended May 3, 2008 and May 2, 2009.
One-TimeEmployee Asset OtherSeverance Write-Downs Costs Total
Accrued balance at April 28, 2007 -$ -$ -$ -$Fiscal 2008 restructuring charges 3,355 1,346 458 5,159Fiscal 2008 payments and asset write-downs (203) (1,346) (434) (1,983)Accrued balance at May 3, 2008 3,152 - 24 3,176
Fiscal 2009 restructuring charges 6,099 10,951 965 18,015Fiscal 2009 payments and asset write-downs (7,402) (10,951) (989) (19,342)Accrued balance at May 2, 2009 1,849$ -$ -$ 1,849$
Fiscal 2007 Restructuring
In the third quarter of fiscal 2007, we closed our Scotland automotive parts manufacturing plant and transferred all production lines from that facility to our automotive parts manufacturing operation in Malta. We recorded charges of $2,518 related to the closing and transfer of operations, consisting of involuntary severance of $1,525 for termination of 140 employees, equipment moving and installation costs of $667, provision for the permanent impairment of assets of $174, and professional fees and lease and other obligations of $152, reduced by a cumulative currency translation credit of $491. All restructuring costs relating to the Scotland restructuring have been paid out as of May 3, 2008.
10k.indd 13 7/16/09 1:18:34 PM
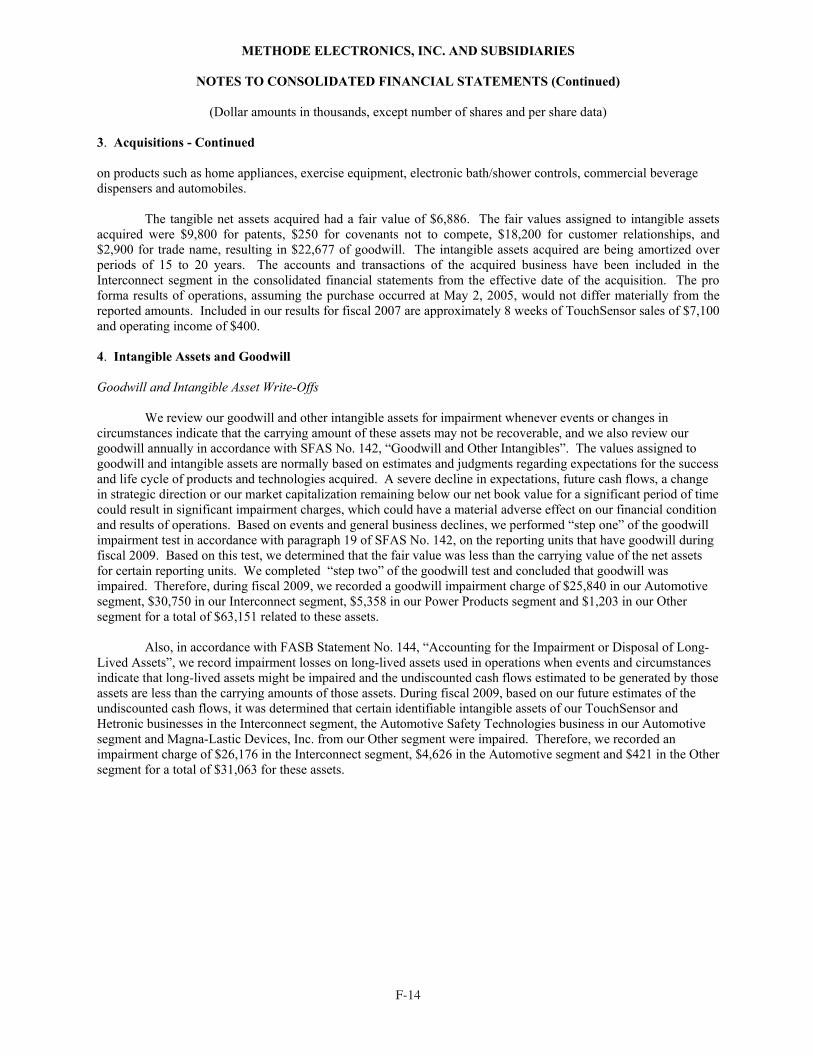
F-14 F-15
METHODE ELECTRONICS, INC. AND SUBSIDIARIES
NOTES TO CONSOLIDATED FINANCIAL STATEMENTS (Continued)
(Dollar amounts in thousands, except number of shares and per share data)
F-15
4. Intangible Assets and Goodwill - Continued
The following table presents details of the goodwill and other asset impairments during fiscal 2009:
IntangibleSegment Reporting Unit Goodwill Assets Total
Automotive Methode Electronics Malta Ltd. 16,987$ 160$ 17,147$Automotive Safety Technologies, Inc. 8,853 4,466 13,319Subtotal Automotive 25,840 4,626 30,466
Interconnect Hetronic 19,063 11,587 30,650TouchSensor Technologies 11,528 14,589 26,117Methode Development Company 159 - 159Subtotal Interconnect 30,750 26,176 56,926
Power Products Cableco Technologies, Inc. 3,186 - 3,186Value Engineered Products, Inc. 2,172 - 2,172Subtotal Power Products 5,358 - 5,358
Other Magna-Lastic Devices, Inc. 933 421 1,354Trace Laboratories 270 - 270Subtotal Other 1,203 421 1,624
Total 63,151$ 31,223$ 94,374$
METHODE ELECTRONICS, INC. AND SUBSIDIARIES
NOTES TO CONSOLIDATED FINANCIAL STATEMENTS (Continued)
(Dollar amounts in thousands, except number of shares and per share data)
F-14
3. Acquisitions - Continued
on products such as home appliances, exercise equipment, electronic bath/shower controls, commercial beverage dispensers and automobiles.
The tangible net assets acquired had a fair value of $6,886. The fair values assigned to intangible assets acquired were $9,800 for patents, $250 for covenants not to compete, $18,200 for customer relationships, and $2,900 for trade name, resulting in $22,677 of goodwill. The intangible assets acquired are being amortized over periods of 15 to 20 years. The accounts and transactions of the acquired business have been included in the Interconnect segment in the consolidated financial statements from the effective date of the acquisition. The pro forma results of operations, assuming the purchase occurred at May 2, 2005, would not differ materially from the reported amounts. Included in our results for fiscal 2007 are approximately 8 weeks of TouchSensor sales of $7,100 and operating income of $400.
4. Intangible Assets and Goodwill
Goodwill and Intangible Asset Write-Offs
We review our goodwill and other intangible assets for impairment whenever events or changes in circumstances indicate that the carrying amount of these assets may not be recoverable, and we also review our goodwill annually in accordance with SFAS No. 142, “Goodwill and Other Intangibles”. The values assigned to goodwill and intangible assets are normally based on estimates and judgments regarding expectations for the success and life cycle of products and technologies acquired. A severe decline in expectations, future cash flows, a change in strategic direction or our market capitalization remaining below our net book value for a significant period of time could result in significant impairment charges, which could have a material adverse effect on our financial condition and results of operations. Based on events and general business declines, we performed “step one” of the goodwill impairment test in accordance with paragraph 19 of SFAS No. 142, on the reporting units that have goodwill during fiscal 2009. Based on this test, we determined that the fair value was less than the carrying value of the net assets for certain reporting units. We completed “step two” of the goodwill test and concluded that goodwill was impaired. Therefore, during fiscal 2009, we recorded a goodwill impairment charge of $25,840 in our Automotive segment, $30,750 in our Interconnect segment, $5,358 in our Power Products segment and $1,203 in our Other segment for a total of $63,151 related to these assets.
Also, in accordance with FASB Statement No. 144, “Accounting for the Impairment or Disposal of Long-Lived Assets”, we record impairment losses on long-lived assets used in operations when events and circumstances indicate that long-lived assets might be impaired and the undiscounted cash flows estimated to be generated by those assets are less than the carrying amounts of those assets. During fiscal 2009, based on our future estimates of the undiscounted cash flows, it was determined that certain identifiable intangible assets of our TouchSensor and Hetronic businesses in the Interconnect segment, the Automotive Safety Technologies business in our Automotive segment and Magna-Lastic Devices, Inc. from our Other segment were impaired. Therefore, we recorded an impairment charge of $26,176 in the Interconnect segment, $4,626 in the Automotive segment and $421 in the Other segment for a total of $31,063 for these assets.
10k.indd 14 7/16/09 1:18:35 PM
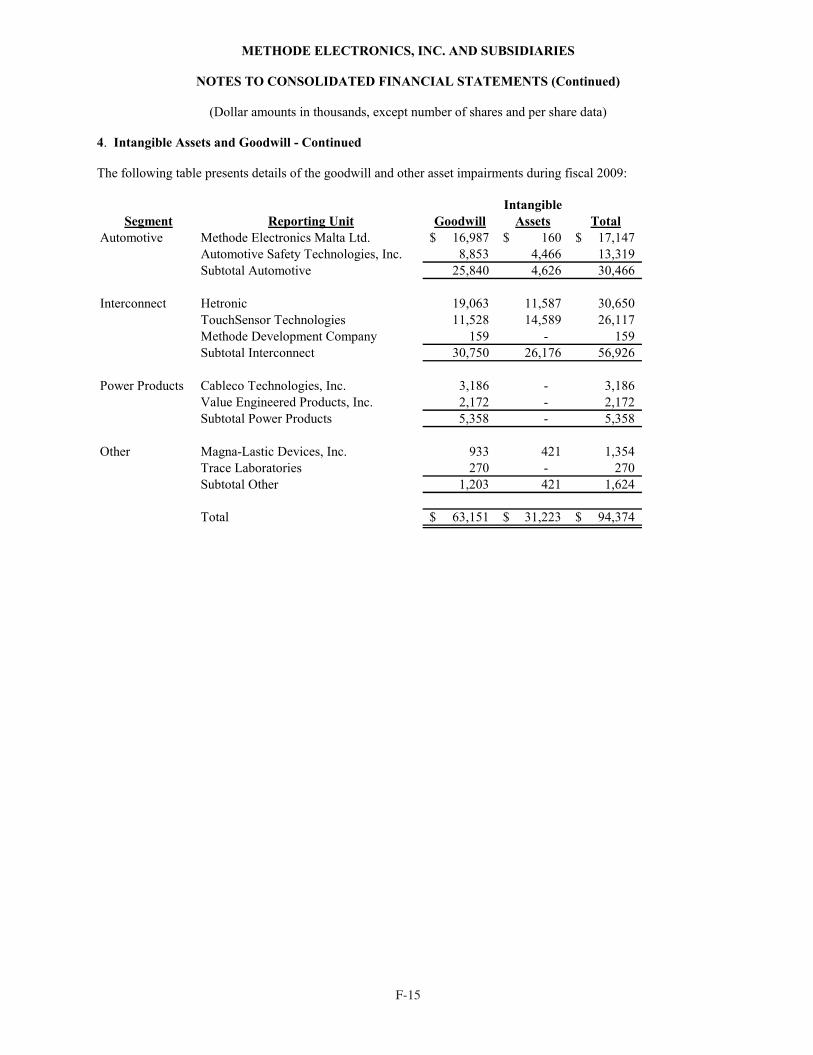
F-14 F-15
METHODE ELECTRONICS, INC. AND SUBSIDIARIES
NOTES TO CONSOLIDATED FINANCIAL STATEMENTS (Continued)
(Dollar amounts in thousands, except number of shares and per share data)
F-15
4. Intangible Assets and Goodwill - Continued
The following table presents details of the goodwill and other asset impairments during fiscal 2009:
IntangibleSegment Reporting Unit Goodwill Assets Total
Automotive Methode Electronics Malta Ltd. 16,987$ 160$ 17,147$Automotive Safety Technologies, Inc. 8,853 4,466 13,319Subtotal Automotive 25,840 4,626 30,466
Interconnect Hetronic 19,063 11,587 30,650TouchSensor Technologies 11,528 14,589 26,117Methode Development Company 159 - 159Subtotal Interconnect 30,750 26,176 56,926
Power Products Cableco Technologies, Inc. 3,186 - 3,186Value Engineered Products, Inc. 2,172 - 2,172Subtotal Power Products 5,358 - 5,358
Other Magna-Lastic Devices, Inc. 933 421 1,354Trace Laboratories 270 - 270Subtotal Other 1,203 421 1,624
Total 63,151$ 31,223$ 94,374$
METHODE ELECTRONICS, INC. AND SUBSIDIARIES
NOTES TO CONSOLIDATED FINANCIAL STATEMENTS (Continued)
(Dollar amounts in thousands, except number of shares and per share data)
F-14
3. Acquisitions - Continued
on products such as home appliances, exercise equipment, electronic bath/shower controls, commercial beverage dispensers and automobiles.
The tangible net assets acquired had a fair value of $6,886. The fair values assigned to intangible assets acquired were $9,800 for patents, $250 for covenants not to compete, $18,200 for customer relationships, and $2,900 for trade name, resulting in $22,677 of goodwill. The intangible assets acquired are being amortized over periods of 15 to 20 years. The accounts and transactions of the acquired business have been included in the Interconnect segment in the consolidated financial statements from the effective date of the acquisition. The pro forma results of operations, assuming the purchase occurred at May 2, 2005, would not differ materially from the reported amounts. Included in our results for fiscal 2007 are approximately 8 weeks of TouchSensor sales of $7,100 and operating income of $400.
4. Intangible Assets and Goodwill
Goodwill and Intangible Asset Write-Offs
We review our goodwill and other intangible assets for impairment whenever events or changes in circumstances indicate that the carrying amount of these assets may not be recoverable, and we also review our goodwill annually in accordance with SFAS No. 142, “Goodwill and Other Intangibles”. The values assigned to goodwill and intangible assets are normally based on estimates and judgments regarding expectations for the success and life cycle of products and technologies acquired. A severe decline in expectations, future cash flows, a change in strategic direction or our market capitalization remaining below our net book value for a significant period of time could result in significant impairment charges, which could have a material adverse effect on our financial condition and results of operations. Based on events and general business declines, we performed “step one” of the goodwill impairment test in accordance with paragraph 19 of SFAS No. 142, on the reporting units that have goodwill during fiscal 2009. Based on this test, we determined that the fair value was less than the carrying value of the net assets for certain reporting units. We completed “step two” of the goodwill test and concluded that goodwill was impaired. Therefore, during fiscal 2009, we recorded a goodwill impairment charge of $25,840 in our Automotive segment, $30,750 in our Interconnect segment, $5,358 in our Power Products segment and $1,203 in our Other segment for a total of $63,151 related to these assets.
Also, in accordance with FASB Statement No. 144, “Accounting for the Impairment or Disposal of Long-Lived Assets”, we record impairment losses on long-lived assets used in operations when events and circumstances indicate that long-lived assets might be impaired and the undiscounted cash flows estimated to be generated by those assets are less than the carrying amounts of those assets. During fiscal 2009, based on our future estimates of the undiscounted cash flows, it was determined that certain identifiable intangible assets of our TouchSensor and Hetronic businesses in the Interconnect segment, the Automotive Safety Technologies business in our Automotive segment and Magna-Lastic Devices, Inc. from our Other segment were impaired. Therefore, we recorded an impairment charge of $26,176 in the Interconnect segment, $4,626 in the Automotive segment and $421 in the Other segment for a total of $31,063 for these assets.
10k.indd 15 7/16/09 1:18:35 PM
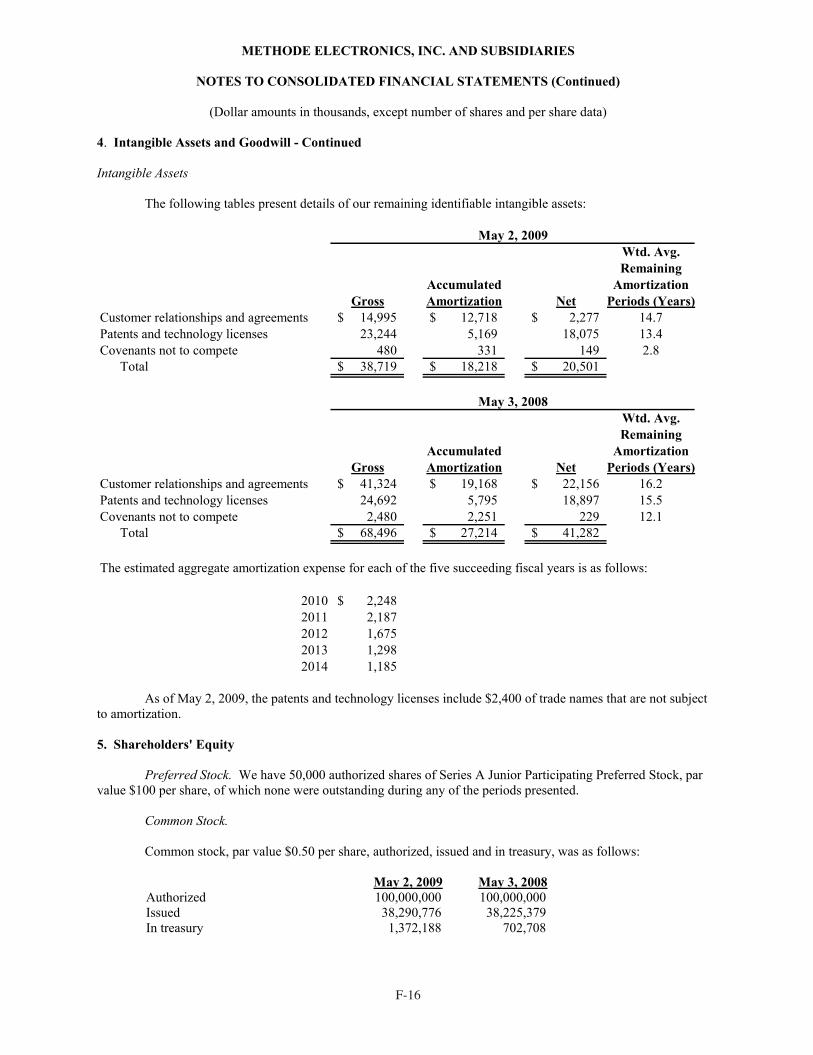
F-16 F-17
METHODE ELECTRONICS, INC. AND SUBSIDIARIES
NOTES TO CONSOLIDATED FINANCIAL STATEMENTS (Continued)
(Dollar amounts in thousands, except number of shares and per share data)
F-17
5. Shareholders' Equity - Continued
At May 2, 2009, 394,718 shares of common stock are reserved for future issuance in connection with our stock plans.
Shareholders’ Rights Agreement. On January 8, 2004, our Board of Directors declared a dividend of one preferred share purchase right (a "Right") for each share of common stock ("Common Shares") outstanding on January 18, 2004 to the stockholders of record on that date. Each Right entitles the registered holder to purchase from us one ten-thousandth of a share of our Series A Junior Participating Preferred Stock at an exercise price of $65.00 per one ten-thousandth of a preferred share, subject to adjustment.
The Rights, which are not detachable, will trade automatically with the Common Shares and will not be exercisable until it is announced that a person or group has become an "acquiring person" by acquiring 15% or more of the Common Shares, or a person or group commences a tender offer that will result in such person or group owning 15% or more of the Common Shares. Thereafter, separate right certificates will be distributed, and each right will entitle its holder to purchase for the exercise price, a fraction of a share of our Series A Junior Participating Preferred Stock having economic and voting terms similar to one share of common stock.
Upon announcement that any person or group has become an acquiring person, each Right will entitle all right-holders (other than the acquiring person) to purchase, for the exercise price, a number of shares of Common Shares having a market value of twice the exercise price. Right-holders would also be entitled to purchase the common stock of another entity having a value of twice the exercise price if, after a person has become an acquiring person, the Company were to enter into certain mergers or other transactions with such other entity. If any person becomes an acquiring person, the Company's Board of Directors may, at its option and subject to certain limitations, exchange one share of common stock for each Right.
The Rights may be redeemed by our Board of Directors for $0.01 per Right at any time prior to a person or group having become an acquiring person. The Rights will expire on January 8, 2014.
Dividends
We paid quarterly dividends totaling $9,778 during fiscal 2009. We intend to retain the remainder of our earnings not used for dividend payments to provide funds for the operation and expansion of our business. Our board of directors approved a stock repurchase plan in September 2008, which expires at the end of fiscal 2010. There were 669,480 shares purchased at an average price of $7.85 under the plan in fiscal 2009.
2007 Stock Plan
On June 21, 2007, our Board of Directors, on the recommendation of our Compensation Committee, adopted the Methode Electronics, Inc. 2007 Stock Plan (the “Stock Plan”). The Stock Plan was voted on and approved by the shareholders at our annual meeting on September 13, 2007. Upon adoption of the Stock Plan, our board of directors elected to terminate the 2004 Plan and the 2000 Plan with respect to the shares reserved under these plans that are not subject to outstanding awards.
The Stock Plan permits a total of 1,250,000 shares of our common stock to be awarded to participants. Shares issued under the Stock Plan may be either authorized but unissued shares, or treasury shares. If any award terminates, expires, is cancelled or forfeited as to any number of shares of common stock, new awards may be granted with respect to such shares. The total number of shares with respect to which awards may be granted to any participant in any calendar year shall not exceed 200,000 shares. As of May 2, 2009 there were 394,718 shares still available for award under the Stock Plan.
METHODE ELECTRONICS, INC. AND SUBSIDIARIES
NOTES TO CONSOLIDATED FINANCIAL STATEMENTS (Continued)
(Dollar amounts in thousands, except number of shares and per share data)
F-16
4. Intangible Assets and Goodwill - Continued
Intangible Assets
The following tables present details of our remaining identifiable intangible assets:
Wtd. Avg.Remaining
Accumulated AmortizationGross Amortization Net Periods (Years)
Customer relationships and agreements 14,995$ 12,718$ 2,277$ 14.7Patents and technology licenses 23,244 5,169 18,075 13.4Covenants not to compete 480 331 149 2.8 Total 38,719$ 18,218$ 20,501$
Wtd. Avg.Remaining
Accumulated AmortizationGross Amortization Net Periods (Years)
Customer relationships and agreements 41,324$ 19,168$ 22,156$ 16.2Patents and technology licenses 24,692 5,795 18,897 15.5Covenants not to compete 2,480 2,251 229 12.1 Total 68,496$ 27,214$ 41,282$
The estimated aggregate amortization expense for each of the five succeeding fiscal years is as follows:
2010 2,248$2011 2,1872012 1,6752013 1,2982014 1,185
May 2, 2009
May 3, 2008
As of May 2, 2009, the patents and technology licenses include $2,400 of trade names that are not subject to amortization.
5. Shareholders' Equity
Preferred Stock. We have 50,000 authorized shares of Series A Junior Participating Preferred Stock, par value $100 per share, of which none were outstanding during any of the periods presented.
Common Stock.
Common stock, par value $0.50 per share, authorized, issued and in treasury, was as follows:
May 2, 2009 May 3, 2008Authorized 100,000,000 100,000,000 Issued 38,290,776 38,225,379 In treasury 1,372,188 702,708
10k.indd 16 7/16/09 1:18:36 PM

F-16 F-17
METHODE ELECTRONICS, INC. AND SUBSIDIARIES
NOTES TO CONSOLIDATED FINANCIAL STATEMENTS (Continued)
(Dollar amounts in thousands, except number of shares and per share data)
F-17
5. Shareholders' Equity - Continued
At May 2, 2009, 394,718 shares of common stock are reserved for future issuance in connection with our stock plans.
Shareholders’ Rights Agreement. On January 8, 2004, our Board of Directors declared a dividend of one preferred share purchase right (a "Right") for each share of common stock ("Common Shares") outstanding on January 18, 2004 to the stockholders of record on that date. Each Right entitles the registered holder to purchase from us one ten-thousandth of a share of our Series A Junior Participating Preferred Stock at an exercise price of $65.00 per one ten-thousandth of a preferred share, subject to adjustment.
The Rights, which are not detachable, will trade automatically with the Common Shares and will not be exercisable until it is announced that a person or group has become an "acquiring person" by acquiring 15% or more of the Common Shares, or a person or group commences a tender offer that will result in such person or group owning 15% or more of the Common Shares. Thereafter, separate right certificates will be distributed, and each right will entitle its holder to purchase for the exercise price, a fraction of a share of our Series A Junior Participating Preferred Stock having economic and voting terms similar to one share of common stock.
Upon announcement that any person or group has become an acquiring person, each Right will entitle all right-holders (other than the acquiring person) to purchase, for the exercise price, a number of shares of Common Shares having a market value of twice the exercise price. Right-holders would also be entitled to purchase the common stock of another entity having a value of twice the exercise price if, after a person has become an acquiring person, the Company were to enter into certain mergers or other transactions with such other entity. If any person becomes an acquiring person, the Company's Board of Directors may, at its option and subject to certain limitations, exchange one share of common stock for each Right.
The Rights may be redeemed by our Board of Directors for $0.01 per Right at any time prior to a person or group having become an acquiring person. The Rights will expire on January 8, 2014.
Dividends
We paid quarterly dividends totaling $9,778 during fiscal 2009. We intend to retain the remainder of our earnings not used for dividend payments to provide funds for the operation and expansion of our business. Our board of directors approved a stock repurchase plan in September 2008, which expires at the end of fiscal 2010. There were 669,480 shares purchased at an average price of $7.85 under the plan in fiscal 2009.
2007 Stock Plan
On June 21, 2007, our Board of Directors, on the recommendation of our Compensation Committee, adopted the Methode Electronics, Inc. 2007 Stock Plan (the “Stock Plan”). The Stock Plan was voted on and approved by the shareholders at our annual meeting on September 13, 2007. Upon adoption of the Stock Plan, our board of directors elected to terminate the 2004 Plan and the 2000 Plan with respect to the shares reserved under these plans that are not subject to outstanding awards.
The Stock Plan permits a total of 1,250,000 shares of our common stock to be awarded to participants. Shares issued under the Stock Plan may be either authorized but unissued shares, or treasury shares. If any award terminates, expires, is cancelled or forfeited as to any number of shares of common stock, new awards may be granted with respect to such shares. The total number of shares with respect to which awards may be granted to any participant in any calendar year shall not exceed 200,000 shares. As of May 2, 2009 there were 394,718 shares still available for award under the Stock Plan.
METHODE ELECTRONICS, INC. AND SUBSIDIARIES
NOTES TO CONSOLIDATED FINANCIAL STATEMENTS (Continued)
(Dollar amounts in thousands, except number of shares and per share data)
F-16
4. Intangible Assets and Goodwill - Continued
Intangible Assets
The following tables present details of our remaining identifiable intangible assets:
Wtd. Avg.Remaining
Accumulated AmortizationGross Amortization Net Periods (Years)
Customer relationships and agreements 14,995$ 12,718$ 2,277$ 14.7Patents and technology licenses 23,244 5,169 18,075 13.4Covenants not to compete 480 331 149 2.8 Total 38,719$ 18,218$ 20,501$
Wtd. Avg.Remaining
Accumulated AmortizationGross Amortization Net Periods (Years)
Customer relationships and agreements 41,324$ 19,168$ 22,156$ 16.2Patents and technology licenses 24,692 5,795 18,897 15.5Covenants not to compete 2,480 2,251 229 12.1 Total 68,496$ 27,214$ 41,282$
The estimated aggregate amortization expense for each of the five succeeding fiscal years is as follows:
2010 2,248$2011 2,1872012 1,6752013 1,2982014 1,185
May 2, 2009
May 3, 2008
As of May 2, 2009, the patents and technology licenses include $2,400 of trade names that are not subject to amortization.
5. Shareholders' Equity
Preferred Stock. We have 50,000 authorized shares of Series A Junior Participating Preferred Stock, par value $100 per share, of which none were outstanding during any of the periods presented.
Common Stock.
Common stock, par value $0.50 per share, authorized, issued and in treasury, was as follows:
May 2, 2009 May 3, 2008Authorized 100,000,000 100,000,000 Issued 38,290,776 38,225,379 In treasury 1,372,188 702,708
10k.indd 17 7/16/09 1:18:36 PM
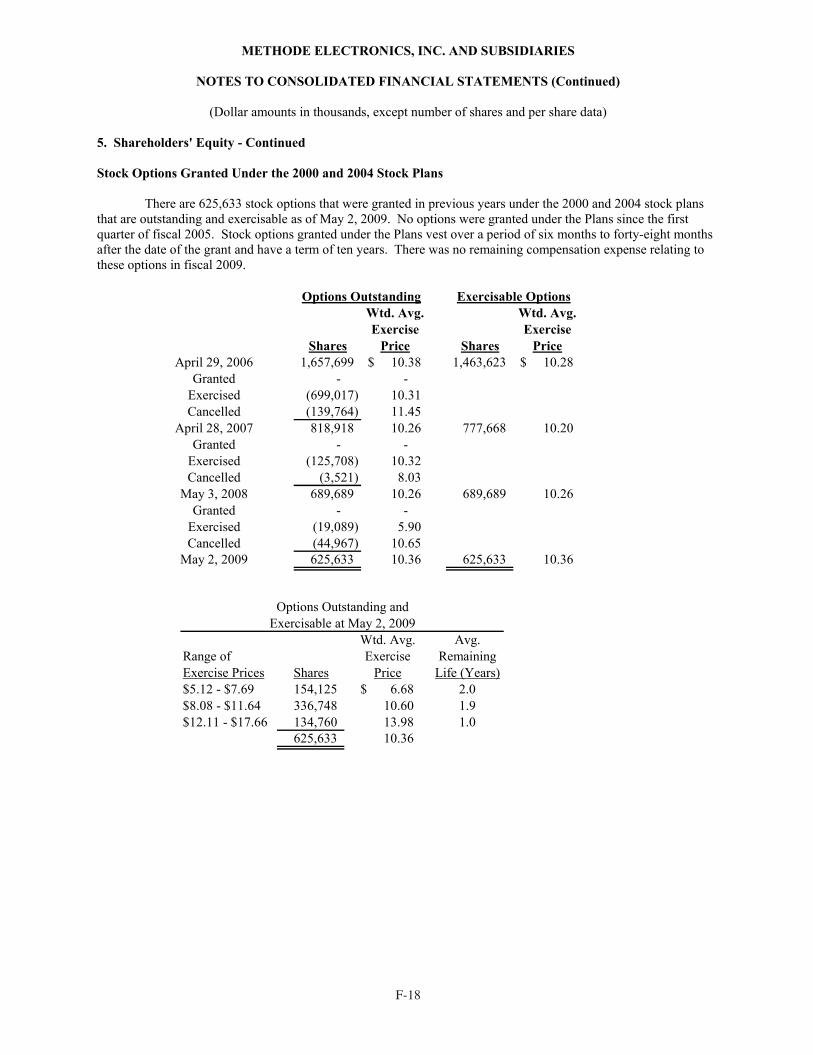
F-18 F-19
METHODE ELECTRONICS, INC. AND SUBSIDIARIES
NOTES TO CONSOLIDATED FINANCIAL STATEMENTS (Continued)
(Dollar amounts in thousands, except number of shares and per share data)
F-19
5. Shareholders' Equity - Continued
Stock Options Granted Under the 2007 Stock Plan
On March 16, 2009, the Compensation Committee approved 285,000 stock option grants to our executive officers under the Company’s 2007 Stock Plan. These options vest in full on March 16, 2012, and have a ten-year term.
ExerciseShares Price
May 3, 2008 - -$Granted 285,000 2.72
Exercised - -Cancelled - -
May 2, 2009 285,000 2.72$
Options Outstanding
Avg.Remaining
Exercise Price Shares Life (Years)2.72$ 285,000 9.9
at May 2, 2009Options Outstanding
We estimated the fair value of our employee stock options on the date of grant using the Black-Scholes option-pricing model with the following assumptions:
Expected volatility 69.58%Risk-Free interest rate 1.39%Dividend yield 2.26%Expected life of options 6.87 yearsWeighted-average grant-date fair value 1.46$
Expected volatility was based on the monthly changes in our historical common stock prices over the expected life of the award. The risk-free rate is based on the U.S. Treasury yield curve in effect at the time of the grant corresponding to the expected life of the options. Our dividend yield is based on the average dividend yield for the previous two years from the date of grant. The expected life of options is based on historical stock option exercise patterns and the terms of the options.
Restricted Stock Awards and Restricted Stock Units
In April 2007, 225,000 shares of common stock subject to performance-based Restricted Stock Awards (RSAs) granted to our CEO in fiscal 2006 and 2007 were converted to Restricted Stock Units (RSUs). The RSUs are subject to the same vesting schedule and other major provisions of the RSAs they replaced, except the RSUs are not payable until the earlier of: (1) thirty days after the CEO’s date of termination of employment with the Company and all of its subsidiaries and affiliates; or (2) the last day of our fiscal year in which the payment of common stock in satisfaction of the RSUs becomes deductible to the Company under Section 162(m) of the Internal Revenue Code. All further discussion of RSAs in this report includes the RSUs described above.
At the beginning of fiscal 2009, there were 525,589 performance-based and time-based RSAs outstanding. The time-based RSAs vest in three equal annual installments from the grant date. All RSAs awarded to senior
METHODE ELECTRONICS, INC. AND SUBSIDIARIES
NOTES TO CONSOLIDATED FINANCIAL STATEMENTS (Continued)
(Dollar amounts in thousands, except number of shares and per share data)
F-18
5. Shareholders' Equity - Continued
Stock Options Granted Under the 2000 and 2004 Stock Plans
There are 625,633 stock options that were granted in previous years under the 2000 and 2004 stock plans that are outstanding and exercisable as of May 2, 2009. No options were granted under the Plans since the first quarter of fiscal 2005. Stock options granted under the Plans vest over a period of six months to forty-eight months after the date of the grant and have a term of ten years. There was no remaining compensation expense relating to these options in fiscal 2009.
Wtd. Avg. Wtd. Avg.Exercise Exercise
Shares Price Shares PriceApril 29, 2006 1,657,699 10.38$ 1,463,623 10.28$
Granted - -Exercised (699,017) 10.31Cancelled (139,764) 11.45
April 28, 2007 818,918 10.26 777,668 10.20Granted - -
Exercised (125,708) 10.32Cancelled (3,521) 8.03
May 3, 2008 689,689 10.26 689,689 10.26Granted - -
Exercised (19,089) 5.90Cancelled (44,967) 10.65
May 2, 2009 625,633 10.36 625,633 10.36
Options Outstanding Exercisable Options
Wtd. Avg. Avg.Range of Exercise RemainingExercise Prices Shares Price Life (Years)$5.12 - $7.69 154,125 6.68$ 2.0$8.08 - $11.64 336,748 10.60 1.9$12.11 - $17.66 134,760 13.98 1.0
625,633 10.36
Exercisable at May 2, 2009Options Outstanding and
10k.indd 18 7/16/09 1:18:37 PM
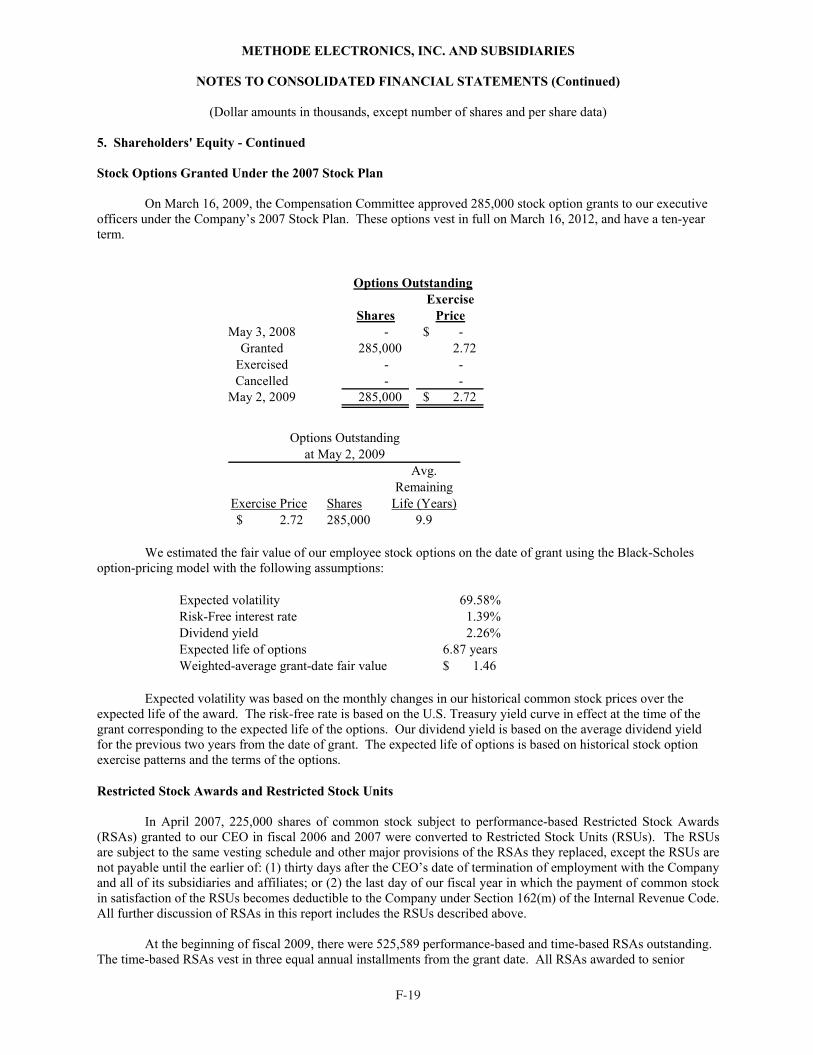
F-18 F-19
METHODE ELECTRONICS, INC. AND SUBSIDIARIES
NOTES TO CONSOLIDATED FINANCIAL STATEMENTS (Continued)
(Dollar amounts in thousands, except number of shares and per share data)
F-19
5. Shareholders' Equity - Continued
Stock Options Granted Under the 2007 Stock Plan
On March 16, 2009, the Compensation Committee approved 285,000 stock option grants to our executive officers under the Company’s 2007 Stock Plan. These options vest in full on March 16, 2012, and have a ten-year term.
ExerciseShares Price
May 3, 2008 - -$Granted 285,000 2.72
Exercised - -Cancelled - -
May 2, 2009 285,000 2.72$
Options Outstanding
Avg.Remaining
Exercise Price Shares Life (Years)2.72$ 285,000 9.9
at May 2, 2009Options Outstanding
We estimated the fair value of our employee stock options on the date of grant using the Black-Scholes option-pricing model with the following assumptions:
Expected volatility 69.58%Risk-Free interest rate 1.39%Dividend yield 2.26%Expected life of options 6.87 yearsWeighted-average grant-date fair value 1.46$
Expected volatility was based on the monthly changes in our historical common stock prices over the expected life of the award. The risk-free rate is based on the U.S. Treasury yield curve in effect at the time of the grant corresponding to the expected life of the options. Our dividend yield is based on the average dividend yield for the previous two years from the date of grant. The expected life of options is based on historical stock option exercise patterns and the terms of the options.
Restricted Stock Awards and Restricted Stock Units
In April 2007, 225,000 shares of common stock subject to performance-based Restricted Stock Awards (RSAs) granted to our CEO in fiscal 2006 and 2007 were converted to Restricted Stock Units (RSUs). The RSUs are subject to the same vesting schedule and other major provisions of the RSAs they replaced, except the RSUs are not payable until the earlier of: (1) thirty days after the CEO’s date of termination of employment with the Company and all of its subsidiaries and affiliates; or (2) the last day of our fiscal year in which the payment of common stock in satisfaction of the RSUs becomes deductible to the Company under Section 162(m) of the Internal Revenue Code. All further discussion of RSAs in this report includes the RSUs described above.
At the beginning of fiscal 2009, there were 525,589 performance-based and time-based RSAs outstanding. The time-based RSAs vest in three equal annual installments from the grant date. All RSAs awarded to senior
METHODE ELECTRONICS, INC. AND SUBSIDIARIES
NOTES TO CONSOLIDATED FINANCIAL STATEMENTS (Continued)
(Dollar amounts in thousands, except number of shares and per share data)
F-18
5. Shareholders' Equity - Continued
Stock Options Granted Under the 2000 and 2004 Stock Plans
There are 625,633 stock options that were granted in previous years under the 2000 and 2004 stock plans that are outstanding and exercisable as of May 2, 2009. No options were granted under the Plans since the first quarter of fiscal 2005. Stock options granted under the Plans vest over a period of six months to forty-eight months after the date of the grant and have a term of ten years. There was no remaining compensation expense relating to these options in fiscal 2009.
Wtd. Avg. Wtd. Avg.Exercise Exercise
Shares Price Shares PriceApril 29, 2006 1,657,699 10.38$ 1,463,623 10.28$
Granted - -Exercised (699,017) 10.31Cancelled (139,764) 11.45
April 28, 2007 818,918 10.26 777,668 10.20Granted - -
Exercised (125,708) 10.32Cancelled (3,521) 8.03
May 3, 2008 689,689 10.26 689,689 10.26Granted - -
Exercised (19,089) 5.90Cancelled (44,967) 10.65
May 2, 2009 625,633 10.36 625,633 10.36
Options Outstanding Exercisable Options
Wtd. Avg. Avg.Range of Exercise RemainingExercise Prices Shares Price Life (Years)$5.12 - $7.69 154,125 6.68$ 2.0$8.08 - $11.64 336,748 10.60 1.9$12.11 - $17.66 134,760 13.98 1.0
625,633 10.36
Exercisable at May 2, 2009Options Outstanding and
10k.indd 19 7/16/09 1:18:38 PM

F-20 F-21
METHODE ELECTRONICS, INC. AND SUBSIDIARIES
NOTES TO CONSOLIDATED FINANCIAL STATEMENTS (Continued)
(Dollar amounts in thousands, except number of shares and per share data)
F-21
5. Shareholders' Equity - Continued
additional cash bonus is recorded as compensation expense ratably over the vesting period, based upon the market value of our common stock as of the latest balance sheet date, if such targets are being met as of the latest balance sheet date. As of May 2, 2009, we were not meeting certain of these additional financial targets, no compensation expense has been accrued as a liability.
6. Employee 401(k) Savings Plan
We have an Employee 401(k) Savings Plan covering substantially all U.S. employees to which we make contributions equal to 3% of eligible compensation. Our contributions to the Employee 401(k) Savings Plan were $1,950, $2,075 and $1,806 in fiscal 2009, 2008 and 2007, respectively.
7. Income Taxes
Significant components of our deferred tax assets and liabilities were as follows:
May 2, May 3,2009 2008
Deferred tax liabilities:Accelerated tax depreciation 2,104$ 2,101$
Deferred tax assets:Deferred compensation and stock award amortization 3,576 3,083Inventory valuation differences 2,855 3,015Property valuation differences 1,031 1,001Accelerated book amortization 22,025 2,656Environmental reserves 1,191 994Bad debt reserves 639 562Vacation accruals 966 1,383Restructuring accruals 866 1,261Foreign investment tax credit 26,518 28,986Foreign net operating loss carryover 3,032 252State net operating loss carryover 443 -Other accruals 260 1,699
63,402 44,892Less valuation allowance 51,377 23,962 Total deferred tax assets 12,025 20,930Net deferred tax assets 9,921$ 18,829$
Balance sheet classification:Current asset 4,928$ 8,730$ Non-current asset 4,993 10,099
9,921$ 18,829$
METHODE ELECTRONICS, INC. AND SUBSIDIARIES
NOTES TO CONSOLIDATED FINANCIAL STATEMENTS (Continued)
(Dollar amounts in thousands, except number of shares and per share data)
F-20
5. Shareholders' Equity - Continued
management are performance-based and vest after three years if the recipient remains employed by the Company until that date and we have met certain revenue growth and return on invested capital targets. All of the unvested RSAs are entitled to voting rights and to payment of dividends. During fiscal 2009, we awarded 356,665 restricted stock awards. Of the shares granted, 24,000 shares vested immediately upon grant, 255,065 are performance-based RSAs and 77,600 are time-based RSAs.
During fiscal 2009, it was determined that based on the current economic environment, the performance shares granted in fiscal years 2007, 2008 and 2009 are not meeting the revenue growth and return on invested capital targets. Due to the performance shares not meeting financial targets, all of the 220,750, performance-based stock awards granted in fiscal 2007, were cancelled. In addition, we have recorded an adjustment to the pre-tax compensation expense to reflect the performance shares not meeting current and future anticipated revenue growth and return on invested capital targets. We recognized pre-tax compensation expense reversal for RSAs in the fiscal year ended May 2, 2009 of $570, a pre-tax compensation expense of $3,348 for the fiscal year ended May 3, 2008 and $2,922 for the fiscal year ended April 28, 2007. We record the expense in the selling and administrative section of our Consolidated Statement of Operations.
The following table summarizes the RSA activity:
2009 2008 2007Unvested at beginning of fiscal year 582,298 525,589 471,957 Awarded 356,665 246,123 316,390 Vested (105,522) (188,982) (245,765) Cancelled (220,750) - - Forfeited (34,404) (432) (16,993)Unvested at end of period 578,287 582,298 525,589
The table below shows the Company's unvested RSAs at May 2, 2009:
Probable TargetUnearned Unearned
Grant Weighted Compensation CompensationFiscal Average Expense at Expense atYear RSAs Value May 2, 2009 May 2, 20092006 125,000 3-year cliff performanced-based 12.42$ -$ -$2007 834 3-year equal annual installments 11.07 - -2007 - 3-year cliff performanced-based - - -2008 18,460 3-year equal annual installments 14.77 91,228 91,2282008 149,730 3-year cliff performanced-based 15.14 - 933,9442009 49,724 3-year equal annual installments 10.64 322,004 322,0042009 234,539 3-year cliff performanced-based 11.35 - 2,031,495
At May 2, 2009, the aggregate unvested RSAs had a weighted average fair value of $12.61 and a weighted average vesting period of approximately 15 months.
Vesting Period
Fiscal Year
In connection with the performance-based RSAs, we agreed to pay each recipient a cash bonus if the Company meets certain additional financial targets, which shall be measured as of the vesting date. The amount of the cash bonuses, if any, will be calculated by multiplying the number representing up to 50% of each recipient’s RSAs described in the paragraphs above by the closing price of our common stock as of the vesting date. This
10k.indd 20 7/16/09 1:18:38 PM

F-20 F-21
METHODE ELECTRONICS, INC. AND SUBSIDIARIES
NOTES TO CONSOLIDATED FINANCIAL STATEMENTS (Continued)
(Dollar amounts in thousands, except number of shares and per share data)
F-21
5. Shareholders' Equity - Continued
additional cash bonus is recorded as compensation expense ratably over the vesting period, based upon the market value of our common stock as of the latest balance sheet date, if such targets are being met as of the latest balance sheet date. As of May 2, 2009, we were not meeting certain of these additional financial targets, no compensation expense has been accrued as a liability.
6. Employee 401(k) Savings Plan
We have an Employee 401(k) Savings Plan covering substantially all U.S. employees to which we make contributions equal to 3% of eligible compensation. Our contributions to the Employee 401(k) Savings Plan were $1,950, $2,075 and $1,806 in fiscal 2009, 2008 and 2007, respectively.
7. Income Taxes
Significant components of our deferred tax assets and liabilities were as follows:
May 2, May 3,2009 2008
Deferred tax liabilities:Accelerated tax depreciation 2,104$ 2,101$
Deferred tax assets:Deferred compensation and stock award amortization 3,576 3,083Inventory valuation differences 2,855 3,015Property valuation differences 1,031 1,001Accelerated book amortization 22,025 2,656Environmental reserves 1,191 994Bad debt reserves 639 562Vacation accruals 966 1,383Restructuring accruals 866 1,261Foreign investment tax credit 26,518 28,986Foreign net operating loss carryover 3,032 252State net operating loss carryover 443 -Other accruals 260 1,699
63,402 44,892Less valuation allowance 51,377 23,962 Total deferred tax assets 12,025 20,930Net deferred tax assets 9,921$ 18,829$
Balance sheet classification:Current asset 4,928$ 8,730$ Non-current asset 4,993 10,099
9,921$ 18,829$
METHODE ELECTRONICS, INC. AND SUBSIDIARIES
NOTES TO CONSOLIDATED FINANCIAL STATEMENTS (Continued)
(Dollar amounts in thousands, except number of shares and per share data)
F-20
5. Shareholders' Equity - Continued
management are performance-based and vest after three years if the recipient remains employed by the Company until that date and we have met certain revenue growth and return on invested capital targets. All of the unvested RSAs are entitled to voting rights and to payment of dividends. During fiscal 2009, we awarded 356,665 restricted stock awards. Of the shares granted, 24,000 shares vested immediately upon grant, 255,065 are performance-based RSAs and 77,600 are time-based RSAs.
During fiscal 2009, it was determined that based on the current economic environment, the performance shares granted in fiscal years 2007, 2008 and 2009 are not meeting the revenue growth and return on invested capital targets. Due to the performance shares not meeting financial targets, all of the 220,750, performance-based stock awards granted in fiscal 2007, were cancelled. In addition, we have recorded an adjustment to the pre-tax compensation expense to reflect the performance shares not meeting current and future anticipated revenue growth and return on invested capital targets. We recognized pre-tax compensation expense reversal for RSAs in the fiscal year ended May 2, 2009 of $570, a pre-tax compensation expense of $3,348 for the fiscal year ended May 3, 2008 and $2,922 for the fiscal year ended April 28, 2007. We record the expense in the selling and administrative section of our Consolidated Statement of Operations.
The following table summarizes the RSA activity:
2009 2008 2007Unvested at beginning of fiscal year 582,298 525,589 471,957 Awarded 356,665 246,123 316,390 Vested (105,522) (188,982) (245,765) Cancelled (220,750) - - Forfeited (34,404) (432) (16,993)Unvested at end of period 578,287 582,298 525,589
The table below shows the Company's unvested RSAs at May 2, 2009:
Probable TargetUnearned Unearned
Grant Weighted Compensation CompensationFiscal Average Expense at Expense atYear RSAs Value May 2, 2009 May 2, 20092006 125,000 3-year cliff performanced-based 12.42$ -$ -$2007 834 3-year equal annual installments 11.07 - -2007 - 3-year cliff performanced-based - - -2008 18,460 3-year equal annual installments 14.77 91,228 91,2282008 149,730 3-year cliff performanced-based 15.14 - 933,9442009 49,724 3-year equal annual installments 10.64 322,004 322,0042009 234,539 3-year cliff performanced-based 11.35 - 2,031,495
At May 2, 2009, the aggregate unvested RSAs had a weighted average fair value of $12.61 and a weighted average vesting period of approximately 15 months.
Vesting Period
Fiscal Year
In connection with the performance-based RSAs, we agreed to pay each recipient a cash bonus if the Company meets certain additional financial targets, which shall be measured as of the vesting date. The amount of the cash bonuses, if any, will be calculated by multiplying the number representing up to 50% of each recipient’s RSAs described in the paragraphs above by the closing price of our common stock as of the vesting date. This
10k.indd 21 7/16/09 1:18:39 PM

F-22 F-23
METHODE ELECTRONICS, INC. AND SUBSIDIARIES
NOTES TO CONSOLIDATED FINANCIAL STATEMENTS (Continued)
(Dollar amounts in thousands, except number of shares and per share data)
F-23
7. Income Taxes - Continued
A reconciliation of the consolidated provisions for income taxes to amounts determined by applying the prevailing statutory federal income tax rate to pre-tax earnings/(loss) is as follows:
May 2, May 3, April 28,2009 2008 2007
Income tax at statutory rate (38,779)$ 35.0% 17,317$ 35.0% 12,566$ 35.0%Effect of:
State income taxes, net of federal benefit (2,559) 2.3 244 0.5 1,609 4.5Foreign operations with lower statutory rates (2,578) 2.3 (5,718) (11.6) (4,179) (11.6)Foreign losses with no tax benefit 13,498 (12.2) 12 0.0 1,802 5.0Foreign investment tax credit (FTC) (2,027) 1.8 (6,360) (12.8) (4,059) (11.3)Change in tax contingency reserve 37 - 1,910 3.9 (213) (0.6)Manufacturing deduction - - (318) (0.6) (53) (0.1)Research and development credit (255) 0.2 (470) (1.0) - -Foreign plant closing benefit - - (1,846) (3.7) - -Goodwill 6,422 (5.8) - - - -Other - net (32) - 213 0.4 (485) (1.4)Valuation allowance 27,953 (25.1) 4,739 9.6 2,832 7.9Income tax provision 1,680$ -1.5% 9,723$ 19.7% 9,820$ 27.4%
Fiscal Year Ended
We paid income taxes of $8,280 in 2009, $10,628 in 2008 and $13,963 in 2007. No provision has been made for income taxes on undistributed net income of foreign operations, as we expect them to be indefinitely reinvested in our foreign operations. If the undistributed net income of $49,860 were distributed as dividends, we would be subject to foreign tax withholdings and incur additional income tax expense of approximately $19,944, before available foreign tax credits. It is not practical to estimate the amount of foreign tax withholdings or foreign tax credits that may be available.
We adopted FIN 48 on April 29, 2007. As a result of the implementation of FIN 48, we recognized a $1,039 increase in the liability for unrecognized tax benefits which was accounted for as an increase of $1,014 to the April 29, 2007 balance of deferred tax assets and a decrease of $25 to the April 29, 2007 balance of retained earnings.
As of May 2, 2009, our FIN 48 gross unrecognized tax benefits totaled $6,126. After considering the federal impact on the state issues, $5,905 of this total would favorably affect the effective tax rate if resolved in our favor.
The following table presents a reconciliation of the beginning and ending amounts of unrecognized tax benefits:
Balance at May 3, 2008 5,770$Increases for positions related to the current year -Increases for positions related to the prior years 570Decreases for positions related to prior years (135)Lapsing of statutes of limitations (79)Balance at May 2, 2009 6,126$
We believe that it is reasonably possible that the total amount of unrecognized tax benefits will change within the next twelve months. We have certain tax return years subject to statutes of limitation, which will close within twelve months from the end of the fiscal 2009. Unless challenged by tax authorities, the closure of those
METHODE ELECTRONICS, INC. AND SUBSIDIARIES
NOTES TO CONSOLIDATED FINANCIAL STATEMENTS (Continued)
(Dollar amounts in thousands, except number of shares and per share data)
F-22
7. Income Taxes - Continued
At May 2, 2009, we had valuation allowances against our deferred tax assets of $51,377. In accordance with FASB No. 109, “Accounting for Income Taxes”, a valuation allowance is required to be recorded when it is more likely than not that deferred tax assets will not be realized. Future realization depends on the existence of sufficient taxable income within the carry forward period available under the tax law. Sources of future taxable income include future reversals of taxable temporary differences, future taxable income exclusive of reversing taxable differences, taxable income in carry back years and tax planning strategies. These sources of positive evidence of realizability must be weighed against negative evidence, such as cumulative losses in recent years.
In forming a judgment about the future realization of our deferred tax assets, we considered both the positive and negative evidence of realizability and gave significant weight to the negative evidence from our recent cumulative loss. We will continue to assess this situation and make appropriate adjustments to the valuation allowance based on our evaluation of the positive and negative evidence existing at the time. We are currently unable to forecast when there will be sufficient positive evidence for us to reverse the remainder of the valuation allowances that we have recorded.
The valuation allowance is associated with the deferred tax assets for the differences between book and tax that result from net operating losses (NOL), foreign investment tax credits with unlimited carryovers generated in the current and prior years and temporary differences which become deductible when the related asset is recovered or related liability is settled.
The foreign and state NOL carry forwards relate to the current years’ NOLs, which may be used to reduce tax liabilities in future years. If not realized, the state tax benefits of $443 expire over a twelve to twenty year period.
Income taxes consisted of the following:
May 2, May 3, April 28,2009 2008 2007
CurrentFederal (6,956)$ 10,580$ 8,414$Foreign 867 1,502 (4)State (309) 589 2,422
(6,398) 12,671 10,832Deferred 8,078 (2,948) (1,012)
1,680$ 9,723$ 9,820$
Fiscal Year Ended
10k.indd 22 7/16/09 1:18:39 PM

F-22 F-23
METHODE ELECTRONICS, INC. AND SUBSIDIARIES
NOTES TO CONSOLIDATED FINANCIAL STATEMENTS (Continued)
(Dollar amounts in thousands, except number of shares and per share data)
F-23
7. Income Taxes - Continued
A reconciliation of the consolidated provisions for income taxes to amounts determined by applying the prevailing statutory federal income tax rate to pre-tax earnings/(loss) is as follows:
May 2, May 3, April 28,2009 2008 2007
Income tax at statutory rate (38,779)$ 35.0% 17,317$ 35.0% 12,566$ 35.0%Effect of:
State income taxes, net of federal benefit (2,559) 2.3 244 0.5 1,609 4.5Foreign operations with lower statutory rates (2,578) 2.3 (5,718) (11.6) (4,179) (11.6)Foreign losses with no tax benefit 13,498 (12.2) 12 0.0 1,802 5.0Foreign investment tax credit (FTC) (2,027) 1.8 (6,360) (12.8) (4,059) (11.3)Change in tax contingency reserve 37 - 1,910 3.9 (213) (0.6)Manufacturing deduction - - (318) (0.6) (53) (0.1)Research and development credit (255) 0.2 (470) (1.0) - -Foreign plant closing benefit - - (1,846) (3.7) - -Goodwill 6,422 (5.8) - - - -Other - net (32) - 213 0.4 (485) (1.4)Valuation allowance 27,953 (25.1) 4,739 9.6 2,832 7.9Income tax provision 1,680$ -1.5% 9,723$ 19.7% 9,820$ 27.4%
Fiscal Year Ended
We paid income taxes of $8,280 in 2009, $10,628 in 2008 and $13,963 in 2007. No provision has been made for income taxes on undistributed net income of foreign operations, as we expect them to be indefinitely reinvested in our foreign operations. If the undistributed net income of $49,860 were distributed as dividends, we would be subject to foreign tax withholdings and incur additional income tax expense of approximately $19,944, before available foreign tax credits. It is not practical to estimate the amount of foreign tax withholdings or foreign tax credits that may be available.
We adopted FIN 48 on April 29, 2007. As a result of the implementation of FIN 48, we recognized a $1,039 increase in the liability for unrecognized tax benefits which was accounted for as an increase of $1,014 to the April 29, 2007 balance of deferred tax assets and a decrease of $25 to the April 29, 2007 balance of retained earnings.
As of May 2, 2009, our FIN 48 gross unrecognized tax benefits totaled $6,126. After considering the federal impact on the state issues, $5,905 of this total would favorably affect the effective tax rate if resolved in our favor.
The following table presents a reconciliation of the beginning and ending amounts of unrecognized tax benefits:
Balance at May 3, 2008 5,770$Increases for positions related to the current year -Increases for positions related to the prior years 570Decreases for positions related to prior years (135)Lapsing of statutes of limitations (79)Balance at May 2, 2009 6,126$
We believe that it is reasonably possible that the total amount of unrecognized tax benefits will change within the next twelve months. We have certain tax return years subject to statutes of limitation, which will close within twelve months from the end of the fiscal 2009. Unless challenged by tax authorities, the closure of those
METHODE ELECTRONICS, INC. AND SUBSIDIARIES
NOTES TO CONSOLIDATED FINANCIAL STATEMENTS (Continued)
(Dollar amounts in thousands, except number of shares and per share data)
F-22
7. Income Taxes - Continued
At May 2, 2009, we had valuation allowances against our deferred tax assets of $51,377. In accordance with FASB No. 109, “Accounting for Income Taxes”, a valuation allowance is required to be recorded when it is more likely than not that deferred tax assets will not be realized. Future realization depends on the existence of sufficient taxable income within the carry forward period available under the tax law. Sources of future taxable income include future reversals of taxable temporary differences, future taxable income exclusive of reversing taxable differences, taxable income in carry back years and tax planning strategies. These sources of positive evidence of realizability must be weighed against negative evidence, such as cumulative losses in recent years.
In forming a judgment about the future realization of our deferred tax assets, we considered both the positive and negative evidence of realizability and gave significant weight to the negative evidence from our recent cumulative loss. We will continue to assess this situation and make appropriate adjustments to the valuation allowance based on our evaluation of the positive and negative evidence existing at the time. We are currently unable to forecast when there will be sufficient positive evidence for us to reverse the remainder of the valuation allowances that we have recorded.
The valuation allowance is associated with the deferred tax assets for the differences between book and tax that result from net operating losses (NOL), foreign investment tax credits with unlimited carryovers generated in the current and prior years and temporary differences which become deductible when the related asset is recovered or related liability is settled.
The foreign and state NOL carry forwards relate to the current years’ NOLs, which may be used to reduce tax liabilities in future years. If not realized, the state tax benefits of $443 expire over a twelve to twenty year period.
Income taxes consisted of the following:
May 2, May 3, April 28,2009 2008 2007
CurrentFederal (6,956)$ 10,580$ 8,414$Foreign 867 1,502 (4)State (309) 589 2,422
(6,398) 12,671 10,832Deferred 8,078 (2,948) (1,012)
1,680$ 9,723$ 9,820$
Fiscal Year Ended
10k.indd 23 7/16/09 1:18:40 PM
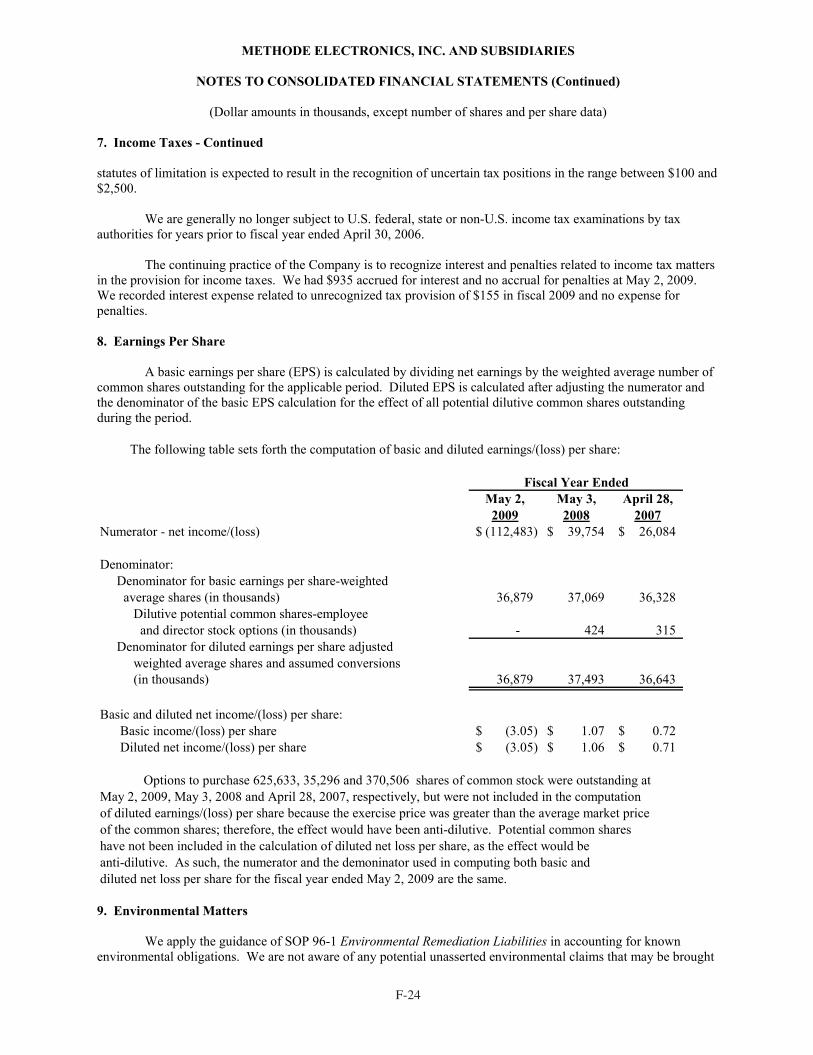
F-24 F-25
METHODE ELECTRONICS, INC. AND SUBSIDIARIES
NOTES TO CONSOLIDATED FINANCIAL STATEMENTS (Continued)
(Dollar amounts in thousands, except number of shares and per share data)
F-25
9. Environmental Matters - Continued
against us. We are involved in environmental investigation and/or remediation at two of our former plant sites. We use environmental consultants to assist us in evaluating our environmental liabilities in order to establish appropriate accruals in our financial statements. Accruals are recorded when environmental remediation is probable and the costs can be reasonably estimated. A number of factors affect the cost of environmental remediation, including the determination of the extent of contamination, the length of time remediation may require, the complexity of environmental regulations and the advancement of remediation technology. Considering these factors, we have estimated (without discounting) the costs of remediation, which will be incurred over a period of several years. Recovery from insurance or other third parties is not anticipated. We are not yet able to determine when such remediation activity will be complete, but estimates for certain remediation efforts are projected through 2015.
At May 2, 2009 and May 3, 2008, we had accruals, primarily based upon independent engineering studies, for environmental matters of $4,271 and $2,580, respectively, of which $600 was classified in other accrued expenses and the remainder was included in other liabilities. We believe the provisions made for environmental matters are adequate to satisfy liabilities relating to such matters, however it is reasonably possible that costs could exceed accrued amounts if the selected methods of remediation do not reduce the contaminates at the sites to levels acceptable to federal and state regulatory agencies.
In fiscal 2009, we spent $685 on remediation cleanups and related studies compared with $387 in fiscal 2008 and $591 in fiscal 2007. The costs associated with environmental matters as they relate to day-to-day activities were not material.
10. Pending Litigation
Certain litigation arising in the normal course of business is pending against us. We, from time to time, are subject to various legal actions and claims incidental to our business, including those arising out of alleged defects, breach of contracts, employment-related matters and environmental matters. We consider insurance coverage and third party indemnification when determining required accruals for pending litigation and claims. Although the outcome of potential legal actions and claims cannot be determined, it is the opinion of our management, based on the information available, that we have adequate reserves for these liabilities and that the ultimate resolution of these matters will not have a significant effect on our consolidated financial statements.
11. Material Customers
Sales to two customers in the Automotive segment, either directly or through their tiered suppliers, represented a significant portion of our business. Net sales to these two customers approximated 18.8% and 9.7% of consolidated net sales in fiscal 2009; three customers accounted for 25.1%, 13.8% and 9.4% of consolidated net sales, respectively in fiscal 2008 and three customers accounted for 27.3%, 16.5% and 13.6% of consolidated net sales in fiscal 2007. Sales of PODS sensor pads to one of these customers were 9.7%, 9.4% and 13.6% of consolidated net sales in fiscal 2009, 2008 and 2007, respectively.
At May 2, 2009 and May 3, 2008, accounts receivable from customers in the automotive industry were approximately $26,834 and $49,774, respectively, which included $14,386 and $22,888, respectively, at our Maltese subsidiary. Accounts receivable are generally due within 30 to 60 days. Credit losses relating to all customers generally have been within management's expectation.
12. Line of Credit
We have an agreement with our primary bank for a revolving credit facility to provide up to $75,000 ready financing for general corporate purposes, including acquisition opportunities that may become available. This facility, which expires January 31, 2011, bears interest at (a) LIBOR plus 2.75% or (b) the bank’s prime rate (or, if
METHODE ELECTRONICS, INC. AND SUBSIDIARIES
NOTES TO CONSOLIDATED FINANCIAL STATEMENTS (Continued)
(Dollar amounts in thousands, except number of shares and per share data)
F-24
7. Income Taxes - Continued
statutes of limitation is expected to result in the recognition of uncertain tax positions in the range between $100 and $2,500.
We are generally no longer subject to U.S. federal, state or non-U.S. income tax examinations by tax authorities for years prior to fiscal year ended April 30, 2006.
The continuing practice of the Company is to recognize interest and penalties related to income tax matters in the provision for income taxes. We had $935 accrued for interest and no accrual for penalties at May 2, 2009. We recorded interest expense related to unrecognized tax provision of $155 in fiscal 2009 and no expense for penalties.
8. Earnings Per Share
A basic earnings per share (EPS) is calculated by dividing net earnings by the weighted average number of common shares outstanding for the applicable period. Diluted EPS is calculated after adjusting the numerator and the denominator of the basic EPS calculation for the effect of all potential dilutive common shares outstanding during the period.
The following table sets forth the computation of basic and diluted earnings/(loss) per share:
May 2, May 3, April 28,2009 2008 2007
Numerator - net income/(loss) (112,483)$ 39,754$ 26,084$
Denominator: Denominator for basic earnings per share-weighted average shares (in thousands) 36,879 37,069 36,328 Dilutive potential common shares-employee and director stock options (in thousands) - 424 315 Denominator for diluted earnings per share adjusted weighted average shares and assumed conversions (in thousands) 36,879 37,493 36,643
Basic and diluted net income/(loss) per share: Basic income/(loss) per share (3.05)$ 1.07$ 0.72$ Diluted net income/(loss) per share (3.05)$ 1.06$ 0.71$
Options to purchase 625,633, 35,296 and 370,506 shares of common stock were outstanding atMay 2, 2009, May 3, 2008 and April 28, 2007, respectively, but were not included in the computationof diluted earnings/(loss) per share because the exercise price was greater than the average market priceof the common shares; therefore, the effect would have been anti-dilutive. Potential common shareshave not been included in the calculation of diluted net loss per share, as the effect would beanti-dilutive. As such, the numerator and the demoninator used in computing both basic anddiluted net loss per share for the fiscal year ended May 2, 2009 are the same.
Fiscal Year Ended
9. Environmental Matters
We apply the guidance of SOP 96-1 Environmental Remediation Liabilities in accounting for known environmental obligations. We are not aware of any potential unasserted environmental claims that may be brought
10k.indd 24 7/16/09 1:18:41 PM
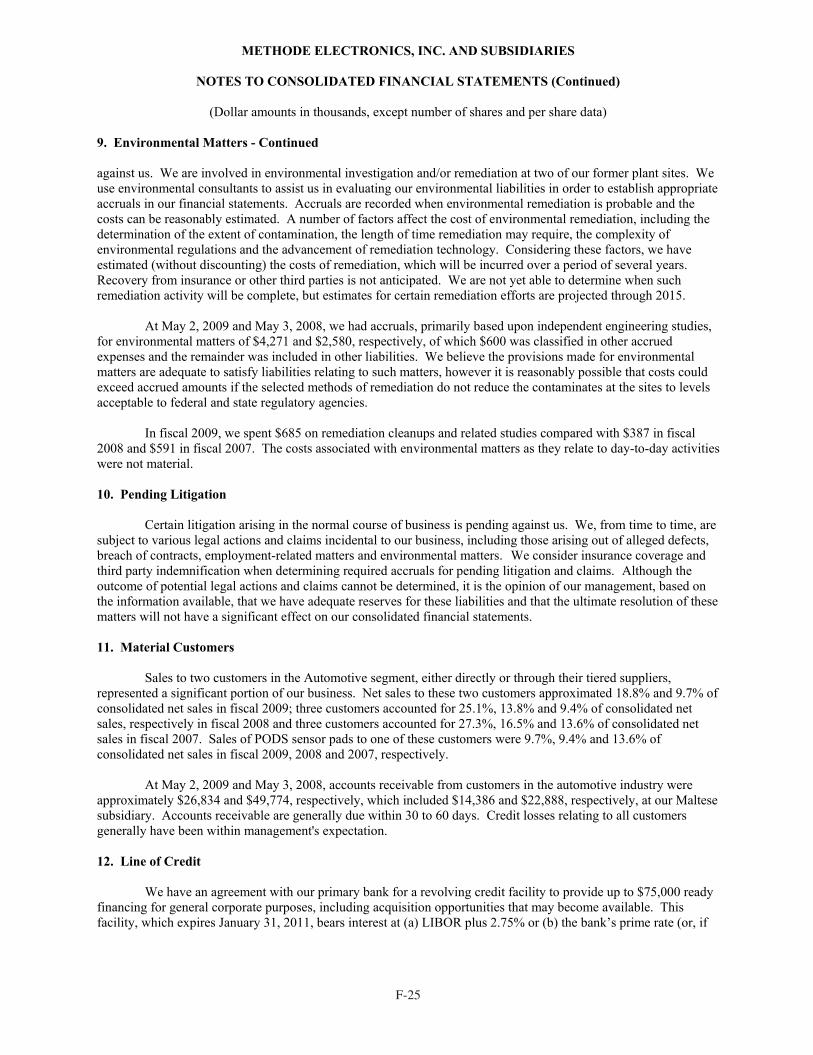
F-24 F-25
METHODE ELECTRONICS, INC. AND SUBSIDIARIES
NOTES TO CONSOLIDATED FINANCIAL STATEMENTS (Continued)
(Dollar amounts in thousands, except number of shares and per share data)
F-25
9. Environmental Matters - Continued
against us. We are involved in environmental investigation and/or remediation at two of our former plant sites. We use environmental consultants to assist us in evaluating our environmental liabilities in order to establish appropriate accruals in our financial statements. Accruals are recorded when environmental remediation is probable and the costs can be reasonably estimated. A number of factors affect the cost of environmental remediation, including the determination of the extent of contamination, the length of time remediation may require, the complexity of environmental regulations and the advancement of remediation technology. Considering these factors, we have estimated (without discounting) the costs of remediation, which will be incurred over a period of several years. Recovery from insurance or other third parties is not anticipated. We are not yet able to determine when such remediation activity will be complete, but estimates for certain remediation efforts are projected through 2015.
At May 2, 2009 and May 3, 2008, we had accruals, primarily based upon independent engineering studies, for environmental matters of $4,271 and $2,580, respectively, of which $600 was classified in other accrued expenses and the remainder was included in other liabilities. We believe the provisions made for environmental matters are adequate to satisfy liabilities relating to such matters, however it is reasonably possible that costs could exceed accrued amounts if the selected methods of remediation do not reduce the contaminates at the sites to levels acceptable to federal and state regulatory agencies.
In fiscal 2009, we spent $685 on remediation cleanups and related studies compared with $387 in fiscal 2008 and $591 in fiscal 2007. The costs associated with environmental matters as they relate to day-to-day activities were not material.
10. Pending Litigation
Certain litigation arising in the normal course of business is pending against us. We, from time to time, are subject to various legal actions and claims incidental to our business, including those arising out of alleged defects, breach of contracts, employment-related matters and environmental matters. We consider insurance coverage and third party indemnification when determining required accruals for pending litigation and claims. Although the outcome of potential legal actions and claims cannot be determined, it is the opinion of our management, based on the information available, that we have adequate reserves for these liabilities and that the ultimate resolution of these matters will not have a significant effect on our consolidated financial statements.
11. Material Customers
Sales to two customers in the Automotive segment, either directly or through their tiered suppliers, represented a significant portion of our business. Net sales to these two customers approximated 18.8% and 9.7% of consolidated net sales in fiscal 2009; three customers accounted for 25.1%, 13.8% and 9.4% of consolidated net sales, respectively in fiscal 2008 and three customers accounted for 27.3%, 16.5% and 13.6% of consolidated net sales in fiscal 2007. Sales of PODS sensor pads to one of these customers were 9.7%, 9.4% and 13.6% of consolidated net sales in fiscal 2009, 2008 and 2007, respectively.
At May 2, 2009 and May 3, 2008, accounts receivable from customers in the automotive industry were approximately $26,834 and $49,774, respectively, which included $14,386 and $22,888, respectively, at our Maltese subsidiary. Accounts receivable are generally due within 30 to 60 days. Credit losses relating to all customers generally have been within management's expectation.
12. Line of Credit
We have an agreement with our primary bank for a revolving credit facility to provide up to $75,000 ready financing for general corporate purposes, including acquisition opportunities that may become available. This facility, which expires January 31, 2011, bears interest at (a) LIBOR plus 2.75% or (b) the bank’s prime rate (or, if
METHODE ELECTRONICS, INC. AND SUBSIDIARIES
NOTES TO CONSOLIDATED FINANCIAL STATEMENTS (Continued)
(Dollar amounts in thousands, except number of shares and per share data)
F-24
7. Income Taxes - Continued
statutes of limitation is expected to result in the recognition of uncertain tax positions in the range between $100 and $2,500.
We are generally no longer subject to U.S. federal, state or non-U.S. income tax examinations by tax authorities for years prior to fiscal year ended April 30, 2006.
The continuing practice of the Company is to recognize interest and penalties related to income tax matters in the provision for income taxes. We had $935 accrued for interest and no accrual for penalties at May 2, 2009. We recorded interest expense related to unrecognized tax provision of $155 in fiscal 2009 and no expense for penalties.
8. Earnings Per Share
A basic earnings per share (EPS) is calculated by dividing net earnings by the weighted average number of common shares outstanding for the applicable period. Diluted EPS is calculated after adjusting the numerator and the denominator of the basic EPS calculation for the effect of all potential dilutive common shares outstanding during the period.
The following table sets forth the computation of basic and diluted earnings/(loss) per share:
May 2, May 3, April 28,2009 2008 2007
Numerator - net income/(loss) (112,483)$ 39,754$ 26,084$
Denominator: Denominator for basic earnings per share-weighted average shares (in thousands) 36,879 37,069 36,328 Dilutive potential common shares-employee and director stock options (in thousands) - 424 315 Denominator for diluted earnings per share adjusted weighted average shares and assumed conversions (in thousands) 36,879 37,493 36,643
Basic and diluted net income/(loss) per share: Basic income/(loss) per share (3.05)$ 1.07$ 0.72$ Diluted net income/(loss) per share (3.05)$ 1.06$ 0.71$
Options to purchase 625,633, 35,296 and 370,506 shares of common stock were outstanding atMay 2, 2009, May 3, 2008 and April 28, 2007, respectively, but were not included in the computationof diluted earnings/(loss) per share because the exercise price was greater than the average market priceof the common shares; therefore, the effect would have been anti-dilutive. Potential common shareshave not been included in the calculation of diluted net loss per share, as the effect would beanti-dilutive. As such, the numerator and the demoninator used in computing both basic anddiluted net loss per share for the fiscal year ended May 2, 2009 are the same.
Fiscal Year Ended
9. Environmental Matters
We apply the guidance of SOP 96-1 Environmental Remediation Liabilities in accounting for known environmental obligations. We are not aware of any potential unasserted environmental claims that may be brought
10k.indd 25 7/16/09 1:18:41 PM

F-26 F-27
METHODE ELECTRONICS, INC. AND SUBSIDIARIES
NOTES TO CONSOLIDATED FINANCIAL STATEMENTS (Continued)
(Dollar amounts in thousands, except number of shares and per share data)
F-27
13. Segment Information and Geographic Area Information - Continued
The table below presents information about our reportable segments:
Auto- Inter- Power Elimi- Consoli-motive Connect Products Other nations dated
Net sales 243,650$ 131,998$ 43,097$ 8,353$ 1,454$ 425,644$Transfers between segments - (952) (399) (103) (1,454) -Net sales to unaffiliated customers 243,650$ 131,046$ 42,698$ 8,250$ -$ 425,644$
Segment income (loss) before restructuring charge, impairment of goodwill and intangible assets 25,782$ 1,681$ 137$ (3,506)$ -$ 24,094$
Restructuring (19,283) (5,468) (527) - - (25,278)Impairment of goodwill and intangible assets (30,466) (56,926) (5,358) (1,624) - (94,374)
Segment income (loss) including restructuring charge, impairment of goodwill and intangible assets (23,967)$ (60,713)$ (5,748)$ (5,130)$ -$ (95,558)$
Corporate expenses, net (15,245)
Loss before income taxes (110,803)$
Depreciation and amortization 17,408$ 15,262$ 2,153$ 1,019$ -$ 35,842$Corporate depreciation and amortization 1,194
37,036$
Identifiable assets 121,572$ 115,085$ 23,925$ 6,613$ -$ 267,195$General corporate assets 38,093Total assets 305,288$
Fiscal Year Ended May 2, 2009
METHODE ELECTRONICS, INC. AND SUBSIDIARIES
NOTES TO CONSOLIDATED FINANCIAL STATEMENTS (Continued)
(Dollar amounts in thousands, except number of shares and per share data)
F-26
12. Line of Credit - Continued
higher, the Federal Funds Rate plus 0.5%) plus 1.50%. The facility also includes a fee of 0.50% of the unused balance. The facility requires that we maintain a minimum consolidated net worth equal to 85% of consolidated net worth ($197,010 at May 2, 2009) plus 50% of consolidated net income earned in each fiscal quarter, with no deduction for a net loss in any quarter and maintain consolidated interest coverage, as defined, of not less than 3.50:1.00, and maintain on a monthly basis a consolidated debt to EBITDA ratio, as defined, of not more than 2.50:1.00. We were in compliance at May 2, 2009. We borrowed $10,000 under this facility to finance a portion of the Hetronic acquisition on September 30, 2009. The amount was repaid in full the following month.
13. Segment Information and Geographic Area Information
We are a global manufacturer of component and subsystem devices. We design, manufacture and market devices employing electrical, electronic, wireless, sensing and optical technologies. Our components are found in the primary end markets of the automotive, appliance, communications (including information processing and storage, networking equipment, wireless and terrestrial voice/data systems), aerospace, rail and other transportation industries; and the consumer and industrial equipment markets.
SFAS No. 131, Disclosures about Segments of an Enterprise and Related Information (“SFAS No. 131”), establishes annual and interim reporting standards for an enterprise’s operating segments and related disclosures about its products, services, geographic areas and major customers. An operating segment is defined as a component of an enterprise that engages in business activities from which it may earn revenues and incur expenses, and about which separate financial information is regularly evaluated by the Chief Operating Decision Maker (“CODM”) in deciding how to allocate resources. The CODM, as defined by SFAS No. 131, is the Company’s President and Chief Executive Officer (“CEO”).
The Automotive segment supplies electronic and electromechanical devices and related products to automobile OEMs, either directly or through their tiered suppliers, including control switches for electrical power and signals, connectors for electrical devices, integrated control components, switches and sensors that monitor the operation or status of a component or system, and packaging of electrical components.
The Interconnect segment provides a variety of copper and fiber-optic interconnect and interface solutions for the appliance, computer, networking, telecommunications, storage, medical, military, aerospace, commercial and consumer markets. Solutions include solid-state field effect interface panels, PC and express card packaging, optical and copper transceivers, terminators, connectors, custom cable assemblies and conductive polymer and thick film inks. Services include the design and installation of fiber optic and copper infrastructure systems, and manufacture of active and passive optical components.
The Power Products segment manufactures current-carrying laminated bus devices, custom power-product assemblies; powder coated bus bars, braided flexible cables and high-current low voltage flexible power cabling systems that are used in various markets and applications, including telecommunications, computers, transportation, industrial and power conversion, insulated gate bipolar transistor solutions, aerospace and military.
The Other segment includes a designer and manufacturer of magnetic torque sensing products, and independent laboratories that provide services for qualification testing and certification, and analysis of electronic and optical components.
The accounting policies of the segments are the same as those described in the summary of significant accounting policies. We allocate resources to and evaluate performance of segments based on operating income. Transfers between segments are recorded using internal transfer prices set by us.
10k.indd 26 7/16/09 1:18:42 PM
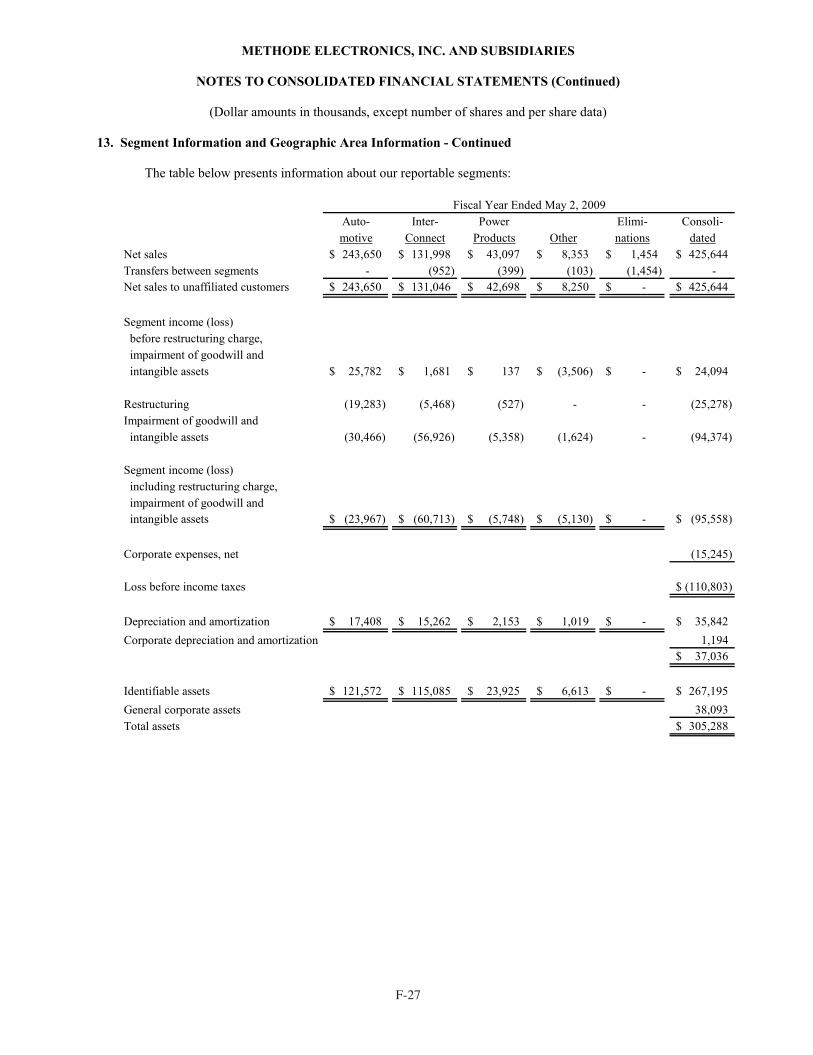
F-26 F-27
METHODE ELECTRONICS, INC. AND SUBSIDIARIES
NOTES TO CONSOLIDATED FINANCIAL STATEMENTS (Continued)
(Dollar amounts in thousands, except number of shares and per share data)
F-27
13. Segment Information and Geographic Area Information - Continued
The table below presents information about our reportable segments:
Auto- Inter- Power Elimi- Consoli-motive Connect Products Other nations dated
Net sales 243,650$ 131,998$ 43,097$ 8,353$ 1,454$ 425,644$Transfers between segments - (952) (399) (103) (1,454) -Net sales to unaffiliated customers 243,650$ 131,046$ 42,698$ 8,250$ -$ 425,644$
Segment income (loss) before restructuring charge, impairment of goodwill and intangible assets 25,782$ 1,681$ 137$ (3,506)$ -$ 24,094$
Restructuring (19,283) (5,468) (527) - - (25,278)Impairment of goodwill and intangible assets (30,466) (56,926) (5,358) (1,624) - (94,374)
Segment income (loss) including restructuring charge, impairment of goodwill and intangible assets (23,967)$ (60,713)$ (5,748)$ (5,130)$ -$ (95,558)$
Corporate expenses, net (15,245)
Loss before income taxes (110,803)$
Depreciation and amortization 17,408$ 15,262$ 2,153$ 1,019$ -$ 35,842$Corporate depreciation and amortization 1,194
37,036$
Identifiable assets 121,572$ 115,085$ 23,925$ 6,613$ -$ 267,195$General corporate assets 38,093Total assets 305,288$
Fiscal Year Ended May 2, 2009
METHODE ELECTRONICS, INC. AND SUBSIDIARIES
NOTES TO CONSOLIDATED FINANCIAL STATEMENTS (Continued)
(Dollar amounts in thousands, except number of shares and per share data)
F-26
12. Line of Credit - Continued
higher, the Federal Funds Rate plus 0.5%) plus 1.50%. The facility also includes a fee of 0.50% of the unused balance. The facility requires that we maintain a minimum consolidated net worth equal to 85% of consolidated net worth ($197,010 at May 2, 2009) plus 50% of consolidated net income earned in each fiscal quarter, with no deduction for a net loss in any quarter and maintain consolidated interest coverage, as defined, of not less than 3.50:1.00, and maintain on a monthly basis a consolidated debt to EBITDA ratio, as defined, of not more than 2.50:1.00. We were in compliance at May 2, 2009. We borrowed $10,000 under this facility to finance a portion of the Hetronic acquisition on September 30, 2009. The amount was repaid in full the following month.
13. Segment Information and Geographic Area Information
We are a global manufacturer of component and subsystem devices. We design, manufacture and market devices employing electrical, electronic, wireless, sensing and optical technologies. Our components are found in the primary end markets of the automotive, appliance, communications (including information processing and storage, networking equipment, wireless and terrestrial voice/data systems), aerospace, rail and other transportation industries; and the consumer and industrial equipment markets.
SFAS No. 131, Disclosures about Segments of an Enterprise and Related Information (“SFAS No. 131”), establishes annual and interim reporting standards for an enterprise’s operating segments and related disclosures about its products, services, geographic areas and major customers. An operating segment is defined as a component of an enterprise that engages in business activities from which it may earn revenues and incur expenses, and about which separate financial information is regularly evaluated by the Chief Operating Decision Maker (“CODM”) in deciding how to allocate resources. The CODM, as defined by SFAS No. 131, is the Company’s President and Chief Executive Officer (“CEO”).
The Automotive segment supplies electronic and electromechanical devices and related products to automobile OEMs, either directly or through their tiered suppliers, including control switches for electrical power and signals, connectors for electrical devices, integrated control components, switches and sensors that monitor the operation or status of a component or system, and packaging of electrical components.
The Interconnect segment provides a variety of copper and fiber-optic interconnect and interface solutions for the appliance, computer, networking, telecommunications, storage, medical, military, aerospace, commercial and consumer markets. Solutions include solid-state field effect interface panels, PC and express card packaging, optical and copper transceivers, terminators, connectors, custom cable assemblies and conductive polymer and thick film inks. Services include the design and installation of fiber optic and copper infrastructure systems, and manufacture of active and passive optical components.
The Power Products segment manufactures current-carrying laminated bus devices, custom power-product assemblies; powder coated bus bars, braided flexible cables and high-current low voltage flexible power cabling systems that are used in various markets and applications, including telecommunications, computers, transportation, industrial and power conversion, insulated gate bipolar transistor solutions, aerospace and military.
The Other segment includes a designer and manufacturer of magnetic torque sensing products, and independent laboratories that provide services for qualification testing and certification, and analysis of electronic and optical components.
The accounting policies of the segments are the same as those described in the summary of significant accounting policies. We allocate resources to and evaluate performance of segments based on operating income. Transfers between segments are recorded using internal transfer prices set by us.
10k.indd 27 7/16/09 1:18:43 PM

F-28 F-29
METHODE ELECTRONICS, INC. AND SUBSIDIARIES
NOTES TO CONSOLIDATED FINANCIAL STATEMENTS (Continued)
(Dollar amounts in thousands, except number of shares and per share data)
F-29
13. Segment Information and Geographic Area Information - Continued
The table below presents information about our reportable segments:
Auto- Inter- Power Elimi- Consoli-motive Connect Products Other nations dated
Net sales 315,691$ 83,221$ 43,398$ 7,715$ 1,598$ 448,427$Transfers between segments - (1,082) (402) (114) (1,598) -Net sales to unaffiliated customers 315,691$ 82,139$ 42,996$ 7,601$ -$ 448,427$Segment income (loss)before restructuring charge 29,328$ 9,264$ 8,845$ (321)$ -$ 47,116$
Restructuring (2,027) - - - - (2,027)
Segment income (loss)including restructuring charge 27,301$ 9,264$ 8,845$ (321)$ 45,089$Corporate expenses, net (9,314)
Income before income taxes and cumulativeeffect of accounting change 35,775$
Depreciation and amortization 18,927$ 3,122$ 585$ 475$ 23,109$Corporate depreciation and amortization 514
23,623$
Indentifiable assets 197,107$ 119,979$ 22,979$ 7,799$ 347,864$General corporate assets 63,876Total assets 411,740$
Fiscal Year Ended April 28, 2007
METHODE ELECTRONICS, INC. AND SUBSIDIARIES
NOTES TO CONSOLIDATED FINANCIAL STATEMENTS (Continued)
(Dollar amounts in thousands, except number of shares and per share data)
F-28
13. Segment Information and Geographic Area Information - Continued
Auto- Inter- Power Elimi- Consoli-motive Connect Products Other nations dated
Net sales 362,165$ 137,239$ 46,839$ 6,982$ 2,152$ 551,073$Transfers between segments (69) (979) (1,023) (81) (2,152) -Net sales to unaffiliated customers 362,096$ 136,260$ 45,816$ 6,901$ -$ 551,073$Segment income (loss)before restructuring charge 59,783$ 5,268$ 8,546$ (1,798)$ 71,799$
Restructuring (4,487) (672) - - (5,159)
Segment income (loss)including restructuring charge 55,296$ 4,596$ 8,546$ (1,798)$ 66,640$Corporate expenses, net (17,163)
Income before income taxes and cumulativeeffect of accounting change 49,477$
Depreciation and amortization 19,007$ 6,257$ 1,409$ 602$ 27,275$Corporate depreciation and amortization 884
28,159$
Indentifiable assets 185,905$ 134,412$ 37,063$ 7,332$ 364,712$General corporate assets 105,508Total assets 470,220$
Fiscal Year Ended May 3, 2008
10k.indd 28 7/16/09 1:18:43 PM
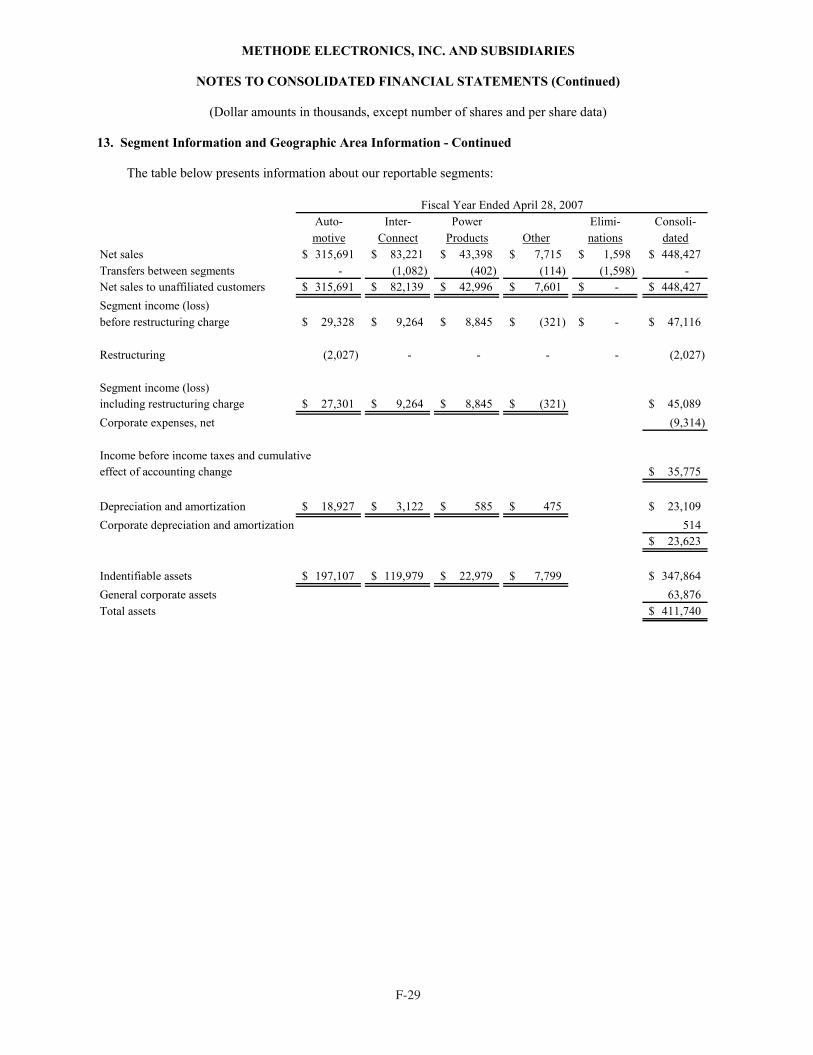
F-28 F-29
METHODE ELECTRONICS, INC. AND SUBSIDIARIES
NOTES TO CONSOLIDATED FINANCIAL STATEMENTS (Continued)
(Dollar amounts in thousands, except number of shares and per share data)
F-29
13. Segment Information and Geographic Area Information - Continued
The table below presents information about our reportable segments:
Auto- Inter- Power Elimi- Consoli-motive Connect Products Other nations dated
Net sales 315,691$ 83,221$ 43,398$ 7,715$ 1,598$ 448,427$Transfers between segments - (1,082) (402) (114) (1,598) -Net sales to unaffiliated customers 315,691$ 82,139$ 42,996$ 7,601$ -$ 448,427$Segment income (loss)before restructuring charge 29,328$ 9,264$ 8,845$ (321)$ -$ 47,116$
Restructuring (2,027) - - - - (2,027)
Segment income (loss)including restructuring charge 27,301$ 9,264$ 8,845$ (321)$ 45,089$Corporate expenses, net (9,314)
Income before income taxes and cumulativeeffect of accounting change 35,775$
Depreciation and amortization 18,927$ 3,122$ 585$ 475$ 23,109$Corporate depreciation and amortization 514
23,623$
Indentifiable assets 197,107$ 119,979$ 22,979$ 7,799$ 347,864$General corporate assets 63,876Total assets 411,740$
Fiscal Year Ended April 28, 2007
METHODE ELECTRONICS, INC. AND SUBSIDIARIES
NOTES TO CONSOLIDATED FINANCIAL STATEMENTS (Continued)
(Dollar amounts in thousands, except number of shares and per share data)
F-28
13. Segment Information and Geographic Area Information - Continued
Auto- Inter- Power Elimi- Consoli-motive Connect Products Other nations dated
Net sales 362,165$ 137,239$ 46,839$ 6,982$ 2,152$ 551,073$Transfers between segments (69) (979) (1,023) (81) (2,152) -Net sales to unaffiliated customers 362,096$ 136,260$ 45,816$ 6,901$ -$ 551,073$Segment income (loss)before restructuring charge 59,783$ 5,268$ 8,546$ (1,798)$ 71,799$
Restructuring (4,487) (672) - - (5,159)
Segment income (loss)including restructuring charge 55,296$ 4,596$ 8,546$ (1,798)$ 66,640$Corporate expenses, net (17,163)
Income before income taxes and cumulativeeffect of accounting change 49,477$
Depreciation and amortization 19,007$ 6,257$ 1,409$ 602$ 27,275$Corporate depreciation and amortization 884
28,159$
Indentifiable assets 185,905$ 134,412$ 37,063$ 7,332$ 364,712$General corporate assets 105,508Total assets 470,220$
Fiscal Year Ended May 3, 2008
10k.indd 29 7/16/09 1:18:44 PM

F-30 F-31
METHODE ELECTRONICS, INC. AND SUBSIDIARIES
NOTES TO CONSOLIDATED FINANCIAL STATEMENTS (Continued)
(Dollar amounts in thousands, except number of shares and per share data)
F-31
14. Lease Commitments
We lease certain office and manufacturing properties under non-cancelable operating leases expiring at various dates through fiscal 2014. Rental expense under non-cancelable operating leases amounted to $4,841, $4,032 and $3,123 in fiscal years 2009, 2008 and 2007, respectively.
Our aggregate minimum rental commitments under all non-cancelable operating leases are summarized in the table below for the next succeeding five fiscal years:
2010 $3,685 2011 1,887 2012 1,155 2013 621 2014 371
15. Pre-Production Costs Related to Long-Term Supply Arrangements
We incur pre-production tooling costs related to the products produced for our customers under long-term supply agreements. We had $3,182 and $8,211 as of fiscal year ended May 2, 2009 and May 3, 2008, respectively, of pre-production tooling costs related to customer-owned tools for which reimbursement is contractually guaranteed by the customer or for which the customer has provided a non-cancelable right to use the tooling. These amounts are included in our work-in-process inventory in the consolidated balance sheets. Net revenues and costs on projects are deferred and recognized over the life of the related long-term supply agreement.
16. Fair Value Measurements
We adopted SFAS No. 157, “Fair Value Measurements” (“SFAS No. 157”) as of May 4, 2008. SFAS No. 157 defines fair value as the exchange price that would be received for an asset or paid to transfer a liability (an exit price) in the principal or most advantageous market for the asset or liability in an orderly transaction between market participants.
In February 2008, the FASB issued FASB Staff Position No. 157-2, which delays the effective date of SFAS No. 157 for non-financial assets and liabilities, which are not measured at fair value on a recurring basis (at least annually) until fiscal years beginning after November 15, 2008, which is our fiscal year 2010 that began May 3, 2009. We are currently assessing the impact of adopting SFAS No. 157 for non-financial assets and liabilities on our consolidated financial statements.
SFAS No. 157 also specifies a fair value hierarchy based upon the observation of inputs in valuation techniques. Observable inputs (highest level) reflect market data obtained from independent sources, while unobservable inputs (lowest level) reflect internally developed market assumptions. In accordance with SFAS No. 157, fair value measurements are classified under the following hierarchy:
Level 1 – Quoted prices in active markets for identical assets and liabilities.
Level 2 – Quoted prices in active markets for similar assets and liabilities, or other inputs that are observable for the asset or liability, either directly or indirectly, for substantially the full term of the financial instrument.
Level 3 – Unobservable inputs that are supported by little or no market activity and that are significant to the fair value of the assets and liabilities. This includes certain pricing models, discounted cash flow methodologies and similar techniques that use significant unobservable inputs.
The adoption of SFAS No. 157 had no effect on our consolidated financial position or results of operations. Assets and liabilities recorded at fair value are valued using quoted market prices or under a market approach using
METHODE ELECTRONICS, INC. AND SUBSIDIARIES
NOTES TO CONSOLIDATED FINANCIAL STATEMENTS (Continued)
(Dollar amounts in thousands, except number of shares and per share data)
F-30
13. Segment Information and Geographic Area Information - Continued
The following table sets forth certain geographic financial information for fiscal years endedMay 2, 2009, May 3, 2008 and April 28, 2007. Geographic net sales and income are determinedbased our sales and income from our various operational locations.
May 2, May 3, April 28,2009 2008 2007
Net Sales:North American 259,539$ 356,240$ 305,232$Asia Pacific 53,378 51,915 30,141Malta 100,594 127,880 75,425Europe, excluding Malta 12,133 15,038 37,629
425,644$ 551,073$ 448,427$
Income (loss) before income taxes and cumulativeeffect of accounting change:
North American (82,328)$ 26,922$ 22,873$Asia Pacific (30,610) 4,598 1,346Europe 753 15,633 8,128Income and expenses not allocated 1,382 2,324 3,428
(110,803)$ 49,477$ 35,775$
Property, Plant and Equipment:United States 30,200$ 35,921$ 48,097$Mexico 2,389 7,149 564Asia Pacific 7,523 11,847 8,893Malta 24,561 29,255 23,434Europe, excluding Malta 5,244 6,108 5,869
69,917$ 90,280$ 86,857$
Fiscal Year Ended
10k.indd 30 7/16/09 1:18:44 PM

F-30 F-31
METHODE ELECTRONICS, INC. AND SUBSIDIARIES
NOTES TO CONSOLIDATED FINANCIAL STATEMENTS (Continued)
(Dollar amounts in thousands, except number of shares and per share data)
F-31
14. Lease Commitments
We lease certain office and manufacturing properties under non-cancelable operating leases expiring at various dates through fiscal 2014. Rental expense under non-cancelable operating leases amounted to $4,841, $4,032 and $3,123 in fiscal years 2009, 2008 and 2007, respectively.
Our aggregate minimum rental commitments under all non-cancelable operating leases are summarized in the table below for the next succeeding five fiscal years:
2010 $3,685 2011 1,887 2012 1,155 2013 621 2014 371
15. Pre-Production Costs Related to Long-Term Supply Arrangements
We incur pre-production tooling costs related to the products produced for our customers under long-term supply agreements. We had $3,182 and $8,211 as of fiscal year ended May 2, 2009 and May 3, 2008, respectively, of pre-production tooling costs related to customer-owned tools for which reimbursement is contractually guaranteed by the customer or for which the customer has provided a non-cancelable right to use the tooling. These amounts are included in our work-in-process inventory in the consolidated balance sheets. Net revenues and costs on projects are deferred and recognized over the life of the related long-term supply agreement.
16. Fair Value Measurements
We adopted SFAS No. 157, “Fair Value Measurements” (“SFAS No. 157”) as of May 4, 2008. SFAS No. 157 defines fair value as the exchange price that would be received for an asset or paid to transfer a liability (an exit price) in the principal or most advantageous market for the asset or liability in an orderly transaction between market participants.
In February 2008, the FASB issued FASB Staff Position No. 157-2, which delays the effective date of SFAS No. 157 for non-financial assets and liabilities, which are not measured at fair value on a recurring basis (at least annually) until fiscal years beginning after November 15, 2008, which is our fiscal year 2010 that began May 3, 2009. We are currently assessing the impact of adopting SFAS No. 157 for non-financial assets and liabilities on our consolidated financial statements.
SFAS No. 157 also specifies a fair value hierarchy based upon the observation of inputs in valuation techniques. Observable inputs (highest level) reflect market data obtained from independent sources, while unobservable inputs (lowest level) reflect internally developed market assumptions. In accordance with SFAS No. 157, fair value measurements are classified under the following hierarchy:
Level 1 – Quoted prices in active markets for identical assets and liabilities.
Level 2 – Quoted prices in active markets for similar assets and liabilities, or other inputs that are observable for the asset or liability, either directly or indirectly, for substantially the full term of the financial instrument.
Level 3 – Unobservable inputs that are supported by little or no market activity and that are significant to the fair value of the assets and liabilities. This includes certain pricing models, discounted cash flow methodologies and similar techniques that use significant unobservable inputs.
The adoption of SFAS No. 157 had no effect on our consolidated financial position or results of operations. Assets and liabilities recorded at fair value are valued using quoted market prices or under a market approach using
METHODE ELECTRONICS, INC. AND SUBSIDIARIES
NOTES TO CONSOLIDATED FINANCIAL STATEMENTS (Continued)
(Dollar amounts in thousands, except number of shares and per share data)
F-30
13. Segment Information and Geographic Area Information - Continued
The following table sets forth certain geographic financial information for fiscal years endedMay 2, 2009, May 3, 2008 and April 28, 2007. Geographic net sales and income are determinedbased our sales and income from our various operational locations.
May 2, May 3, April 28,2009 2008 2007
Net Sales:North American 259,539$ 356,240$ 305,232$Asia Pacific 53,378 51,915 30,141Malta 100,594 127,880 75,425Europe, excluding Malta 12,133 15,038 37,629
425,644$ 551,073$ 448,427$
Income (loss) before income taxes and cumulativeeffect of accounting change:
North American (82,328)$ 26,922$ 22,873$Asia Pacific (30,610) 4,598 1,346Europe 753 15,633 8,128Income and expenses not allocated 1,382 2,324 3,428
(110,803)$ 49,477$ 35,775$
Property, Plant and Equipment:United States 30,200$ 35,921$ 48,097$Mexico 2,389 7,149 564Asia Pacific 7,523 11,847 8,893Malta 24,561 29,255 23,434Europe, excluding Malta 5,244 6,108 5,869
69,917$ 90,280$ 86,857$
Fiscal Year Ended
10k.indd 31 7/16/09 1:18:45 PM
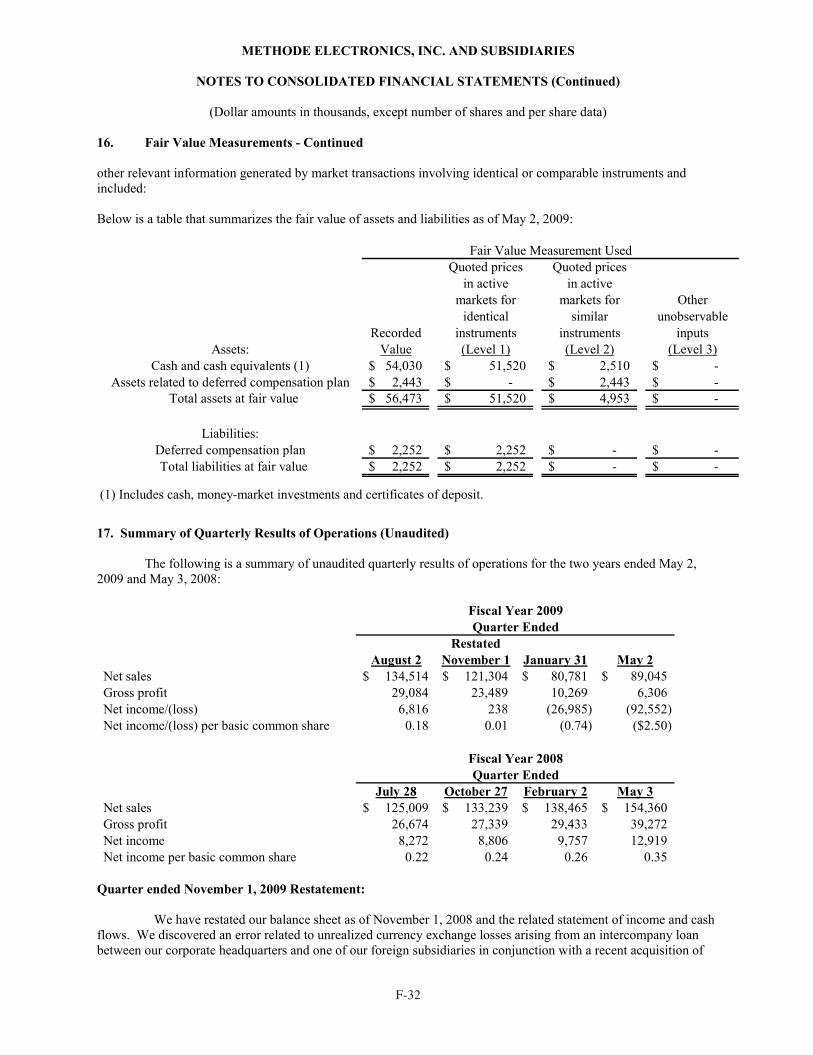
F-32 F-33
METHODE ELECTRONICS, INC. AND SUBSIDIARIES
NOTES TO CONSOLIDATED FINANCIAL STATEMENTS (Continued)
(Dollar amounts in thousands, except number of shares and per share data)
F-33
17. Summary of Quarterly Results of Operations (Unaudited) - Continued
Hetronic, LLC, purchased on September 30, 2008. The loan amount was $20,858. Due to the U.S. Dollar increasing versus the Euro, from 0.69230 on September 30, 2008 to 0.78500 on November 1, 2008, an unrealized currency loss of $2,463 should have been recorded during the second quarter.
The effects of the restatement are as follows:
Adjustment to the November 1, 2008 Condensed Consolidated Balance Sheet decreases retained earnings by $2,463 from $270,826 as previously reported, to $268,363 and increases the accumulated other comprehensive income by $2,463 from $11,472 as previously reported, to $13,935.
Adjustment to the three months ended November 1, 2008 Condensed Consolidated Statement of Income decreases other income by $2,463 from $1,853 as previously reported to an expense of $610. Net income for the three months ended November 1, 2008 decreased $2,463 from $2,701 as previously reported to $238. Basic and diluted earnings per share both decreased $0.06, from $0.07 as previously reported to $0.01.
Adjustment to the six months ended November 1, 2008 Condensed Consolidated Statement of Income decreases other income by $2,463 from $1,584 as previously reported to an expense of $879. Net income for the six months ended November 1, 2008 decreased $2,463 from $9,517 as previously reported to $7,054. Basic earnings per share decreased $0.06, from $0.26 as previously reported to $0.19. Diluted earnings per share decreased $0.05, from $0.25 as previously reported to $0.19.
Adjustment to the six months ended November 1, 2008 condensed consolidated statement of cash flows decreases net income by $2,463, from $9,517 as previously reported to $7,054. In addition, a non-cash add-back of translation loss of $2,463 has been added in the operating activities section.
The loan has been fully paid to corporate and all transactions have been properly recorded as of May 2, 2009.
Other Significant Items for Fiscal 2009
The first, second, third and fourth quarter of fiscal 2009 includes a pre-tax restructuring charge of $4,917, $6,284, $3,796 and $10,281, respectively. In addition, the third and fourth quarter of fiscal 2009 include impairment charges for goodwill and intangible assets write-down of $32,678 and $61,696, respectively.
Significant Items for Fiscal 2008
The third and fourth quarter of fiscal 2008 include a pre-tax restructuring charges of $450 and $4,709, respectively, relating to a restructuring of our U.S.-based automotive operations and a decision to discontinue producing certain legacy electronic connector products.
Quarter ended February 2, 2008 includes 14 weeks of activity due to the timing of our fiscal calendar.
Significant Items for Fiscal 2007
Third quarter fiscal 2007 results include a restructuring charge of $2,027 for the closing of our Scotland facility.
METHODE ELECTRONICS, INC. AND SUBSIDIARIES
NOTES TO CONSOLIDATED FINANCIAL STATEMENTS (Continued)
(Dollar amounts in thousands, except number of shares and per share data)
F-32
16. Fair Value Measurements - Continued
other relevant information generated by market transactions involving identical or comparable instruments and included:
Below is a table that summarizes the fair value of assets and liabilities as of May 2, 2009:
Quoted prices Quoted pricesin active in active
markets for markets for Otheridentical similar unobservable
Recorded instruments instruments inputsAssets: Value (Level 1) (Level 2) (Level 3)
Cash and cash equivalents (1) 54,030$ 51,520$ 2,510$ -$Assets related to deferred compensation plan 2,443$ -$ 2,443$ -$
Total assets at fair value 56,473$ 51,520$ 4,953$ -$
Liabilities:Deferred compensation plan 2,252$ 2,252$ -$ -$ Total liabilities at fair value 2,252$ 2,252$ -$ -$
(1) Includes cash, money-market investments and certificates of deposit.
Fair Value Measurement Used
17. Summary of Quarterly Results of Operations (Unaudited)
The following is a summary of unaudited quarterly results of operations for the two years ended May 2, 2009 and May 3, 2008:
RestatedAugust 2 November 1 January 31 May 2
Net sales 134,514$ 121,304$ 80,781$ 89,045$Gross profit 29,084 23,489 10,269 6,306Net income/(loss) 6,816 238 (26,985) (92,552)Net income/(loss) per basic common share 0.18 0.01 (0.74) ($2.50)
July 28 October 27 February 2 May 3Net sales 125,009$ 133,239$ 138,465$ 154,360$Gross profit 26,674 27,339 29,433 39,272Net income 8,272 8,806 9,757 12,919Net income per basic common share 0.22 0.24 0.26 0.35
Fiscal Year 2009Quarter Ended
Fiscal Year 2008Quarter Ended
Quarter ended November 1, 2009 Restatement:
We have restated our balance sheet as of November 1, 2008 and the related statement of income and cash flows. We discovered an error related to unrealized currency exchange losses arising from an intercompany loan between our corporate headquarters and one of our foreign subsidiaries in conjunction with a recent acquisition of
10k.indd 32 7/16/09 1:18:46 PM
F-32 F-33
METHODE ELECTRONICS, INC. AND SUBSIDIARIES
NOTES TO CONSOLIDATED FINANCIAL STATEMENTS (Continued)
(Dollar amounts in thousands, except number of shares and per share data)
F-33
17. Summary of Quarterly Results of Operations (Unaudited) - Continued
Hetronic, LLC, purchased on September 30, 2008. The loan amount was $20,858. Due to the U.S. Dollar increasing versus the Euro, from 0.69230 on September 30, 2008 to 0.78500 on November 1, 2008, an unrealized currency loss of $2,463 should have been recorded during the second quarter.
The effects of the restatement are as follows:
Adjustment to the November 1, 2008 Condensed Consolidated Balance Sheet decreases retained earnings by $2,463 from $270,826 as previously reported, to $268,363 and increases the accumulated other comprehensive income by $2,463 from $11,472 as previously reported, to $13,935.
Adjustment to the three months ended November 1, 2008 Condensed Consolidated Statement of Income decreases other income by $2,463 from $1,853 as previously reported to an expense of $610. Net income for the three months ended November 1, 2008 decreased $2,463 from $2,701 as previously reported to $238. Basic and diluted earnings per share both decreased $0.06, from $0.07 as previously reported to $0.01.
Adjustment to the six months ended November 1, 2008 Condensed Consolidated Statement of Income decreases other income by $2,463 from $1,584 as previously reported to an expense of $879. Net income for the six months ended November 1, 2008 decreased $2,463 from $9,517 as previously reported to $7,054. Basic earnings per share decreased $0.06, from $0.26 as previously reported to $0.19. Diluted earnings per share decreased $0.05, from $0.25 as previously reported to $0.19.
Adjustment to the six months ended November 1, 2008 condensed consolidated statement of cash flows decreases net income by $2,463, from $9,517 as previously reported to $7,054. In addition, a non-cash add-back of translation loss of $2,463 has been added in the operating activities section.
The loan has been fully paid to corporate and all transactions have been properly recorded as of May 2, 2009.
Other Significant Items for Fiscal 2009
The first, second, third and fourth quarter of fiscal 2009 includes a pre-tax restructuring charge of $4,917, $6,284, $3,796 and $10,281, respectively. In addition, the third and fourth quarter of fiscal 2009 include impairment charges for goodwill and intangible assets write-down of $32,678 and $61,696, respectively.
Significant Items for Fiscal 2008
The third and fourth quarter of fiscal 2008 include a pre-tax restructuring charges of $450 and $4,709, respectively, relating to a restructuring of our U.S.-based automotive operations and a decision to discontinue producing certain legacy electronic connector products.
Quarter ended February 2, 2008 includes 14 weeks of activity due to the timing of our fiscal calendar.
Significant Items for Fiscal 2007
Third quarter fiscal 2007 results include a restructuring charge of $2,027 for the closing of our Scotland facility.
METHODE ELECTRONICS, INC. AND SUBSIDIARIES
NOTES TO CONSOLIDATED FINANCIAL STATEMENTS (Continued)
(Dollar amounts in thousands, except number of shares and per share data)
F-32
16. Fair Value Measurements - Continued
other relevant information generated by market transactions involving identical or comparable instruments and included:
Below is a table that summarizes the fair value of assets and liabilities as of May 2, 2009:
Quoted prices Quoted pricesin active in active
markets for markets for Otheridentical similar unobservable
Recorded instruments instruments inputsAssets: Value (Level 1) (Level 2) (Level 3)
Cash and cash equivalents (1) 54,030$ 51,520$ 2,510$ -$Assets related to deferred compensation plan 2,443$ -$ 2,443$ -$
Total assets at fair value 56,473$ 51,520$ 4,953$ -$
Liabilities:Deferred compensation plan 2,252$ 2,252$ -$ -$ Total liabilities at fair value 2,252$ 2,252$ -$ -$
(1) Includes cash, money-market investments and certificates of deposit.
Fair Value Measurement Used
17. Summary of Quarterly Results of Operations (Unaudited)
The following is a summary of unaudited quarterly results of operations for the two years ended May 2, 2009 and May 3, 2008:
RestatedAugust 2 November 1 January 31 May 2
Net sales 134,514$ 121,304$ 80,781$ 89,045$Gross profit 29,084 23,489 10,269 6,306Net income/(loss) 6,816 238 (26,985) (92,552)Net income/(loss) per basic common share 0.18 0.01 (0.74) ($2.50)
July 28 October 27 February 2 May 3Net sales 125,009$ 133,239$ 138,465$ 154,360$Gross profit 26,674 27,339 29,433 39,272Net income 8,272 8,806 9,757 12,919Net income per basic common share 0.22 0.24 0.26 0.35
Fiscal Year 2009Quarter Ended
Fiscal Year 2008Quarter Ended
Quarter ended November 1, 2009 Restatement:
We have restated our balance sheet as of November 1, 2008 and the related statement of income and cash flows. We discovered an error related to unrealized currency exchange losses arising from an intercompany loan between our corporate headquarters and one of our foreign subsidiaries in conjunction with a recent acquisition of
10k.indd 33 7/16/09 1:18:46 PM

F-34
INDEX TO EXHIBITS
Exhibit Number Description
3.1 Certificate of Incorporation of Registrant, as amended and currently in effect (1)
3.2 Bylaws of Registrant, as amended and currently in effect (17)
4.1 Article Fourth of Certificate of Incorporation of Registrant, as amended and currently in effect (included in Exhibit 3.1) (1)
4.2 Rights Agreement dated as of January 8, 2004 between Methode Electronics, Inc. and Mellon Investor Services LLC, which includes as Exhibit A thereto, the Certificate of Designation of Series A Junior Participating Preferred Stock of Methode Electronics, Inc.; as Exhibit B thereto, the Form of Right Certificate; as Exhibit C thereto, the Summary of Rights to Purchase Preferred Shares. (2)
10.1* Methode Electronics, Inc. Managerial Bonus and Matching Bonus Plan (also referred to as the Longevity Contingent Bonus Program) (3)
10.2* Methode Electronics, Inc. 2000 Stock Plan (4)
10.3* Methode Electronics, Inc. 2004 Stock Plan (5)
10.4* Form of Methode Electronics, Inc. Restricted Stock Award Agreement (Executive Award/Cliff Vesting) under the 2000 Stock Plan (6)
10.5 Credit Agreement dated as of December 19, 2002 among Methode Electronics, Inc. as the Borrower, Bank of America, N.A., as Administrative Agent and L/C Issuer, and The Other Lenders Party Thereto (7)
10.6 Amendment to Credit Agreement dated as of November 2005 among Methode Electronics, Inc. as the Borrower, Bank of America, N.A., as Administrative Agent and L/C Issuer, and The Other Lenders Party Thereto (6)
10.7* Form of Methode Electronics, Inc. Restricted Stock Award Agreement (Outside Director) under the 2004 Stock Plan (8)
10.8* Form of Methode Electronics, Inc. Restricted Stock Award Agreement (Executive Award/Performance Based) under the 2004 Stock Plan (8)
10.9 Amendment to Credit Agreement dated as of January 31, 2006, among Methode Electronics, Inc., the Borrower, Bank of America, N.A., as Administrative Agent, and L/C Issuer, and The Other Lenders Party Thereto (9)
10.10* Change in Control Agreement dated September 1, 2006 between Methode Electronics, Inc. and Donald W. Duda (10)
10.11* Change in Control Agreement dated September 1, 2006 between Methode Electronics, Inc. and Douglas A. Koman (10)
10.12* Change in Control Agreement dated September 1, 2006 between Methode Electronics, Inc. and Thomas D. Reynolds (10)
10.13* Change in Control Agreement dated September 1, 2006 between Methode Electronics, Inc. and Paul E. Whybrow (10)
10.14* Change in Control Agreement dated September 14, 2006 between Methode Electronics, Inc. and Theodore P. Kill (11)
10.15* Change in Control Agreement dated September 14, 2006 between Methode Electronics, Inc. and Timothy R. Glandon (11)
10.16* First Amendment to Methode Electronics, Inc. 2000 Stock Plan effective as of December 14, 2006 (12)
10.17* Amended and Restated Restricted Stock Unit Award Agreement (Executive Award/Performance Based) effective as of June 18, 2004 between Methode Electronics, Inc. and Donald W. Duda (12)
10.18* Amended and Restated Restricted Stock Unit Award Agreement (Executive Award/Cliff Vesting) effective as of June 18, 2004 between Methode Electronics, Inc. and Donald W. Duda (12)
10.19 Waiver and Amendment dated as of February 28, 2007 among Methode Electronics, Inc., the Borrower, Bank of America, N.A., as Administrative Agent, and L/C Issuer, and The Other Lenders Party Thereto (13)
10.20* Amended Cash Bonus Agreement effective as of April 6, 2007 between Methode Electronics, Inc. and Donald W. Duda (14)
10.21* Amended and Restated Restricted Stock Unit Award Agreement (Executive Award/Performance Based) effective as of June 15, 2005 between Methode Electronics, Inc. and Donald W. Duda (14)
F-3
4
SC
HE
DU
LE
II—
VA
LU
AT
ION
AN
D Q
UA
LIF
YIN
G A
CC
OU
NT
S
ME
TH
OD
E E
LE
CT
RO
NIC
S, IN
C.
AN
D S
UB
SID
IAR
IES
(in
th
ou
san
ds)
CO
L. A
C
OL
. B
C
OL
. C
CO
L. D
. C
OL
. E
Ad
dit
ion
s
Des
crip
tio
n
Bal
ance
at
Beg
inn
ing
of
Per
iod
Ch
arg
ed t
o C
ost
s
and
Ex
pen
ses
Ch
arg
ed t
o O
ther
Acc
ou
nts
—
Des
crib
e
Ded
uct
ion
s—
Des
crib
e
Bal
ance
at
En
d o
f
Per
iod
YE
AR
EN
DE
D M
AY
2,
20
09
:
Res
erv
es a
nd
all
ow
ance
s d
edu
cted
fro
m a
sset
acco
un
ts:
All
ow
ance
fo
r u
nco
llec
tib
le a
cco
un
ts
$
2,3
09
$
1
20
$
6
25
(1)
$
36
0(2
) $
1
,44
4
Def
erre
d t
ax v
alu
atio
n a
llo
wan
ce
3
1,1
64
2
7,5
06
(7
,29
3)(1
)
51
,37
7
YE
AR
EN
DE
D M
AY
3,
20
08
:
Res
erv
es a
nd
all
ow
ance
s d
edu
cted
fro
m a
sset
acco
un
ts:
All
ow
ance
fo
r u
nco
llec
tib
le a
cco
un
ts
$
2,2
31
$
1
95
$
4
5(1
) $
16
2(2
) $
2
,30
9
Def
erre
d t
ax v
alu
atio
n a
llo
wan
ce
25
,76
2
3,8
92
1
,51
0(1
)
31
,16
4
YE
AR
EN
DE
D A
PR
IL 2
8,
20
07
:
Res
erv
es a
nd
all
ow
ance
s d
edu
cted
fro
m a
sset
acco
un
ts:
All
ow
ance
fo
r u
nco
llec
tib
le a
cco
un
ts
$
3,7
52
$
3
72
$
1
40
(1)
$
2,0
32
(2)
$
2,2
31
Def
erre
d t
ax v
alu
atio
n a
llo
wan
ce
25
,18
7
29
8
27
7(1
)
25
,76
2
(1) I
mp
act
of
fore
ign
cu
rren
cy t
ran
slat
ion
an
d o
ther
rec
lass
ific
atio
ns.
(2
) Un
coll
ecti
ble
acc
oun
ts w
ritt
en o
ff,
net
of
reco
ver
ies.
10k.indd 34 7/16/09 1:18:47 PM

F-34
INDEX TO EXHIBITS
Exhibit Number Description
3.1 Certificate of Incorporation of Registrant, as amended and currently in effect (1)
3.2 Bylaws of Registrant, as amended and currently in effect (17)
4.1 Article Fourth of Certificate of Incorporation of Registrant, as amended and currently in effect (included in Exhibit 3.1) (1)
4.2 Rights Agreement dated as of January 8, 2004 between Methode Electronics, Inc. and Mellon Investor Services LLC, which includes as Exhibit A thereto, the Certificate of Designation of Series A Junior Participating Preferred Stock of Methode Electronics, Inc.; as Exhibit B thereto, the Form of Right Certificate; as Exhibit C thereto, the Summary of Rights to Purchase Preferred Shares. (2)
10.1* Methode Electronics, Inc. Managerial Bonus and Matching Bonus Plan (also referred to as the Longevity Contingent Bonus Program) (3)
10.2* Methode Electronics, Inc. 2000 Stock Plan (4)
10.3* Methode Electronics, Inc. 2004 Stock Plan (5)
10.4* Form of Methode Electronics, Inc. Restricted Stock Award Agreement (Executive Award/Cliff Vesting) under the 2000 Stock Plan (6)
10.5 Credit Agreement dated as of December 19, 2002 among Methode Electronics, Inc. as the Borrower, Bank of America, N.A., as Administrative Agent and L/C Issuer, and The Other Lenders Party Thereto (7)
10.6 Amendment to Credit Agreement dated as of November 2005 among Methode Electronics, Inc. as the Borrower, Bank of America, N.A., as Administrative Agent and L/C Issuer, and The Other Lenders Party Thereto (6)
10.7* Form of Methode Electronics, Inc. Restricted Stock Award Agreement (Outside Director) under the 2004 Stock Plan (8)
10.8* Form of Methode Electronics, Inc. Restricted Stock Award Agreement (Executive Award/Performance Based) under the 2004 Stock Plan (8)
10.9 Amendment to Credit Agreement dated as of January 31, 2006, among Methode Electronics, Inc., the Borrower, Bank of America, N.A., as Administrative Agent, and L/C Issuer, and The Other Lenders Party Thereto (9)
10.10* Change in Control Agreement dated September 1, 2006 between Methode Electronics, Inc. and Donald W. Duda (10)
10.11* Change in Control Agreement dated September 1, 2006 between Methode Electronics, Inc. and Douglas A. Koman (10)
10.12* Change in Control Agreement dated September 1, 2006 between Methode Electronics, Inc. and Thomas D. Reynolds (10)
10.13* Change in Control Agreement dated September 1, 2006 between Methode Electronics, Inc. and Paul E. Whybrow (10)
10.14* Change in Control Agreement dated September 14, 2006 between Methode Electronics, Inc. and Theodore P. Kill (11)
10.15* Change in Control Agreement dated September 14, 2006 between Methode Electronics, Inc. and Timothy R. Glandon (11)
10.16* First Amendment to Methode Electronics, Inc. 2000 Stock Plan effective as of December 14, 2006 (12)
10.17* Amended and Restated Restricted Stock Unit Award Agreement (Executive Award/Performance Based) effective as of June 18, 2004 between Methode Electronics, Inc. and Donald W. Duda (12)
10.18* Amended and Restated Restricted Stock Unit Award Agreement (Executive Award/Cliff Vesting) effective as of June 18, 2004 between Methode Electronics, Inc. and Donald W. Duda (12)
10.19 Waiver and Amendment dated as of February 28, 2007 among Methode Electronics, Inc., the Borrower, Bank of America, N.A., as Administrative Agent, and L/C Issuer, and The Other Lenders Party Thereto (13)
10.20* Amended Cash Bonus Agreement effective as of April 6, 2007 between Methode Electronics, Inc. and Donald W. Duda (14)
10.21* Amended and Restated Restricted Stock Unit Award Agreement (Executive Award/Performance Based) effective as of June 15, 2005 between Methode Electronics, Inc. and Donald W. Duda (14)
10k.indd 35 7/16/09 1:18:48 PM
Exhibit 21
SUBSIDIARIES OF METHODE ELECTRONICS, INC.
Subsidiary (1) Jurisdiction of Incorporation
ABAS, Inc. Delaware Automotive Safety Technologies, Inc. Delaware Cableco Technologies, Inc. Delaware Duel Systems, Inc. Delaware Hetronic International, Inc. Hetronic USA, Inc. Hetronic Asia Holding, Inc. Hetronic Malta, Inc. KBA, Inc.
Delaware Delaware
The Philippines Malta
Delaware Magna-Lastic Devices, Inc. Delaware Methode Automotive de Mexico S.A. de C.V. Mexico Methode Development Company Delaware Methode Electronics Aftermarket, Ltd. Malta Methode Electronics Asia Pte, Ltd. Singapore Methode Electronics Connectivity Technologies, Inc. Delaware Methode Electronics Europe, Limited Scotland Methode Electronics Far East Pte., Ltd. Singapore Methode Electronics India, Private Ltd. India Methode Electronics International GmbH Germany Methode Electronics Ireland Limited Ireland Methode Electronics Malta Holdings Ltd Malta Methode Electronics Malta Ltd. Malta Methode Electronics Mediterranean Company Ltd Malta Methode Electronics (Shanghai) Co. Ltd. China Methode Electronics U.K. Ltd. United Kingdom Methode Mexico, S.A. de C.V. Mexico Methode Technology de Mexico S.A. de C.V. Mexico Optokon Co., Ltd., S.R.O. Czech Republic TouchSensor Technolgies, L.L.C. Delaware Trace Laboratories Delaware Universal Resources de Mexico S.A. de C.V. Mexico Value Engineered Products, Inc. Delaware
(1) All subsidiaries are 100% owned, except Optokon, which is 75% owned and Hetronic Asia Holding, which is 96.3% owned.
10.22* Amended and Restated Restricted Stock Unit Award Agreement (Executive Award/Performance Based) effective as of August 7, 2006 between Methode Electronics, Inc. and Donald W. Duda (14)
10.23* Methode Electronics, Inc. 2007 Stock Plan (15) 10.24* Methode Electronics, Inc. 2007 Cash Incentive Plan (15) 10.25* Form Performance Based RSA Award Agreement (15) 10.26* Form Annual Cash Bonus Award Agreement (15) 10.27* Form RSA Tandem Cash Award Agreement (15) 10.28* 10.29*
10.30
Form Director RSA Award Agreement (15)
Change in Control Agreement dated July 15, 2008 between Methode Electronics, Inc. and Ronald L. G. Tsoumas (17)
Asset and Share Purchase Agreement for Hetronic (18)
21 Subsidiaries of Methode Electronics, Inc.23 Consent of Ernst & Young LLP
31.1 Rule 13a-14(a)/15d-14(a) Certification of Principal Executive Officer 31.2 Rule 13a-14(a)/15d-14(a) Certification of Principal Financial Officer 32 Certification of Periodic Financial Report Pursuant to 18 U.S.C. Section 1350
----------------------------------------------------------- (1) Previously filed with Registrant’s Form 8-K filed January 9, 2004, and incorporated herein
by reference. (2) Previously filed with Registrant’s Form 8-A filed January 8, 2004, and incorporated herein
by reference. (3) Previously filed with Registrant’s Form 10-K for the year ended April 30, 2005, and
incorporated herein by reference. (4) Previously filed with Registrant’s Form 10-Q for the three months ended October 31, 2000,
and incorporated herein by reference. (5) Previously filed with Registrant’s Form 8-K filed December 7, 2004, and incorporated
herein by reference. (6) Previously filed with Registrant’s Form 10-Q for the three months ended October 31, 2004,
and incorporated herein by reference. (7) Previously filed with Registrant’s Form 10-Q for the three months ended January 31, 2003,
and incorporated herein by reference. (8) Previously filed with Registrant’s Form 8-K filed August 11, 2006, and incorporated herein
by reference. (9) Previously filed with Registrant’s Form 8-K filed February 3, 2006, and incorporated
herein by reference. (10) Previously filed with Registrant’s Form 8-K filed September 6, 2006, and incorporated
herein by reference. (11) Previously filed with Registrant’s Form 8-K filed September 18, 2006, and incorporated
herein by reference. (12) Previously filed with Registrant’s Form 10-Q for the three months ended January 27, 2007,
and incorporated herein by reference. (13) Previously filed with Registrant’s Form 8-K filed March 12, 2007, and incorporated herein
by reference. (14) Previously filed with Registrant’s Form 8-K filed April 6, 2007, and incorporated herein by
reference. (15) Previously filed with Registrant’s Form 8-K filed September 19, 2007, and incorporated
herein by reference. (16) Previously filed with Registrant’s Form 8-K filed November 2, 2007, and incorporated
herein by reference. (17)
(18)
Previously filed with Registrant’s Form 10-K filed July 17, 2008, and incorporated herein by reference. Previously filed with Registrant’s Form 10-K filed July 2, 2009, and incorporated herein by reference.
* Management Compensatory Plan
10k.indd 36 7/16/09 1:18:49 PM
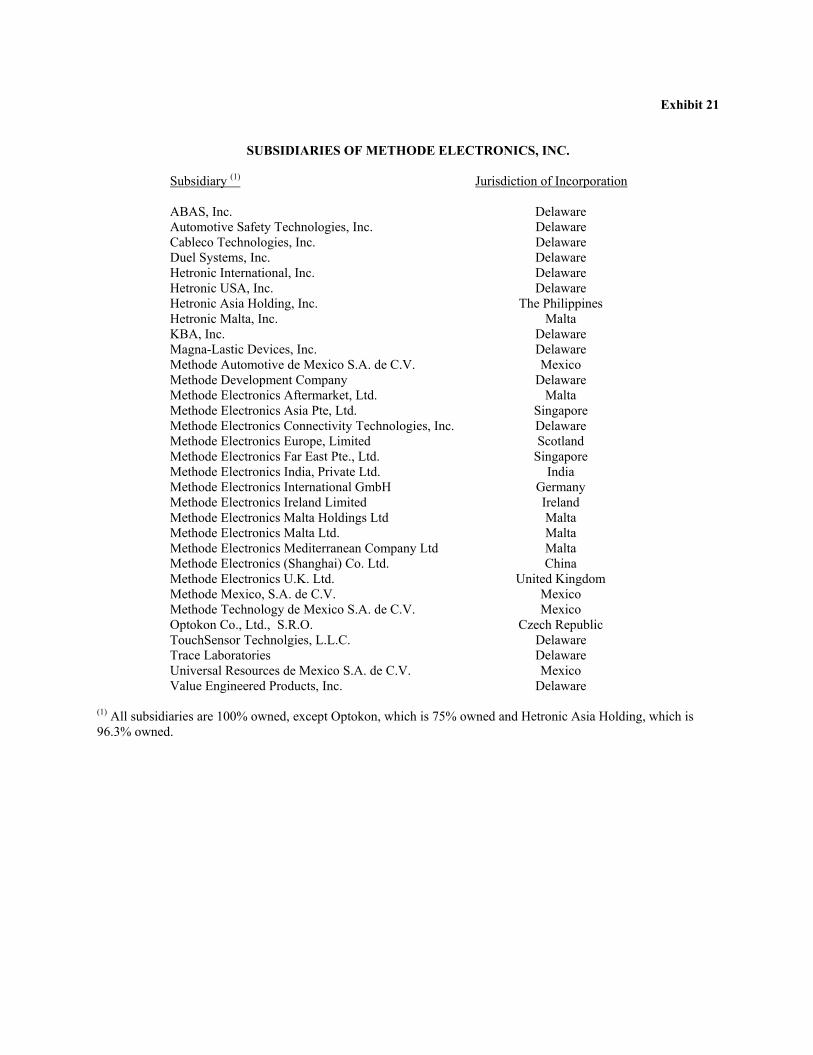
Exhibit 21
SUBSIDIARIES OF METHODE ELECTRONICS, INC.
Subsidiary (1) Jurisdiction of Incorporation
ABAS, Inc. Delaware Automotive Safety Technologies, Inc. Delaware Cableco Technologies, Inc. Delaware Duel Systems, Inc. Delaware Hetronic International, Inc. Hetronic USA, Inc. Hetronic Asia Holding, Inc. Hetronic Malta, Inc. KBA, Inc.
Delaware Delaware
The Philippines Malta
Delaware Magna-Lastic Devices, Inc. Delaware Methode Automotive de Mexico S.A. de C.V. Mexico Methode Development Company Delaware Methode Electronics Aftermarket, Ltd. Malta Methode Electronics Asia Pte, Ltd. Singapore Methode Electronics Connectivity Technologies, Inc. Delaware Methode Electronics Europe, Limited Scotland Methode Electronics Far East Pte., Ltd. Singapore Methode Electronics India, Private Ltd. India Methode Electronics International GmbH Germany Methode Electronics Ireland Limited Ireland Methode Electronics Malta Holdings Ltd Malta Methode Electronics Malta Ltd. Malta Methode Electronics Mediterranean Company Ltd Malta Methode Electronics (Shanghai) Co. Ltd. China Methode Electronics U.K. Ltd. United Kingdom Methode Mexico, S.A. de C.V. Mexico Methode Technology de Mexico S.A. de C.V. Mexico Optokon Co., Ltd., S.R.O. Czech Republic TouchSensor Technolgies, L.L.C. Delaware Trace Laboratories Delaware Universal Resources de Mexico S.A. de C.V. Mexico Value Engineered Products, Inc. Delaware
(1) All subsidiaries are 100% owned, except Optokon, which is 75% owned and Hetronic Asia Holding, which is 96.3% owned.
10.22* Amended and Restated Restricted Stock Unit Award Agreement (Executive Award/Performance Based) effective as of August 7, 2006 between Methode Electronics, Inc. and Donald W. Duda (14)
10.23* Methode Electronics, Inc. 2007 Stock Plan (15) 10.24* Methode Electronics, Inc. 2007 Cash Incentive Plan (15) 10.25* Form Performance Based RSA Award Agreement (15) 10.26* Form Annual Cash Bonus Award Agreement (15) 10.27* Form RSA Tandem Cash Award Agreement (15) 10.28* 10.29*
10.30
Form Director RSA Award Agreement (15)
Change in Control Agreement dated July 15, 2008 between Methode Electronics, Inc. and Ronald L. G. Tsoumas (17)
Asset and Share Purchase Agreement for Hetronic (18)
21 Subsidiaries of Methode Electronics, Inc.23 Consent of Ernst & Young LLP
31.1 Rule 13a-14(a)/15d-14(a) Certification of Principal Executive Officer 31.2 Rule 13a-14(a)/15d-14(a) Certification of Principal Financial Officer 32 Certification of Periodic Financial Report Pursuant to 18 U.S.C. Section 1350
----------------------------------------------------------- (1) Previously filed with Registrant’s Form 8-K filed January 9, 2004, and incorporated herein
by reference. (2) Previously filed with Registrant’s Form 8-A filed January 8, 2004, and incorporated herein
by reference. (3) Previously filed with Registrant’s Form 10-K for the year ended April 30, 2005, and
incorporated herein by reference. (4) Previously filed with Registrant’s Form 10-Q for the three months ended October 31, 2000,
and incorporated herein by reference. (5) Previously filed with Registrant’s Form 8-K filed December 7, 2004, and incorporated
herein by reference. (6) Previously filed with Registrant’s Form 10-Q for the three months ended October 31, 2004,
and incorporated herein by reference. (7) Previously filed with Registrant’s Form 10-Q for the three months ended January 31, 2003,
and incorporated herein by reference. (8) Previously filed with Registrant’s Form 8-K filed August 11, 2006, and incorporated herein
by reference. (9) Previously filed with Registrant’s Form 8-K filed February 3, 2006, and incorporated
herein by reference. (10) Previously filed with Registrant’s Form 8-K filed September 6, 2006, and incorporated
herein by reference. (11) Previously filed with Registrant’s Form 8-K filed September 18, 2006, and incorporated
herein by reference. (12) Previously filed with Registrant’s Form 10-Q for the three months ended January 27, 2007,
and incorporated herein by reference. (13) Previously filed with Registrant’s Form 8-K filed March 12, 2007, and incorporated herein
by reference. (14) Previously filed with Registrant’s Form 8-K filed April 6, 2007, and incorporated herein by
reference. (15) Previously filed with Registrant’s Form 8-K filed September 19, 2007, and incorporated
herein by reference. (16) Previously filed with Registrant’s Form 8-K filed November 2, 2007, and incorporated
herein by reference. (17)
(18)
Previously filed with Registrant’s Form 10-K filed July 17, 2008, and incorporated herein by reference. Previously filed with Registrant’s Form 10-K filed July 2, 2009, and incorporated herein by reference.
* Management Compensatory Plan
10k.indd 37 7/16/09 1:18:49 PM

Exhibit 31.1Certification of Chief Executive Officer
Pursuant to Section 302 of the Sarbanes-Oxley Act of 2002
I, Donald W. Duda certify that:
1. I have reviewed this annual report on Form 10-K of Methode Electronics, Inc.;
2. Based on my knowledge, this report does not contain any untrue statement of a material fact or omit to state a material fact necessary to make the statements made, in light of the circumstances under which such statements were made, not misleading with respect to the period covered by this report;
3. Based on my knowledge, the financial statements, and other financial information included in this report, fairly present in all material respects the financial condition, results of operations and cash flows of the registrant as of, and for, the periods presented in this report;
4. The registrant’s other certifying officer and I are responsible for establishing and maintaining disclosure controls and procedures (as defined in Exchange Act Rules 13a-15(e) and 15d-15(e)) and internal control over financial reporting (as defined in Exchange Act Rules 13a-15(f) and 15d-15(f)) for the registrant and have:
a) Designed such disclosure controls and procedures, or caused such disclosure controls and procedures to be designed under our supervision, to ensure that material information relating to the registrant, including its consolidated subsidiaries, is made known to us by others within those entities, particularly during the period in which this report is being prepared;
b) Designed such internal control over financial reporting, or caused such internal control over financial reporting to be designed under our supervision, to provide reasonable assurance regarding the reliability of financial reporting and the preparation of financial statements for external purposes in accordance with generally accepted accounting principles;
c) Evaluated the effectiveness of the registrant’s disclosure controls and procedures and presented in this report our conclusions about the effectiveness of the disclosure controls and procedures, as of the end of the period covered by this report based on such evaluation; and
d) Disclosed in this report any change in the registrant’s internal control over financial reporting that occurred during the registrant’s most recent fiscal quarter (the registrant’s fourth fiscal quarter in the case of an annual report) that has materially affected, or is reasonably likely to materially affect, the registrant’s internal control over financial reporting; and
5. The registrant’s other certifying officer and I have disclosed, based on our most recent evaluation of internal control over financial reporting, to the registrant’s auditors and the audit committee of the registrant’s board of directors (or persons performing the equivalent functions):
a) All significant deficiencies and material weaknesses in the design or operation of internal control over financial reporting which are reasonably likely to adversely affect the registrant’s ability to record, process, summarize and report financial information; and
b) Any fraud, whether or not material, that involves management or other employees who have a significant role in the registrant’s internal control over financial reporting.
Dated: July 2, 2009./s/ Donald W. Duda
President and Chief Executive Officer (Principal Executive Officer)
Exhibit 23
CONSENT OF INDEPENDENT REGISTERED PUBLIC ACCOUNTING FIRM
We consent to the incorporation by reference in the Registration Statements (Forms S-8 No. 333-121090, No. 333-71042, No. 333-48356, and No. 333-49671 and Form S-3 No. 333-123806), as amended, and in the related Prospectus of Methode Electronics, Inc. of our reports dated July 1, 2009 with respect to the consolidated financial statements and schedule of Methode Electronics, Inc., and the effectiveness of internal control over financial reporting of Methode Electronics, Inc., included in this Annual Report (Form 10-K) for the year ended May 2, 2009.
/s/Ernst & Young LLP
Chicago, Illinois July 1, 2009
10k.indd 38 7/16/09 1:18:50 PM
Exhibit 31.1Certification of Chief Executive Officer
Pursuant to Section 302 of the Sarbanes-Oxley Act of 2002
I, Donald W. Duda certify that:
1. I have reviewed this annual report on Form 10-K of Methode Electronics, Inc.;
2. Based on my knowledge, this report does not contain any untrue statement of a material fact or omit to state a material fact necessary to make the statements made, in light of the circumstances under which such statements were made, not misleading with respect to the period covered by this report;
3. Based on my knowledge, the financial statements, and other financial information included in this report, fairly present in all material respects the financial condition, results of operations and cash flows of the registrant as of, and for, the periods presented in this report;
4. The registrant’s other certifying officer and I are responsible for establishing and maintaining disclosure controls and procedures (as defined in Exchange Act Rules 13a-15(e) and 15d-15(e)) and internal control over financial reporting (as defined in Exchange Act Rules 13a-15(f) and 15d-15(f)) for the registrant and have:
a) Designed such disclosure controls and procedures, or caused such disclosure controls and procedures to be designed under our supervision, to ensure that material information relating to the registrant, including its consolidated subsidiaries, is made known to us by others within those entities, particularly during the period in which this report is being prepared;
b) Designed such internal control over financial reporting, or caused such internal control over financial reporting to be designed under our supervision, to provide reasonable assurance regarding the reliability of financial reporting and the preparation of financial statements for external purposes in accordance with generally accepted accounting principles;
c) Evaluated the effectiveness of the registrant’s disclosure controls and procedures and presented in this report our conclusions about the effectiveness of the disclosure controls and procedures, as of the end of the period covered by this report based on such evaluation; and
d) Disclosed in this report any change in the registrant’s internal control over financial reporting that occurred during the registrant’s most recent fiscal quarter (the registrant’s fourth fiscal quarter in the case of an annual report) that has materially affected, or is reasonably likely to materially affect, the registrant’s internal control over financial reporting; and
5. The registrant’s other certifying officer and I have disclosed, based on our most recent evaluation of internal control over financial reporting, to the registrant’s auditors and the audit committee of the registrant’s board of directors (or persons performing the equivalent functions):
a) All significant deficiencies and material weaknesses in the design or operation of internal control over financial reporting which are reasonably likely to adversely affect the registrant’s ability to record, process, summarize and report financial information; and
b) Any fraud, whether or not material, that involves management or other employees who have a significant role in the registrant’s internal control over financial reporting.
Dated: July 2, 2009./s/ Donald W. Duda
President and Chief Executive Officer (Principal Executive Officer)
Exhibit 23
CONSENT OF INDEPENDENT REGISTERED PUBLIC ACCOUNTING FIRM
We consent to the incorporation by reference in the Registration Statements (Forms S-8 No. 333-121090, No. 333-71042, No. 333-48356, and No. 333-49671 and Form S-3 No. 333-123806), as amended, and in the related Prospectus of Methode Electronics, Inc. of our reports dated July 1, 2009 with respect to the consolidated financial statements and schedule of Methode Electronics, Inc., and the effectiveness of internal control over financial reporting of Methode Electronics, Inc., included in this Annual Report (Form 10-K) for the year ended May 2, 2009.
/s/Ernst & Young LLP
Chicago, Illinois July 1, 2009
10k.indd 39 7/16/09 1:18:50 PM
Exhibit 32
METHODE ELECTRONICS, INC.
Certification of Periodic Financial Report Pursuant to 18 U.S.C. Section 1350
Pursuant to 18 U.S.C. Section 1350, as adopted pursuant to Section 906 of the Sarbanes-Oxley Act of 2002, each of the undersigned officers of Methode Electronics, Inc. (the “Company”) certifies that the Annual Report on Form 10-K of the Company for the year ended May 2, 2009 fully complies with the requirements of Section 13(a) or 15(d) of the Securities Exchange Act of 1934 and information contained in that Form 10-K fairly presents, in all material respects, the financial condition and results of operations of the Company.
Dated: July 2, 2009 /s/ Donald W. Duda Donald W. Duda
President and Chief Executive Officer
Dated: July 2, 2009 /s/ Douglas A. Koman Douglas A. Koman
Chief Financial Officer
A signed original of this written statement required by Section 906 has been provided to the Company and will be retained by the Company and furnished to the Securities and Exchange Commission or its staff upon request.
Exhibit 31.2Certification of Chief Financial Officer
Pursuant to Section 302 of the Sarbanes-Oxley Act of 2002
I, Douglas A. Koman certify that:
1. I have reviewed this annual report on Form 10-K of Methode Electronics, Inc.;
2. Based on my knowledge, this report does not contain any untrue statement of a material fact or omit to state a material fact necessary to make the statements made, in light of the circumstances under which such statements were made, not misleading with respect to the period covered by this report;
3. Based on my knowledge, the financial statements, and other financial information included in this report, fairly present in all material respects the financial condition, results of operations and cash flows of the registrant as of, and for, the periods presented in this report;
4. The registrant’s other certifying officer and I are responsible for establishing and maintaining disclosure controls and procedures (as defined in Exchange Act Rules 13a-15(e) and 15d-15(e)) and internal control over financial reporting (as defined in Exchange Act Rules 13a-15(f) and 15d-15(f)) for the registrant and have:
a) Designed such disclosure controls and procedures, or caused such disclosure controls and procedures to be designed under our supervision, to ensure that material information relating to the registrant, including its consolidated subsidiaries, is made known to us by others within those entities, particularly during the period in which this report is being prepared;
b) Designed such internal control over financial reporting, or caused such internal control over financial reporting to be designed under our supervision, to provide reasonable assurance regarding the reliability of financial reporting and the preparation of financial statements for external purposes in accordance with generally accepted accounting principles;
c) Evaluated the effectiveness of the registrant’s disclosure controls and procedures and presented in this report our conclusions about the effectiveness of the disclosure controls and procedures, as of the end of the period covered by this report based on such evaluation; and
d) Disclosed in this report any change in the registrant’s internal control over financial reporting that occurred during the registrant’s most recent fiscal quarter (the registrant’s fourth fiscal quarter in the case of an annual report) that has materially affected, or is reasonably likely to materially affect, the registrant’s internal control over financial reporting; and
5. The registrant’s other certifying officer and I have disclosed, based on our most recent evaluation of internal control over financial reporting, to the registrant’s auditors and the audit committee of the registrant’s board of directors (or persons performing the equivalent functions):
a) All significant deficiencies and material weaknesses in the design or operation of internal control over financial reporting which are reasonably likely to adversely affect the registrant’s ability to record, process, summarize and report financial information; and
b) Any fraud, whether or not material, that involves management or other employees who have a significant role in the registrant’s internal control over financial reporting.
Dated: July 2, 2009./s/ Douglas A. KomanChief Financial Officer
(Principal Financial Officer)
10k.indd 40 7/16/09 1:18:51 PM
Exhibit 32
METHODE ELECTRONICS, INC.
Certification of Periodic Financial Report Pursuant to 18 U.S.C. Section 1350
Pursuant to 18 U.S.C. Section 1350, as adopted pursuant to Section 906 of the Sarbanes-Oxley Act of 2002, each of the undersigned officers of Methode Electronics, Inc. (the “Company”) certifies that the Annual Report on Form 10-K of the Company for the year ended May 2, 2009 fully complies with the requirements of Section 13(a) or 15(d) of the Securities Exchange Act of 1934 and information contained in that Form 10-K fairly presents, in all material respects, the financial condition and results of operations of the Company.
Dated: July 2, 2009 /s/ Donald W. Duda Donald W. Duda
President and Chief Executive Officer
Dated: July 2, 2009 /s/ Douglas A. Koman Douglas A. Koman
Chief Financial Officer
A signed original of this written statement required by Section 906 has been provided to the Company and will be retained by the Company and furnished to the Securities and Exchange Commission or its staff upon request.
Exhibit 31.2Certification of Chief Financial Officer
Pursuant to Section 302 of the Sarbanes-Oxley Act of 2002
I, Douglas A. Koman certify that:
1. I have reviewed this annual report on Form 10-K of Methode Electronics, Inc.;
2. Based on my knowledge, this report does not contain any untrue statement of a material fact or omit to state a material fact necessary to make the statements made, in light of the circumstances under which such statements were made, not misleading with respect to the period covered by this report;
3. Based on my knowledge, the financial statements, and other financial information included in this report, fairly present in all material respects the financial condition, results of operations and cash flows of the registrant as of, and for, the periods presented in this report;
4. The registrant’s other certifying officer and I are responsible for establishing and maintaining disclosure controls and procedures (as defined in Exchange Act Rules 13a-15(e) and 15d-15(e)) and internal control over financial reporting (as defined in Exchange Act Rules 13a-15(f) and 15d-15(f)) for the registrant and have:
a) Designed such disclosure controls and procedures, or caused such disclosure controls and procedures to be designed under our supervision, to ensure that material information relating to the registrant, including its consolidated subsidiaries, is made known to us by others within those entities, particularly during the period in which this report is being prepared;
b) Designed such internal control over financial reporting, or caused such internal control over financial reporting to be designed under our supervision, to provide reasonable assurance regarding the reliability of financial reporting and the preparation of financial statements for external purposes in accordance with generally accepted accounting principles;
c) Evaluated the effectiveness of the registrant’s disclosure controls and procedures and presented in this report our conclusions about the effectiveness of the disclosure controls and procedures, as of the end of the period covered by this report based on such evaluation; and
d) Disclosed in this report any change in the registrant’s internal control over financial reporting that occurred during the registrant’s most recent fiscal quarter (the registrant’s fourth fiscal quarter in the case of an annual report) that has materially affected, or is reasonably likely to materially affect, the registrant’s internal control over financial reporting; and
5. The registrant’s other certifying officer and I have disclosed, based on our most recent evaluation of internal control over financial reporting, to the registrant’s auditors and the audit committee of the registrant’s board of directors (or persons performing the equivalent functions):
a) All significant deficiencies and material weaknesses in the design or operation of internal control over financial reporting which are reasonably likely to adversely affect the registrant’s ability to record, process, summarize and report financial information; and
b) Any fraud, whether or not material, that involves management or other employees who have a significant role in the registrant’s internal control over financial reporting.
Dated: July 2, 2009./s/ Douglas A. KomanChief Financial Officer
(Principal Financial Officer)
10k.indd 41 7/16/09 1:18:51 PM

Comparison of Five-Year Cumulative Total Returns Performance Graph for
METHODE ELECTRONICS, INC. The following graph sets forth a five-year comparison of the cumulative total stockholder returns for the following: (1) MethodeÕs common stock; (2) the NYSE Composite Index; (3) the NASDAQ U.S. Index; (4) a previously used custom peer group of publicly traded companies; and (5) a new custom peer group that management believes better reflects the business and prospects of Methode Electronics. The ÒNew Peer GroupÓ includes companies that design and manufacture electrical and electronic devices, sub-assemblies, sensors and controls for the automotive, computer, communications systems, and other markets. The New Peer Group consists of the following companies: CTS Corp., Franklin Electric Co., Inc., Gentex Corp., LaBarge, Inc., Littelfuse, Inc., Merix Corp., Nu Horizons Electronics, Corp., Powell Industries, Richardson Electronics, Inc., Rogers Corp., Standard Motor Products, Inc., and Stoneridge, Inc. The ÒOld Peer GroupÓ includes companies that manufacture, or have business units that manufacture, electrical and electronic connectors; interconnect devices, or controls and components for the automotive, computer, communications systems and other markets. The Old Peer Group consists of the following companies: Arris Group, CTS Corporation, Foundry Networks, Inc., Franklin Electric Co., Inc., Gentex Corporation, Littelfuse, Inc., Nu Horizons Electronics, Corp., Polycom, Inc., Powerwave Technologies, Inc., Richardson Electronics, Inc., Standard Motor Products, Inc., and Stoneridge, Inc.
0
20
40
60
80
100
120
140
160
180
$200
200920082007200620052004
Old Peer GroupNew Peer Group
NASDAQ Stock Market (U.S.Companies)NYSE Composite IndexMethode Electronics
2004 2005 2006 2007 2008 2009Methode Electronics 100.00 100.77 89.47 146.74 106.61 60.83NYSE Composite Index 100.00 111.21 137.50 161.82 161.64 98.35NASDAQ Stock Market (US Companies) 100.00 100.35 121.83 134.57 128.83 72.03Old Peer Group 100.00 84.40 110.00 127.24 100.05 76.92New Peer Group 100.00 80.77 95.24 102.90 94.16 60.60
(This page intentionally left blank)
10k.indd 42 7/16/09 1:18:52 PM

Comparison of Five-Year Cumulative Total Returns Performance Graph for
METHODE ELECTRONICS, INC. The following graph sets forth a five-year comparison of the cumulative total stockholder returns for the following: (1) MethodeÕs common stock; (2) the NYSE Composite Index; (3) the NASDAQ U.S. Index; (4) a previously used custom peer group of publicly traded companies; and (5) a new custom peer group that management believes better reflects the business and prospects of Methode Electronics. The ÒNew Peer GroupÓ includes companies that design and manufacture electrical and electronic devices, sub-assemblies, sensors and controls for the automotive, computer, communications systems, and other markets. The New Peer Group consists of the following companies: CTS Corp., Franklin Electric Co., Inc., Gentex Corp., LaBarge, Inc., Littelfuse, Inc., Merix Corp., Nu Horizons Electronics, Corp., Powell Industries, Richardson Electronics, Inc., Rogers Corp., Standard Motor Products, Inc., and Stoneridge, Inc. The ÒOld Peer GroupÓ includes companies that manufacture, or have business units that manufacture, electrical and electronic connectors; interconnect devices, or controls and components for the automotive, computer, communications systems and other markets. The Old Peer Group consists of the following companies: Arris Group, CTS Corporation, Foundry Networks, Inc., Franklin Electric Co., Inc., Gentex Corporation, Littelfuse, Inc., Nu Horizons Electronics, Corp., Polycom, Inc., Powerwave Technologies, Inc., Richardson Electronics, Inc., Standard Motor Products, Inc., and Stoneridge, Inc.
0
20
40
60
80
100
120
140
160
180
$200
200920082007200620052004
Old Peer GroupNew Peer Group
NASDAQ Stock Market (U.S.Companies)NYSE Composite IndexMethode Electronics
2004 2005 2006 2007 2008 2009Methode Electronics 100.00 100.77 89.47 146.74 106.61 60.83NYSE Composite Index 100.00 111.21 137.50 161.82 161.64 98.35NASDAQ Stock Market (US Companies) 100.00 100.35 121.83 134.57 128.83 72.03Old Peer Group 100.00 84.40 110.00 127.24 100.05 76.92New Peer Group 100.00 80.77 95.24 102.90 94.16 60.60
(This page intentionally left blank)
10k.indd 43 7/16/09 1:18:52 PM

C O M PA N Y P R O F I L E
Methode Electronics, Inc. (NYSE: MEI) is a global d esigner and manufacturer
of electro-mechanical devices with manufacturing, design and testing
facilities in the United States, Malta, Mexico, the United Kingdom,
Germany, the Czech Republic, China, Singapore, the Philippines and India.
We design, manufacture and market devices employing electrical, electronic,
wireless, radio remote control, sensing and optical technologies to control
and convey signals through sensors, interconnections and controls.
Our business is managed on a segment basis, with those segments being
Automotive, Interconnect, Power Products and Other. Our components are
in the primary end markets of the automobile, computer, information
processing and networking equipment, voice and data communication
systems, consumer electronics, appliances, aerospace vehicles and
industrial equipment industries.
Further information can be found at Methode’s Web site www.methode.com.
Methode is. . . possibilities.
U N I T E D S TA T E SAutomotive Electronic ControlsManufacturing Plant111 West Buchanan StreetCarthage, IL 62321James L. KendrickPlant Manager
Automotive Electronic ControlsSales and Engineering Office24585 Evergreen RoadSouthfield, MI 48075Theodore P. KillVice President, WorldwideAutomotive Sales
Automotive Safety Technologies, Inc.
111 West Buchanan StreetCarthage, IL 62321Timothy R. GlandonVice President and GeneralManager, North AmericanAutomotive Operations
Cableco Technologies, Inc.1750 Junction Avenue, Suite 150San Jose, CA 95112Arthur H. BronkGeneral Manager
Printed on Recycled Paper.
I N T E R N AT I O N A LHetronic Asia Manufacturing & Trading Corp.
Laguna Technopark 121 East Main Avenue L4, P5 Binan, Laguna PhilippinesHans JohnPresident
Hetronic Malta Mosta Technopark Factory 15B Mosta, Malta MST 3000 MaltaSimon GrimaPresident
Methode Electronics International GmbH
Rhein Strasse 4855435 Gau-AlgesheimGermanyJoseph E. KhouryVice President European Automotive
Methode Electronics U.K., Ltd.Design OfficePrestige Park Active Way Burnley, Lancashire BB11 1BSEnglandRussell L. SchoonoverEuropean Program Director
M A N A G E M E N T O F B U S I N E S S U N I T S S H A R E H O L D E R I N F O R M AT I O N
Connectivity Technologies, Inc.1111 Digital DriveRichardson, TX 75081Timothy A. HazzardPresident
dataMate Products7401 West Wilson AvenueChicago, IL 60706Albert C. ChiappettaGeneral Manager
Hetronic International, Inc. 3000 NW 149th Street Oklahoma City, OK 73134 Torsten RempePresident & CEO
Hetronic USA, Inc. 4300 Highline Boulevard Building A Oklahoma City, OK 73108 Torsten RempePresident
Magna-lastic Devices, Inc.7401 West Wilson AvenueChicago, IL 60706LeVern J. HooverGeneral Manager
Methode Mexico, S.A. de C.V.Calle Spectrum #200 Suite “D”Parque Industrial Finsa-MonterreyApodaca, Nuevo Leon, C.P. 66600Mexico Ezequiel Acevedo PeredaPlant Manager
Methode Electronics Far East Pte Ltd.
60 Alexandra Terrace#02-09A The ComtechSingapore 118502Ken WongRegional Sales Manager for Asia
Methode Electronics India Private Limited
Raj Driva, 99/A 3rd Floor, 5th BlockKHB Colony, KoramangalaBangalore, India 560095Anil ShettyGeneral Manager
Methode Electronics Ireland, Ltd.Crossagalla Business Park, Unit HBallysimon RoadLimerick, IrelandJohn A. LyonsSales Manager
Methode Electronics Malta Ltd.Mriehel Industrial EstateMriehel QRM09MaltaJoseph E. KhouryVice President European Automotive
Transfer Agent and RegistrarContinental Stock Transfer & Trust Co.17 Battery Place8th FloorNew York, NY 10004212-509-4000Toll-Free 800-509-5586 www.continentalstock.com
Corporate CounselLocke Lord Bissell & Liddell LLP111 South Wacker DriveChicago, IL 60606
Independent AuditorsErnst & Young LLP233 South Wacker DriveChicago, IL 60606
Corporate HeadquartersMethode Electronics, Inc.7401 West Wilson AvenueChicago, IL 60706708-867-6777Toll-Free 877-316-7700www.methode.com
Annual MeetingThe Annual Meeting ofShareholders will be held at 11:00 A.M. on September 17, 2009 at: Methode Electronics, Inc.7401 West Wilson AvenueChicago, IL 60706
MarketThe shares are traded on the New York Stock Exchangeunder the symbol MEI.
Methode Development Company7401 West Wilson AvenueChicago, IL 60706Albert C. ChiappettaGeneral Manager
Network Bus ProductsValue Engineered Products1700 Hicks RoadRolling Meadows, IL 60008 Thomas D. ReynoldsActing General Manager
TouchSensor Technologies, LLC203 North Gables BoulevardWheaton, IL 60187Robert B. CampbellGeneral Manager
Trace Laboratories Inc.1150 West Euclid AvenuePalatine, IL 60067Kevin MehaffeyGeneral Managerand5 North Park DriveHunt Valley, MD 21030Gaylon D. MorrisGeneral Manager
Methode Electronics (Shanghai) Co. Ltd.
Interconnect OperationsNo. 40B (T40B-7) No. 1765 Jin Qiao Export Processing ZonePudong Shanghai 201206People’s Republic of ChinaShang ZhengGeneral Manager
Methode Electronics (Shanghai) Co., Ltd.
211 Qin Qiao RoadBuilding T71-5 EastJin Qiao Export Processing ZonePudong Shanghai 201206People’s Republic of ChinaAutomotive OperationsShang ZhengGeneral ManagerPower ProductsJay SeelanGeneral Manager
Optokon Co., Ltd.Cerveny Kriz 250586 02 Jihlava Czech RepublicJiri SteflManaging Director
Universal Resources de Mexico, S.A. de C.V.
Carr. Riberena Km 10.5Maquilpark C.D. ReynosaTamaulipas, MexicoMichael S. BrothertonPlant Manager
Methode Cover 7/23/09 10:16 AM Page 3

Corporate Headquarters7401 West Wilson AvenueChicago, Illinois 60706Phone: (708) 867-6777Fax: (708) 867-3288
www.methode.com
Methode Cover 7/23/09 10:16 AM Page 1


