Table SI-3. Monomer, cross-linker and overall final conversions for nanogels N1-N25
Feeding Composition Conversiona
Nanogel NIPAM NPAM NAPr MBA NIPAM NPAM NAPr MBA Overall
n° % mol monomer % mol CL % % %
N1 90 - - 10 63.7 - - 80.9 65.4
N2 80 - - 20 67.2 - - 91.7 72.4
N3 70 - - 30 77.6 - - 93.4 82.2
N4 60 - - 40 81.1 - - 95.7 86.7
N5 50 - - 50 75.9 - - 94.5 85.1
N6 - 90 - 10 - 59.3 - 80.2 61.7
N7 - 80 - 20 - 61.3 - 86.1 66.9
N8 - 70 - 30 - 64.6 - 86.9 71.4
N9 - 60 - 40 - 72.1 - 92.7 80.5
N10 - 50 - 50 - 71.7 - 92.4 82.4
N11 - - 90 10 - - 95.7 99.3 96.2
N12 - - 80 20 - - 95.4 98.8 96.2
N13 - - 70 30 - - 96.7 99.0 97.5
N14 - - 60 40 - - 96.4 98.4 97.2
N15 - - 50 50 - - 97.8 98.4 98.1
N16 40 - 50 10 81.6 - 94.2 94.8 89.1
N17 40 - 40 20 82.7 - 96.0 95.4 90.3
N18 40 - 30 30 81.0 - 94.1 96.8 89.4
N19 40 - 20 40 78.9 - 79.0 91.6 84.0
N20 40 - 10 50 78.4 - 94.0 95.5 88.3
N21 - 40 50 10 - 78.1 91.6 94.2 86.5
N22 - 40 40 20 - 75.8 90.5 93.3 85.3
N23 - 40 30 30 - 77.9 91.5 94.6 87.2
N24 - 40 20 40 - 79.1 93.8 95.6 88.9
N25 - 40 10 50 - 76.7 92.2 93.4 86.7
Polymerisation conditions: 48h, 70 °C, DMSO-d6, 1% AIBN and Cm=1%. aConversions were calculated from 1H NMR spectra of
initial and final polymerisation mixtures.
SI page 4
Table SI-4. Monomer, cross-linker and overall final conversions for nanogels N26-N30
Feeding Composition Conversiona
Nanogel NPAM A-Pro-OH MBA NPAM A-Pro-OH MBA Overall
n° % mol monomer % mol CL % % % %
N26 70 20 10 67.5 87.3 85.5 73.6
N27 75 15 10 71.9 87.7 85.8 75.8
N28 80 10 10 66.3 85.5 82.0 70.0
N29 85 5 10 71.7 89.15 89.2 74.2
N30 87.5 2.5 10 62.0 79.5 85.8 65.0
Polymerisation conditions: 48h, 70 °C, DMSO-d6, 1% AIBN and Cm=1%. aConversions were calculated from 1H NMR spectra of initial and final polymerisation mixtures.
SI page 5
2. Supporting Figures
Figure SI-1. Partial 1H NMR (400 MHz, 298 K, DMSO-d6) spectra of the polymerisation mixtures for the
preparation of nanogel N1 as a representative example for all polymerisations. a) Spectrum acquired
immediately after preparation of the polymerisation mixture, b) spectrum acquired after heating at 70 °C for
48 h. Peaks integrated to calculate conversions (Table SI-3 and Table SI-4) are indicated. 1,2,4,5-
Tetramethylbenzene was used as internal standard (IS). Intensities have been scaled for clarity.
SI page 6
Figure SI-2. Calibration curve of NBA
Figure SI-3. FT-IR spectra of monomers NIPAM, NPAM, NAPr and A-Pro-OH
0.0 2.5x10⁻⁵
2.0x10⁻⁵
1.5x10-51.0x10
-5
0.05
0.10
0.15
0.20
0.25
0.30
Ab
sorb
an
ce
(6
34
nm
)
Concentration (mol L-1) of NBA
0.35
5.0x10⁻⁶
y=13615x-0.0008
R2=0.9937
4000 3500 3000 2500 2000 1500 1000 500
N O
OH
O
Wavenumber (cm-1)
monomer A-Pro-OH
4000 3500 3000 2500 2000 1500 1000 500
monomer NIPAM
O
HN
Wavenumber (cm-1)
4000 3500 3000 2500 2000 1500 1000 500
monomer NAPr
N
O
Wavenumber (cm-1)
4000 3500 3000 2500 2000 1500 1000 500
monomer NPAM
O
HN
Wavenumber (cm-1)
SI page 7
Figure SI-4. FT-IR spectra of monomer NIPAM and nanogel N1 (NIPAM-MBA 90:10)
Figure SI-5. FT-IR spectra of monomer NPAM and nanogel N6 (NPAM-MBA 90:10)
4000 3500 3000 2500 2000 1500 1000 500
monomer NIPAM
Wavenumber (cm-1)
nanogel N1
4000 3500 3000 2500 2000 1500 1000 500
Wavenumber (cm-1)
nanogel N6
monomer NPAM
SI page 8
Figure SI-6. FT-IR spectra of monomer NPAr and nanogel N11 (NPAr-MBA 90:10)
Figure SI-7. FT-IR spectra of monomer A-Pro-OH and nanogel N30 (NPAM-A-Pro-OH-MBA 87.5:2.5:10).
4000 3500 3000 2500 2000 1500 1000 500
Wavenumber (cm-1)
monomer NAPr
nanogel N11
Wavenumber (cm-1)
nanogel N30
monomer A-Pro-OH
4000 3500 3000 2500 2000 1500 1000 500
SI page 9
Figure SI-8. Dynamic light scattering of nanogel N1
Figure SI-9. Dynamic light scattering of nanogel N2
Figure SI-10. Dynamic light scattering of Nanogel N3
SI page 10
Figure SI-11. Dynamic light scattering of nanogel N4
Figure SI-12. Dynamic light scattering of nanogel N5
Figure SI-13. Dynamic light scattering of nanogel N6
SI page 11
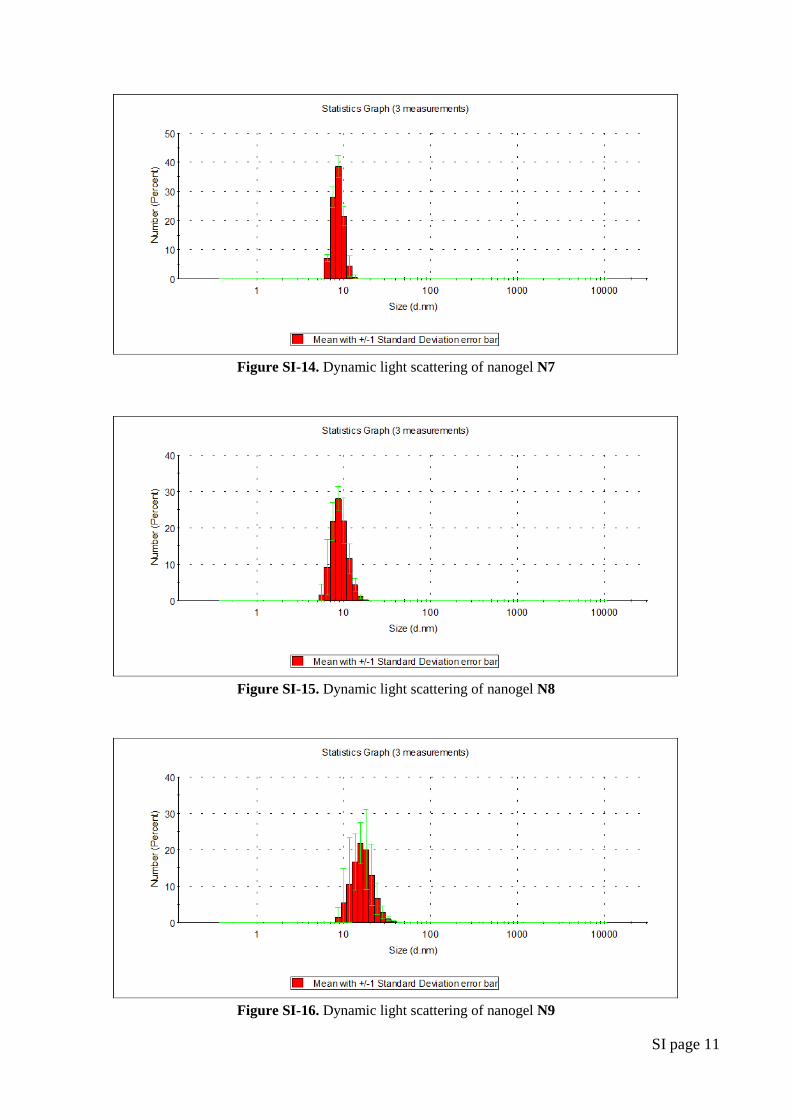
Figure SI-14. Dynamic light scattering of nanogel N7
Figure SI-15. Dynamic light scattering of nanogel N8
Figure SI-16. Dynamic light scattering of nanogel N9
SI page 12
Figure SI-17. Dynamic light scattering of nanogel N10
Figure SI-18. Dynamic light scattering of nanogel N11
Figure SI-19. Dynamic light scattering of nanogel N12
SI page 13
Figure SI-20. Dynamic light scattering of nanogel N13
Figure SI-21. Dynamic light scattering of nanogel N14
Figure SI-22. Dynamic light scattering of nanogel N15
SI page 14
Figure SI-23. Dynamic light scattering of nanogel N16
Figure SI-24. Dynamic light scattering of nanogel N17
Figure SI-25. Dynamic light scattering of nanogel N18
SI page 15
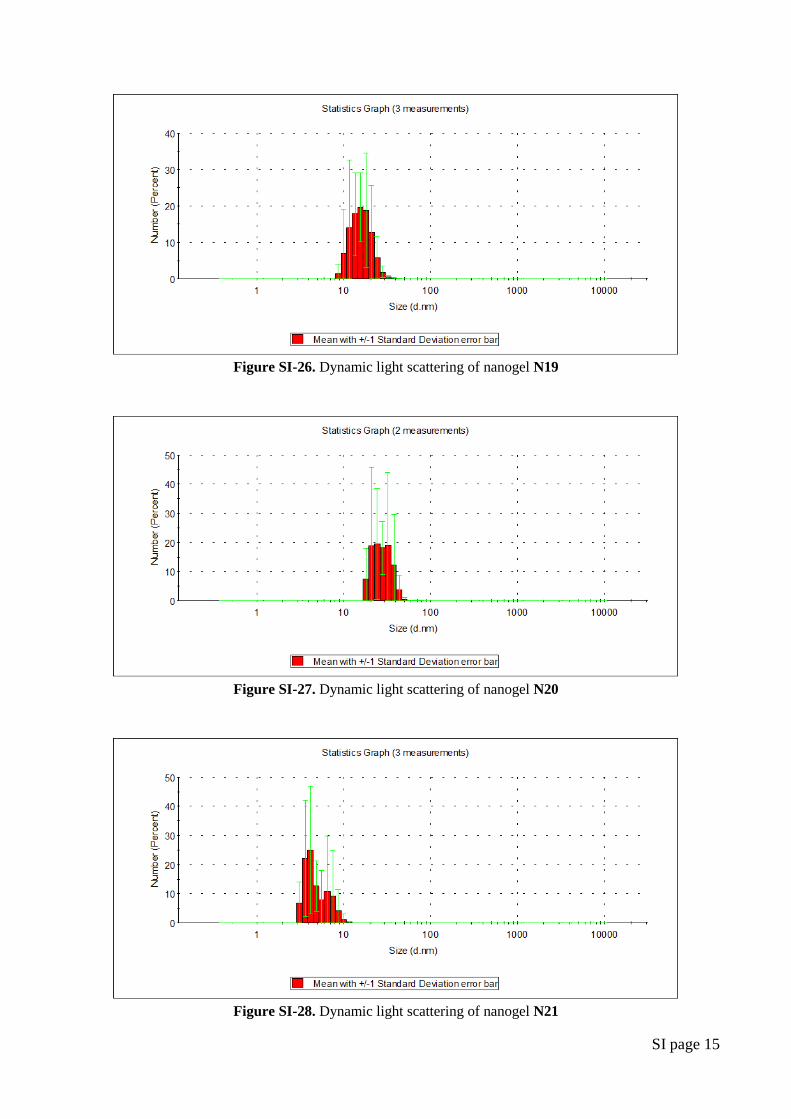
Figure SI-26. Dynamic light scattering of nanogel N19
Figure SI-27. Dynamic light scattering of nanogel N20
Figure SI-28. Dynamic light scattering of nanogel N21
SI page 16
Figure SI-29. Dynamic light scattering of nanogel N22
Figure SI-30. Dynamic light scattering of nanogel N23
Figure SI-31. Dynamic light scattering of nanogel N24
SI page 17
Figure SI-32. Dynamic light scattering of nanogel N25
Figure SI-33. Dynamic light scattering of nanogel N26
Figure SI-34. Dynamic light scattering of nanogel N27
SI page 18
Figure SI-35. Dynamic light scattering of nanogel N28
Figure SI-36. Dynamic light scattering of nanogel N29
Figure SI-37. Dynamic light scattering of nanogel N30
SI page 19
Figure SI-38. Dynamic light scattering of nanogel N31
Figure SI-39. Dynamic light scattering of nanogel N30D
SI page 20
Figure SI-40 Transmittance change with increasing temperature for nanogels based on a) NIPAM (N1-N5), b)
NPAM (N6-N10) and c) NAPr (N11-N15), cross-linked with different % mol MBA. Transmittance was
measured at 500 nm at a polymer concentration of 1 mgmL-1 in deionised water.
Figure SI-41. Transmittance change with increasing temperature for the nanogels based on a) NIPAM-NAPr
(N16-N20) and b) NPAM-NAPr (N21-N25), cross-linked with different % mol MBA. Transmittance was
measured at 500 nm at a polymer concentration of 1 mgmL-1 in deionised water.
26 28 30 32 34 36 38 40 42 44 46 48 500
10
20
30
40
50
60
70
80
90
100 MBA 10%
MBA 20%
MBA 30%
MBA 40%
MBA 50%
NIPAM based nanogels cross-linked with MBA
Tra
nsm
itta
nce (
%)
at
500 n
m
Temperature (ºC)
N1N3N4N5VPTT 50% of Transmittance
N2
26 28 30 32 34 36 38 40 42 44 46 48 500
10
20
30
40
50
60
70
80
90
100
Tra
nsm
itta
nce
(%
) a
t 5
00
nm
Temperature (ºC)
NPAM based nanogels cross-linked with MBA
N6 N8
N9 N10
N7
27 30 33 36 39 42 45 48 51 54 57 60 630
10
20
30
40
50
60
70
80
90
100
NAPr based nanogels cross-linked with MBA
Tra
nsm
itta
nce
(%
) a
t 5
00
nm
Temperature (ºC)
N11N13N14N15 N12
a)
b)
c)
26 28 30 32 34 36 38 40 42 44 46 48 500
10
20
30
40
50
60
70
80
90
100 MBA 10%
MBA 20%
MBA 30%
MBA 40%
MBA 50%
NIPAM based nanogels cross-linked with MBA
Tra
nsm
itta
nce
(%
) a
t 5
00
nm
Temperature (ºC)
N1N3N4N5VPTT 50% of Transmittance
N2
26 28 30 32 34 36 38 40 42 44 46 48 500
10
20
30
40
50
60
70
80
90
100
Tra
nsm
itta
nce
(%
) a
t 5
00
nm
Temperature (ºC)
NPAM based nanogels cross-linked with MBA
N6 N8
N9 N10
N7
27 30 33 36 39 42 45 48 51 54 57 60 630
10
20
30
40
50
60
70
80
90
100
NAPr based nanogels cross-linked with MBA
Tra
nsm
itta
nce
(%
) a
t 5
00
nm
Temperature (ºC)
N11N13N14N15 N12
a)
b)
c)
a) b)
c)
26 28 30 32 34 36 38 40 42 44 46 48 500
10
20
30
40
50
60
70
80
90
100
NIPAM+NAPr based nanogels cross-linked with MBA
Tra
nsm
itta
nce
(%
) a
t 5
00 n
m
Temperature (ºC)
N16N18N19N20
N17
N21N23
N24
N25
N22
20 25 30 35 40 45 50 55 60 65 70 75 80
0
10
20
30
40
50
60
70
80
90
100
NPAM+NAPr nanogels cross-linked MBA
Tra
nsm
itta
nce (
%)
at
500 n
m
Temperature (ºC)
a)
b)
26 28 30 32 34 36 38 40 42 44 46 48 500
10
20
30
40
50
60
70
80
90
100
NIPAM+NAPr based nanogels cross-linked with MBA
Tra
nsm
itta
nce
(%
) a
t 5
00
nm
Temperature (ºC)
N16N18N19N20
N17
N21N23
N24
N25
N22
20 25 30 35 40 45 50 55 60 65 70 75 80
0
10
20
30
40
50
60
70
80
90
100
NPAM+NAPr nanogels cross-linked MBA
Tra
nsm
itta
nce (
%)
at
500 n
m
Temperature (ºC)
a)
b)
a) b)
SI page 21
Figure SI-42. Transmittance changes at 500 nm with heating - cooling cycles for nanogels N1, N6 and N11
(conc =1 mg ml-1). The temperature was cycled between 25 ºC and 40 °C, 34 °C or 55 °C for N1, N6 and N11,
respectively.
Figure SI-43. Dynamic light scattering measurements of a) nanogel N6 (NPAM-MBA 90:10 %mol) and
b) nanogel N30 (NPAM-A-Pro-OH-MBA 87.5:2.5:10 %mol). Inset: a) TEM image of N6, b) TEM image of N30,
non-stained and scale bar = 100 nm.
0 1 2 3 4 5 6 7
40
50
60
70
80
90
100
Tra
nsm
itta
nce (
%)
at
500 n
m
25 oC
Cycles
40 oC
a)
0 1 2 3 4 5 6 7
50
60
70
80
90
100 c)
Tra
nsm
itta
nce
(%)
at
500 n
m
55 oC
25 oC
Cycles
N1 N11
0 1 2 3 4 5 6 7
50
60
70
80
90
100
Tra
nsm
itta
nce
(%)
at
500 n
m
Cycles
25 oC
34 oC
N6
1 10 100 1000
0
5
10
15
20
25
30
35
40
Volu
me (
%)
Size (nm)
100 nm 100 nm
a)
b)
1 10 100 1000
0
5
10
15
20
25
Volu
me (
%)
Size (nm)
100 nm 100 nm
SI page 22
Figure SI-44. Zeta potential measurement of nanogel N26
Figure SI-45. Zeta potential measurement of nanogel N27
Figure SI-46. Zeta potential measurement of nanogel N28
SI page 23
Figure SI-47. Zeta potential measurement of nanogel N29
Figure SI-48. Zeta potential measurement of nanogel N30
Figure SI-49. Zeta potential measurement of nanogel N31
SI page 24
Figure SI-50. Zeta potential measurement of nanogel N30D
Figure SI-51. Transmittance changes with temperature for nanogels N26-N30, based on NPAM-10%MBA and
copolymerized with A-Pro-OH from 20 to 2.5%.
25 30 35 40 45 50 55 60 65 70 75 800
10
20
30
40
50
60
70
80
90
100
NPAM+A-Pro-OH based nanogels cross-linked with 10% MBA
20%
15%
10%
5%
Tra
nsm
itta
nce
(%
) a
t 5
00
nm
Temperature (ºC)
2.5%
N26
N27
N28
N29
N30
SI page 25
Figure SI-52. Photographs showing the visual change of nanogel N30 in water (conc =1mgmL-1) with
temperature at three different pHs (7.4, 6.5 and 5.2). Bottom photograph shows the solutions at a temperature
below the VPPT and the top one shows the solutions at a temperature above the VPTT.
Figure SI-53. Zeta potential measurement of nanogel N30 at pH 7.4.
ζ (N30, pH 7.4) = -19.1 ± 8.7 mV
SI page 26
Figure SI-54. Zeta potential measurement of nanogel N30 at pH 6.5.
Figure SI-55. Zeta potential measurement of nanogel N30 at pH 5.2.
Figure SI-56. Transmittance changes at 500 nm with the temperature for nanogel N31 (based on monomers
NPAM, AAc and NAPr) and N30D (based on monomers NPAM, A-Pro-OH) and loaded with NBA.