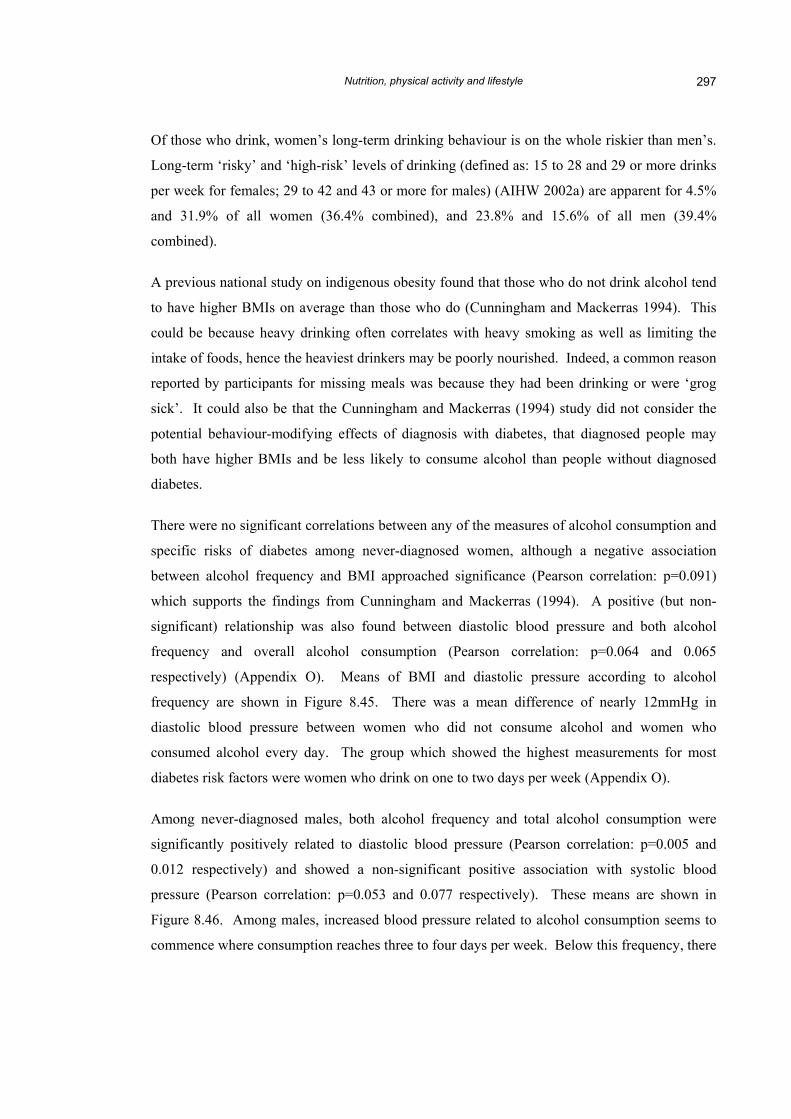
Questionnaire results (1): Nutrition, physical activity and lifestyle The previous chapter analysed diabetes risk in relation to birthweight and childhood growth. Even if the evidence to support an association between child growth and subsequent diabetes risk had been strong, features of the adult environment must also play a role. Their influence may be through being at odds with a childhood environment (such as in the programming hypothesis), or through exerting their influence early on in life and establishing a trajectory (such as overnutrition promoting perhaps too rapid weight growth among children). This chapter explores the proximal causes of diabetes, such as nutritional quality, level of physical activity and other lifestyle factors of alcohol and tobacco consumption, through the responses to the surveys that were conducted as part of the current study. These are discussed in terms of diabetes control and prevention within the community. The development of the survey questions and the coding of responses were presented in Section 5.4. 8 Responses to the food frequency questionnaire were analysed in relation to participant category: diagnosed (D), high-risk (H), low-risk (L) for females and males, and females who had been diagnosed at some stage with gestational diabetes (G). Food frequency questionnaire (FFQ) and lifestyle responses were also analysed in relation to FBSL, BMI, waist circumference, systolic and diastolic pressure and age. These were divided into quintiles for analysis. This risk factor analysis was performed for four different sub-groups of participants: all females, all males, never-diagnosed females and never-diagnosed males. Physical activity (leisure, occupational and total activity) levels, as determined by the method described in Section 5.4.1, were assessed in relation to diabetes risk. Patterns of alcohol consumption (frequency, quantity, and frequency * quantity) were tested to determine if there were differences relating to specific diabetes risk factors among never-diagnosed participants. Tobacco consumption was also assessed. Where nutrition and lifestyle responses from diagnosed participants differ from those who are high-risk, it is likely that diagnosis has informed and shaped their choices. Where those who high-risk provide similar responses to those who are diagnosed, but different from those who are low-risk, it is likely that the lifestyle factors may be contributing to diabetes risk. Unless specified otherwise, the significance tests performed on the data are one-way ANOVAs. All frequency data (such as food frequency and alcohol consumption) were log transformed to
Transcript
8. Questionnaire results (1): Nutrition, physical activity and lifestyle
The previous chapter analysed diabetes risk in relation to birthweight and childhood growth.
Even if the evidence to support an association between child growth and subsequent diabetes
risk had been strong, features of the adult environment must also play a role. Their influence
may be through being at odds with a childhood environment (such as in the programming
hypothesis), or through exerting their influence early on in life and establishing a trajectory
(such as overnutrition promoting perhaps too rapid weight growth among children). This
chapter explores the proximal causes of diabetes, such as nutritional quality, level of physical
activity and other lifestyle factors of alcohol and tobacco consumption, through the responses to
the surveys that were conducted as part of the current study. These are discussed in terms of
diabetes control and prevention within the community. The development of the survey
questions and the coding of responses were presented in Section 5.4.
8
Responses to the food frequency questionnaire were analysed in relation to participant category:
diagnosed (D), high-risk (H), low-risk (L) for females and males, and females who had been
diagnosed at some stage with gestational diabetes (G). Food frequency questionnaire (FFQ) and
lifestyle responses were also analysed in relation to FBSL, BMI, waist circumference, systolic
and diastolic pressure and age. These were divided into quintiles for analysis. This risk factor
analysis was performed for four different sub-groups of participants: all females, all males,
never-diagnosed females and never-diagnosed males.
Physical activity (leisure, occupational and total activity) levels, as determined by the method
described in Section 5.4.1, were assessed in relation to diabetes risk. Patterns of alcohol
consumption (frequency, quantity, and frequency * quantity) were tested to determine if there
were differences relating to specific diabetes risk factors among never-diagnosed participants.
Tobacco consumption was also assessed.
Where nutrition and lifestyle responses from diagnosed participants differ from those who are
high-risk, it is likely that diagnosis has informed and shaped their choices. Where those who
high-risk provide similar responses to those who are diagnosed, but different from those who
are low-risk, it is likely that the lifestyle factors may be contributing to diabetes risk. Unless
specified otherwise, the significance tests performed on the data are one-way ANOVAs. All
frequency data (such as food frequency and alcohol consumption) were log transformed to
Nutrition, physical activity and lifestyle 245
better fit a normal distribution (ANOVA assumes a normal distribution). Details of statistical
results are provided in Appendices M to P.
8.1. Nutrition results
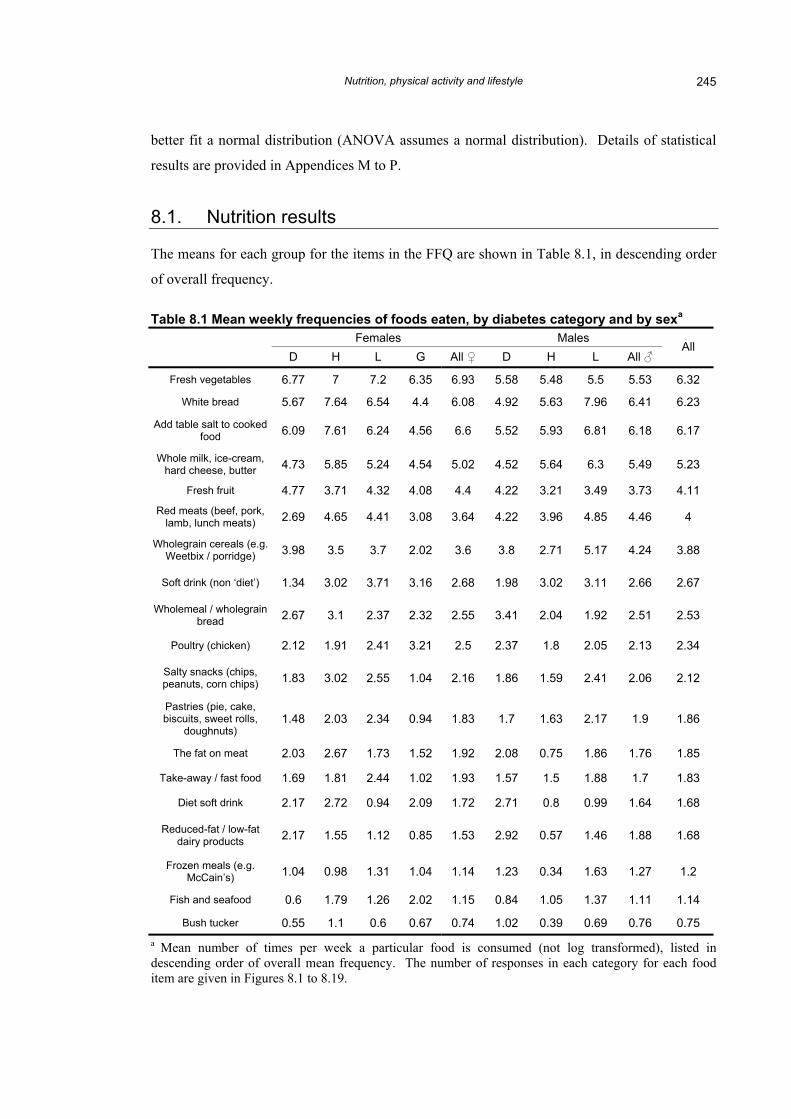
The means for each group for the items in the FFQ are shown in Table 8.1, in descending order
of overall frequency.
Table 8.1 Mean weekly frequencies of foods eaten, by diabetes category and by sexa
Fish and seafood 0.6 1.79 1.26 2.02 1.15 0.84 1.05 1.37 1.11 1.14
Bush tucker 0.55 1.1 0.6 0.67 0.74 1.02 0.39 0.69 0.76 0.75 a Mean number of times per week a particular food is consumed (not log transformed), listed in descending order of overall mean frequency. The number of responses in each category for each food item are given in Figures 8.1 to 8.19.
Nutrition, physical activity and lifestyle 246
8.1.1. Food frequencies and overall diabetes risk
Each item on the food frequency questionnaire was analysed to determine whether there were
any differences in the frequencies of consumption of certain foods between categories of risk
(for example: diagnosed, high and low). Results of frequency comparisons are presented in the
order in which they appeared in the survey, so that related foods, such as fruit and vegetables,
are discussed together (Figures 8.1 to 8.19).
Salt
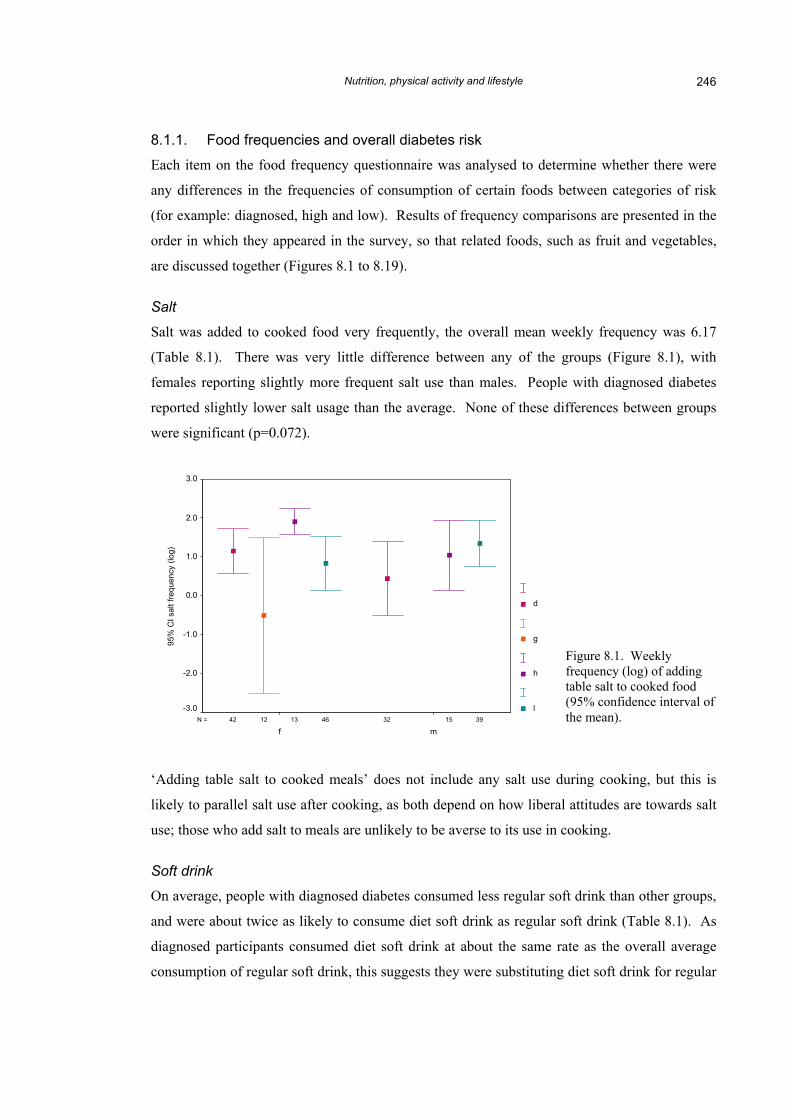
Salt was added to cooked food very frequently, the overall mean weekly frequency was 6.17
(Table 8.1). There was very little difference between any of the groups (Figure 8.1), with
females reporting slightly more frequent salt use than males. People with diagnosed diabetes
reported slightly lower salt usage than the average. None of these differences between groups
were significant (p=0.072).
3946 151312 3242N =
mf
95%
CI s
alt f
requ
ency
(log
)
3.0
2.0
1.0
0.0
-1.0
-2.0
-3.0
d
g
h
l
Figure 8.1. Weekly frequency (log) of adding table salt to cooked food (95% confidence interval of the mean).
‘Adding table salt to cooked meals’ does not include any salt use during cooking, but this is
likely to parallel salt use after cooking, as both depend on how liberal attitudes are towards salt
use; those who add salt to meals are unlikely to be averse to its use in cooking.
Soft drink
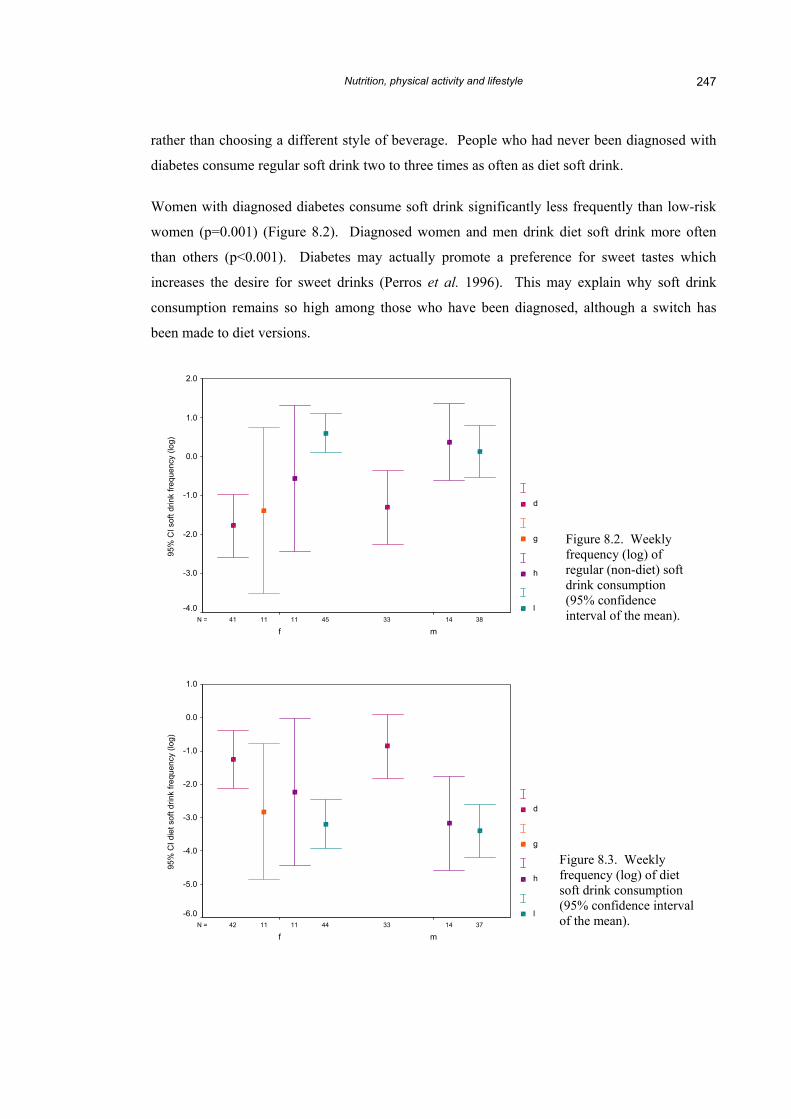
On average, people with diagnosed diabetes consumed less regular soft drink than other groups,
and were about twice as likely to consume diet soft drink as regular soft drink (Table 8.1). As
diagnosed participants consumed diet soft drink at about the same rate as the overall average
consumption of regular soft drink, this suggests they were substituting diet soft drink for regular
Nutrition, physical activity and lifestyle 247
rather than choosing a different style of beverage. People who had never been diagnosed with
diabetes consume regular soft drink two to three times as often as diet soft drink.
Women with diagnosed diabetes consume soft drink significantly less frequently than low-risk
women (p=0.001) (Figure 8.2). Diagnosed women and men drink diet soft drink more often
than others (p<0.001). Diabetes may actually promote a preference for sweet tastes which
increases the desire for sweet drinks (Perros et al. 1996). This may explain why soft drink
consumption remains so high among those who have been diagnosed, although a switch has
been made to diet versions.
3845 141111 3341N =
mf
95%
CI s
oft d
rink
frequ
ency
(log
)
2.0
1.0
0.0
-1.0
-2.0
-3.0
-4.0
d
g
h
l
3744 141111 3342N =
mf
95%
CI d
iet s
oft d
rink
frequ
ency
(log
)
1.0
0.0
-1.0
-2.0
-3.0
-4.0
-5.0
-6.0
d
g
h
l
Figure 8.3. Weekly frequency (log) of diet soft drink consumption (95% confidence interval of the mean).
Figure 8.2. Weekly frequency (log) of regular (non-diet) soft drink consumption (95% confidence interval of the mean).
Nutrition, physical activity and lifestyle 248
The confidence interval was largest for women in the high-risk group, which may reflect
greatest variability in consumption in addition to small sample size. It is possible that some of
the high-risk women see themselves as being at risk due to their higher BMIs, and have acted on
the message to cut down on sugar consumption. This is supported on closer examination.
Among women who had never been diagnosed, those whose BMI fell into the highest quintile
were drinking diet soft drink significantly more often (log transformed frequency = –0.32) than
those in the lower two quintiles (quintile 1: frequency = –3.97, quintile 2: frequency = –4.19,
p=0.037 and 0.044 respectively). However, as higher-BMI women are also drinking the same
amount of non-diet soft drink as other women (p=0.999), it could be that they are attempting to
improve their diet; they may have been drinking more previously but have now substituted some
of their soft drink consumption with a perceived healthier option.
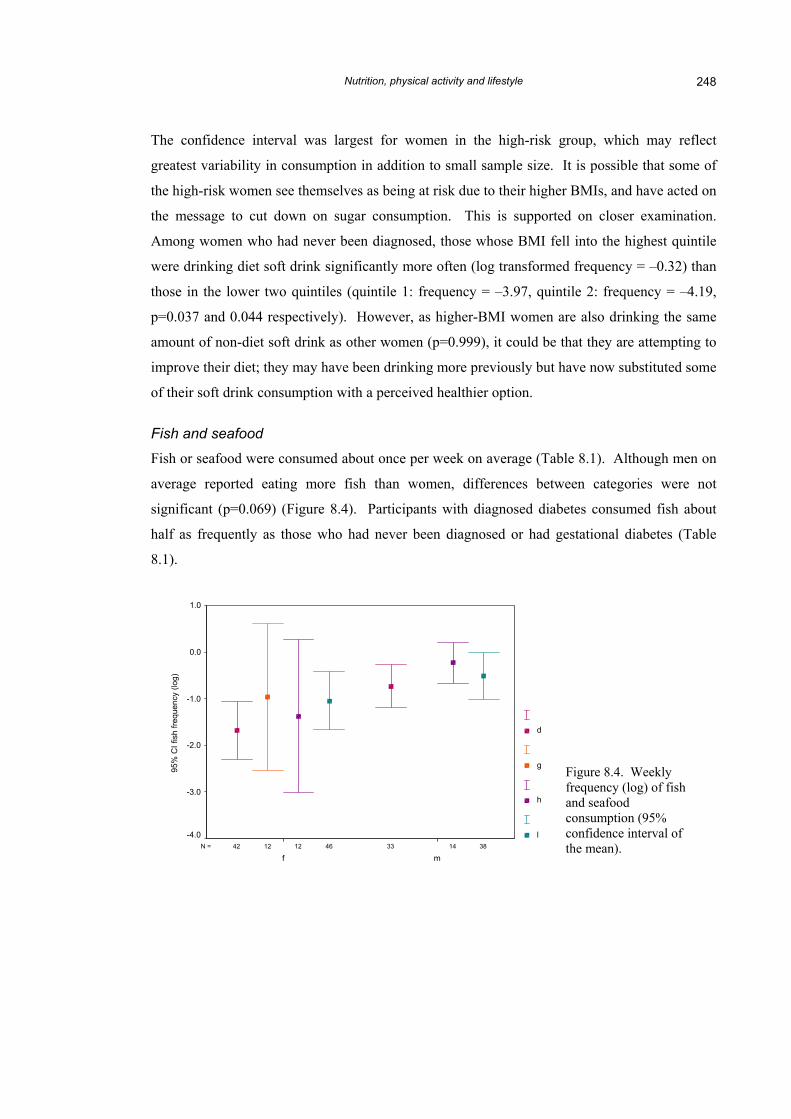
Fish and seafood
Fish or seafood were consumed about once per week on average (Table 8.1). Although men on
average reported eating more fish than women, differences between categories were not
significant (p=0.069) (Figure 8.4). Participants with diagnosed diabetes consumed fish about
half as frequently as those who had never been diagnosed or had gestational diabetes (Table
8.1).
3846 141212 3342N =
mf
95%
CI f
ish
frequ
ency
(log
)
1.0
0.0
-1.0
-2.0
-3.0
-4.0
d
g
h
l
Figure 8.4. Weekly frequency (log) of fish and seafood consumption (95% confidence interval of the mean).
Nutrition, physical activity and lifestyle 249
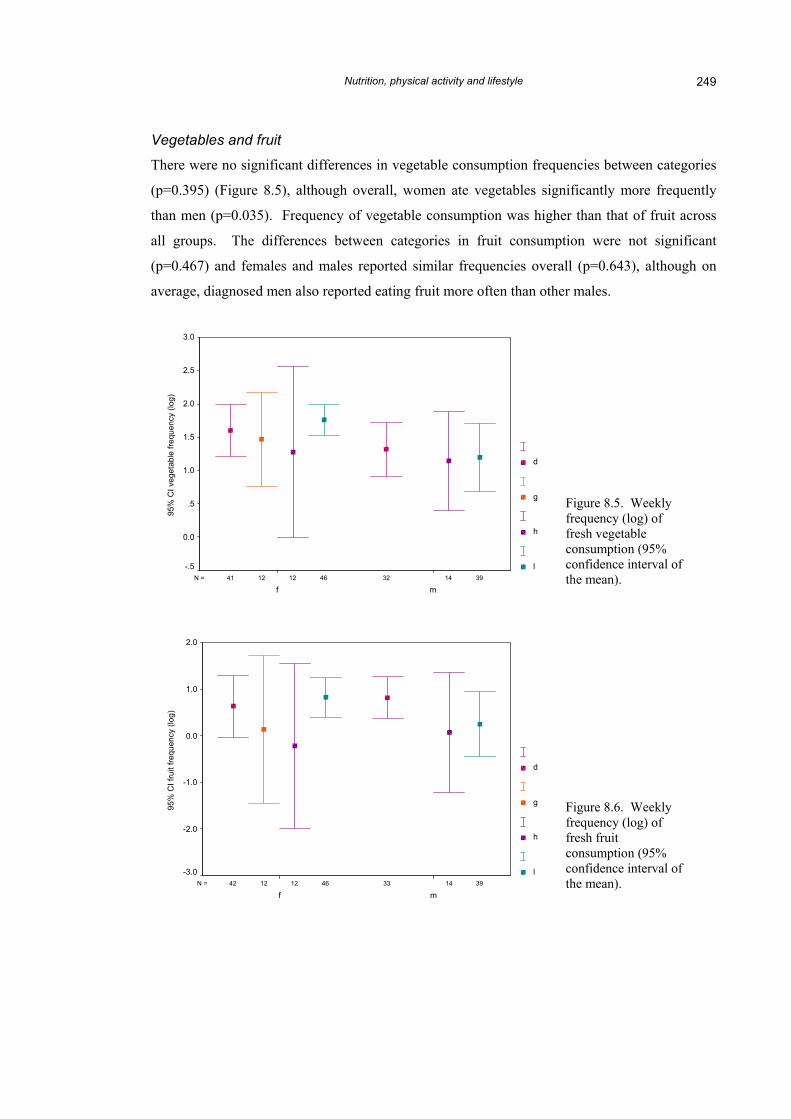
Vegetables and fruit
There were no significant differences in vegetable consumption frequencies between categories
(p=0.395) (Figure 8.5), although overall, women ate vegetables significantly more frequently
than men (p=0.035). Frequency of vegetable consumption was higher than that of fruit across
all groups. The differences between categories in fruit consumption were not significant
(p=0.467) and females and males reported similar frequencies overall (p=0.643), although on
average, diagnosed men also reported eating fruit more often than other males.
3946 141212 3241N =
mf
95%
CI v
eget
able
freq
uenc
y (lo
g)
3.0
2.5
2.0
1.5
1.0
.5
0.0
-.5
d
g
h
l
Figure 8.5. Weekly frequency (log) of fresh vegetable consumption (95% confidence interval of the mean).
Figure 8.6. Weekly frequency (log) of fresh fruit consumption (95% confidence interval of the mean). 3946 141212 3342N =
mf
95%
CI f
ruit
frequ
ency
(log
)
2.0
1.0
0.0
-1.0
-2.0
-3.0
d
g
h
l
Nutrition, physical activity and lifestyle 250
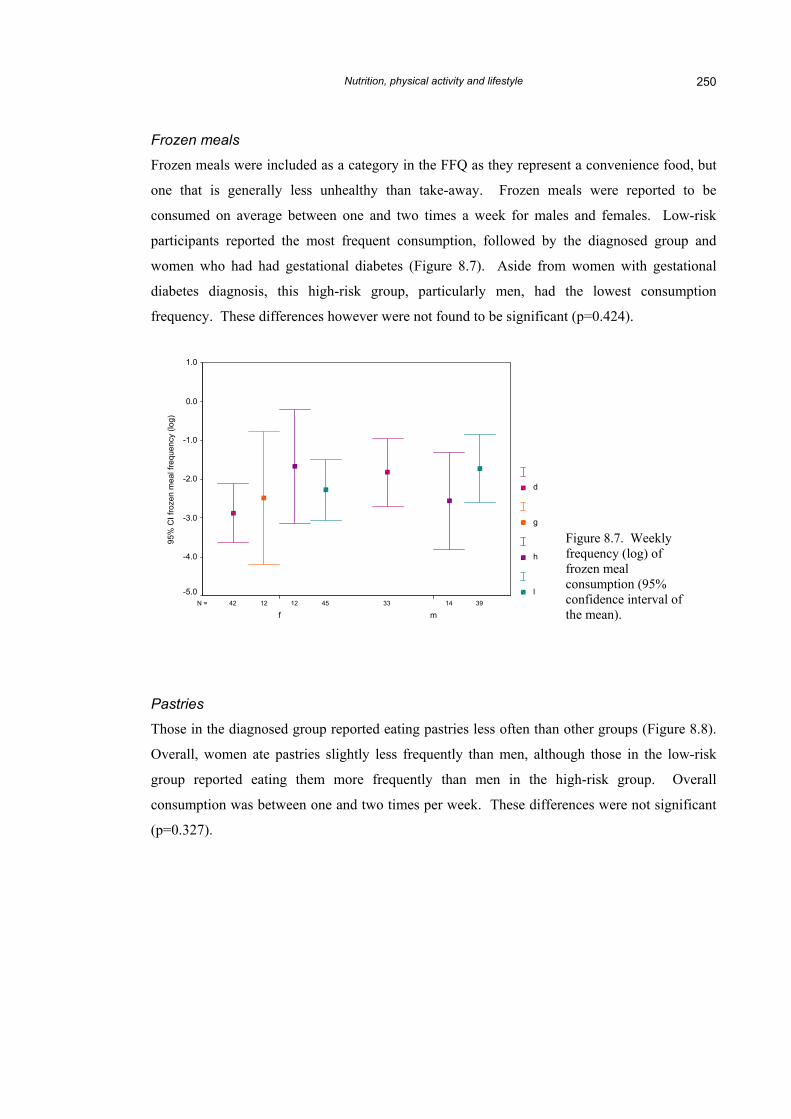
Frozen meals
Frozen meals were included as a category in the FFQ as they represent a convenience food, but
one that is generally less unhealthy than take-away. Frozen meals were reported to be
consumed on average between one and two times a week for males and females. Low-risk
participants reported the most frequent consumption, followed by the diagnosed group and
women who had had gestational diabetes (Figure 8.7). Aside from women with gestational
diabetes diagnosis, this high-risk group, particularly men, had the lowest consumption
frequency. These differences however were not found to be significant (p=0.424).
3945 141212 3342N =
mf
95%
CI f
roze
n m
eal f
requ
ency
(log
)
1.0
0.0
-1.0
-2.0
-3.0
-4.0
-5.0
d
g
h
l
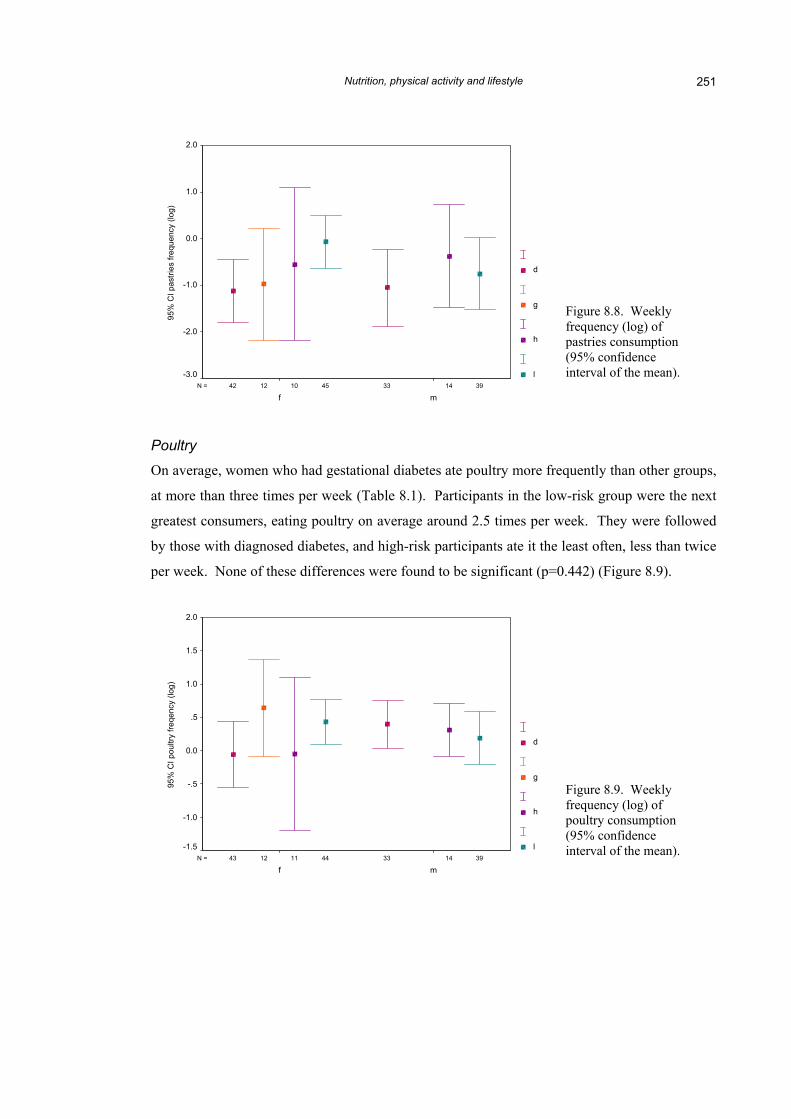
Pastries
Those in the diagnosed group reported eating pastries less often than
Overall, women ate pastries slightly less frequently than men, altho
group reported eating them more frequently than men in the h
consumption was between one and two times per week. These diffe
(p=0.327).
Figure 8.7. Weekly frequency (log) of frozen meal consumption (95% confidence interval ofthe mean).
other groups (Figure 8.8).
ugh those in the low-risk
igh-risk group. Overall
rences were not significant
Nutrition, physical activity and lifestyle 251
3945 141012 3342N =
mf
95%
CI p
astri
es fr
eque
ncy
(log)
2.0
1.0
0.0
-1.0
-2.0
-3.0
d
g
h
l
Poultry
On average, women who had gestational diabetes ate poultry more frequently than other groups,
at more than three times per week (Table 8.1). Participants in the low-risk group were the next
greatest consumers, eating poultry on average around 2.5 times per week. They were followed
by those with diagnosed diabetes, and high-risk participants ate it the least often, less than twice
per week. None of these differences were found to be significant (p=0.442) (Figure 8.9).
Figure 8.8. Weekly frequency (log) of pastries consumption (95% confidence interval of the mean).
Figure 8.9. Weekly frequency (log) of poultry consumption (95% confidence interval of the mean).
3944 141112 3343N =
mf
95%
CI p
oultr
y fre
qenc
y (lo
g)
2.0
1.5
1.0
.5
0.0
-.5
-1.0
-1.5
d
g
h
l
Nutrition, physical activity and lifestyle 252
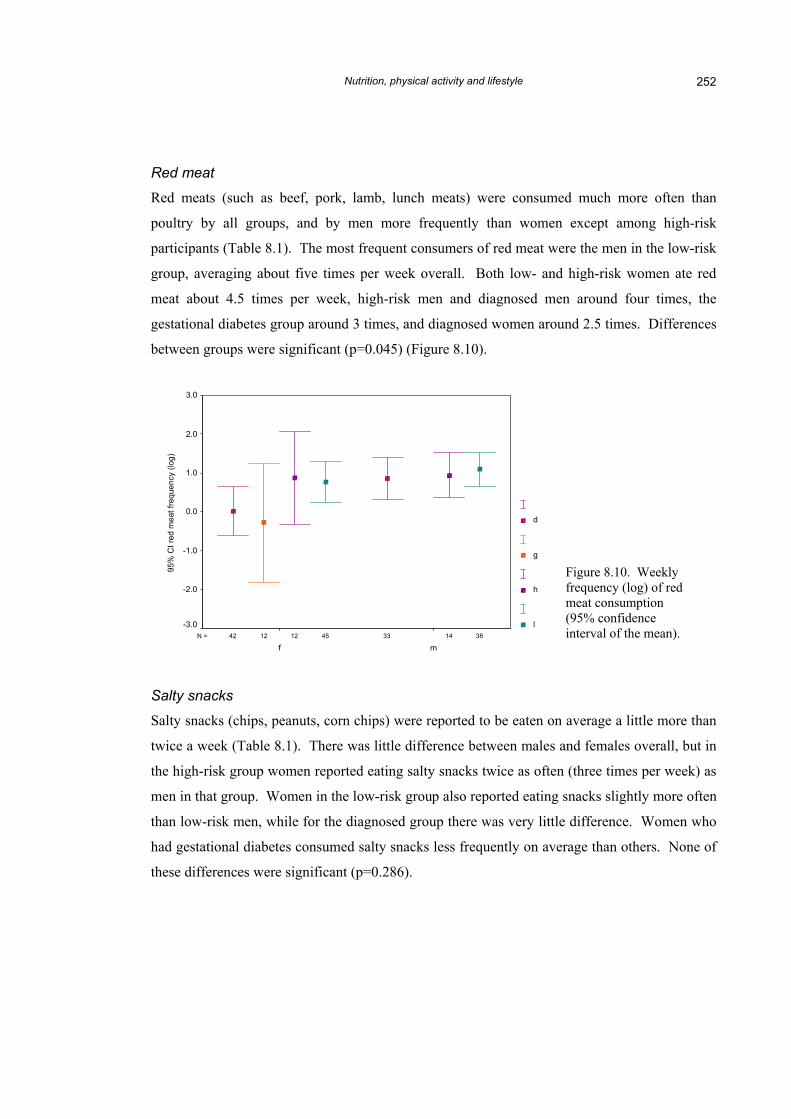
Red meat
Red meats (such as beef, pork, lamb, lunch meats) were consumed much more often than
poultry by all groups, and by men more frequently than women except among high-risk
participants (Table 8.1). The most frequent consumers of red meat were the men in the low-risk
group, averaging about five times per week overall. Both low- and high-risk women ate red
meat about 4.5 times per week, high-risk men and diagnosed men around four times, the
gestational diabetes group around 3 times, and diagnosed women around 2.5 times. Differences
between groups were significant (p=0.045) (Figure 8.10).
3845 141212 3342N =
mf
95%
CI r
ed m
eat f
requ
ency
(log
)
3.0
2.0
1.0
0.0
-1.0
-2.0
-3.0
d
g
h
l
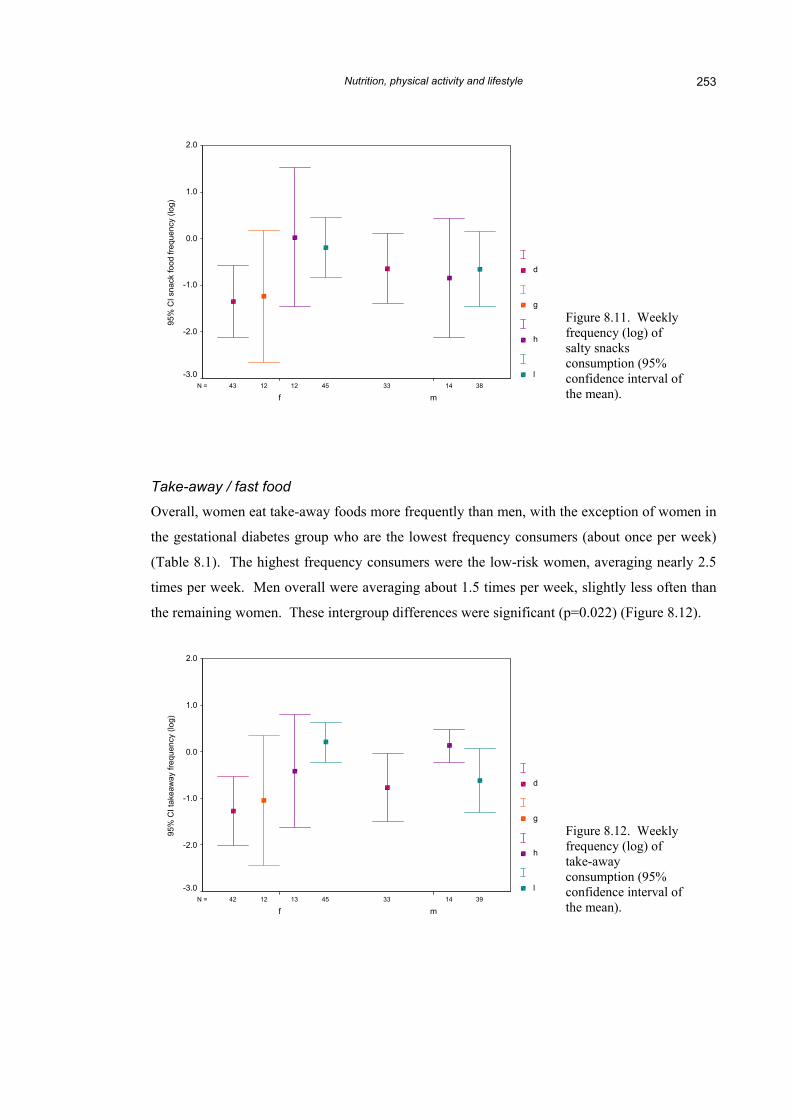
Salty snacks
Salty snacks (chips, peanuts, corn chips) were reported to be eaten on
twice a week (Table 8.1). There was little difference between males
the high-risk group women reported eating salty snacks twice as ofte
men in that group. Women in the low-risk group also reported eating
than low-risk men, while for the diagnosed group there was very littl
had gestational diabetes consumed salty snacks less frequently on av
these differences were significant (p=0.286).
Figure 8.10. Weekly frequency (log) of red meat consumption (95% confidence interval of the mean).
average a little more than
and females overall, but in
n (three times per week) as
snacks slightly more often
e difference. Women who
erage than others. None of
Nutrition, physical activity and lifestyle 253
3845 141212 3343N =
mf
95%
CI s
nack
food
freq
uenc
y (lo
g)
2.0
1.0
0.0
-1.0
-2.0
-3.0
d
g
h
l
Take-away / fast food
Overall, women eat take-away foods more frequently than men, with
the gestational diabetes group who are the lowest frequency consum
(Table 8.1). The highest frequency consumers were the low-risk wo
times per week. Men overall were averaging about 1.5 times per we
the remaining women. These intergroup differences were significant
3945 141312 3342N =
mf
95%
CI t
akea
way
freq
uenc
y (lo
g)
2.0
1.0
0.0
-1.0
-2.0
-3.0
d
g
h
l
Figure 8.11. Weekly frequency (log) of salty snacks consumption (95% confidence interval ofthe mean).
the exception of women in
ers (about once per week)
men, averaging nearly 2.5
ek, slightly less often than
(p=0.022) (Figure 8.12).
Figure 8.12. Weekly frequency (log) of take-away consumption (95% confidence interval ofthe mean).
Nutrition, physical activity and lifestyle 254
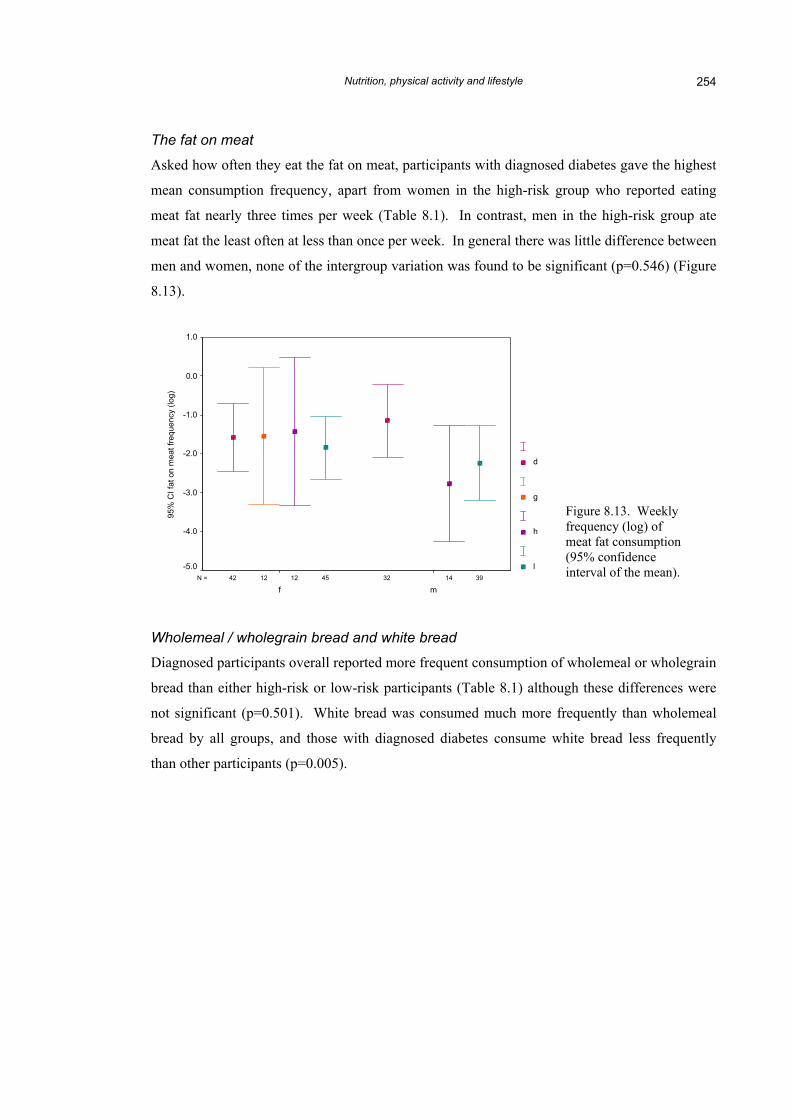
The fat on meat
Asked how often they eat the fat on meat, participants with diagnosed diabetes gave the highest
mean consumption frequency, apart from women in the high-risk group who reported eating
meat fat nearly three times per week (Table 8.1). In contrast, men in the high-risk group ate
meat fat the least often at less than once per week. In general there was little difference between
men and women, none of the intergroup variation was found to be significant (p=0.546) (Figure
8.13).
3945 141212 3242N =
mf
95%
CI f
at o
n m
eat f
requ
ency
(log
)
1.0
0.0
-1.0
-2.0
-3.0
-4.0
-5.0
d
g
h
l
Figure 8.13. Weekly frequency (log) of meat fat consumption (95% confidence interval of the mean).
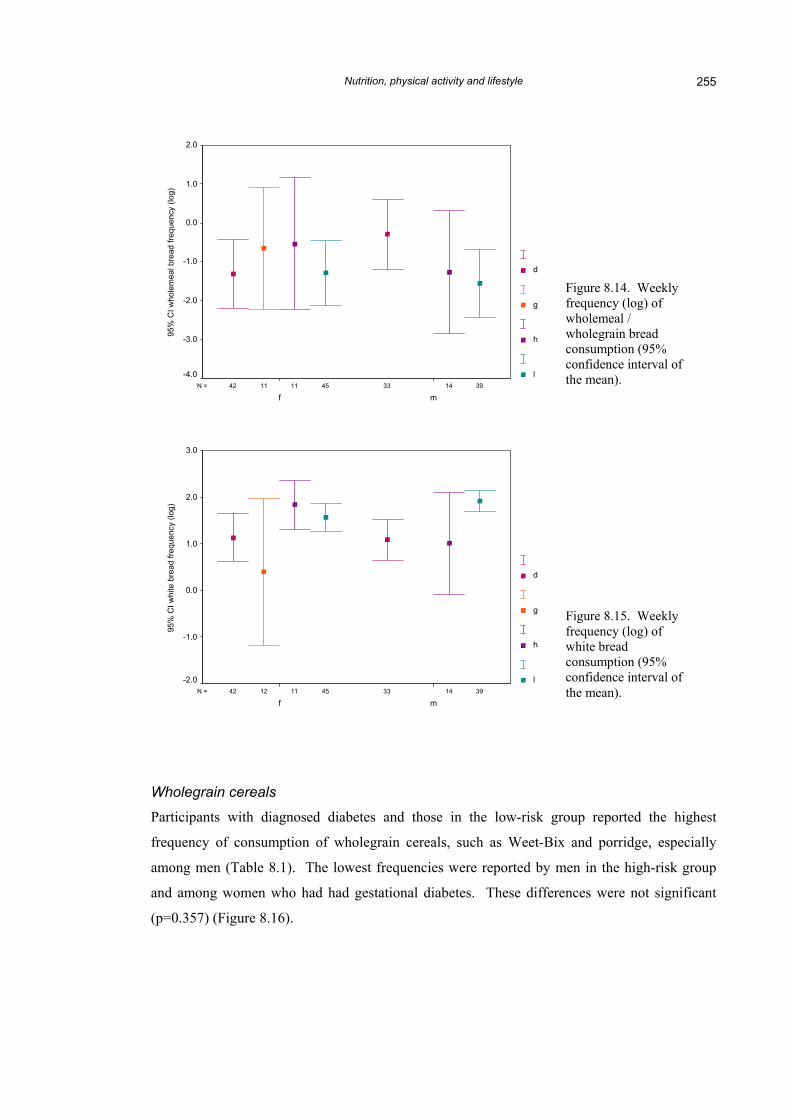
Wholemeal / wholegrain bread and white bread
Diagnosed participants overall reported more frequent consumption of wholemeal or wholegrain
bread than either high-risk or low-risk participants (Table 8.1) although these differences were
not significant (p=0.501). White bread was consumed much more frequently than wholemeal
bread by all groups, and those with diagnosed diabetes consume white bread less frequently
than other participants (p=0.005).
Nutrition, physical activity and lifestyle 255
3945 141111 3342N =
mf
95%
CI w
hole
mea
l bre
ad fr
eque
ncy
(log)
2.0
1.0
0.0
-1.0
-2.0
-3.0
-4.0
d
g
h
l
3945 141112 3342N =
mf
95%
CI w
hite
bre
ad fr
eque
ncy
(log)
3.0
2.0
1.0
0.0
-1.0
-2.0
d
g
h
l
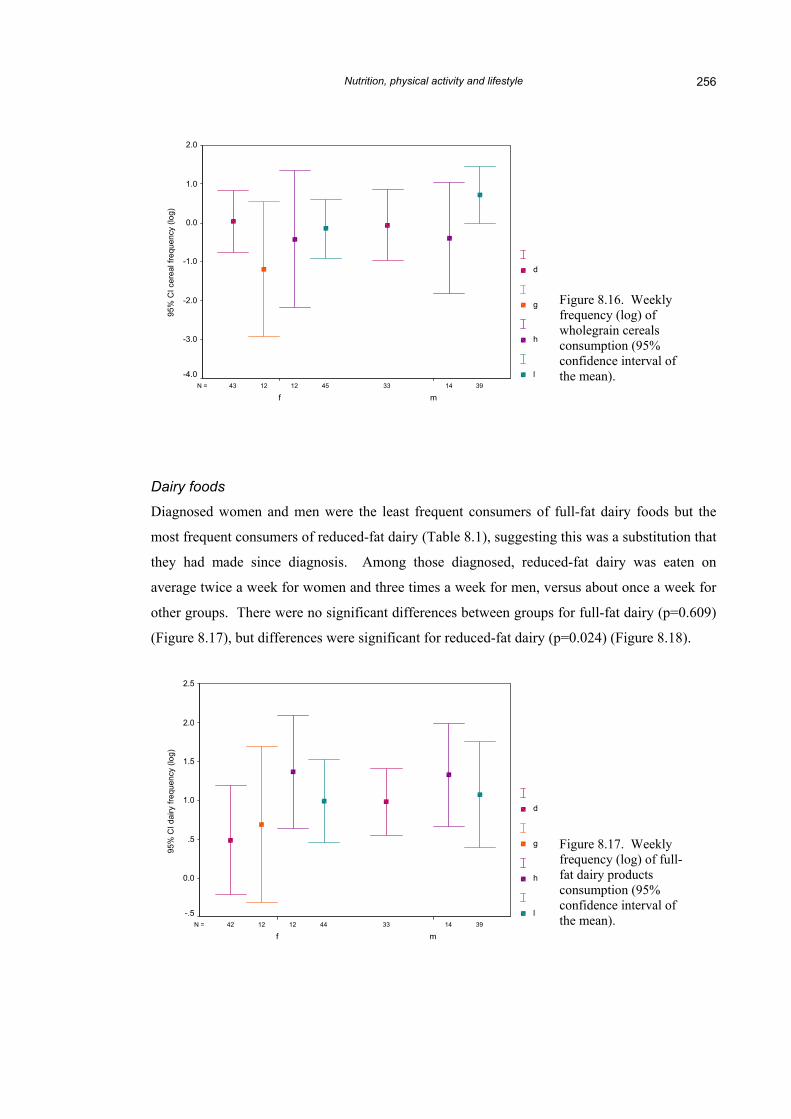
Wholegrain cereals
Participants with diagnosed diabetes and those in the low-risk g
frequency of consumption of wholegrain cereals, such as Weet-Bi
among men (Table 8.1). The lowest frequencies were reported by m
and among women who had had gestational diabetes. These differ
(p=0.357) (Figure 8.16).
Figure 8.14. Weekly frequency (log) of wholemeal / wholegrain bread consumption (95% confidence interval ofthe mean).
Figure 8.15. Weekly frequency (log) of white bread consumption (95% confidence interval of the mean).
roup reported the highest
x and porridge, especially
en in the high-risk group
ences were not significant
Nutrition, physical activity and lifestyle 256
3945 141212 3343N =
mf
95%
CI c
erea
l fre
quen
cy (l
og)
2.0
1.0
0.0
-1.0
-2.0
-3.0
-4.0
d
g
h
l
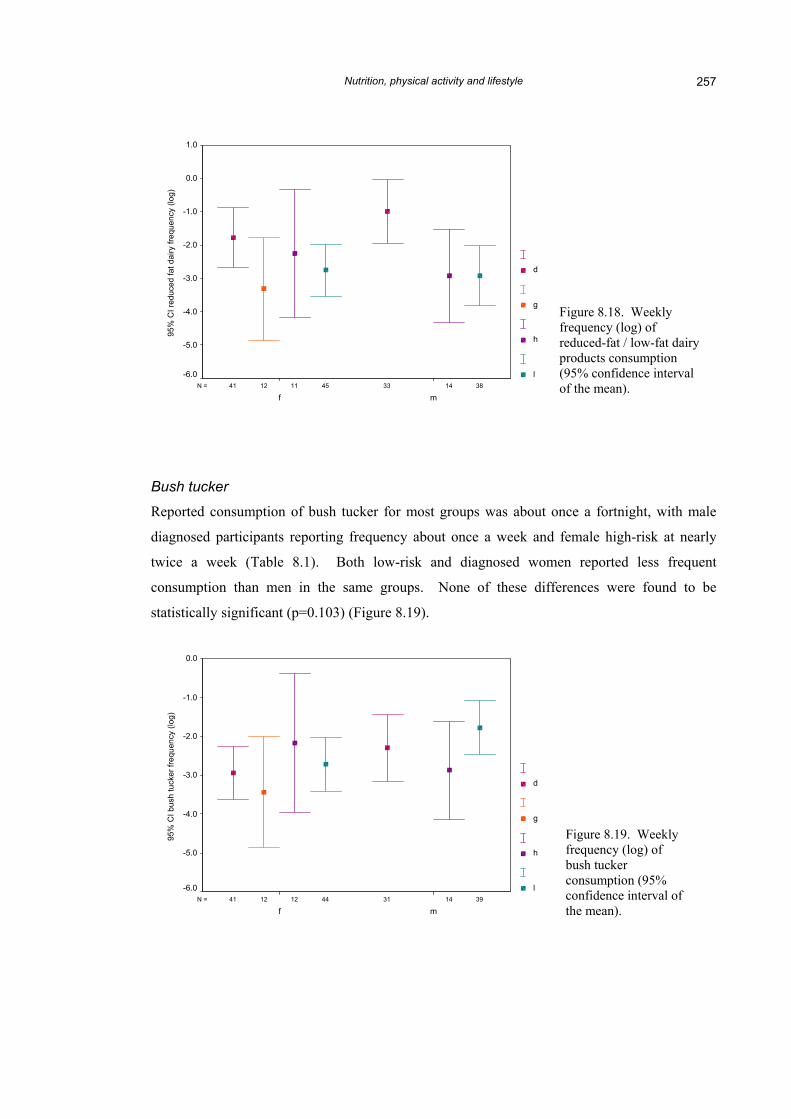
Dairy foods
Diagnosed women and men were the least frequent consumers of
most frequent consumers of reduced-fat dairy (Table 8.1), suggesting
they had made since diagnosis. Among those diagnosed, reduc
average twice a week for women and three times a week for men, v
other groups. There were no significant differences between groups
(Figure 8.17), but differences were significant for reduced-fat dairy (
3944 141212 3342N =
mf
95%
CI d
airy
freq
uenc
y (lo
g)
2.5
2.0
1.5
1.0
.5
0.0
-.5
d
g
h
l
Figure 8.16. Weekly frequency (log) of wholegrain cereals consumption (95% confidence interval ofthe mean).
full-fat dairy foods but the
this was a substitution that
ed-fat dairy was eaten on
ersus about once a week for
for full-fat dairy (p=0.609)
p=0.024) (Figure 8.18).
Figure 8.17. Weekly frequency (log) of full-fat dairy products consumption (95% confidence interval of the mean).
Nutrition, physical activity and lifestyle 257
3845 141112 3341N =
mf
95%
CI r
educ
ed fa
t dai
ry fr
eque
ncy
(log)
1.0
0.0
-1.0
-2.0
-3.0
-4.0
-5.0
-6.0
d
g
h
l
Bush tucker
Reported consumption of bush tucker for most groups was about once a fortnight, with male
diagnosed participants reporting frequency about once a week and female high-risk at nearly
twice a week (Table 8.1). Both low-risk and diagnosed women reported less frequent
consumption than men in the same groups. None of these differences were found to be
Figure 8.18. Weekly frequency (log) of reduced-fat / low-fat dairy products consumption (95% confidence interval of the mean).
Figure 8.19. Weekly frequency (log) of bush tucker consumption (95% confidence interval of the mean).
3944 141212 3141N =
mf
95%
CI b
ush
tuck
er fr
eque
ncy
(log)
0.0
-1.0
-2.0
-3.0
-4.0
-5.0
-6.0
d
g
h
l
Nutrition, physical activity and lifestyle 258
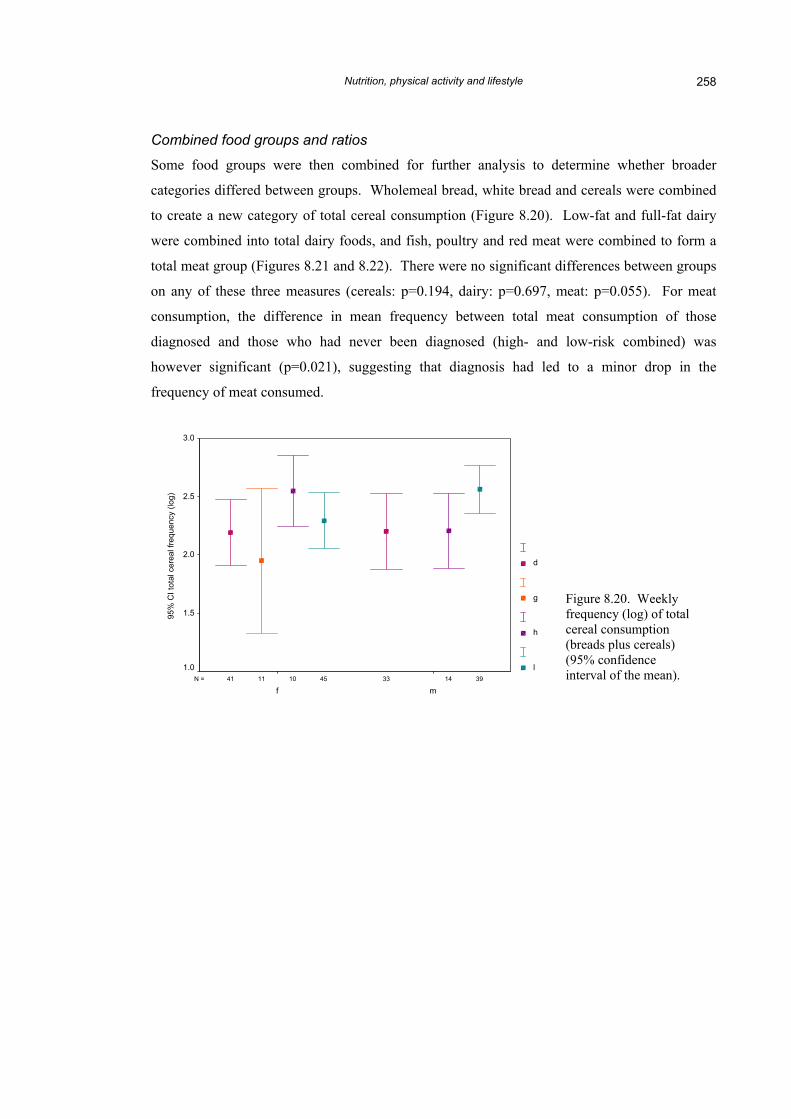
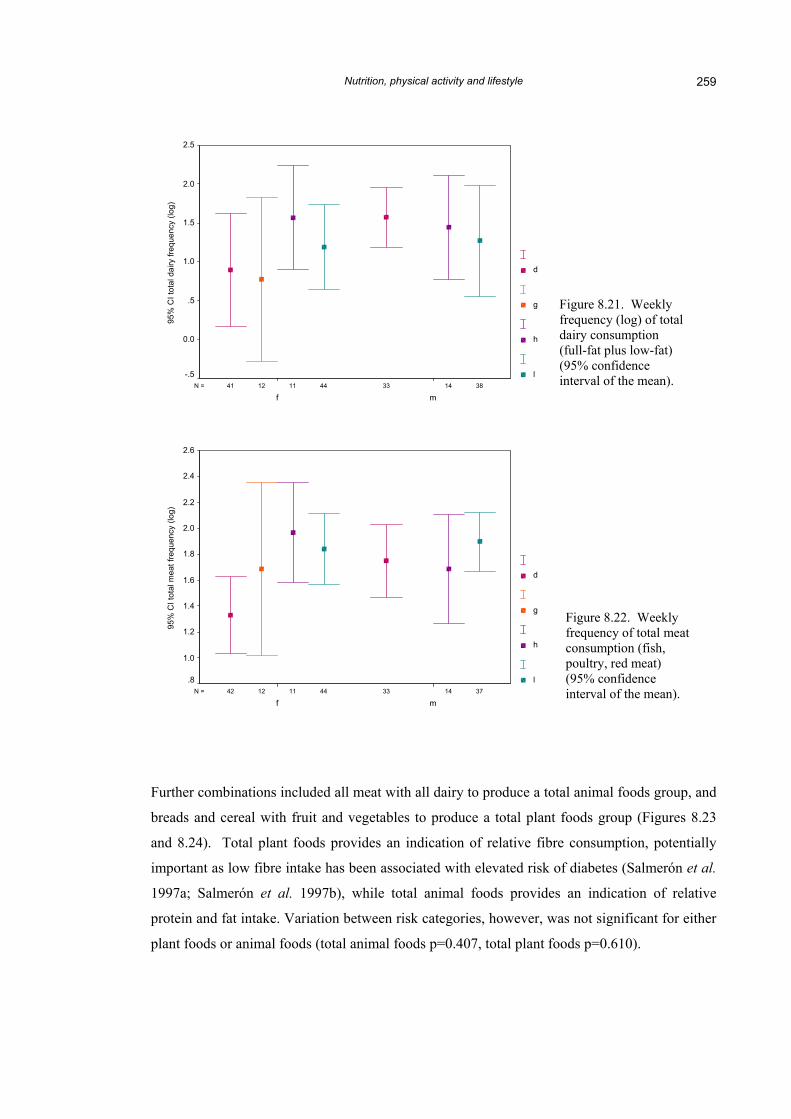
Combined food groups and ratios
Some food groups were then combined for further analysis to determine whether broader
categories differed between groups. Wholemeal bread, white bread and cereals were combined
to create a new category of total cereal consumption (Figure 8.20). Low-fat and full-fat dairy
were combined into total dairy foods, and fish, poultry and red meat were combined to form a
total meat group (Figures 8.21 and 8.22). There were no significant differences between groups
on any of these three measures (cereals: p=0.194, dairy: p=0.697, meat: p=0.055). For meat
consumption, the difference in mean frequency between total meat consumption of those
diagnosed and those who had never been diagnosed (high- and low-risk combined) was
however significant (p=0.021), suggesting that diagnosis had led to a minor drop in the
frequency of meat consumed.
3945 141011 3341N =
mf
95%
CI t
otal
cer
eal f
requ
ency
(log
)
3.0
2.5
2.0
1.5
1.0
d
g
h
l
Figure 8.20. Weekly frequency (log) of total cereal consumption (breads plus cereals) (95% confidence interval of the mean).
Nutrition, physical activity and lifestyle 259
3844 141112 3341N =
mf
95%
CI t
otal
dai
ry fr
eque
ncy
(log)
2.5
2.0
1.5
1.0
.5
0.0
-.5
d
g
h
l
Figure 8.21. Weekly frequency (log) of total dairy consumption (full-fat plus low-fat) (95% confidence interval of the mean).
Figure 8.22. Weekly frequency of total meat consumption (fish, poultry, red meat) (95% confidence interval of the mean). 3744 141112 3342N =
mf
95%
CI t
otal
mea
t fre
quen
cy (l
og)
2.6
2.4
2.2
2.0
1.8
1.6
1.4
1.2
1.0
.8
d
g
h
l
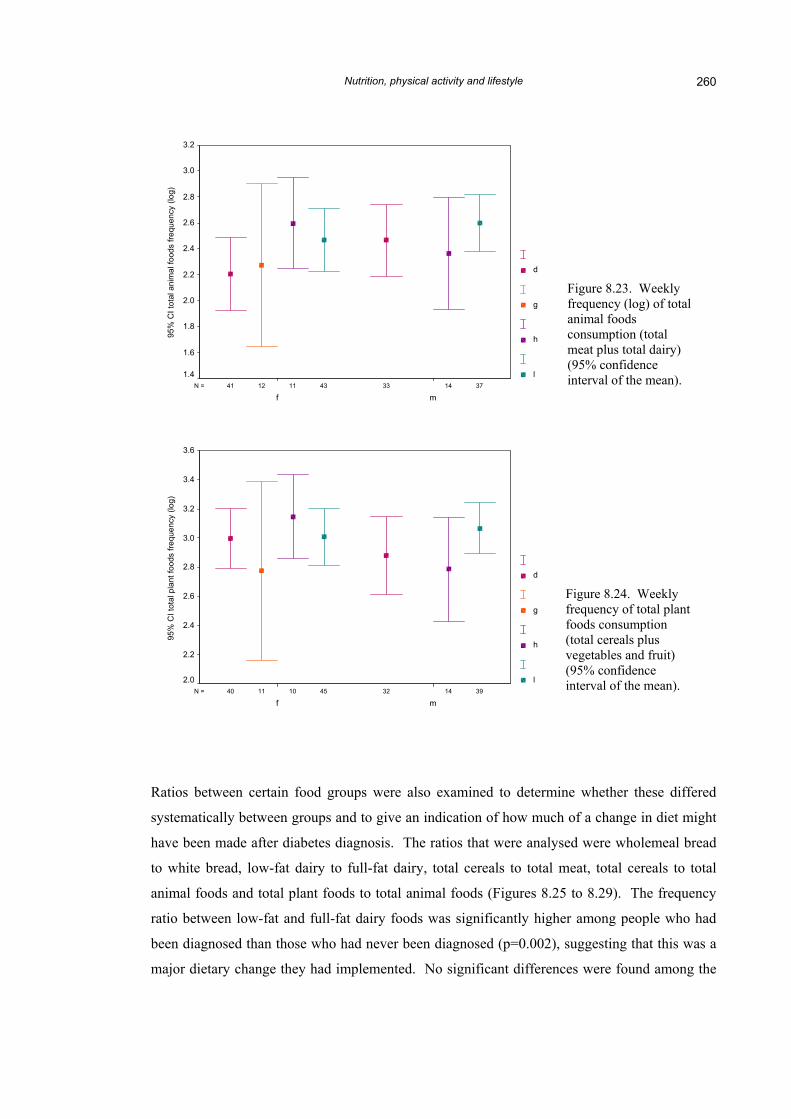
Further combinations included all meat with all dairy to produce a total animal foods group, and
breads and cereal with fruit and vegetables to produce a total plant foods group (Figures 8.23
and 8.24). Total plant foods provides an indication of relative fibre consumption, potentially
important as low fibre intake has been associated with elevated risk of diabetes (Salmerón et al.
1997a; Salmerón et al. 1997b), while total animal foods provides an indication of relative
protein and fat intake. Variation between risk categories, however, was not significant for either
plant foods or animal foods (total animal foods p=0.407, total plant foods p=0.610).
Nutrition, physical activity and lifestyle 260
3743 141112 3341N =
mf
95%
CI t
otal
ani
mal
food
s fre
quen
cy (l
og)
3.2
3.0
2.8
2.6
2.4
2.2
2.0
1.8
1.6
1.4
d
g
h
l
Figure 8.23. Weekly frequency (log) of total animal foods consumption (total meat plus total dairy) (95% confidence interval of the mean).
Figure 8.24. Weekly frequency of total plantfoods consumption (total cereals plus vegetables and fruit) (95% confidence interval of the mean). 3945 141011 3240N =
mf
95%
CI t
otal
pla
nt fo
ods
frequ
ency
(log
)
3.6
3.4
3.2
3.0
2.8
2.6
2.4
2.2
2.0
d
g
h
l
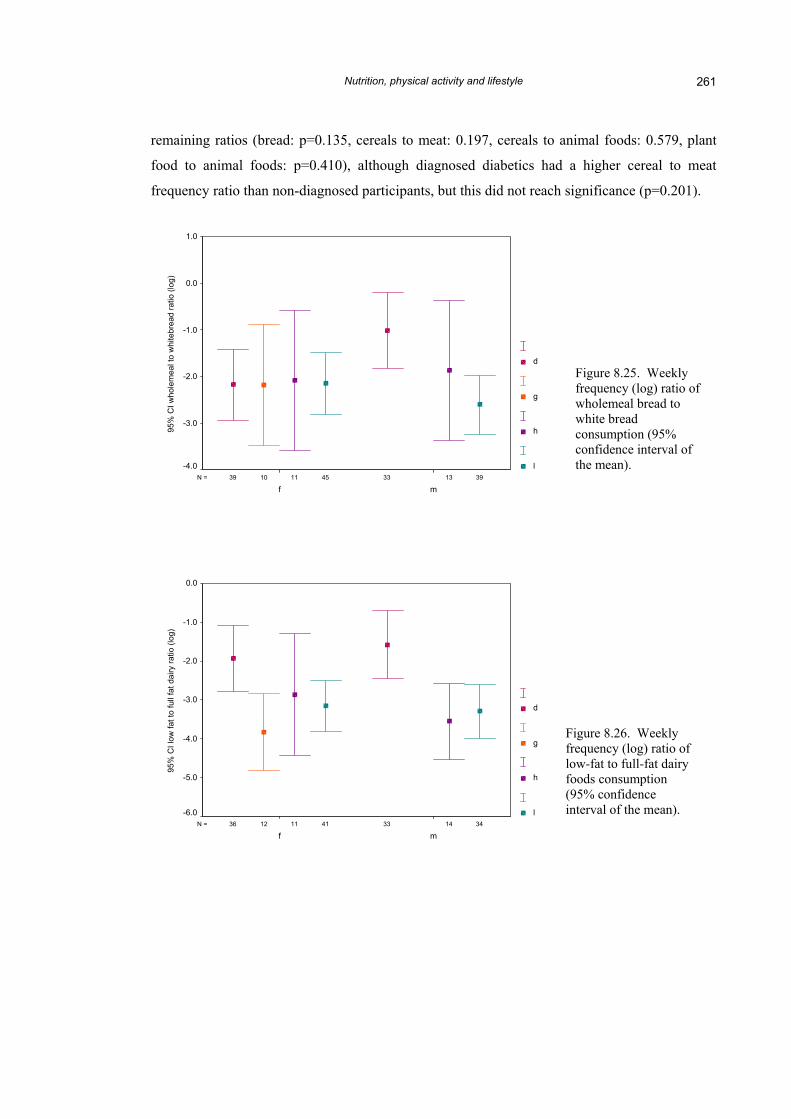
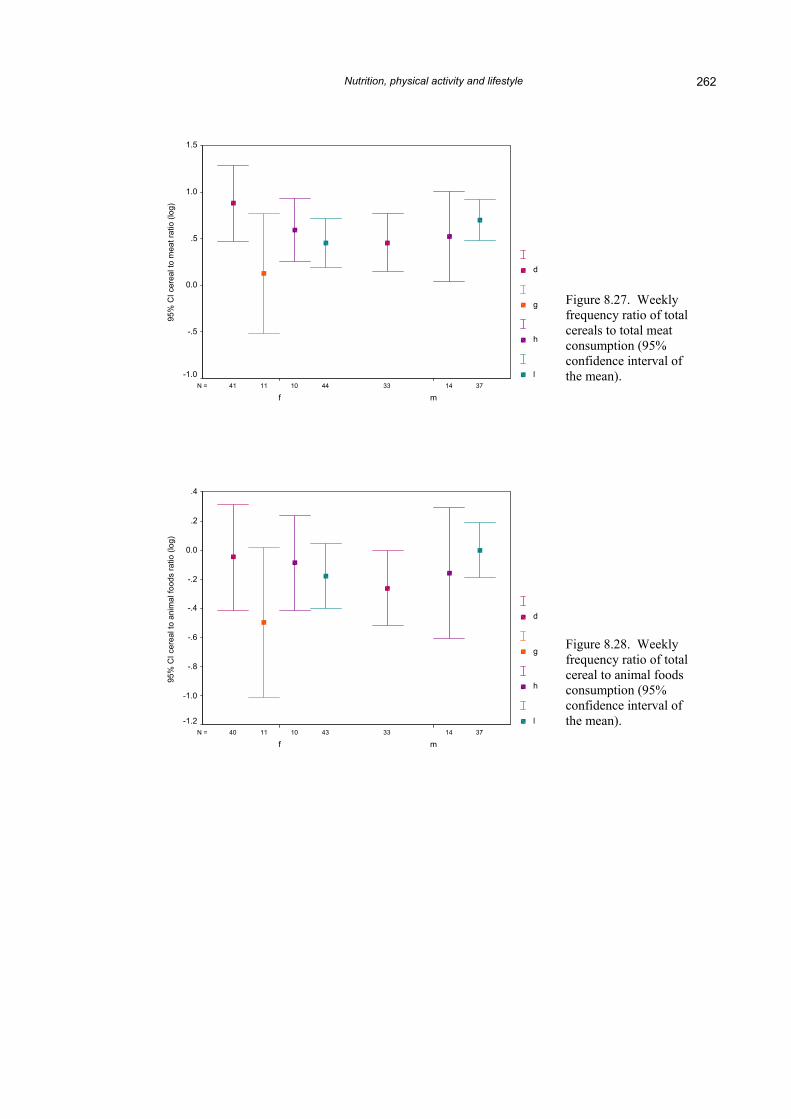
Ratios between certain food groups were also examined to determine whether these differed
systematically between groups and to give an indication of how much of a change in diet might
have been made after diabetes diagnosis. The ratios that were analysed were wholemeal bread
to white bread, low-fat dairy to full-fat dairy, total cereals to total meat, total cereals to total
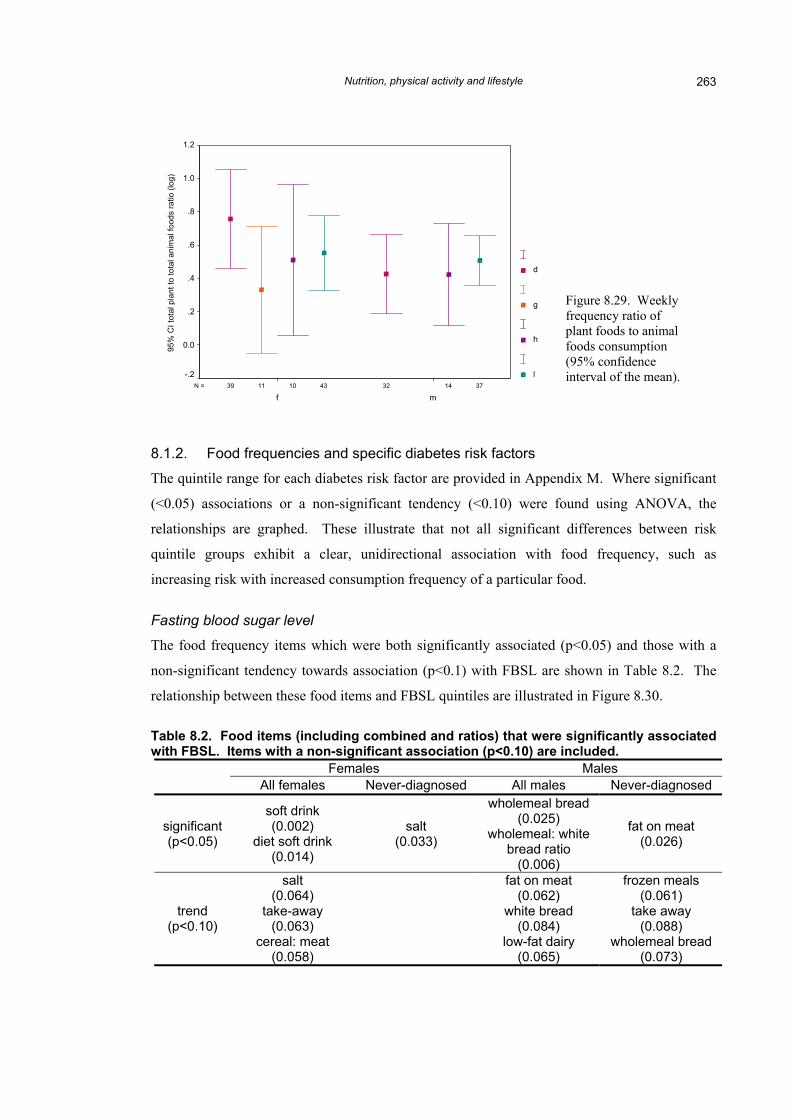
animal foods and total plant foods to total animal foods (Figures 8.25 to 8.29). The frequency
ratio between low-fat and full-fat dairy foods was significantly higher among people who had
been diagnosed than those who had never been diagnosed (p=0.002), suggesting that this was a
major dietary change they had implemented. No significant differences were found among the
Nutrition, physical activity and lifestyle 261
remaining ratios (bread: p=0.135, cereals to meat: 0.197, cereals to animal foods: 0.579, plant
food to animal foods: p=0.410), although diagnosed diabetics had a higher cereal to meat
frequency ratio than non-diagnosed participants, but this did not reach significance (p=0.201).
3945 131110 3339N =
mf
95%
CI w
hole
mea
l to
whi
tebr
ead
ratio
(log
)
1.0
0.0
-1.0
-2.0
-3.0
-4.0
d
g
h
l
Figure 8.25. Weekly frequency (log) ratio ofwholemeal bread to white bread consumption (95% confidence interval of the mean).
Figure 8.26. Weekly frequency (log) ratio oflow-fat to full-fat dairy foods consumption (95% confidence interval of the mean).
3441 141112 3336N =
mf
95%
CI l
ow fa
t to
full
fat d
airy
ratio
(log
)
0.0
-1.0
-2.0
-3.0
-4.0
-5.0
-6.0
d
g
h
l
Nutrition, physical activity and lifestyle 262
3744 141011 3341N =
mf
95%
CI c
erea
l to
mea
t rat
io (l
og)
1.5
1.0
.5
0.0
-.5
-1.0
d
g
h
l
Figure 8.27. Weekly frequency ratio of total cereals to total meat consumption (95% confidence interval of the mean).
Figure 8.28. Weekly frequency ratio of total cereal to animal foods consumption (95% confidence interval of the mean).
3743 141011 3340N =
mf
95%
CI c
erea
l to
anim
al fo
ods
ratio
(log
)
.4
.2
0.0
-.2
-.4
-.6
-.8
-1.0
-1.2
d
g
h
l
Nutrition, physical activity and lifestyle 263
3743 141011 3239N =
mf
95%
CI t
otal
pla
nt to
tota
l ani
mal
food
s ra
tio (l
og)
1.2
1.0
.8
.6
.4
.2
0.0
-.2
d
g
h
l
8.1.2. Food frequencies and specific diabetes risk factors
The quintile range for each diabetes risk factor are provided in Appendix M. Where significant
(<0.05) associations or a non-significant tendency (<0.10) were found using ANOVA, the
relationships are graphed. These illustrate that not all significant differences between risk
quintile groups exhibit a clear, unidirectional association with food frequency, such as
increasing risk with increased consumption frequency of a particular food.
Fasting blood sugar level
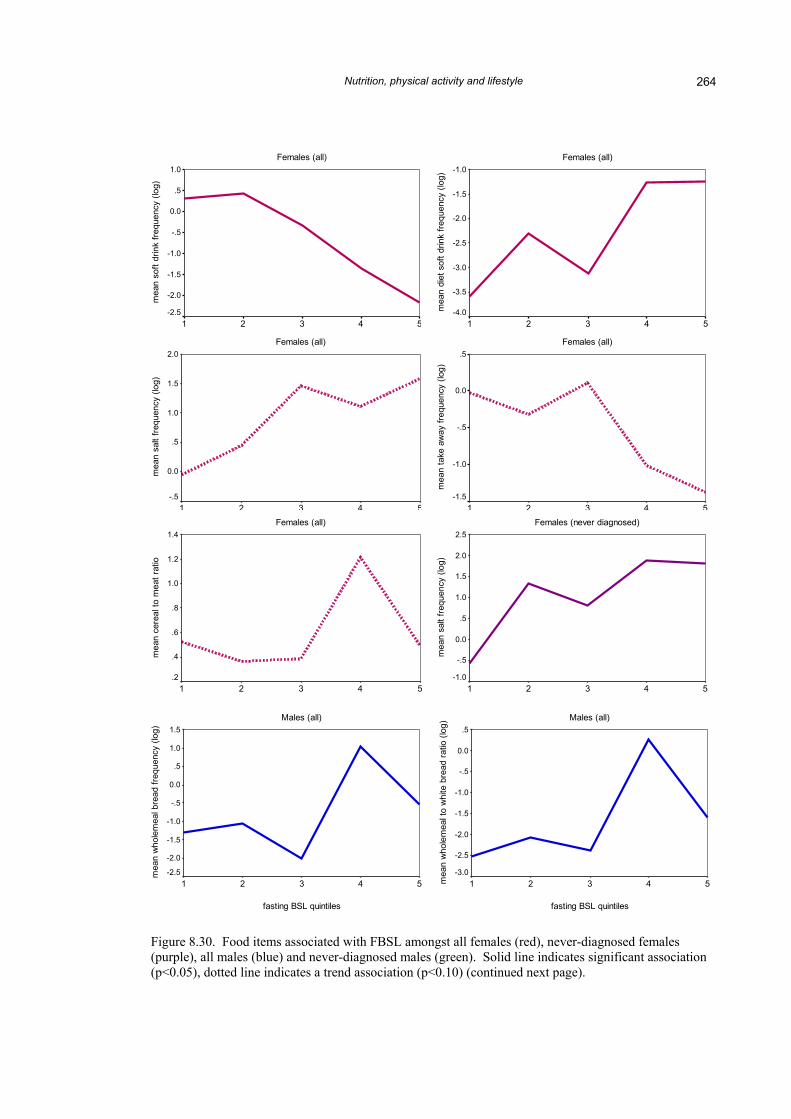
The food frequency items which were both significantly associated (p<0.05) and those with a
non-significant tendency towards association (p<0.1) with FBSL are shown in Table 8.2. The
relationship between these food items and FBSL quintiles are illustrated in Figure 8.30.
Table 8.2. Food items (including combined and ratios) that were significantly associated with FBSL. Items with a non-significant association (p<0.10) are included.
Females Males All females Never-diagnosed All males Never-diagnosed
significant (p<0.05)
soft drink (0.002)
diet soft drink (0.014)
salt (0.033)
wholemeal bread (0.025)
wholemeal: white bread ratio
(0.006)
fat on meat (0.026)
trend (p<0.10)
salt (0.064)
take-away (0.063)
cereal: meat (0.058)
fat on meat (0.062)
white bread (0.084)
low-fat dairy (0.065)
frozen meals (0.061)
take away (0.088)
wholemeal bread(0.073)
Figure 8.29. Weekly frequency ratio of plant foods to animal foods consumption (95% confidence interval of the mean).
Nutrition, physical activity and lifestyle 264
Females (all)
fasting BSL quintiles
54321
mea
n so
ft dr
ink
frequ
ency
(log
)
1.0
.5
0.0
-.5
-1.0
-1.5
-2.0
-2.5
Females (all)
fasting BSL quintiles
54321
mea
n sa
lt fre
quen
cy (l
og)
2.0
1.5
1.0
.5
0.0
-.5
Females (all)
54321
mea
n di
et s
oft d
rink
frequ
ency
(log
) -1.0
-1.5
-2.0
-2.5
-3.0
-3.5
-4.0
fasting BSL quintilesFemales (all)
fasting BSL quintiles
54321
mea
n ta
ke a
way
freq
uenc
y (lo
g)
.5
0.0
-.5
-1.0
-1.5
Females (never diagnosed)2.5
fasting BSL quintilesMales (all)
fasting BSL quintiles
54321mea
n w
hole
mea
l to
whi
te b
read
ratio
(log
)
.5
0.0
-.5
-1.0
-1.5
-2.0
-2.5
-3.0
fasting BSL quintilesMales (all)
fasting BSL quintiles
54321
mea
n w
hole
mea
l bre
ad fr
eque
ncy
(log) 1.5
1.0
.5
0.0
-.5
-1.0
-1.5
-2.0
-2.5
Females (all)
54321
mea
n ce
real
to m
eat r
atio
1.4
1.2
1.0
.8
.6
.4
.254321
mea
n sa
lt fre
quen
cy (l
og) 2.0
1.5
1.0
.5
0.0
-.5
-1.0
Figure 8.30. Food items associated with FBSL amongst all females (red), never-diagnosed females (purple), all males (blue) and never-diagnosed males (green). Solid line indicates significant association (p<0.05), dotted line indicates a trend association (p<0.10) (continued next page).
Nutrition, physical activity and lifestyle
265
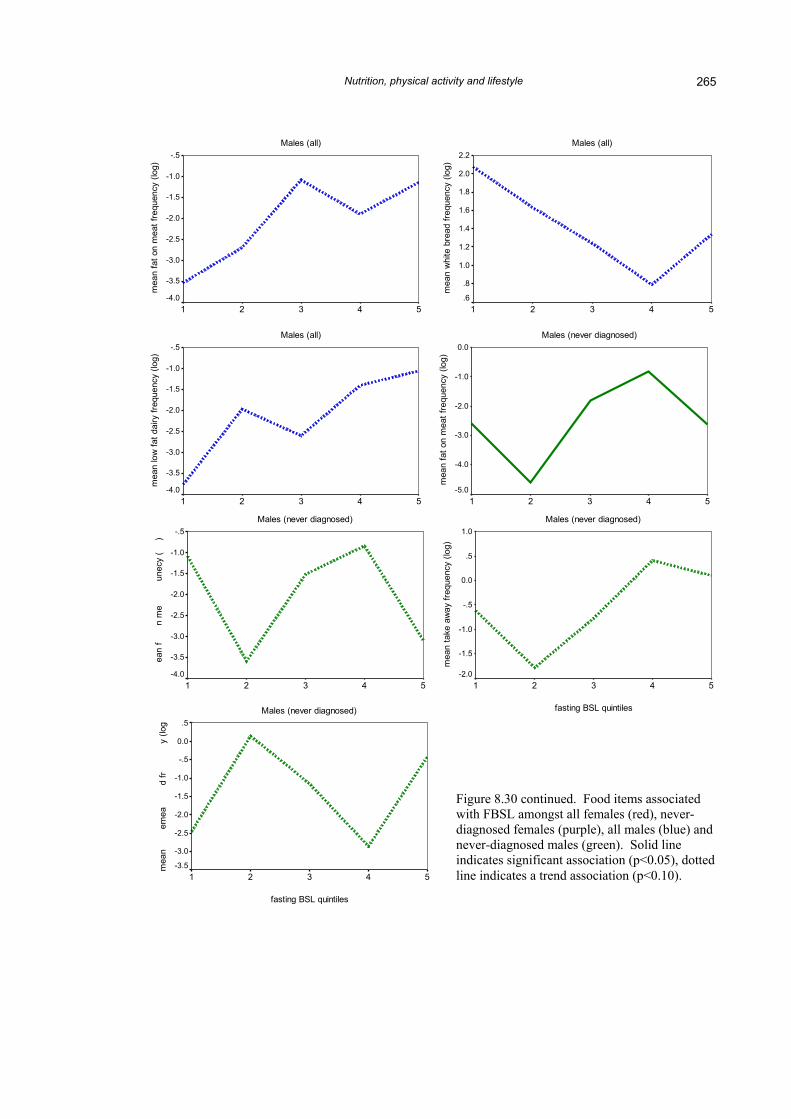
Figure 8.30 continued. Food items associated with FBSL amongst all females (red), never-diagnosed females (purple), all males (blue) and never-diagnosed males (green). Solid line indicates significant association (p<0.05), dotted line indicates a trend association (p<0.10).
Males (all)
fasting BSL quintiles
54321
mea
n fa
t on
mea
t fre
quen
cy (l
og)
-.5
-1.0
-1.5
-2.0
-2.5
-3.0
-3.5
-4.0
Males (all)
fasting BSL quintiles
54321
mea
n lo
w fa
t dai
ry fr
eque
ncy
(log)
-.5
-1.0
-1.5
-2.0
-2.5
-3.0
-3.5
-4.0
log
al fr
eq
roze
m
)
eque
nc
l bre
a
who
l
Males (all)
fasting BSL quintiles
54321
mea
n w
hite
bre
ad fr
eque
ncy
(log)
2.2
2.0
1.8
1.6
1.4
1.2
1.0
.8
.6
Males (never diagnosed)
fasting BSL quintiles
54321
mea
n fa
t on
mea
t fre
quen
cy (l
og)
0.0
-1.0
-2.0
-3.0
-4.0
-5.0
Males (never diagnosed)
fasting BSL quintiles
54321
mea
n ta
ke a
way
freq
uenc
y (lo
g)
1.0
.5
0.0
-.5
-1.0
-1.5
-2.0
Males (never diagnosed)
fasting BSL quintiles
54321
ean
fn
me
unec
y (
)
-.5
-1.0
-1.5
-2.0
-2.5
-3.0
-3.5
-4.0
Males (never diagnosed)
fasting BSL quintiles
54321
mea
nem
ead
fry
(log .5
0.0
-.5
-1.0
-1.5
-2.0
-2.5
-3.0
-3.5
Nutrition, physical activity and lifestyle 266
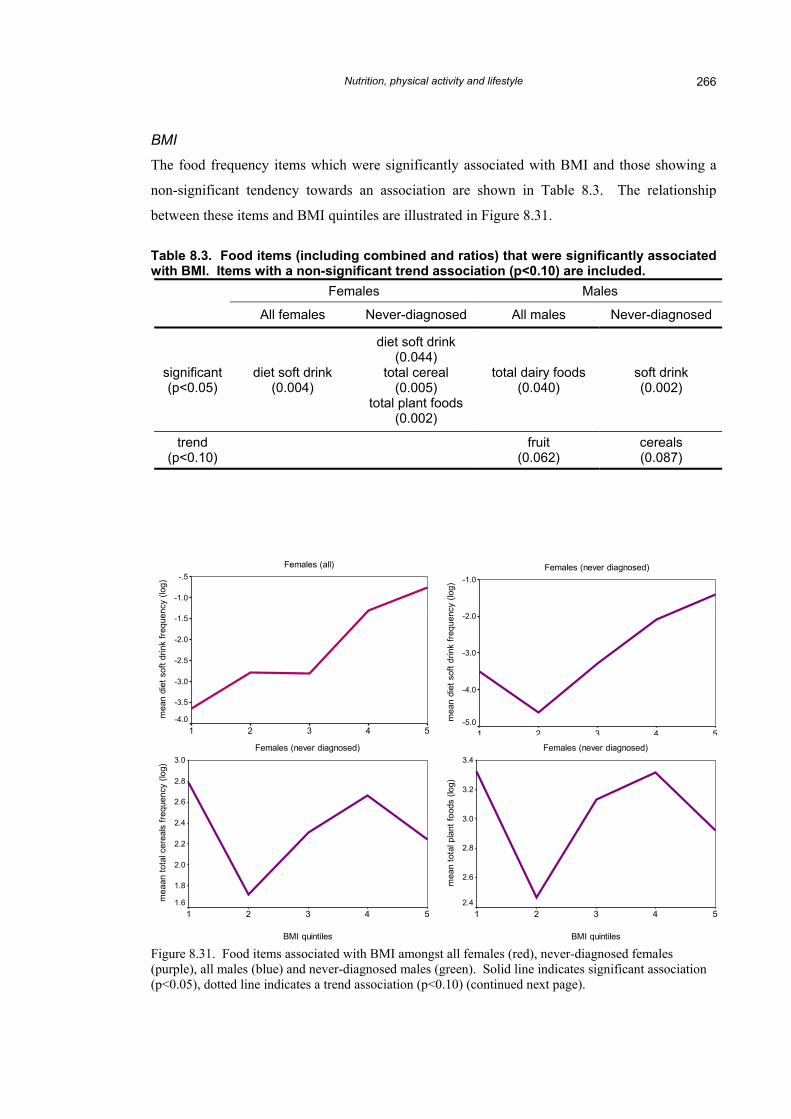
BMI
The food frequency items which were significantly associated with BMI and those showing a
non-significant tendency towards an association are shown in Table 8.3. The relationship
between these items and BMI quintiles are illustrated in Figure 8.31.
Table 8.3. Food items (including combined and ratios) that were significantly associated with BMI. Items with a non-significant trend association (p<0.10) are included.
Females Males
All females Never-diagnosed All males Never-diagnosed
significant (p<0.05)
diet soft drink (0.004)
diet soft drink (0.044)
total cereal (0.005)
total plant foods (0.002)
total dairy foods (0.040)
soft drink (0.002)
trend (p<0.10) fruit
(0.062) cereals (0.087)
Females (all)
BMI quintiles
54321
mea
n di
et s
oft d
rink
frequ
ency
(log
) -.5
-1.0
-1.5
-2.0
-2.5
-3.0
-3.5
-4.0
Females (never diagnosed)
BMI quintiles
54321
mea
n di
et s
oft d
rink
frequ
ency
(log
) -1.0
-2.0
-3.0
-4.0
-5.0
Females (never diagnosed)
BMI quintiles
54321
mea
n to
tal p
lant
food
s (lo
g)
3.4
3.2
3.0
2.8
2.6
2.4
Females (never diagnosed)
BMI quintiles
54321
mea
an to
tal c
erea
ls fr
eque
ncy
(log)
3.0
2.8
2.6
2.4
2.2
2.0
1.8
1.6
Figure 8.31. Food items associated with BMI amongst all females (red), never-diagnosed females (purple), all males (blue) and never-diagnosed males (green). Solid line indicates significant association (p<0.05), dotted line indicates a trend association (p<0.10) (continued next page).
Nutrition, physical activity and lifestyle 267
Males (all)
BMI quintiles
54321
tota
l dai
ry fo
ods
frequ
ency
(log
)2.5
2.0
1.5
1.0
.5
0.0
Males (all)
BMI quintiles
54321
mea
n fru
it fre
quen
cy (l
og)
1.5
1.0
.5
0.0
-.5
-1.0
Males (never diagnosed)
BMI quintiles
54321
mea
n so
ft dr
ink
frequ
ency
(log
)
1.5
1.0
.5
0.0
-.5
-1.0
-1.5
-2.0
-2.5
Males (never diagnosed)
BMI quintiles
54321
mea
n ce
real
s fre
quen
cy (l
og)
1.5
1.0
.5
0.0
-.5
-1.0
-1.5
-2.0
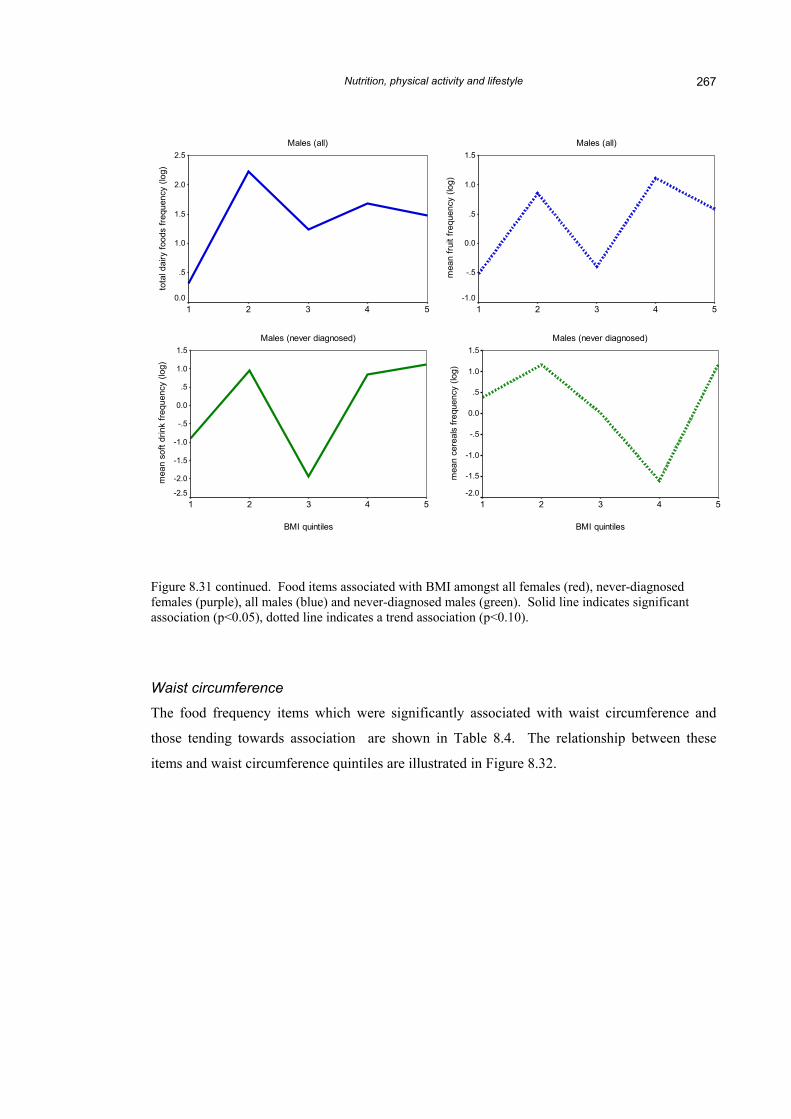
Figure 8.31 continued. Food items associated with BMI amongst all females (red), never-diagnosed females (purple), all males (blue) and never-diagnosed males (green). Solid line indicates significant association (p<0.05), dotted line indicates a trend association (p<0.10).
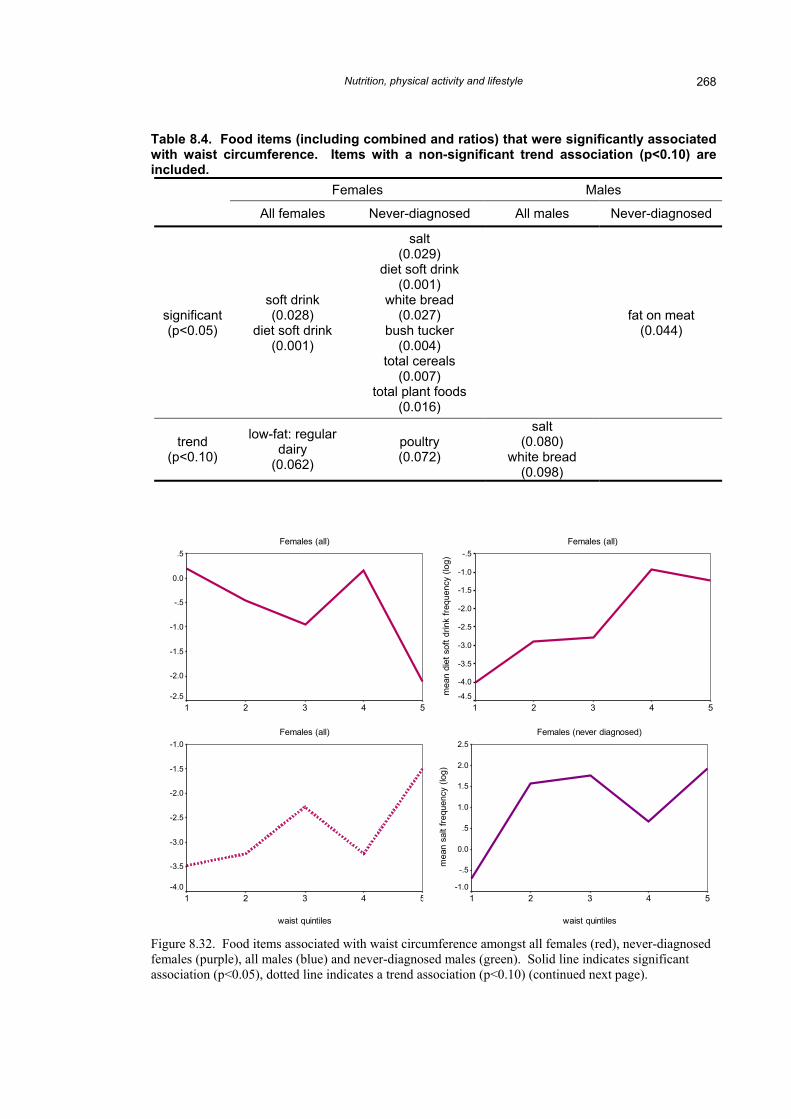
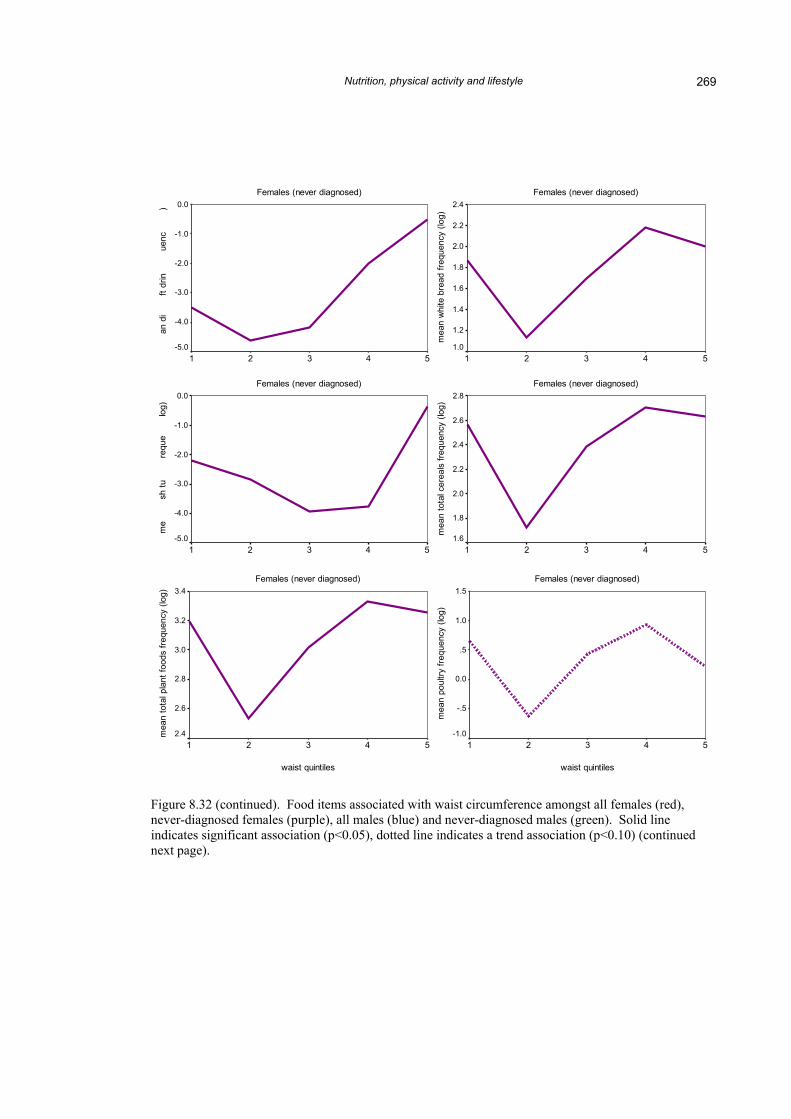
Waist circumference
The food frequency items which were significantly associated with waist circumference and
those tending towards association are shown in Table 8.4. The relationship between these
items and waist circumference quintiles are illustrated in Figure 8.32.
Nutrition, physical activity and lifestyle 268
Table 8.4. Food items (including combined and ratios) that were significantly associated with waist circumference. Items with a non-significant trend association (p<0.10) are included.
Females Males
All females Never-diagnosed All males Never-diagnosed
significant (p<0.05)
soft drink (0.028)
diet soft drink (0.001)
salt (0.029)
diet soft drink (0.001)
white bread (0.027)
bush tucker (0.004)
total cereals (0.007)
total plant foods (0.016)
fat on meat (0.044)
trend (p<0.10)
low-fat: regular dairy
(0.062)
poultry (0.072)
salt (0.080)
white bread (0.098)
)
log
uenc
y (
req
rink
f
sof
t d
ean
m
(log
)
ratio
airy
ular
d
reg
fat t
o
n lo
w
mea
Females (all)
waist quintiles
54321
.5
0.0
-.5
-1.0
-1.5
-2.0
-2.5
Females (all)
waist quintiles
54321
mea
n di
et s
oft d
rink
frequ
ency
(log
) -.5
-1.0
-1.5
-2.0
-2.5
-3.0
-3.5
-4.0
-4.5
Females (all)
waist quintiles
54321
-1.0
-1.5
-2.0
-2.5
-3.0
-3.5
-4.0
Females (never diagnosed)
waist quintiles
54321
mea
n sa
lt fre
quen
cy (l
og)
2.5
2.0
1.5
1.0
.5
0.0
-.5
-1.0
Figure 8.32. Food items associated with waist circumference amongst all females (red), never-diagnosed females (purple), all males (blue) and never-diagnosed males (green). Solid line indicates significant association (p<0.05), dotted line indicates a trend association (p<0.10) (continued next page).
Nutrition, physical activity and lifestyle 269
y (lo
g
k fre
q
et s
o
me
ncy
(
cker
f
an b
u
Females (never diagnosed)
waist quintiles
54321
mea
n w
hite
bre
ad fr
eque
ncy
(log)
2.4
2.2
2.0
1.8
1.6
1.4
1.2
1.0
Females (never diagnosed)
waist quintiles
54321
an d
ift
drin
uenc
) 0.0
-1.0
-2.0
-3.0
-4.0
-5.0
Females (never diagnosed)
waist quintiles
54321
mea
n to
tal c
erea
ls fr
eque
ncy
(log)
2.8
2.6
2.4
2.2
2.0
1.8
1.6
Females (never diagnosed)
waist quintiles
54321
me
sh tu
requ
elo
g)
0.0
-1.0
-2.0
-3.0
-4.0
-5.0
Females (never diagnosed)
waist quintiles
54321
mea
n po
ultry
freq
uenc
y (lo
g)
1.5
1.0
.5
0.0
-.5
-1.0
Females (never diagnosed)
waist quintiles
54321
mea
n to
tal p
lant
food
s fre
quen
cy (l
og) 3.4
3.2
3.0
2.8
2.6
2.4
Figure 8.32 (continued). Food items associated with waist circumference amongst all females (red), never-diagnosed females (purple), all males (blue) and never-diagnosed males (green). Solid line indicates significant association (p<0.05), dotted line indicates a trend association (p<0.10) (continued next page).
Nutrition, physical activity and lifestyle 270
Males (all)
waist quintiles
54321
mea
n sa
lt fre
quen
cy (l
og)
2.0
1.5
1.0
.5
0.0
-.5
Males (all)
waist quintiles
54321
mea
n w
hite
bre
ad fr
eque
ncy
(log)
2.2
2.0
1.8
1.6
1.4
1.2
1.0
.8
.6
Males (never diagnosed)
waist quintiles
54321
fat o
n m
eat f
requ
ency
(log
)
1.0
0.0
-1.0
-2.0
-3.0
-4.0
-5.0
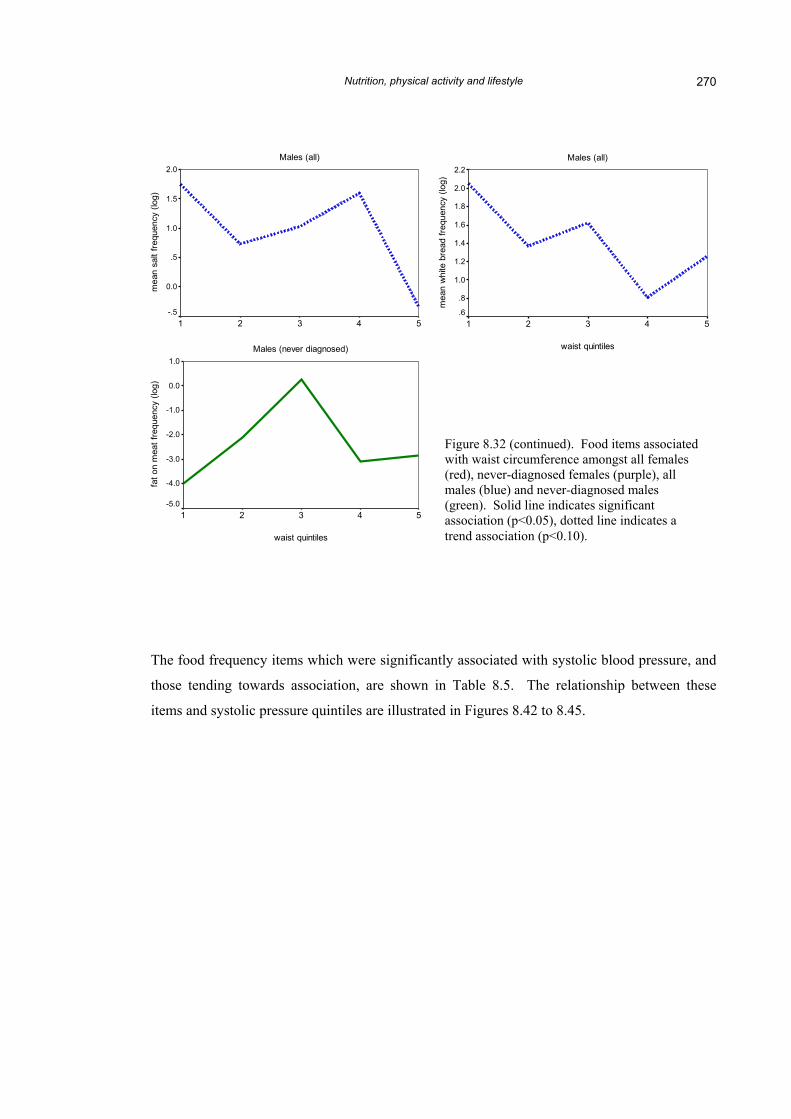
Figure 8.32 (continued). Food items associated with waist circumference amongst all females (red), never-diagnosed females (purple), all males (blue) and never-diagnosed males (green). Solid line indicates significant association (p<0.05), dotted line indicates a trend association (p<0.10).
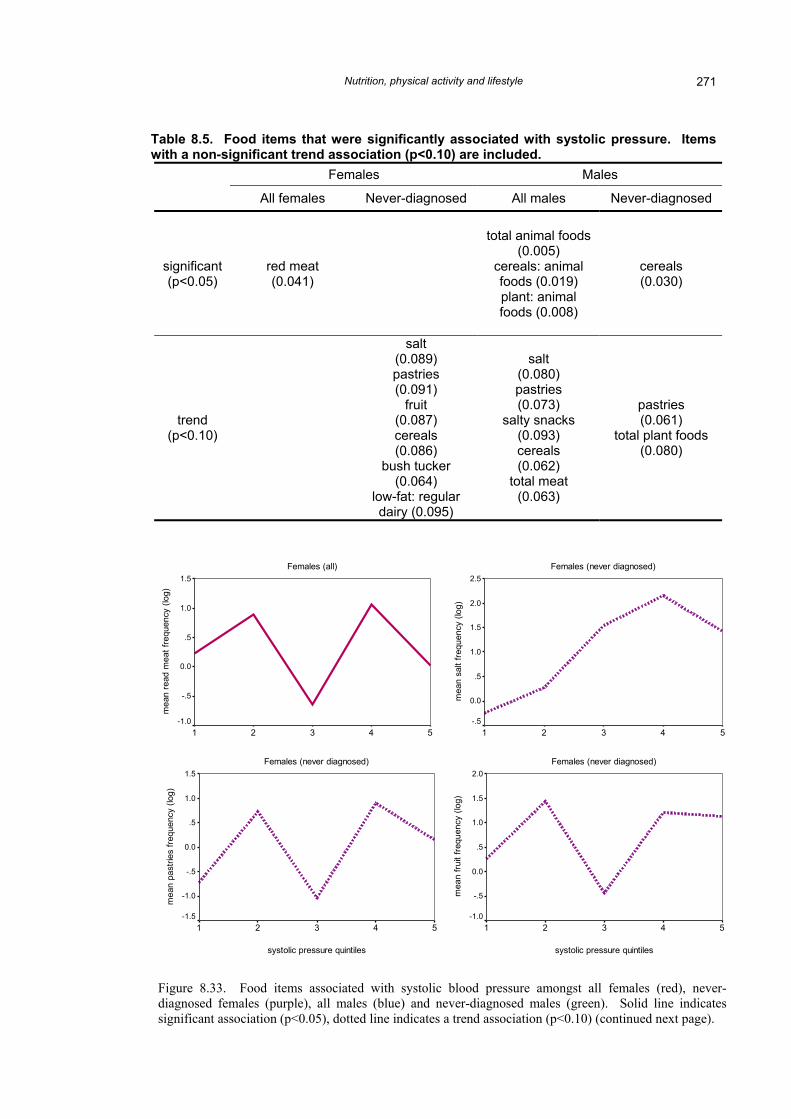
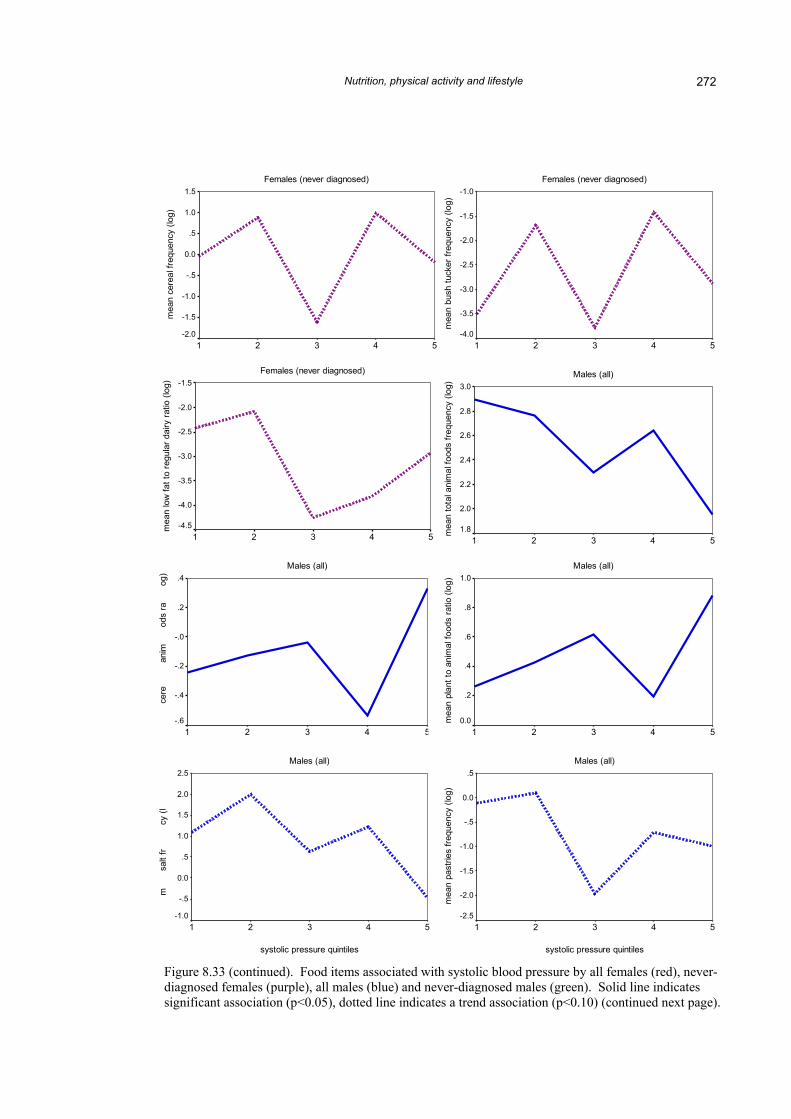
The food frequency items which were significantly associated with systolic blood pressure, and
those tending towards association, are shown in Table 8.5. The relationship between these
items and systolic pressure quintiles are illustrated in Figures 8.42 to 8.45.
Nutrition, physical activity and lifestyle 271
Table 8.5. Food items that were significantly associated with systolic pressure. Items with a non-significant trend association (p<0.10) are included.
Females Males
All females Never-diagnosed All males Never-diagnosed
Figure 8.33. Food items associated with systolic blood pressure amongst all females (red), never-diagnosed females (purple), all males (blue) and never-diagnosed males (green). Solid line indicatessignificant association (p<0.05), dotted line indicates a trend association (p<0.10) (continued next page).
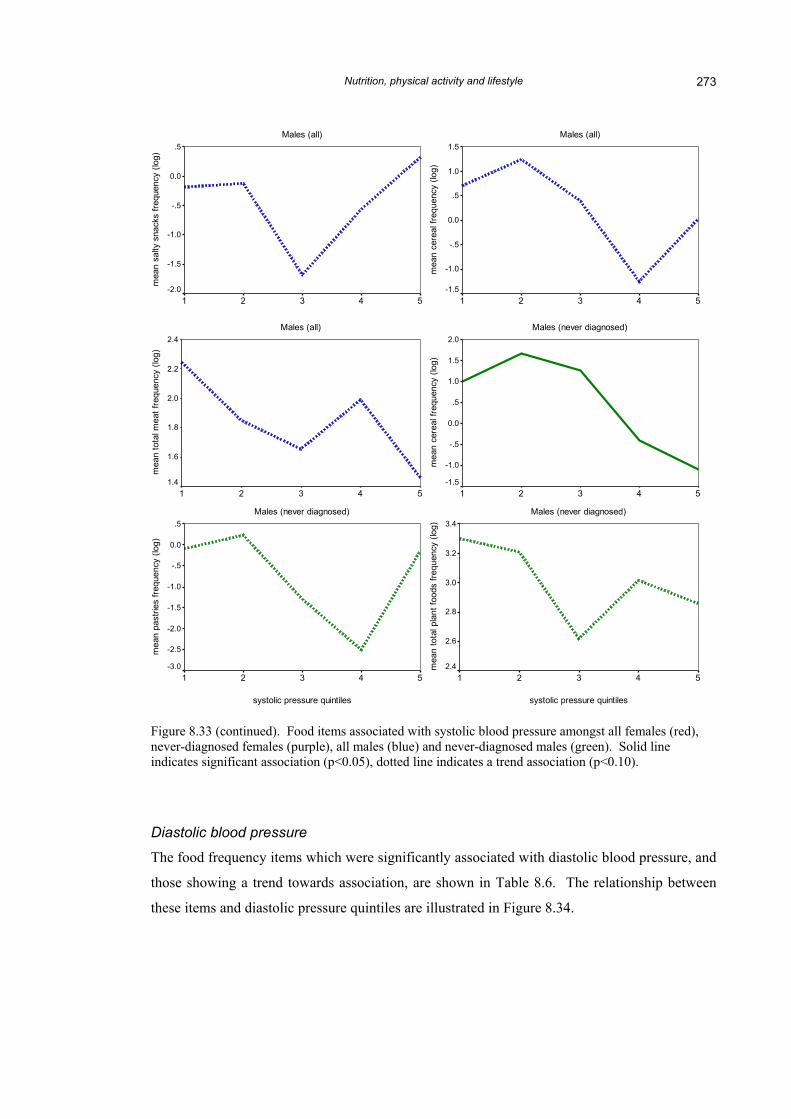
Figure 8.33 (continued). Food items associated with systolic blood pressure by all females (red), never-diagnosed females (purple), all males (blue) and never-diagnosed males (green). Solid line indicates significant association (p<0.05), dotted line indicates a trend association (p<0.10) (continued next page).
Nutrition, physical activity and lifestyle 273
Figure 8.33 (continued). Food items associated with systolic blood pressure amongst all females (red), never-diagnosed females (purple), all males (blue) and never-diagnosed males (green). Solid line indicates significant association (p<0.05), dotted line indicates a trend association (p<0.10).
Males (all)
systolic pressure quintiles
54321
mea
n ce
real
freq
uenc
y (lo
g)
1.5
1.0
.5
0.0
-.5
-1.0
-1.5
Males (all)
systolic pressure quintiles
54321
mea
n sa
lty s
nack
s fre
quen
cy (l
og)
.5
0.0
-.5
-1.0
-1.5
-2.0
Males (never diagnosed)
systolic pressure quintiles
54321
mea
n ce
real
freq
uenc
y (lo
g)
2.0
1.5
1.0
.5
0.0
-.5
-1.0
-1.5
Males (all)
systolic pressure quintiles
54321
mea
n to
tal m
eat f
requ
ency
(log
)
2.4
2.2
2.0
1.8
1.6
1.4
Males (never diagnosed)
systolic pressure quintiles
54321
mea
n to
tal p
lant
food
s fre
quen
cy (l
og) 3.4
3.2
3.0
2.8
2.6
2.4
Males (never diagnosed)
systolic pressure quintiles
54321
mea
n pa
strie
s fre
quen
cy (l
og)
.5
0.0
-.5
-1.0
-1.5
-2.0
-2.5
-3.0
Diastolic blood pressure
The food frequency items which were significantly associated with diastolic blood pressure, and
those showing a trend towards association, are shown in Table 8.6. The relationship between
these items and diastolic pressure quintiles are illustrated in Figure 8.34.
Nutrition, physical activity and lifestyle 274
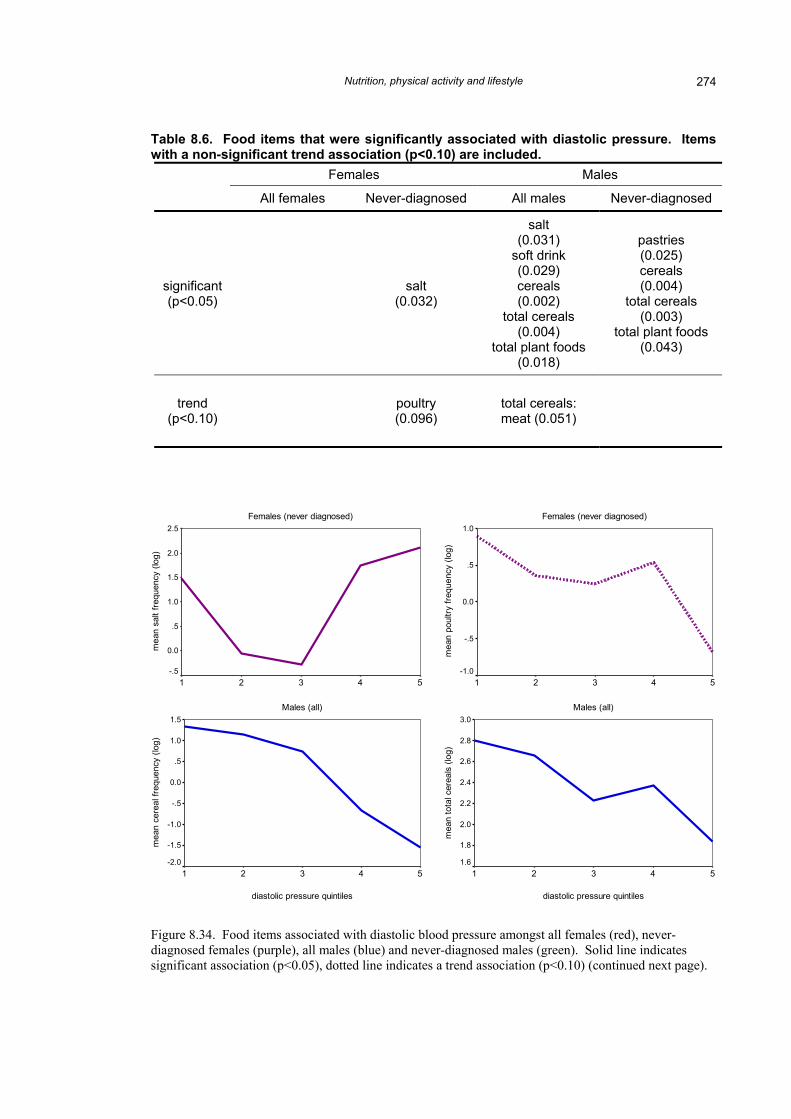
Table 8.6. Food items that were significantly associated with diastolic pressure. Items with a non-significant trend association (p<0.10) are included.
Females Males
All females Never-diagnosed All males Never-diagnosed
significant (p<0.05) salt
(0.032)
salt (0.031)
soft drink (0.029) cereals (0.002)
total cereals (0.004)
total plant foods (0.018)
pastries (0.025) cereals (0.004)
total cereals (0.003)
total plant foods (0.043)
trend (p<0.10) poultry
(0.096) total cereals: meat (0.051)
Females (never diagnosed)
diastolic pressure quintiles
54321
mea
n sa
lt fre
quen
cy (l
og)
2.5
2.0
1.5
1.0
.5
0.0
-.5
Females (never diagnosed)
diastolic pressure quintiles
54321
mea
n po
ultry
freq
uenc
y (lo
g)
1.0
.5
0.0
-.5
-1.0
Males (all)
diastolic pressure quintiles
54321
mea
n ce
real
freq
uenc
y (lo
g)
1.5
1.0
.5
0.0
-.5
-1.0
-1.5
-2.0
Males (all)
diastolic pressure quintiles
54321
mea
n to
tal c
erea
ls (l
og)
3.0
2.8
2.6
2.4
2.2
2.0
1.8
1.6
Figure 8.34. Food items associated with diastolic blood pressure amongst all females (red), never-diagnosed females (purple), all males (blue) and never-diagnosed males (green). Solid line indicates significant association (p<0.05), dotted line indicates a trend association (p<0.10) (continued next page).
Nutrition, physical activity and lifestyle 275
Males (all)
diastolic pressure quintiles
54321
mea
n to
tal p
lant
food
s fre
quen
cy (l
og) 3.4
3.2
3.0
2.8
2.6
2.4
Males (all)
diastolic pressure quintiles
54321
mea
n ce
real
s to
mea
t rat
io (l
og)
1.0
.8
.6
.4
.2
0.0
Males (never diagnosed)
diastolic pressure quintiles
54321
mea
n pa
strie
s fre
quen
cy (l
og)
1.0
.5
0.0
-.5
-1.0
-1.5
-2.0
-2.5
Males (never diagnosed)
diastolic pressure quintiles
54321
mea
n ce
real
freq
uenc
y (lo
g)
2.0
1.0
0.0
-1.0
-2.0
-3.0
Males (never diagnosed)
diastolic pressure quintiles
54321
mea
n to
tal c
erea
ls fr
eque
ncy
(log)
3.2
3.0
2.8
2.6
2.4
2.2
2.0
1.8
1.6
Males (never diagnosed)
diastolic pressure quintiles
54321
mea
n to
tal p
lant
food
s fre
quen
cy (l
og) 3.4
3.2
3.0
2.8
2.6
2.4
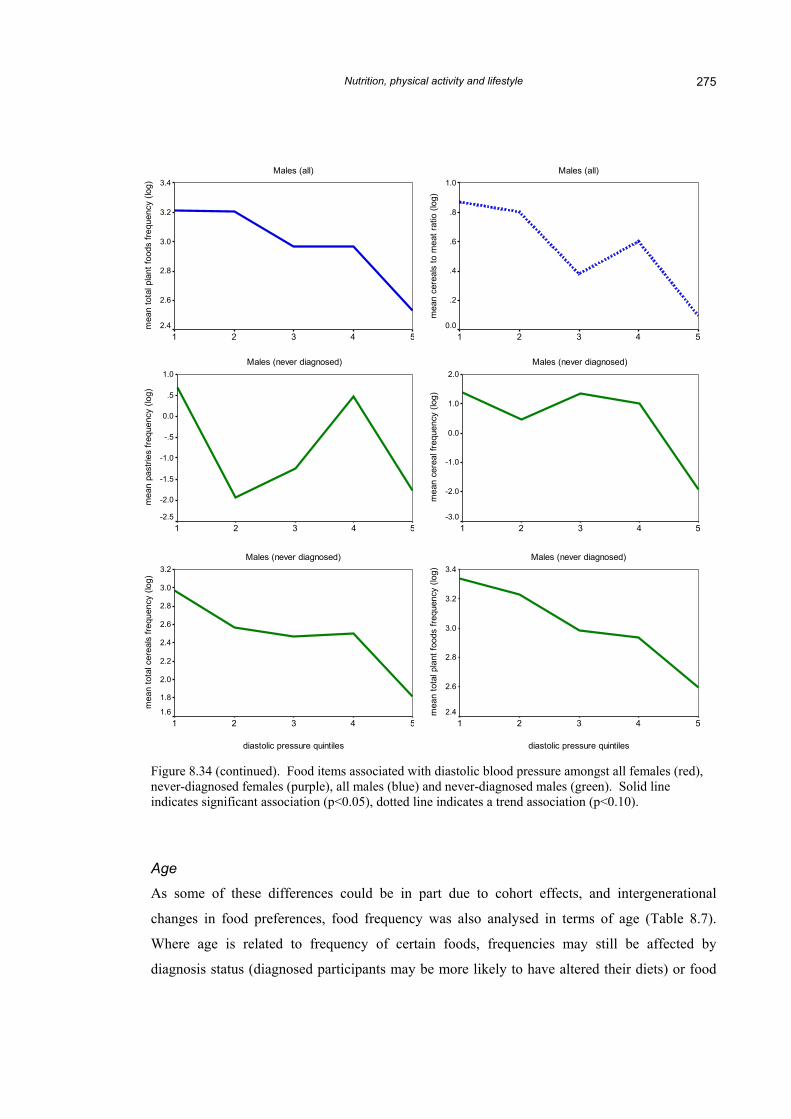
Figure 8.34 (continued). Food items associated with diastolic blood pressure amongst all females (red), never-diagnosed females (purple), all males (blue) and never-diagnosed males (green). Solid line indicates significant association (p<0.05), dotted line indicates a trend association (p<0.10).
Age
As some of these differences could be in part due to cohort effects, and intergenerational
changes in food preferences, food frequency was also analysed in terms of age (Table 8.7).
Where age is related to frequency of certain foods, frequencies may still be affected by
diagnosis status (diagnosed participants may be more likely to have altered their diets) or food
Nutrition, physical activity and lifestyle 276
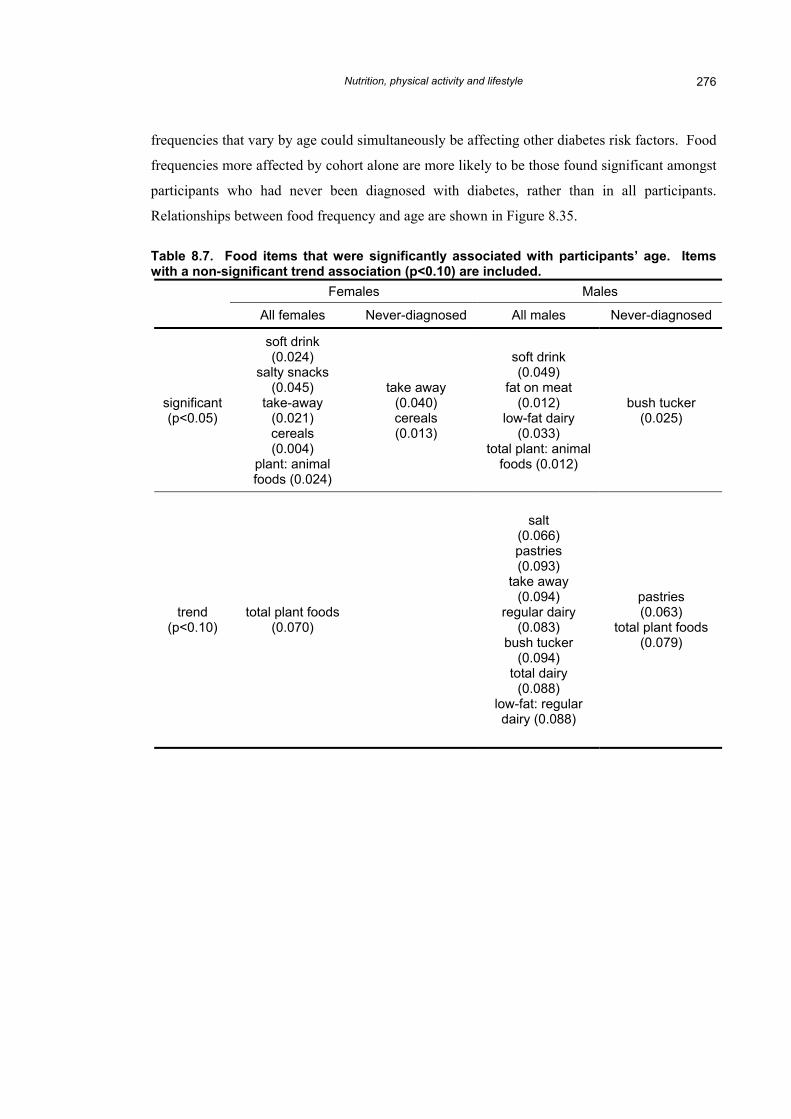
frequencies that vary by age could simultaneously be affecting other diabetes risk factors. Food
frequencies more affected by cohort alone are more likely to be those found significant amongst
participants who had never been diagnosed with diabetes, rather than in all participants.
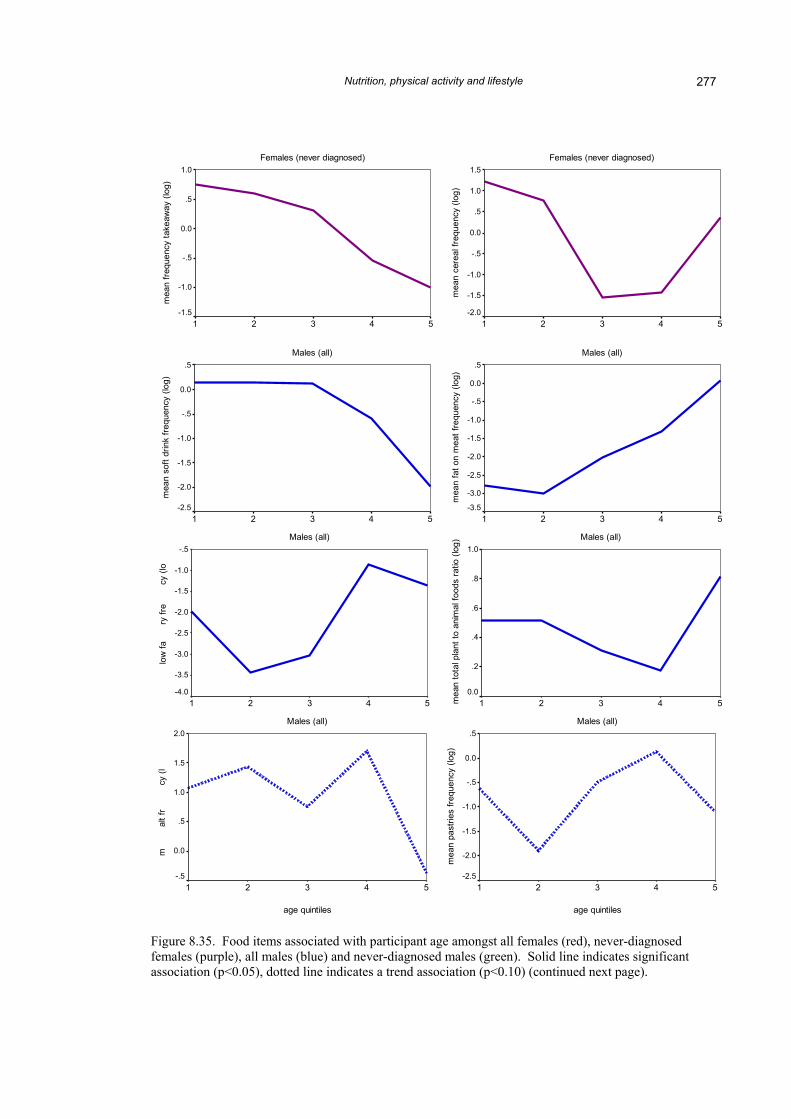
Relationships between food frequency and age are shown in Figure 8.35.
Table 8.7. Food items that were significantly associated with participants’ age. Items with a non-significant trend association (p<0.10) are included.
Females Males
All females Never-diagnosed All males Never-diagnosed
significant (p<0.05)
soft drink (0.024)
salty snacks (0.045)
take-away (0.021) cereals (0.004)
plant: animal foods (0.024)
take away (0.040) cereals (0.013)
soft drink (0.049)
fat on meat (0.012)
low-fat dairy (0.033)
total plant: animal foods (0.012)
bush tucker (0.025)
trend (p<0.10)
total plant foods (0.070)
salt (0.066) pastries (0.093)
take away (0.094)
regular dairy (0.083)
bush tucker (0.094)
total dairy (0.088)
low-fat: regular dairy (0.088)
pastries (0.063)
total plant foods (0.079)
Nutrition, physical activity and lifestyle 277
g)
quen
t dai
mea
n
og)
eque
n
ean
s
Females (never diagnosed)
age quintiles
54321
mea
n fre
quen
cy ta
keaw
ay (l
og)
1.0
.5
0.0
-.5
-1.0
-1.5
Females (never diagnosed)
age quintiles
54321
mea
n ce
real
freq
uenc
y (lo
g)
1.5
1.0
.5
0.0
-.5
-1.0
-1.5
-2.0
Males (all)
age quintiles
54321
mea
n so
ft dr
ink
frequ
ency
(log
)
.5
0.0
-.5
-1.0
-1.5
-2.0
-2.5
Males (all)
age quintiles
54321
mea
n fa
t on
mea
t fre
quen
cy (l
og)
.5
0.0
-.5
-1.0
-1.5
-2.0
-2.5
-3.0
-3.5
Males (all)
age quintiles
54321
low
fary
fre
cy (l
o
-.5
-1.0
-1.5
-2.0
-2.5
-3.0
-3.5
-4.0
Males (all)
age quintiles
54321mea
n to
tal p
lant
to a
nim
al fo
ods
ratio
(log
)
1.0
.8
.6
.4
.2
0.0
Males (all)
age quintiles
54321
mal
t fr
cy (l
2.0
1.5
1.0
.5
0.0
-.5
Males (all)
age quintiles
54321
mea
n pa
strie
s fre
quen
cy (l
og)
.5
0.0
-.5
-1.0
-1.5
-2.0
-2.5
Figure 8.35. Food items associated with participant age amongst all females (red), never-diagnosed females (purple), all males (blue) and never-diagnosed males (green). Solid line indicates significant association (p<0.05), dotted line indicates a trend association (p<0.10) (continued next page).
Nutrition, physical activity and lifestyle 278
Males (all)
age quintiles
54321
mea
n ta
keaw
ay fr
equn
ecy
(log)
.5
0.0
-.5
-1.0
-1.5
Males (all)
age quintiles
54321
mea
n re
gula
r dai
ry fr
eque
ncy
(log)
2.0
1.5
1.0
.5
0.0
Males (all)
age quintiles
54321
mea
n lo
w fa
t to
regu
lar d
airy
ratio
(log
) -1.5
-2.0
-2.5
-3.0
-3.5
-4.0
Males (all)
age quintiles
54321
mea
n re
gula
r dai
ry fr
eque
ncy
(log)
2.0
1.5
1.0
.5
0.0
Males (all)
age quintiles
54321
mea
n to
tal d
airy
food
freq
uenc
y (lo
g) 2.5
2.0
1.5
1.0
.5
0.0
Males (never diagnosed)
age quintiles
54321
mea
n bu
sh tu
cker
freq
uenc
y (lo
g)
0.0
-.5
-1.0
-1.5
-2.0
-2.5
-3.0
-3.5
-4.0
Males (never diagnosed)
age quintiles
54321
mea
n pa
strie
s fre
quen
cy (l
og)
.5
0.0
-.5
-1.0
-1.5
-2.0
-2.5
-3.0
Males (never diagnosed)
age quintiles
54321
mea
n to
tal p
lant
food
s fre
quen
cy
3.3
3.2
3.1
3.0
2.9
2.8
2.7
2.6
2.5
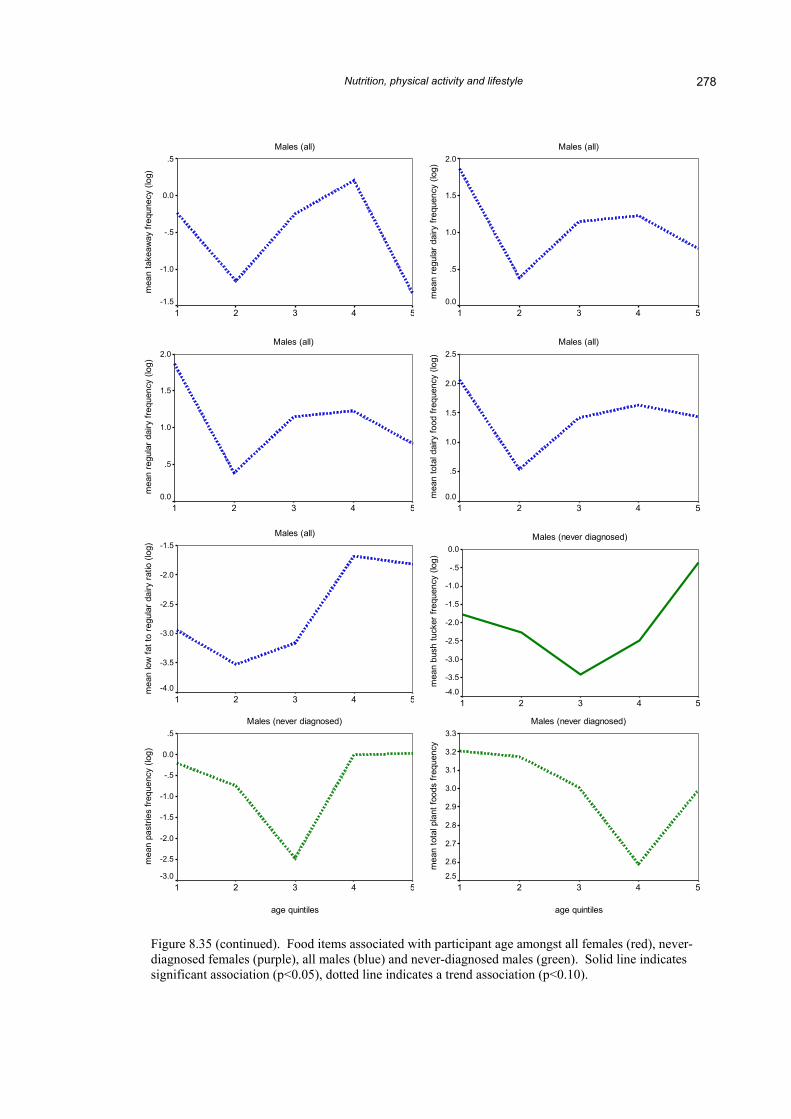
Figure 8.35 (continued). Food items associated with participant age amongst all females (red), never-diagnosed females (purple), all males (blue) and never-diagnosed males (green). Solid line indicates significant association (p<0.05), dotted line indicates a trend association (p<0.10).
Nutrition, physical activity and lifestyle 279
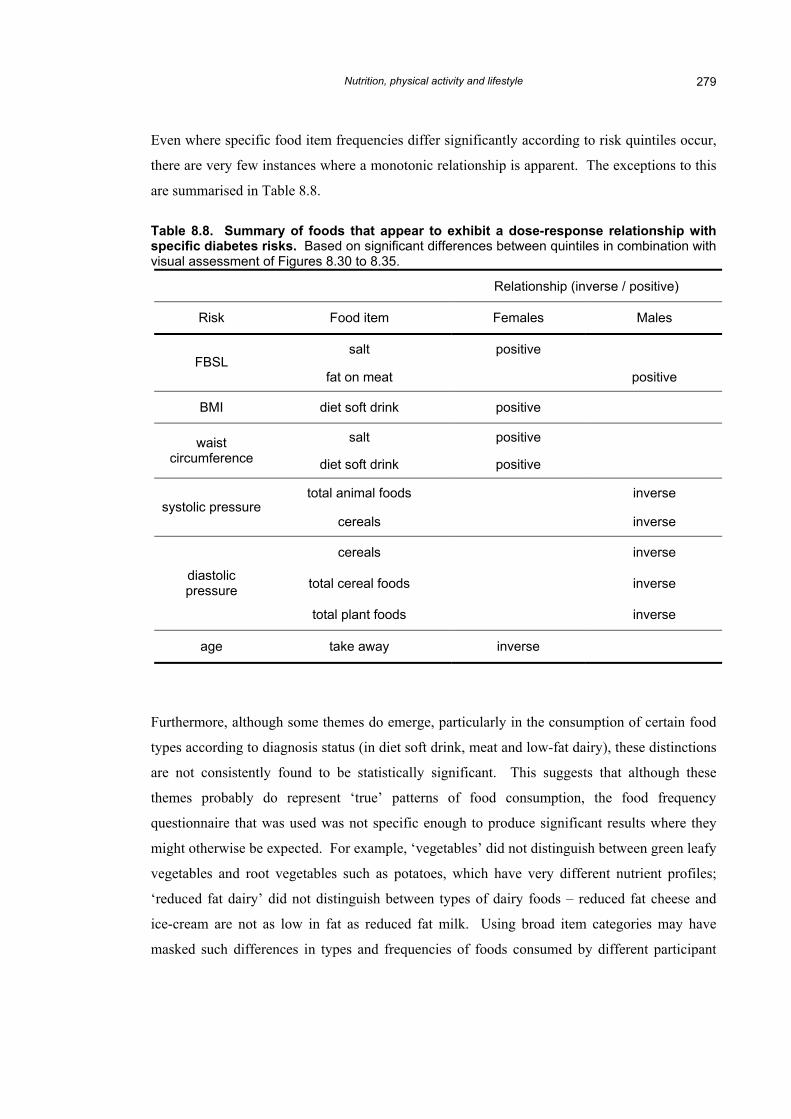
Even where specific food item frequencies differ significantly according to risk quintiles occur,
there are very few instances where a monotonic relationship is apparent. The exceptions to this
are summarised in Table 8.8.
Table 8.8. Summary of foods that appear to exhibit a dose-response relationship with specific diabetes risks. Based on significant differences between quintiles in combination with visual assessment of Figures 8.30 to 8.35.
Relationship (inverse / positive)
Risk Food item Males
salt positive FBSL
Females
fat on meat positive
BMI diet soft drink positive
salt positive waist circumference diet soft drink positive
total animal foods inverse systolic pressure
cereals inverse
cereals inverse
total cereal foods inverse diastolic pressure
total plant foods inverse
age take away inverse
Furthermore, although some themes do emerge, particularly in the consumption of certain food
types according to diagnosis status (in diet soft drink, meat and low-fat dairy), these distinctions
are not consistently found to be statistically significant. This suggests that although these
themes probably do represent ‘true’ patterns of food consumption, the food frequency
questionnaire that was used was not specific enough to produce significant results where they
might otherwise be expected. For example, ‘vegetables’ did not distinguish between green leafy
vegetables and root vegetables such as potatoes, which have very different nutrient profiles;
‘reduced fat dairy’ did not distinguish between types of dairy foods – reduced fat cheese and
ice-cream are not as low in fat as reduced fat milk. Using broad item categories may have
masked such differences in types and frequencies of foods consumed by different participant
Nutrition, physical activity and lifestyle 280
groups. A food diary approach, or some more targeted method, may be more suited to tease out
finer differences in a future study.
The results of the food frequency questionnaire indicate that diabetes diagnosis does make
some, albeit subtle, difference to a person’s diet. The main differences seem to be in
substituting diet for regular soft drink, low-fat for full-fat dairy foods, and reducing total meat
consumption.
These findings have interesting implications for the modified thrifty genotype hypothesis
introduced in Section 2.3.2, and the evidence among some Aboriginal groups for higher protein
consumption and lower carbohydrate consumption improving metabolic control (for example,
O’Dea 1981), rather than the reverse which seems to be being practised. Those who have been
diagnosed with diabetes have apparently cut down on their meat consumption based on medical
advice to avoid fatty foods. Alternatively, perhaps their higher intake of carbohydrate foods in
relation to meat intake was a contributing factor to their development of diabetes, given that
never-diagnosed women in the highest BMI quintile also reported more frequent cereal intake.
Missed meals
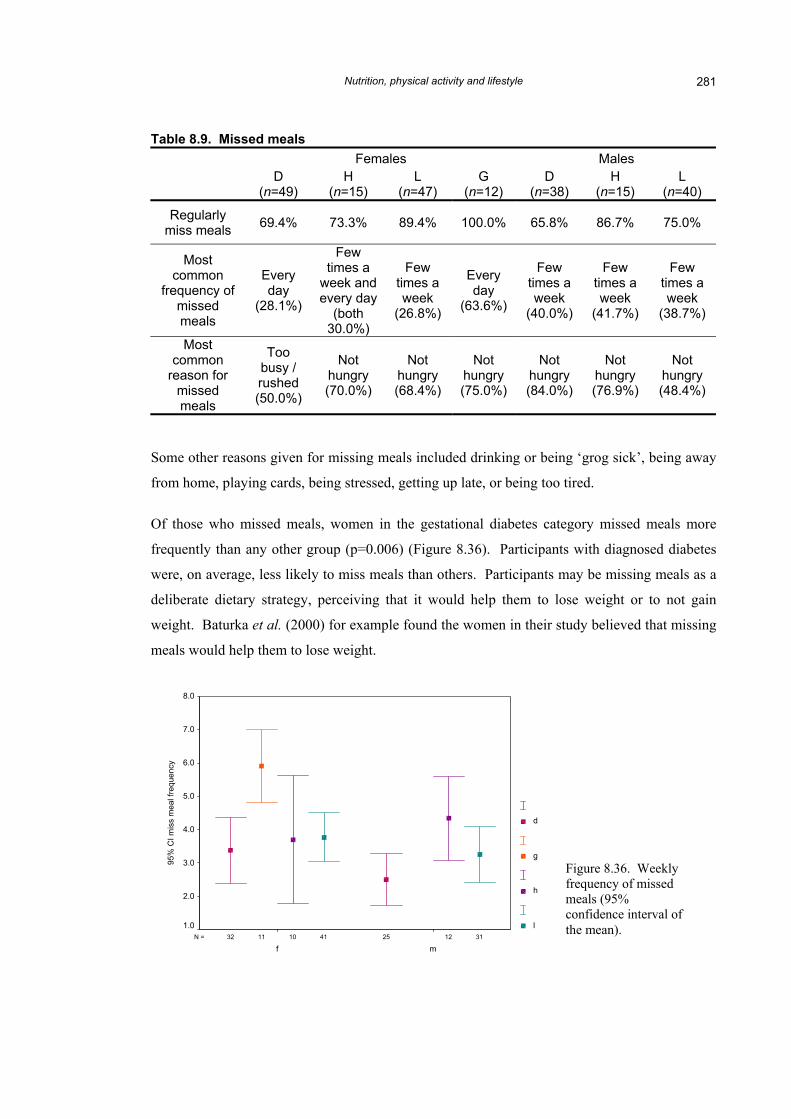
The majority of participants in each group report missing meals regularly, but the frequency and
the reasons for missing meals differ from group to group (Table 8.9). Fewer diagnosed women
and men habitually miss meals, probably a reflection of educative advice to try to eat regularly.
Nutrition, physical activity and lifestyle 281
Table 8.9. Missed meals Females Males
D (n=49)
H (n=15)
L (n=47)
G (n=12)
D (n=38)
H (n=15)
L (n=40)
Regularly miss meals 69.4% 73.3% 89.4% 100.0% 65.8% 86.7% 75.0%
Most common
frequency of missed meals
Every day
(28.1%)
Few times a
week and every day
(both 30.0%)
Few times a week
(26.8%)
Every day
(63.6%)
Few times a week
(40.0%)
Few times a week
(41.7%)
Few times a week
(38.7%)
Most common
reason for missed meals
Too busy / rushed (50.0%)
Not hungry (70.0%)
Not hungry (68.4%)
Not hungry (75.0%)
Not hungry (84.0%)
Not hungry (76.9%)
Not hungry (48.4%)
Some other reasons given for missing meals included drinking or being ‘grog sick’, being away
from home, playing cards, being stressed, getting up late, or being too tired.
Of those who missed meals, women in the gestational diabetes category missed meals more
frequently than any other group (p=0.006) (Figure 8.36). Participants with diagnosed diabetes
were, on average, less likely to miss meals than others. Participants may be missing meals as a
deliberate dietary strategy, perceiving that it would help them to lose weight or to not gain
weight. Baturka et al. (2000) for example found the women in their study believed that missing
meals would help them to lose weight.
3141 121011 2532N =
mf
95%
CI m
iss
mea
l fre
quen
cy
8.0
7.0
6.0
5.0
4.0
3.0
2.0
1.0
d
g
h
l
Figure 8.36. Weekly frequency of missed meals (95% confidence interval of the mean).
Nutrition, physical activity and lifestyle 282
Whether people regularly missed meals was unrelated to any diabetes risk factor, other than
negatively to age among all females (t-test: p=0.005). This most likely reflects diabetes
diagnosis rather than age as there were no differences according to age among never-diagnosed
women.
Nutrition security
Nutrition security at the household level is apparently lacking, with a substantial proportion of
participants reporting that they sometimes worry about not getting enough food: 14.3%(D♀),
6.7%(H♀), 14.9%(L♀), 31.6%(D♂) and 20.0%(L♂). This is higher than a more general
Queensland survey on food insufficiency, in which 11.3% of respondents reported insufficiency
at either individual or household level (Radimer et al. 1997a). None of the women who had had
gestational diabetes nor any of the high-risk men reported worrying about not getting enough
food.
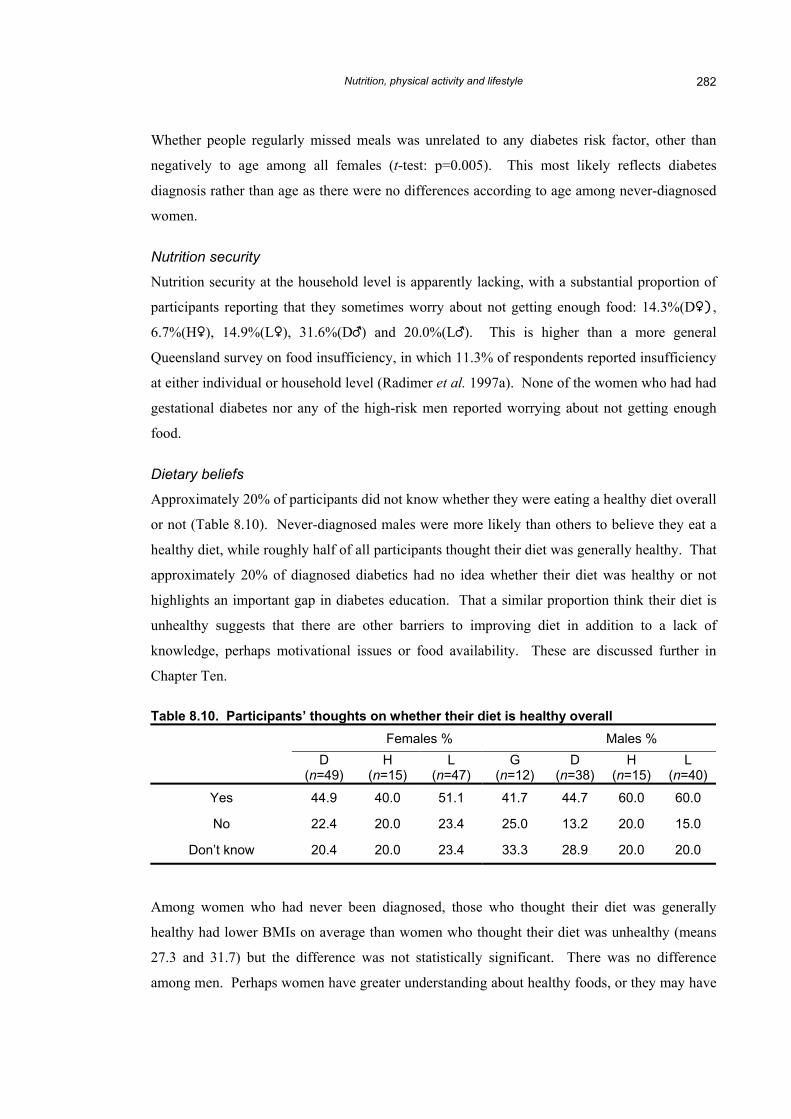
Dietary beliefs
Approximately 20% of participants did not know whether they were eating a healthy diet overall
or not (Table 8.10). Never-diagnosed males were more likely than others to believe they eat a
healthy diet, while roughly half of all participants thought their diet was generally healthy. That
approximately 20% of diagnosed diabetics had no idea whether their diet was healthy or not
highlights an important gap in diabetes education. That a similar proportion think their diet is
unhealthy suggests that there are other barriers to improving diet in addition to a lack of
knowledge, perhaps motivational issues or food availability. These are discussed further in
Chapter Ten.
Table 8.10. Participants’ thoughts on whether their diet is healthy overall Females % Males %
D (n=49)
H (n=15)
L (n=47)
G (n=12)
D (n=38)
H (n=15)
L (n=40)
Yes 44.9 40.0 51.1 41.7 44.7 60.0 60.0
No 22.4 20.0 23.4 25.0 13.2 20.0 15.0
Don’t know 20.4 20.0 23.4 33.3 28.9 20.0 20.0
Among women who had never been diagnosed, those who thought their diet was generally
healthy had lower BMIs on average than women who thought their diet was unhealthy (means
27.3 and 31.7) but the difference was not statistically significant. There was no difference
among men. Perhaps women have greater understanding about healthy foods, or they may have
Nutrition, physical activity and lifestyle 283
responded to this question by thinking about their own body size in relation to others and made
their decision based on that comparison. Many women may recognise that their diet is
unhealthy, but may lack the motivation or the means to change it.
Where people shop
The vast majority of people do most of their food shopping in Murgon: 81.6%(D♀), 86.7%(H♀),
93.6%(L♀), 100%(G♀), 71.1%(D♂), 93.3%(H♂) and 97.5%(L♂). A few people in each group
also rated Cherbourg as where they do most of their shopping in addition to Murgon, but this
was less than 3% in each group.
Many people said they would choose to shop somewhere else (for example, Kingaroy rather
than Cherbourg or Murgon) if suitable transport were available: 36.7%(D♀), 46.7%(H♀),
53.2%(L♀), 50.0%(G♀), 15.8%%(D♂), 53.3%(H♂) and 47.5%(L♂). Relatively few diagnosed
males feel that transport availability is a problem probably because older males are the group
with the highest car ownership level. This is supported too by the most common means of
getting to the shops (Table 8.11). Most people report that they do most of their own shopping.
Table 8.11. Main transport used to do the shopping Females %a Males %a
D (n=49)
H (n=15)
L (n=47)
G (n=12)
D (n=38)
H (n=15)
L (n=40)
Someone else shops 4.1 0.0 8.5 0.0 7.9 13.3 17.5
Own car 34.7 20.0 25.5 33.3 53.3 40.0 30.0
Borrowed car 8.1 26.7 10.6 16.7 2.6 13.4 12.5
Someone else drives in their car 26.5 26.7 42.5 25.0 13.1 26.7 32.5
Walk 10.2 0.0 2.1 16.7 7.9 0.0 7.5
Bicycle 0.0 0.0 0.0 0.0 0.0 0.0 0.0
Other (e.g. taxi) 6.1 20.0 8.5 8.3 2.6 6.7 7.5 a Columns may sum to over 100% due to multiple responses
Nutrition, physical activity and lifestyle 284
8.2. Lifestyle results
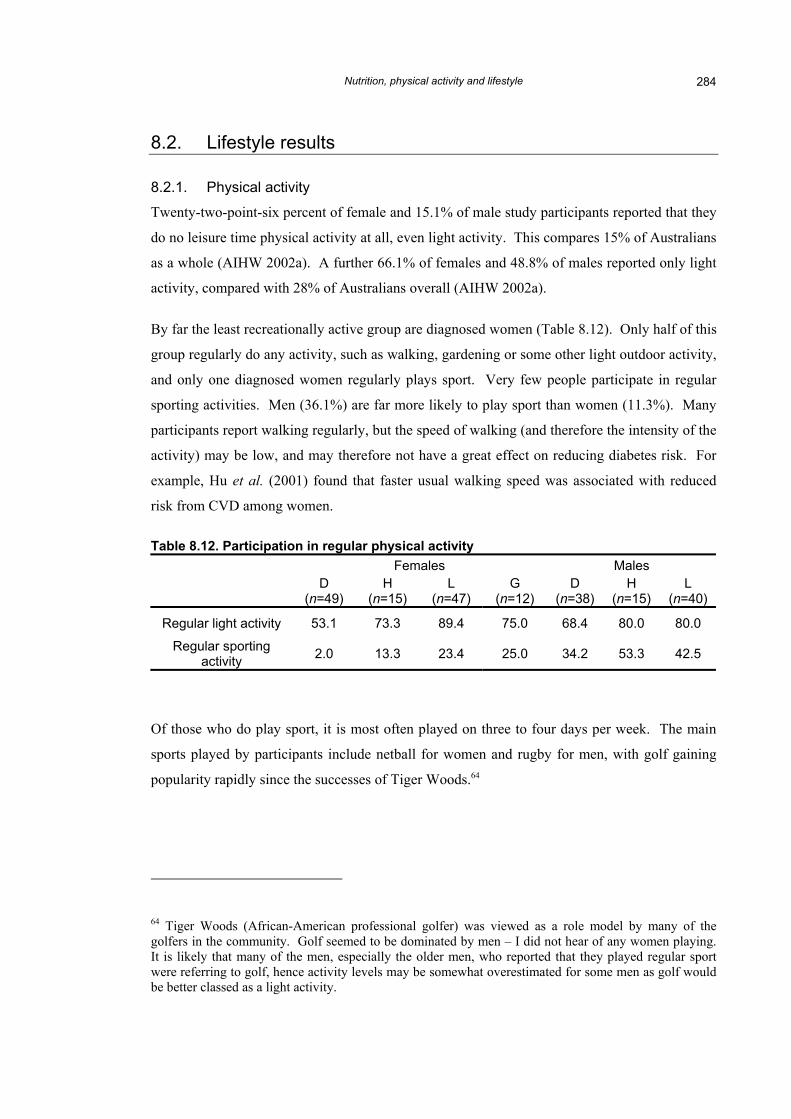
8.2.1. Physical activity
Twenty-two-point-six percent of female and 15.1% of male study participants reported that they
do no leisure time physical activity at all, even light activity. This compares 15% of Australians
as a whole (AIHW 2002a). A further 66.1% of females and 48.8% of males reported only light
activity, compared with 28% of Australians overall (AIHW 2002a).
By far the least recreationally active group are diagnosed women (Table 8.12). Only half of this
group regularly do any activity, such as walking, gardening or some other light outdoor activity,
and only one diagnosed women regularly plays sport. Very few people participate in regular
sporting activities. Men (36.1%) are far more likely to play sport than women (11.3%). Many
participants report walking regularly, but the speed of walking (and therefore the intensity of the
activity) may be low, and may therefore not have a great effect on reducing diabetes risk. For
example, Hu et al. (2001) found that faster usual walking speed was associated with reduced
risk from CVD among women.
Table 8.12. Participation in regular physical activity Females Males
Of those who do play sport, it is most often played on three to four days per week. The main
sports played by participants include netball for women and rugby for men, with golf gaining
popularity rapidly since the successes of Tiger Woods.64
64 Tiger Woods (African-American professional golfer) was viewed as a role model by many of the golfers in the community. Golf seemed to be dominated by men – I did not hear of any women playing. It is likely that many of the men, especially the older men, who reported that they played regular sport were referring to golf, hence activity levels may be somewhat overestimated for some men as golf would be better classed as a light activity.
Nutrition, physical activity and lifestyle 285
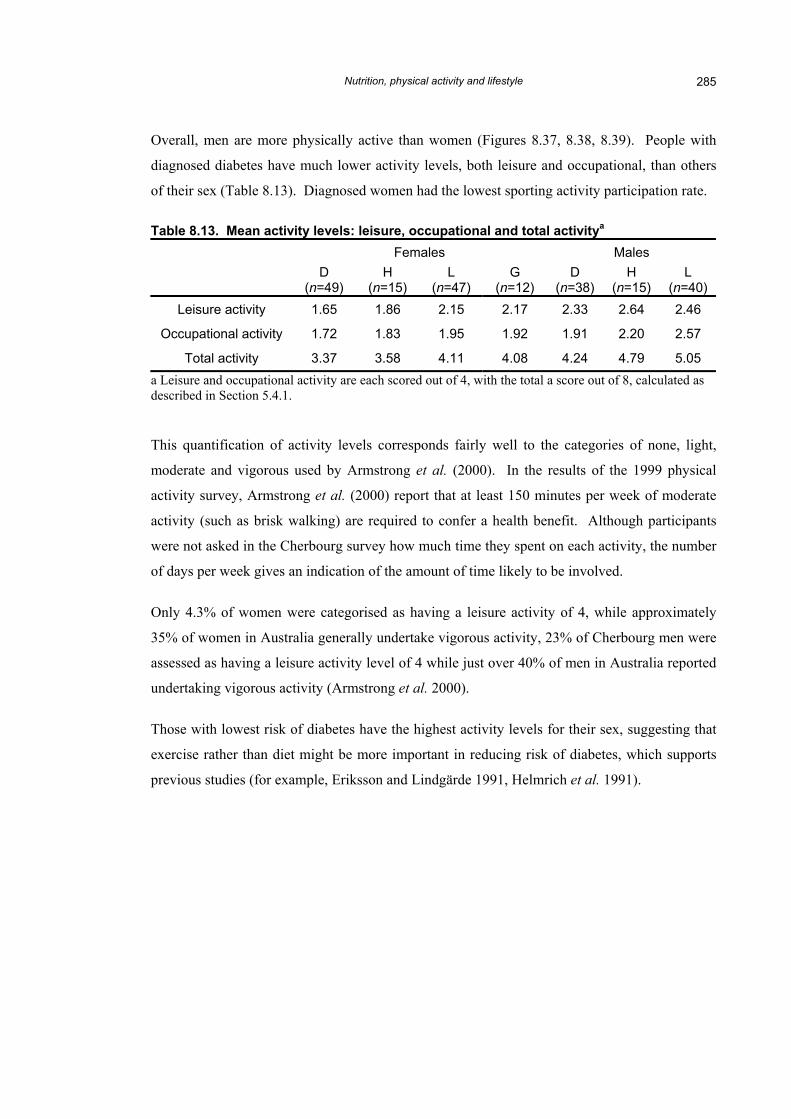
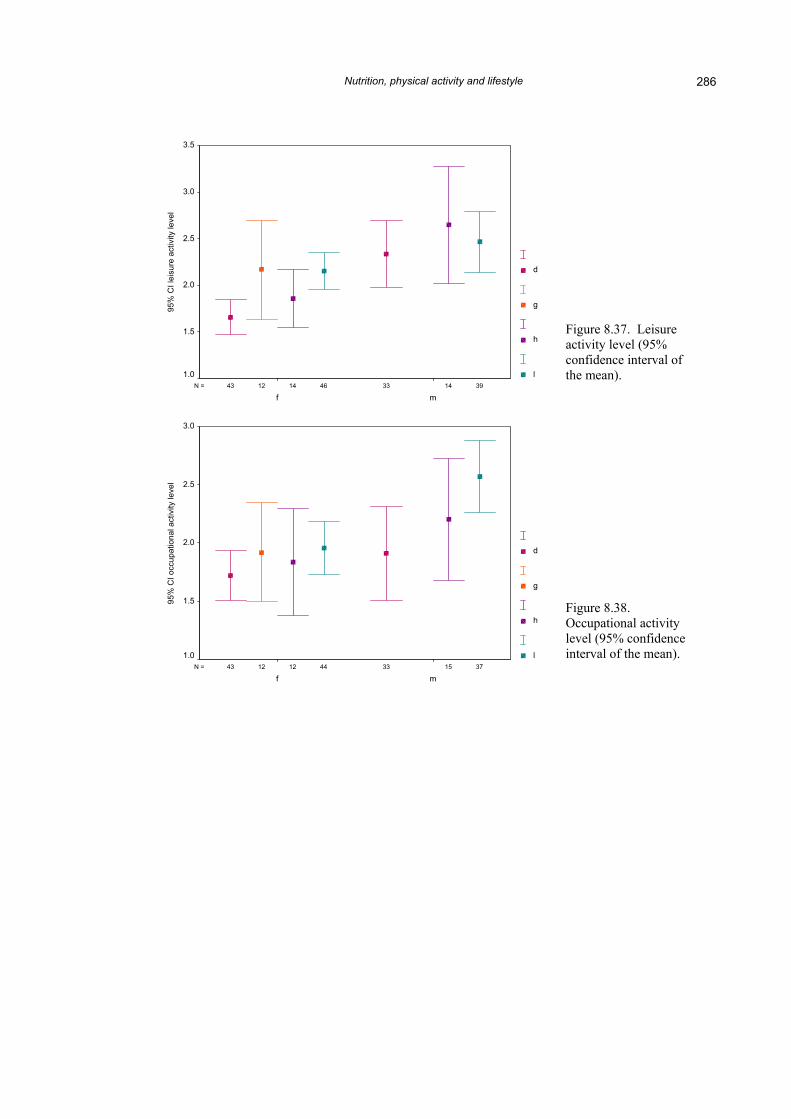
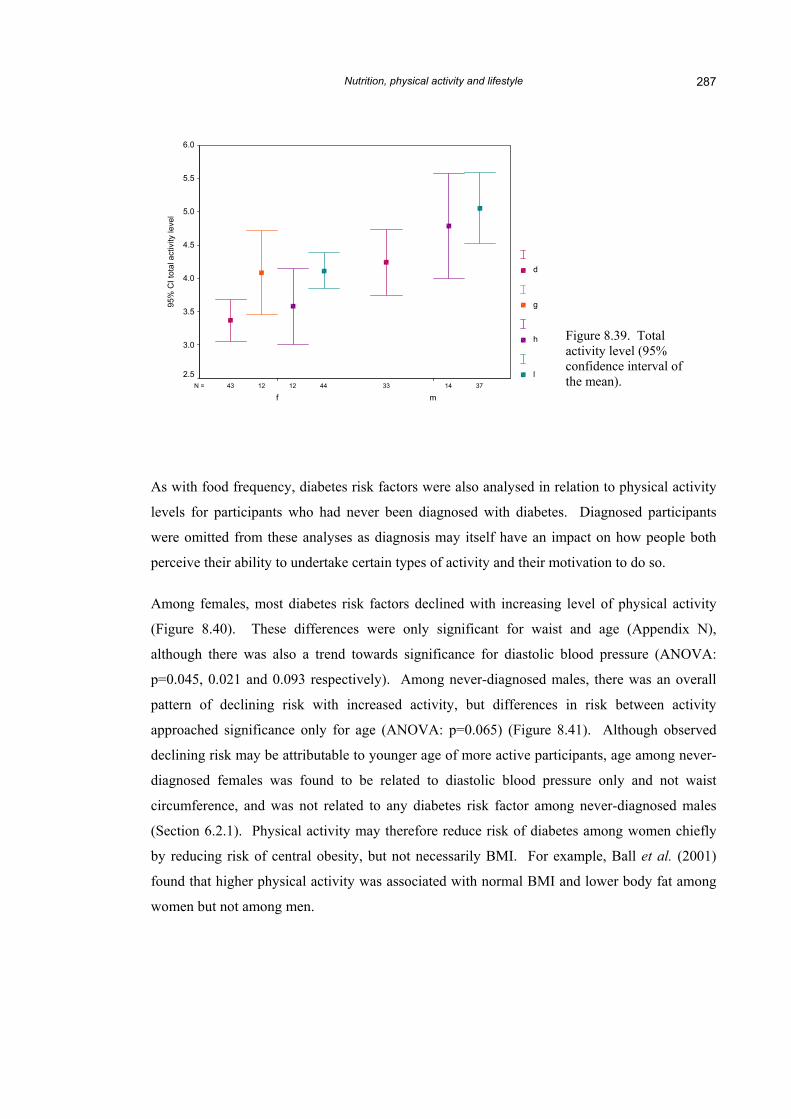
Overall, men are more physically active than women (Figures 8.37, 8.38, 8.39). People with
diagnosed diabetes have much lower activity levels, both leisure and occupational, than others
of their sex (Table 8.13). Diagnosed women had the lowest sporting activity participation rate.
Table 8.13. Mean activity levels: leisure, occupational and total activitya
Total activity 3.37 3.58 4.11 4.08 4.24 4.79 5.05 a Leisure and occupational activity are each scored out of 4, with the total a score out of 8, calculated as described in Section 5.4.1.
This quantification of activity levels corresponds fairly well to the categories of none, light,
moderate and vigorous used by Armstrong et al. (2000). In the results of the 1999 physical
activity survey, Armstrong et al. (2000) report that at least 150 minutes per week of moderate
activity (such as brisk walking) are required to confer a health benefit. Although participants
were not asked in the Cherbourg survey how much time they spent on each activity, the number
of days per week gives an indication of the amount of time likely to be involved.
Only 4.3% of women were categorised as having a leisure activity of 4, while approximately
35% of women in Australia generally undertake vigorous activity, 23% of Cherbourg men were
assessed as having a leisure activity level of 4 while just over 40% of men in Australia reported
undertaking vigorous activity (Armstrong et al. 2000).
Those with lowest risk of diabetes have the highest activity levels for their sex, suggesting that
exercise rather than diet might be more important in reducing risk of diabetes, which supports
previous studies (for example, Eriksson and Lindgärde 1991, Helmrich et al. 1991).
Figure 8.38. Occupational activity level (95% confidence interval of the mean).
Nutrition, physical activity and lifestyle 287
3744 141212 3343N =
mf
95%
CI t
otal
act
ivity
leve
l
6.0
5.5
5.0
4.5
4.0
3.5
3.0
2.5
d
g
h
l
Figure 8.39. Total activity level (95% confidence interval of the mean).
As with food frequency, diabetes risk factors were also analysed in relation to physical activity
levels for participants who had never been diagnosed with diabetes. Diagnosed participants
were omitted from these analyses as diagnosis may itself have an impact on how people both
perceive their ability to undertake certain types of activity and their motivation to do so.
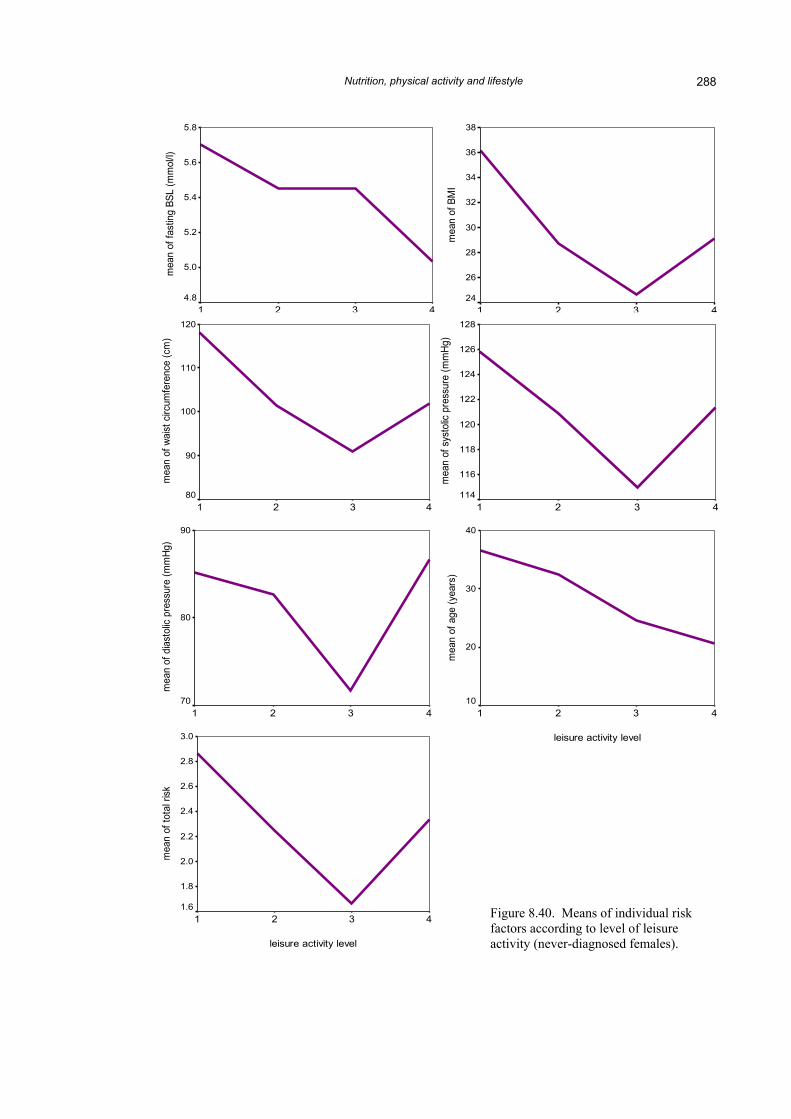
Among females, most diabetes risk factors declined with increasing level of physical activity
(Figure 8.40). These differences were only significant for waist and age (Appendix N),
although there was also a trend towards significance for diastolic blood pressure (ANOVA:
p=0.045, 0.021 and 0.093 respectively). Among never-diagnosed males, there was an overall
pattern of declining risk with increased activity, but differences in risk between activity
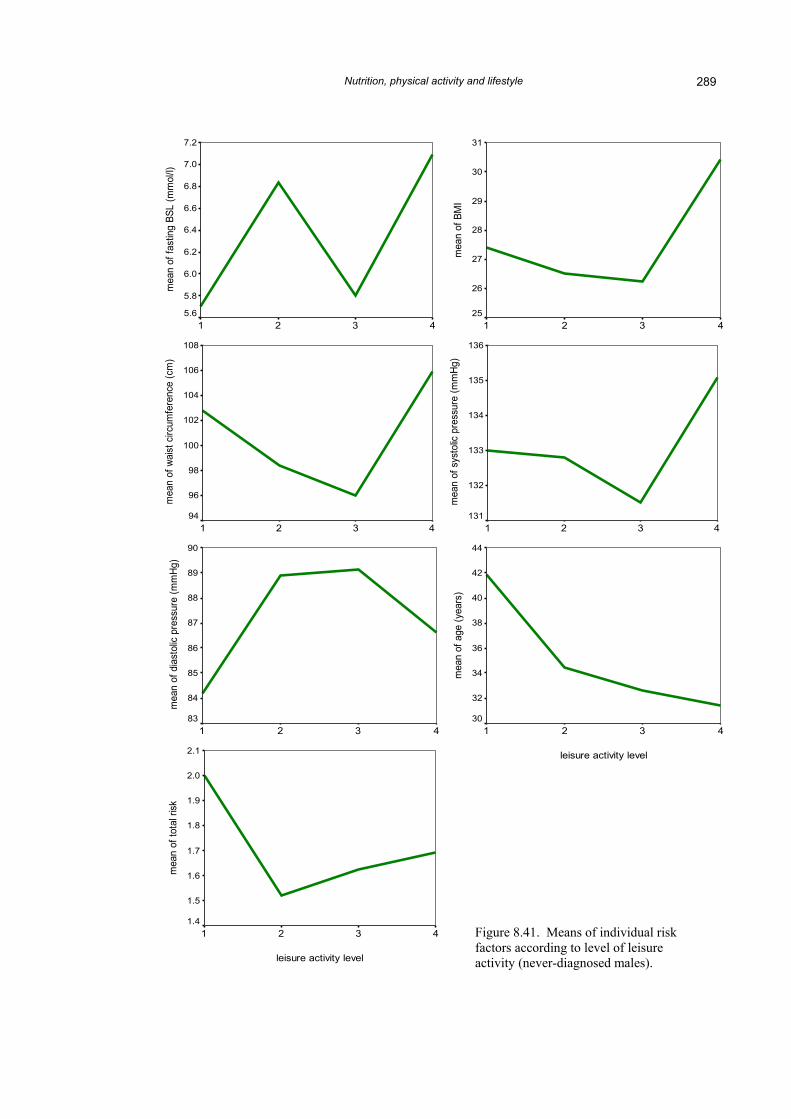
approached significance only for age (ANOVA: p=0.065) (Figure 8.41). Although observed
declining risk may be attributable to younger age of more active participants, age among never-
diagnosed females was found to be related to diastolic blood pressure only and not waist
circumference, and was not related to any diabetes risk factor among never-diagnosed males
(Section 6.2.1). Physical activity may therefore reduce risk of diabetes among women chiefly
by reducing risk of central obesity, but not necessarily BMI. For example, Ball et al. (2001)
found that higher physical activity was associated with normal BMI and lower body fat among
women but not among men.
Nutrition, physical activity and lifestyle
288
leisure activity level
4321
mea
n of
BM
I
38
36
34
32
30
28
26
24
leisure activity level
4321
mea
n of
fast
ing
BSL
(mm
ol/l)
5.8
5.6
5.4
5.2
5.0
4.8
leisure activity level
4321
mea
n of
sys
tolic
pre
ssur
e (m
mHg
)
128
126
124
122
120
118
116
114
leisure activity level
4321
mea
n of
wai
st c
ircum
fere
nce
(cm
)
120
110
100
90
80
leisure activity level
4321
mea
n of
age
(yea
rs)
40
30
20
10
leisure activity level
4321
mea
n of
dia
stol
ic pr
essu
re (m
mHg
)
90
80
70
3.0
leisure activity level
4321
mea
n of
tota
l risk
2.8
2.6
2.4
2.2
2.0
1.8
1.6
Figure 8.40. Means of individual risk factors according to level of leisure activity (never-diagnosed females).
Nutrition, physical activity and lifestyle
289
leisure activity level
4321
mea
n of
BM
I
31
30
29
28
27
26
25
leisure activity level
4321
mea
n of
sys
tolic
pre
ssur
e (m
mHg
)
136
135
134
133
132
131
leisure activity level
4321
mea
n of
fast
ing
BSL
(mm
ol/l)
7.2
7.0
6.8
6.6
6.4
6.2
6.0
5.8
5.6
leisure activity level
4321
mea
n of
wai
st c
ircum
fere
nce
(cm
)
108
106
104
102
100
98
96
94
leisure activity level
4321
mea
n of
age
(yea
rs)
44
42
40
38
36
34
32
30
leisure activity level
4321
mea
n of
dia
stol
ic pr
essu
re (m
mHg
)
90
89
88
87
86
85
84
83
2.1
leisure activity level
4321
mea
n of
tota
l risk
2.0
1.9
1.8
1.7
1.6
1.5
1.4
Figure 8.41. Means of individual risk factors according to level of leisure activity (never-diagnosed males).
Nutrition, physical activity and lifestyle 290
For every risk factor, other than age (and possibly FBSL in women), there is a change in
direction of risk that occurs at activity level 4. This could mean that no additional gains are
made with physical activity beyond a certain level, or it could mean that the method of
estimating physical activity became less accurate beyond level 3. For example, if men reported
participating in sport three days a week they were categorised as having a leisure activity level
of 4, but the sport they were most likely to be playing was golf, rather than a moderate to
vigorous activity (for example, cycling or squash).
It could also be that the physical activity questions were not precise enough to tease out more
subtle differences between groups, as only intensity and frequency were investigated, and not
duration of activity as Pols et al. (1998) recommend. Neither were they objective rather than
subjective measures such as doubly-labelled water or movement sensors, as recommended by
Wareham and Rennie (1998), methods which would not have been feasible in the present
study.65 Frequency and intensity, however, should be sufficient in this case to provide a relative
measure of activity between individuals and groups.
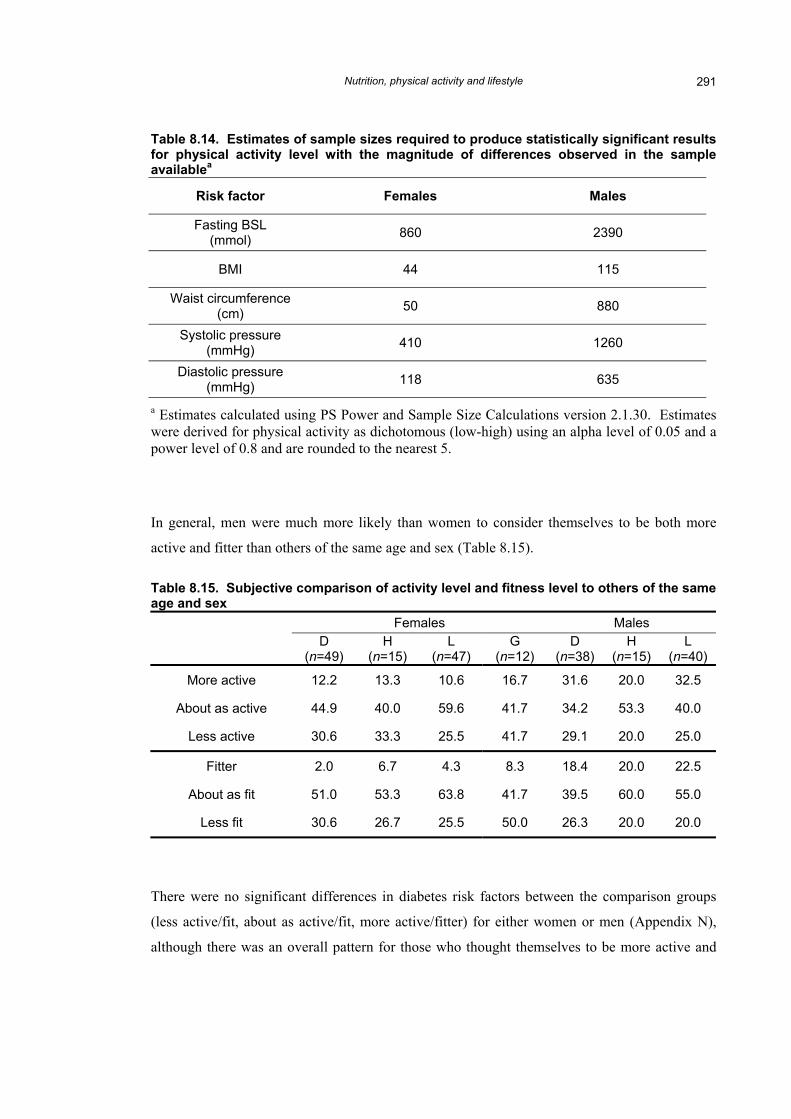
A further reason for the absence of statistical significance is again the small sample size. Table
8.14 provides estimates of the sample sizes required to produced statistically significant results.
65 Such methods are both more intrusive and could serve to increase people’s perceptions of feeling like guinea-pigs and reduce participation. For example, during my fieldwork, permission was refused by the Cherbourg Health Action Committee for a proposed study of body fat and fat-free mass using bioelectrical impedance. This study was primarily intended as a trial to test the method, and offered no obvious benefit to the community.
Nutrition, physical activity and lifestyle 291
Table 8.14. Estimates of sample sizes required to produce statistically significant results for physical activity level with the magnitude of differences observed in the sample availablea
Risk factor Females Males
Fasting BSL (mmol) 860 2390
BMI 44 115
Waist circumference (cm) 50 880
Systolic pressure (mmHg) 410 1260
Diastolic pressure (mmHg) 118 635
a Estimates calculated using PS Power and Sample Size Calculations version 2.1.30. Estimates were derived for physical activity as dichotomous (low-high) using an alpha level of 0.05 and a power level of 0.8 and are rounded to the nearest 5.
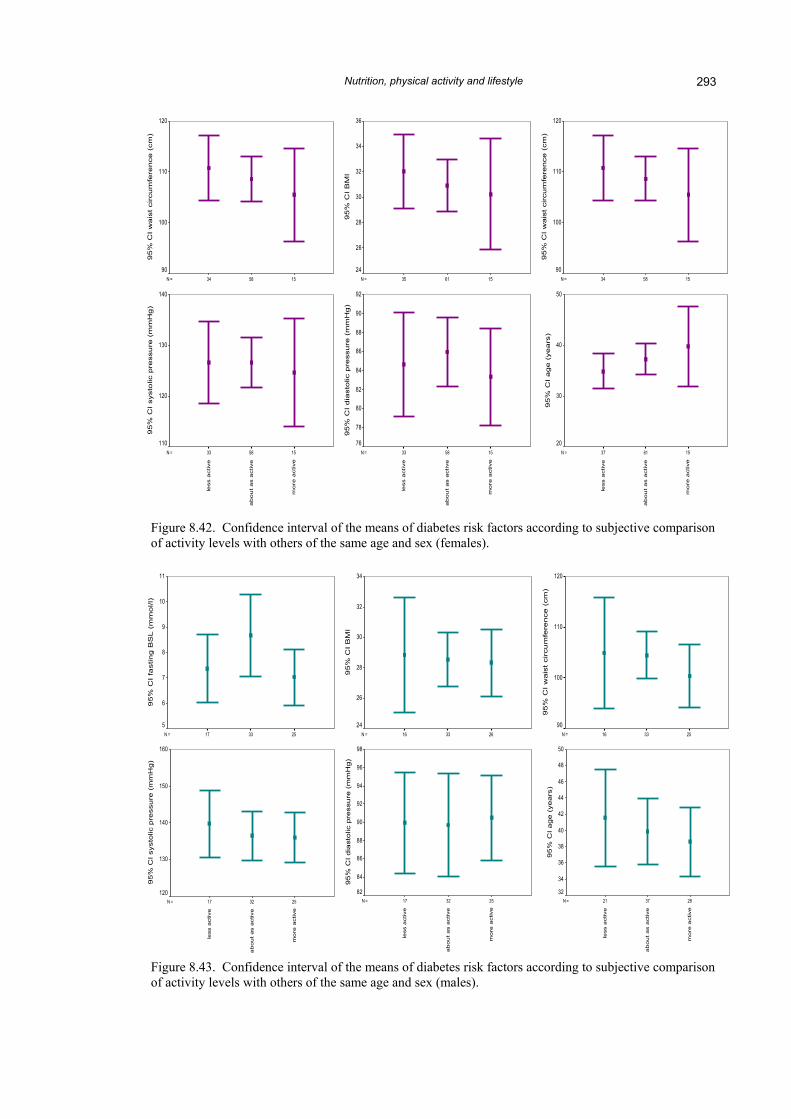
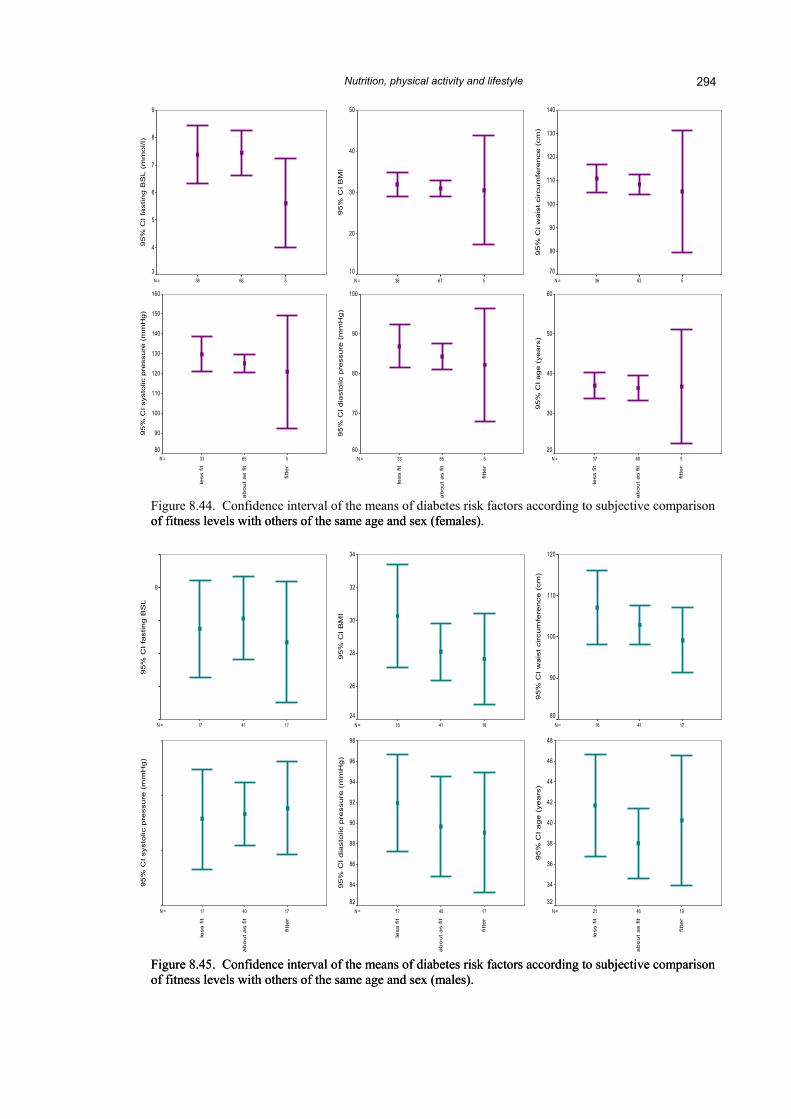
In general, men were much more likely than women to consider themselves to be both more
active and fitter than others of the same age and sex (Table 8.15).
Table 8.15. Subjective comparison of activity level and fitness level to others of the same age and sex
Females Males D
(n=49) H
(n=15) L
(n=47) G
(n=12) D
(n=38) H
(n=15) L
(n=40)
More active 12.2 13.3 10.6 16.7 31.6 20.0 32.5
About as active 44.9 40.0 59.6 41.7 34.2 53.3 40.0
Less active 30.6 33.3 25.5 41.7 29.1 20.0 25.0
Fitter 2.0 6.7 4.3 8.3 18.4 20.0 22.5
About as fit 51.0 53.3 63.8 41.7 39.5 60.0 55.0
Less fit 30.6 26.7 25.5 50.0 26.3 20.0 20.0
There were no significant differences in diabetes risk factors between the comparison groups
(less active/fit, about as active/fit, more active/fitter) for either women or men (Appendix N),
although there was an overall pattern for those who thought themselves to be more active and
Nutrition, physical activity and lifestyle 292
fitter to have lower risk factor measurements, suggesting that perceptions of relative activity and
fitness may be fairly accurate (Figures 8.42 to 8.45). This pattern was less obvious among men.
Interestingly, subjective rating of activity level increases with age among females, suggesting
either that older women are either more active than younger women or they think that other
older women are less active than themselves. The reverse occurs among males, with older men
more likely to consider themselves less active than their peers, while younger men consider
themselves more active. This may be due to overconfidence among young men regarding their
health, and is possibly related to why so many of them are at greater risk of undiagnosed
diabetes (Section 6.3.2).
Nutrition, physical activity and lifestyle 293
155834N =
mo
re a
ctive
ab
ou
t a
s a
ctive
less a
ctive
95%
CI w
ais
t circum
fere
nce (
cm
)
120
110
100
90156135N =
mo
re a
ctive
ab
ou
t a
s a
ctive
less a
ctive
95
% C
I B
MI
36
34
32
30
28
26
24155834N =
mo
re a
ctive
ab
ou
t a
s a
ctive
less a
ctive
95%
CI w
ais
t circum
fere
nce (
cm
)
120
110
100
90
156137N =
mo
re a
ctive
ab
ou
t a
s a
ctive
less a
ctive
95%
CI age (
years
)
50
40
30
20155833N =
mo
re a
ctive
ab
ou
t a
s a
ctive
less a
ctive
95%
CI dia
sto
lic p
ressure
(m
mH
g)
92
90
88
86
84
82
80
78
76155833N =
mo
re a
ctive
ab
ou
t a
s a
ctive
less a
ctive
95%
CI systo
lic p
ressure
(m
mH
g)
140
130
120
110
Figure 8.42. Confidence interval of the means of diabetes risk factors according to subjective comparison of activity levels with others of the same age and sex (females). Figure 8.43. Confidence interval of the means of diabetes risk factors according to subjective comparison of activity levels with others of the same age and sex (males).
253316N =
mo
re a
ctive
ab
ou
t a
s a
ctive
less a
ctive
95%
CI w
ais
t circum
fere
nce (
cm
)
120
110
100
90263316N =
mo
re a
ctive
ab
ou
t a
s a
ctive
less a
ctive
95
% C
I B
MI
34
32
30
28
26
24253317N =
mo
re a
ctive
ab
ou
t a
s a
ctive
less a
ctive
95%
CI fa
sting B
SL (
mm
ol/l)
11
10
9
8
7
6
5
283721N =
mo
re a
ctiv
e
ab
ou
t a
s a
ctiv
e
less
act
ive
95
% C
I a
ge
(ye
ars
)
50
48
46
44
42
40
38
36
34
32253217N =
mo
re a
ctiv
e
ab
ou
t a
s a
ctiv
e
less
act
ive
95
% C
I d
iast
olic
pre
ssure
(m
mH
g)
98
96
94
92
90
88
86
84
82253217N =
mo
re a
ctiv
e
ab
ou
t a
s a
ctiv
e
less
act
ive
95
% C
I sy
stolic
pre
ssu
re (
mm
Hg)
160
150
140
130
120
Nutrition, physical activity and lifestyle 294
56336N =
fitt
er
ab
ou
t a
s f
it
less f
it
95%
CI w
ais
t circum
fere
nce (
cm
)
140
130
120
110
100
90
80
7056736N =
fitt
er
ab
ou
t a
s f
it
less f
it
95
% C
I B
MI
50
40
30
20
1056636
fitt
er
ab
ou
t a
s f
it
less f
it
95%
CI fa
sting B
SL (
mm
ol/l)
9
8
7 6 5
4
N =
3
56837N =
fitte
r
ab
ou
t a
s fit
less
fit
95%
CI age (
years
)
60
50
40
30
2056533N =
fitte
r
ab
ou
t a
s fit
less
fit
95%
CI dia
stolic
pre
ssure
(m
mH
g)
100
90
80
70
6056533N =
fitte
r
ab
ou
t a
s fit
less
fit
95%
CI sy
stolic
pre
ssure
(m
mH
g)
160 150 140 130 120 110 100
90 80
Figure 8.44. Confidence interval of the means of diabetes risk factors according to subjective comparison of fitness levels with others of the same age and sex (females). of fitness levels with others of the same age and sex (females). 10
8
7
6
5
150
140
130
120
Figure 8.45. Confidence interval of the means of diabetes risk factors according to subjective comparison of fitness levels with others of the same age and sex (males). Figure 8.45. Confidence interval of the means of diabetes risk factors according to subjective comparison of fitness levels with others of the same age and sex (males).
174116N =
fitt
er
ab
ou
t a
s f
it
less f
it
95%
CI w
ais
t circum
fere
nce (
cm
)
120
110
100
90
80
194621N =
fitt
er
ab
ou
t a
s f
it
less f
it
95%
CI age (
years
)
48
46
44
42
40
38
36
34
32
184116N =
fitt
er
ab
ou
t a
s f
it
less f
it
95
% C
I B
MI
34
32
30
28
26
24174117N =
fitt
er
ab
ou
t a
s f
it
less f
it
95%
CI fa
sting B
SL
9
174017N =
fitt
er
ab
ou
t a
s f
it
less f
it
95%
CI systo
lic p
ressure
(m
mH
g)
174017N =
fitt
er
ab
ou
t a
s f
it
less f
it
95%
CI dia
sto
lic p
ressure
(m
mH
g)
98
96
94
92
90
88
86
84
82
Nutrition, physical activity and lifestyle 295
Perceived relative fitness seems to have very little to do with objective measures of body shape
(BMI and waist circumference) among women (Figure 8.44), but men who think they are fitter
than their peers also have slightly lower mean BMI and waist circumference (Figure 8.45). The
much larger confidence interval for means of women who think they are fitter than their peers is
probably due to the very small number in this category (5).
8.2.2. Alcohol consumption
Many participants reported that they never drink alcohol, especially women (Table 8.16), and
most of those who consume alcohol do so on fewer than two days per week. On a day when
alcohol is used, however, the number of drinks consumed may be very high. In Australia as a
whole, approximately 17% of adults do not drink alcohol (AIHW 2002a), substantially fewer
than among participants in the present study where 45% of all females and 26% of all males
reported that they did not drink alcohol.
The proportion of non-drinkers is not static across groups. Reported alcohol frequency and
amount, in addition to anecdotal evidence from study participants, suggest that diagnosis
impacts considerably on people’s pattern of alcohol consumption. However, although the
proportion of diagnosed people who do not consume alcohol is high, those who do drink alcohol
continue to drink at ‘risky’ or ‘high-risk’ levels (see below) on a day when they consume
alcohol. Among participants who had never been diagnosed, although fewer women drink
alcohol than men, those who do report drinking both more frequently and consuming more per
drinking day than men. Frequently used alcoholic drinks include beer, spirits and fortified wine
(sold by the flagon), which may be consumed in tumblers or mugs or from the bottle.
Nutrition, physical activity and lifestyle 296
Table 8.16. Alcohol consumption frequency and quantity Females % Males %
D (n=49)
H (n=15)
L (n=47)
G (n=12)
D (n=38)
H (n=15)
L (n=40)
Never 75.6 28.6 28.3 25.0 39.4 21.4 16.2
Less than once a week 17.1 7.1 10.9 58.3 33.3 28.6 18.9
1 or 2 days per week 2.4 50.0 23.9 16.7 18.2 21.4 40.5
3 or 4 days per week 0.0 0.0 21.7 0.0 9.1 14.3 13.5
5 or 6 days per week 2.4 0.0 8.7 0.0 0.0 0.0 5.4
Usu
al fr
eque
ncy
Everyday 2.4 14.3 6.5 0.0 0.0 14.3 5.4
1 or 2 drinks 0.0 0.0 0.0 0.0 0.0 0.0 0.0
3 or 4 drinks 0.0 0.0 0.0 11.1 10.0 0.0 3.1
5 to 8 drinks 30.0 0.0 3.0 11.1 10.0 0.0 3.1
9 to 12 drinks 10.0 0.0 9.1 44.4 25.0 36.4 9.4
13 to 20 drinks 10.0 10.0 12.1 11.1 5.0 9.1 15.6
Usu
al n
umbe
r of d
rinks
per
dr
inki
ng d
aya
More than 20 drinks 50.0 90.0 75.8 22.2 50.0 54.5 68.8
a Of the participants who consume alcohol. ‘Number of drinks’ was not standardised, e.g. one can of beer contains approximately 1.4 ‘standard’ drinks, and so the number of standard drinks may actually be much higher than reported number of drinks. In Australia, one standard drink contains 10g of alcohol. The amount of alcohol in a standard drink varies internationally (Food Standards Australia New Zealand 2002).
In the Australian population as a whole, 12% of females and 15% of males drink one or more
times per week at levels considered either ‘risky’ or ‘high-risk’ in the short-term (defined for
females as five or six and seven or more drinks respectively per drinking day, and for males
seven to 10 and 11 or more drinks respectively) (AIHW 2002a). Among female study
participants, approximately 8.1% were drinking at risky levels and 85.4% (93.5% combined)
were drinking at high-risk levels. Among males, these rates were 4.8% and 90.4% respectively
(95.2% combined). When non-drinkers are included, 52.1% of all females and 70.6% of all
males were engaging in short term risky or high-risk drinking.
Nutrition, physical activity and lifestyle 297
Of those who drink, women’s long-term drinking behaviour is on the whole riskier than men’s.
Long-term ‘risky’ and ‘high-risk’ levels of drinking (defined as: 15 to 28 and 29 or more drinks
per week for females; 29 to 42 and 43 or more for males) (AIHW 2002a) are apparent for 4.5%
and 31.9% of all women (36.4% combined), and 23.8% and 15.6% of all men (39.4%
combined).
A previous national study on indigenous obesity found that those who do not drink alcohol tend
to have higher BMIs on average than those who do (Cunningham and Mackerras 1994). This
could be because heavy drinking often correlates with heavy smoking as well as limiting the
intake of foods, hence the heaviest drinkers may be poorly nourished. Indeed, a common reason
reported by participants for missing meals was because they had been drinking or were ‘grog
sick’. It could also be that the Cunningham and Mackerras (1994) study did not consider the
potential behaviour-modifying effects of diagnosis with diabetes, that diagnosed people may
both have higher BMIs and be less likely to consume alcohol than people without diagnosed
diabetes.
There were no significant correlations between any of the measures of alcohol consumption and
specific risks of diabetes among never-diagnosed women, although a negative association
between alcohol frequency and BMI approached significance (Pearson correlation: p=0.091)
which supports the findings from Cunningham and Mackerras (1994). A positive (but non-
significant) relationship was also found between diastolic blood pressure and both alcohol
frequency and overall alcohol consumption (Pearson correlation: p=0.064 and 0.065
respectively) (Appendix O). Means of BMI and diastolic pressure according to alcohol
frequency are shown in Figure 8.45. There was a mean difference of nearly 12mmHg in
diastolic blood pressure between women who did not consume alcohol and women who
consumed alcohol every day. The group which showed the highest measurements for most
diabetes risk factors were women who drink on one to two days per week (Appendix O).
Among never-diagnosed males, both alcohol frequency and total alcohol consumption were
significantly positively related to diastolic blood pressure (Pearson correlation: p=0.005 and
0.012 respectively) and showed a non-significant positive association with systolic blood
pressure (Pearson correlation: p=0.053 and 0.077 respectively). These means are shown in
Figure 8.46. Among males, increased blood pressure related to alcohol consumption seems to
commence where consumption reaches three to four days per week. Below this frequency, there
Nutrition, physical activity and lifestyle 298
appears to be very little difference in blood pressure associated with alcohol frequency. Alcohol
consumption was not found to be correlated with age in either women or men.
number of usual drinking days per week
7.05.53.51.5.50m
ean
dias
tolic
pre
ssur
e (m
mH
g)
94
92
90
88
86
84
82
80
78
76
number of usual drinking days per week
7.05.53.51.5.50
mea
n BM
I
34
32
30
28
26
24
22
20
Figure 8.45. Mean BMI and mean diastolic pressure according to frequency of usual weekly alcohol consumption (days per week): females.
number of usual drinking days per week
7.05.53.51.5.50
mea
n di
asto
lic p
ress
ure
(mm
Hg)
110
105
100
95
90
85
80
number of usual drinking days per week
7.05.53.51.5.50
mea
n sy
stol
ic p
ress
ure
(mm
Hg)
146
144
142
140
138
136
134
132
130
128
Figure 8.46. Mean systolic and diastolic pressures according to frequency of usual weekly alcohol consumption (days per week): males.
Given the absence of associations between most diabetes risk factors and patterns of alcohol
consumption, and the large proportion of the community that does not drink alcohol, these
findings suggest that alcohol consumption alone is not responsible for the high rates of diabetes
in the community. The patterns of alcohol consumption may, however, be very important in
Nutrition, physical activity and lifestyle 299
contributing to enhanced CVD risk among those who drink, through increasing blood pressure
(especially among males).
8.2.3. Smoking
Women are more likely to be current tobacco smokers than men, and those with diagnosed
diabetes are less likely to smoke than those who have never been diagnosed (Table 8.17).
Smoking among men occurs at twice the rate of Australian men overall (45% Cherbourg, 21%
Australia), while among women the difference is much greater, at four times the rate for
Australian women (73% Cherbourg, 18% Australia)66 (AIHW 2002a).
Table 8.17. Participants who are regular smokers Females % Males %
D (n=49)
H (n=15)
L (n=47)
G (n=12)
D (n=38)
H (n=15)
L (n=40)
Current smokers 42.9 73.3 66.0 83.3 23.7 53.3 70.0
Mean number of cigarettes per day a 17.7 26.7 20.9 20.0 20.4 20.0 20.3
a Calculation based on current smokers only.
Of those who do smoke, diagnosed women consume on average the fewest cigarettes each day
(17.7), so perhaps they have tried to reduce their tobacco consumption. High-risk women
smoke the most (26.7) while other groups smoke approximately 20 cigarettes per day. These
differences were not significant (ANOVA: p=0.772) (Appendix P).
Only a small proportion of non-smokers reported that they had been regular smokers in the past
(between 2% and 8%), and so behavioural change due to diagnosis of diabetes is unlikely to be
the main reason for the differences between the diagnosed and never-diagnosed groups.
Instead, the difference is probably due to age, with a very high uptake of smoking among young
people, especially women, contributing to the high rates reported among those without
diagnosed diabetes.
Among never-diagnosed participants, mean BMI was slightly lower among female smokers than
non-smokers (28.9 versus 29.6) but this difference was not significant (p=0.728, two-tailed
66 Australian rates include those aged over 14 years.
Nutrition, physical activity and lifestyle 300
t-test). Among never-diagnosed men, current smokers had a significantly lower BMI (25.4
versus 32.0 among non-smokers, p<0.001). Being male and a smoker may combine with other
factors that limit nutritional intake, such as frequent and/or heavy alcohol use, and may depress
appetite.
8.2.4. Recent lifestyle change
Recent weight change
Is recent weight change associated with diabetes risk? Gaining or losing weight over the
previous 12 months was reported by a number of participants. In general, women’s weight
appears less stable than men’s, as a greater number reported recent weight change (Table 8.18).
Table 8.18. Reported weight change over previous 12 months
Females % Males %
D (n=49)
H (n=15)
L (n=47)
G (n=12)
D (n=38)
H (n=15)
L (n=40)
Gained weight 14.3 40.0 25.5 41.7 18.4 26.7 22.5
Lost weight 34.7 13.3 27.7 41.7 15.8
0.0 0.0
13.3
40.0 15.0
Both lost and gained 0.0 0.0 2.6 0.0 0.0
No change 12.2 17.0 0.0 23.7 20.0 25.0
Don’t know 24.5 26.7 25.5 16.7 21.1 13.3 35.0
Mean change in weight in kilos a -2.8 . -2.3 -2.8 -1.57 +3.0 +2.6
Range of weight change in kilos (na)
-12 to +5 (10) .
-20 to +20 (8)
-30 to +8 (5)
-20 to +10 (7)
-5 to +10 (4)
-10 to +20 (9)
a Of those reporting weight change who knew how much they had gained or lost. No high-risk woman knew by how much her weight had changed.
The changes reported in weight suggest that some of those with diagnosed diabetes are having
some success in reducing their weight, as they are less likely to report weight gain than their
never-diagnosed counterparts. These changes to weight are for most, however, very small.
Insulin resistance can enhance capacity for weight gain, and this may make it much harder for
some people to deliberately lose weight. Unfortunately, these patterns of weight change may
not accurately reflect overall change in the community, as many people did not know how much
their weight had changed over the previous year, just whether they had lost or gained weight.
Nutrition, physical activity and lifestyle 301
Recent changes to diet and exercise
Diagnosed diabetics, especially men, were more likely to have made changes to their diets
within the last five years in order to be healthier (Table 8.19). To improve their health, many
people have also made recent changes to how much exercise they do, but the group reporting
the lowest rate for changes to exercise is diagnosed women. This group also expressed the least
willingness to change their exercise regime (see below).
Table 8.19. Whether participants had made changes to diet and exercise in the previous five years
Females % Males % D
(n=49) H
(n=15) L
(n=47) G
(n=12) D
(n=38) H
(n=15) L
(n=40)
Yes 30.6 20.0 29.8 25.0 47.4 26.7 30.0
Die
t
No 57.1 73.3 68.1 75.0 39.5 73.3 67.5
Yes 18.4 26.7 27.7 25.0 28.9 20.0 40.0
Exer
cise
No 69.4 60.0 68.1 66.7 57.9 73.3 57.5
8.2.5. Willingness to change diet and exercise
Both women and with diagnosed diabetes are more willing to change their diet than the amount
of exercise they do (Table 8.20). Men overall expressed greater willingness than women to
change how much exercise they do. It appears that diagnosis with diabetes is a great motivator
towards women’s willingness to change what they eat, with diagnosed women reporting more
willingness and less unwillingness than never-diagnosed women. Men who have been
diagnosed are more willing than women to change both their diet and exercise regime, but less
willing than never-diagnosed men. The unwillingness expressed by some males may be related
to their belief that they are already eating well (Table 8.10 above). Gender-related differences
in barriers to changing diet and exercise patterns are explored in Chapter Ten.
Nutrition, physical activity and lifestyle 302
Table 8.20. Willingness to make changes to diet and exercise to be healthier Females Males
D (n=49)
H (n=15)
L (n=47)
G (n=12)
D (n=38)
H (n=15)
L (n=40)
Willing 59.2 33.3 46.8 58.3 52.6 66.7 52.5
Not willing 20.4 26.7 36.2 25.0 15.8 20.0 35.0 Die
t
Don’t know 8.2 33.3 12.8 16.7 18.4 13.3 7.5
Willing 36.7 33.3 46.8 58.3 52.6 60.0 50.0
Not willing 24.5 13.3 25.5 16.7 18.4 20.0 22.5
Exer
cise
Don’t know 24.5 33.3 23.4 25.0 15.8 13.3 22.5
8.3. Discussion and conclusions
There are few statistically significant dietary differences between categories of participants as
measured by the FFQ, nor are there consistent differences associated with particular risk factors.
Where there are differences, they relate more to diagnosis of diabetes rather than to the level of
risk among those without diabetes, suggesting that diagnosis motivates people to some extent to
consume what is perceived as a more nutritious diet, but that having well-publicised risk factors,
such as obesity, does not.
Associations between individual risk factors and food frequency appear to be positive for salt,
fat on meat and diet soft drink for FBSL, BMI and waist circumference, but inverse for total
animal foods, cereals and plant foods in relation to blood pressure.
That there is little difference in food frequencies associated with BMI may also mean that level
of physical activity may in fact be more important in determining diabetes risk than diet is, as
activity levels were inversely associated with risk factors associated with diabetes. As people
were in general more willing to change their diet than their levels of activity, a focus on the
benefits of increasing even incidental physical activity could have a profound impact on the risk
of diabetes in the community. This is discussed further in Chapter 10.
Nutrition security at the household level could be improved, with up to a third of participants
reporting that they sometime worry about not getting enough food. Nutrition education could
also be improved, as 20% of participants do not know whether their diet is healthy overall,
while between 40% and 60% of participants think that they do eat a healthy diet overall. There
Nutrition, physical activity and lifestyle 303
are further issues that constrain food choices, including a ‘captive market’; up to half the
participants stating that they would shop somewhere else if they had transport.
Physical activity levels in the community are low, women are less active than men, and women
with diagnosed diabetes are the least active of all. The importance of increasing physical
activity to have improved health was highlighted by the lower risk factor measurements among
women who were more active. This supports the widely accepted relationship between higher
levels of physical activity and reduced diabetes risk factors (for example, Reaven et al. 1996,
Samara et al. 1997 and Wannamethee et al. 2000). Perceived physical fitness relative to peers
was not associated with BMI among women.
Gregg et al. (1996) concluded from a study of Pima Indians with diabetes that physical activity
level was associated with perceived locus of control; those with an internal locus of control, i.e.
people who perceive everyday events to be more within their personal control than under the
control of external factors, such as government, were more physically active than those with an
external locus of control. Given the historical context of Cherbourg, especially the restrictions
placed on Aboriginal people and the removal of responsibilities and freedoms under legislation
until fairly recently, it is not surprising if participants tend to view their lives as not under their
personal control – the expectation of many, for example, is that they will get diabetes no matter
what they do. This could be further enhanced by both gender and age differences (see Section
10.3).
A large proportion of participants do not consume alcohol, but among those who do consume
alcohol, levels of consumption on drinking days are extremely high. BMI was slightly higher
among people who do not consume alcohol, which may be due to the large proportion of non-
drinkers who are diagnosed diabetics and have higher BMIs. A large number of these
participants may also be ex-drinkers, who have given up alcohol subsequent to diabetes
diagnosis. BMI was unrelated to alcohol consumption among never-diagnosed participants. As
obesity is the main modifiable risk factor associated with diabetes, it is unlikely that alcohol
consumption is contributing directly to diabetes risk. The absence of a positive association
between alcohol and BMI may also be due to co-occurrence of heavy alcohol consumption,
eating irregularly and smoking; such factors associated with heavy consumption of alcohol may
therefore act to keep weight down, hence reducing diabetes risk as it was measured in this study,
while risk to overall health remains high. Increased consumption of alcohol is related to higher
blood pressure rather than to other diabetes risk factors, suggesting that alcohol could play a
Nutrition, physical activity and lifestyle 304
major role in CVD. It may also be that those who are heavy consumers of alcohol are potential
candidates for pancreatitis (Toskes 2001), so that even if their body weight remains low their
risk of diabetes is increased.
Smoking rates in the Cherbourg community are more than double the rate for Australia as a
whole; smoking prevalence is extremely high, especially among young women in Cherbourg.
That approximately 70% of participants categorised as ‘low-risk’ smoke cigarettes does not
bode well for their future health; even if their current risk of diabetes is low, they are at
increased risk from CVD, respiratory diseases and cancers (AIHW 2002a). Perhaps the high
rate of smoking among women is partially due to perceived usefulness as a means for weight
control, as suggested by Abbey and Stewart (2000).
Methodological issues
Similar questionnaires to the FFQ used in the present study have been shown to be highly
repeatable in a range of subjects (Horwarth and Worsley 1990; Willett 1994; Franceschi et al.
1995; Lazarus et al. 1995; Smith et al. 1998). The FFQ emphasises overall patterns of
consumption rather than what was eaten over the previous few days and this may be most
advantageous in terms of understanding the development of diabetes.
Underreporting of food frequencies may be greater among those with higher BMIs (Johansson
et al. 2001), which would mask some possible dietary associations with BMI. Some dietary
studies exclude under-reporters from analyses (for example, see Smith et al. 1994). Neither the
presence or extent of underreporting was determined in the present study, however, as
comparison with actual energy requirements could not be made given, that the frequency
questionnaire provides an indication of dietary habits rather than quantifying nutrient intake.
One regular criticism of studies based on self-reporting is that participants are prone to tell the
researcher what they think they want to hear, or they might try to portray themselves in a
favourable light; promoting a social desirability bias (Radimer et al. 1997b). In the case of
food, this might manifest in under-reporting of consumption of foods that are perceived to be
‘bad’, unhealthy or socially undesirable (Johansson et al. 2001), and an over reporting of those
that are perceived to be ‘good’, healthy or socially desirable (Cook et al. 2000).
This is unlikely to be an issue in the present study. Participants seemed very open to reporting
‘unhealthy’ behaviours throughout the survey (for example, smoking and heavy alcohol
consumption, Section 8.2.2) and gave no impression of trying to give an answer they thought I
Nutrition, physical activity and lifestyle 305
might want. A fairly common response to questions about the consumption of ‘bad’ foods, such
as the fat on meat or take-away, was for the participant to sigh and say conspiratorially, ‘oh, I do
like the fat’ or ‘I do get take-away sometimes because it’s easy’. Participants therefore seemed
willing to admit to eating a particular type of food ‘more than they should’. They might know a
food to be unhealthy, but did not see that as a reason to hide their consumption of it. As the
voluntary and confidential nature of the survey were of course also emphasised to the
participants, this might also have reduced the bias away from undesirable responses.
Recall bias – that some participants might systematically be more or less likely to recall eating
certain types of foods – could potentially have occurred (Liu et al. 2000). Those diagnosed with
diabetes for instance may be more likely to recall eating foods they have been educated to eat
more or less of. Examining ratios of reported frequencies (for example, ratios of wholemeal to
white bread) might have controlled for any such bias. In addition, it is unlikely that systematic
effects of bias would have occurred between the high-risk and the low-risk groups in relation to
diabetes significant foods, given that they would not have received such targeted advice.
Using a fixed list of foods in a frequency questionnaire may be somewhat limiting (Guest and
O'Dea 1993), although the foods that were included were chosen after consultation with the
community nutritionist67 as to the sorts of foods that would be most appropriate given
community pattern of consumption.
Striking a balance between accuracy and convenience, the use of this simple FFQ was suitable
for the purpose of this study, to establish general patterns of consumption within the community
and determine if there are overall differences between particular groups; attaining relative
validity, rather than absolute validity, is more important in epidemiological nutrition assessment
(Block 1982). A greater number of items may have increased specificity and helped tease out
intergroup differences.
The following chapter explores risk on its social context, in particular the contributions made by