Page 1
ENVIRONMENTAL RESOURCES MANAGEMENT ABLE UK LTD
8-1
8 HYDRODYNAMIC & SEDIMENTARY REGIME
8.1 INTRODUCTION
8.1.1 This chapter examines the likely significant effects of AMEP on the
hydrodynamic and sedimentary regime of the Humber Estuary. The
development of AMEP will cause an alteration of the local estuary
shoreline and bathymetry, which may lead to changes to existing
estuarine processes both in close proximity to AMEP and potentially
remotely. This chapter evaluates the potential effects of AMEP in terms
of physical processes (for example changes to hydrodynamics, sediment
transport, waves and geomorphology) and its findings have been used
to inform the impact assessment that is reported in other chapters of the
ES.
8.1.2 The Humber Estuary is a dynamic estuarine environment with complex
hydrodynamic processes controlling local and wider scale sediment
transport processes. The nature of these hydrodynamic processes is
determined by a range of factors including the local and general estuary
morphology, wave climate, tidal range and freshwater inputs.
Additionally, the Humber Estuary contains numerous man-made
structures that change the flow and sediment patterns. The components
of AMEP comprise a solid reclamation and quay that will protrude
from the flood defence wall into the intertidal and sub-tidal area, and
dredging of the surrounding bathymetry for shipping access. The
development will therefore result in an alteration of the local estuary
morphology at Killingholme.
8.1.3 Impacts of the associated Compensation Site on the hydrodynamic and
sedimentary regime are not included in this chapter as these are
addressed in Chapter 32.
8.1.4 This chapter has been informed by four technical assessments including
numerical modelling studies:
• Annex 8.1 AMEP Estuary Modelling Studies (JBA Consulting, 2011a)
• Annex 8.2 Review of Geomorphological Dynamics of the Humber
Estuary (JBA Consulting, 2011b);
• Annex 8.3 Able Marine Energy Park 3D Mud Modelling (HR
Wallingford, 2011a)
Page 2
ENVIRONMENTAL RESOURCES MANAGEMENT ABLE UK LTD
8-2
• Annex 8.4 Able Marine Energy Park – Dredging Plume Dispersion
Arising From Capital Works (HR Wallingford, 2011b)
8.1.5 During the course of undertaking these studies, the design of the AMEP
has evolved (as described in Annex 4.4). The impacts presented in this
chapter are informed by hydrodynamic and sediment modelling results
for different iterations of the scheme. In all cases where the impacts are
based upon an earlier layout for AMEP, these relate to a larger scheme
set forward further into the estuary. For clarity, the different layouts are
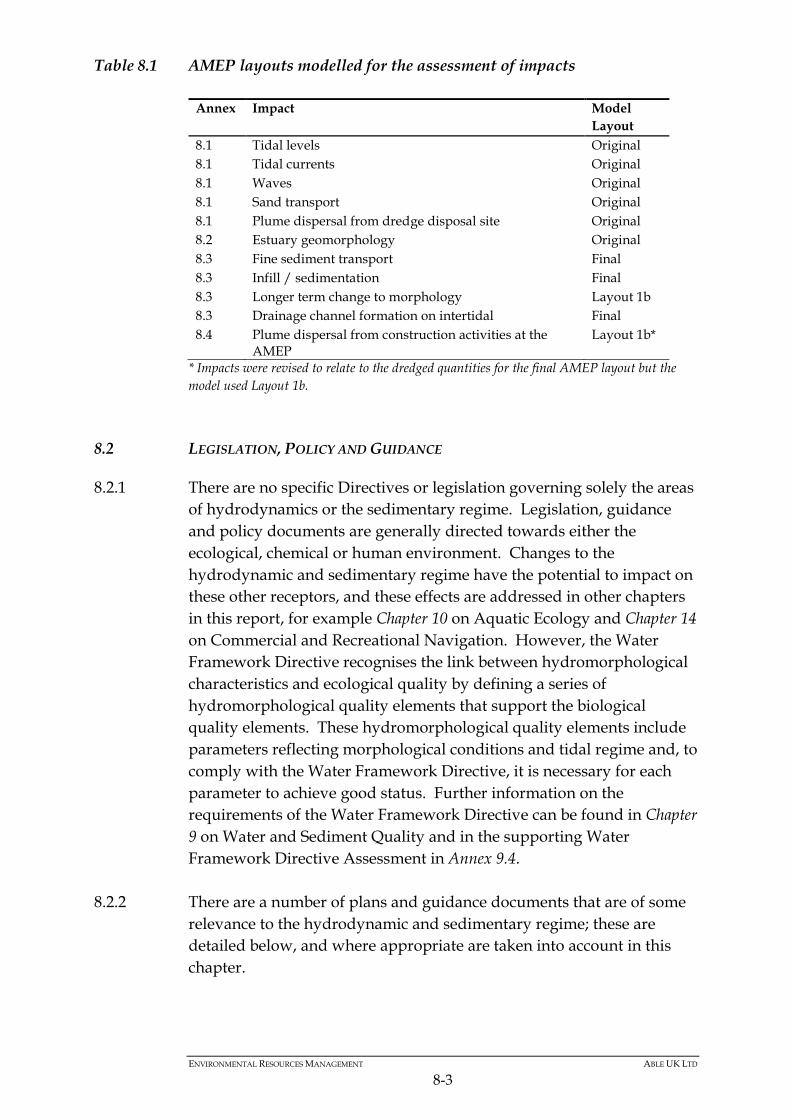
shown in Figure 8.1. Table 8.1 lists the model layouts used to inform the
various impacts presented in this chapter.
Figure 8.1 AMEP Layouts (including original (or preliminary) design, an
intermediate layout (Layout 1b) and the final layout) used in the
modelling of impacts
Page 3
ENVIRONMENTAL RESOURCES MANAGEMENT ABLE UK LTD
8-3
Table 8.1 AMEP layouts modelled for the assessment of impacts
Annex Impact Model
Layout
8.1 Tidal levels Original
8.1 Tidal currents Original
8.1 Waves Original
8.1 Sand transport Original
8.1 Plume dispersal from dredge disposal site Original
8.2 Estuary geomorphology Original
8.3 Fine sediment transport Final
8.3 Infill / sedimentation Final
8.3 Longer term change to morphology Layout 1b
8.3 Drainage channel formation on intertidal Final
8.4 Plume dispersal from construction activities at the AMEP
Layout 1b*
* Impacts were revised to relate to the dredged quantities for the final AMEP layout but the
model used Layout 1b.
8.2 LEGISLATION, POLICY AND GUIDANCE
8.2.1 There are no specific Directives or legislation governing solely the areas
of hydrodynamics or the sedimentary regime. Legislation, guidance
and policy documents are generally directed towards either the
ecological, chemical or human environment. Changes to the
hydrodynamic and sedimentary regime have the potential to impact on
these other receptors, and these effects are addressed in other chapters
in this report, for example Chapter 10 on Aquatic Ecology and Chapter 14
on Commercial and Recreational Navigation. However, the Water
Framework Directive recognises the link between hydromorphological
characteristics and ecological quality by defining a series of
hydromorphological quality elements that support the biological
quality elements. These hydromorphological quality elements include
parameters reflecting morphological conditions and tidal regime and, to
comply with the Water Framework Directive, it is necessary for each
parameter to achieve good status. Further information on the
requirements of the Water Framework Directive can be found in Chapter
9 on Water and Sediment Quality and in the supporting Water
Framework Directive Assessment in Annex 9.4.
8.2.2 There are a number of plans and guidance documents that are of some
relevance to the hydrodynamic and sedimentary regime; these are
detailed below, and where appropriate are taken into account in this
chapter.
Page 4
ENVIRONMENTAL RESOURCES MANAGEMENT ABLE UK LTD
8-4
8.2.3 The Humber Estuary Management Scheme Annex D (Environment
Agency, 2004) provides guidance on the noted effects of dredging and
their significance in the estuary.
8.2.4 The Humber Maintenance Dredging Baseline Document (ABP Humber
Estuary Services, 2008) provides information on the current
maintenance dredging regime including quantities and locations of
disposed material in the estuary.
8.2.5 The Humber Estuary Coastal Habitat Management Plan (CHaMP)
(Environment Agency, 2005) provides mechanisms for delivering flood
and coastal defence schemes which comply with the requirements of
the Habitats Directive.
8.2.6 The Humber Flood Risk Management Strategy: Planning for the Rising Tides
(Environment Agency, 2008) sets out the Environment Agency’s
strategy for managing the flood defences of the Humber Estuary over
the next 100 years.
8.2.7 The Humber Estuary Coastal Authorities Group Flamborough Head to
Gibraltar Point Shoreline Management Plan: Consultation Draft (Scott
Wilson, 2009) provides a plan for managing flood and erosion risk for
the area of coastline encompassing the outer Humber Estuary. This
plan details the development of a sustainable management approach
and looks at the short, medium and long term.
8.2.8 The East Riding of Yorkshire Biodiversity Action Plan, the Lincolnshire
Biodiversity Action Plan and the Hull Biodiversity Action Plan all aim to
actively conserve priority habitats and species locally.
8.2.9 Guidance and best practice for the calibration and validation of
hydrodynamic models used to simulate estuarine processes is provided
by the Environment Agency technical report, Quality Control Manual for
Computational Estuarine Modelling (Bartlett, 1998).
8.2.10 Guidance and best practice for predicting morphological change in
estuaries is provided in the EA / Defra / Natural England report, A
Guide to the Prediction of Morphological Change within Estuarine Systems
(Emphasys Consortium, 2000).
Page 5
ENVIRONMENTAL RESOURCES MANAGEMENT ABLE UK LTD
8-5
8.3 ASSESSMENT METHODOLOGY AND CRITERIA
Overview
8.3.1 An assessment of the effects of AMEP on hydrodynamic and
sedimentary processes has been carried out using appropriate
numerical modelling tools. This section provides an overview of the
modelling techniques utilised, which include hydrodynamic modelling,
sediment transport modelling, sediment plume modelling and
nearshore wave transformation modelling. The modelling has been
used to simulate the baseline conditions in hydrodynamic and
sedimentary processes in the Humber Estuary, and subsequently to
determine and quantify the predicted effects of AMEP on these baseline
conditions. Detailed descriptions of the development of the models are
provided in JBA Consulting (2011a & b) and HR Wallingford (2011a &
b), Annexes 8.1, 8.2, 8.3 and 8.4. The final layout of the AMEP is shown
in Figure 8.2. As noted in Paragraph 8.1.5 above, this layout was
developed after several iterations at different stages of the studies.
Although the studies relate to different layouts, the final proposal
mitigates impacts when compared with the larger earlier layouts.
Figure 8.2 Representation of AMEP in the cohesive sediment modelling (Annex
8.3), showing main features, dredged areas, and locations of intakes /
outfalls.
Page 6
ENVIRONMENTAL RESOURCES MANAGEMENT ABLE UK LTD
8-6
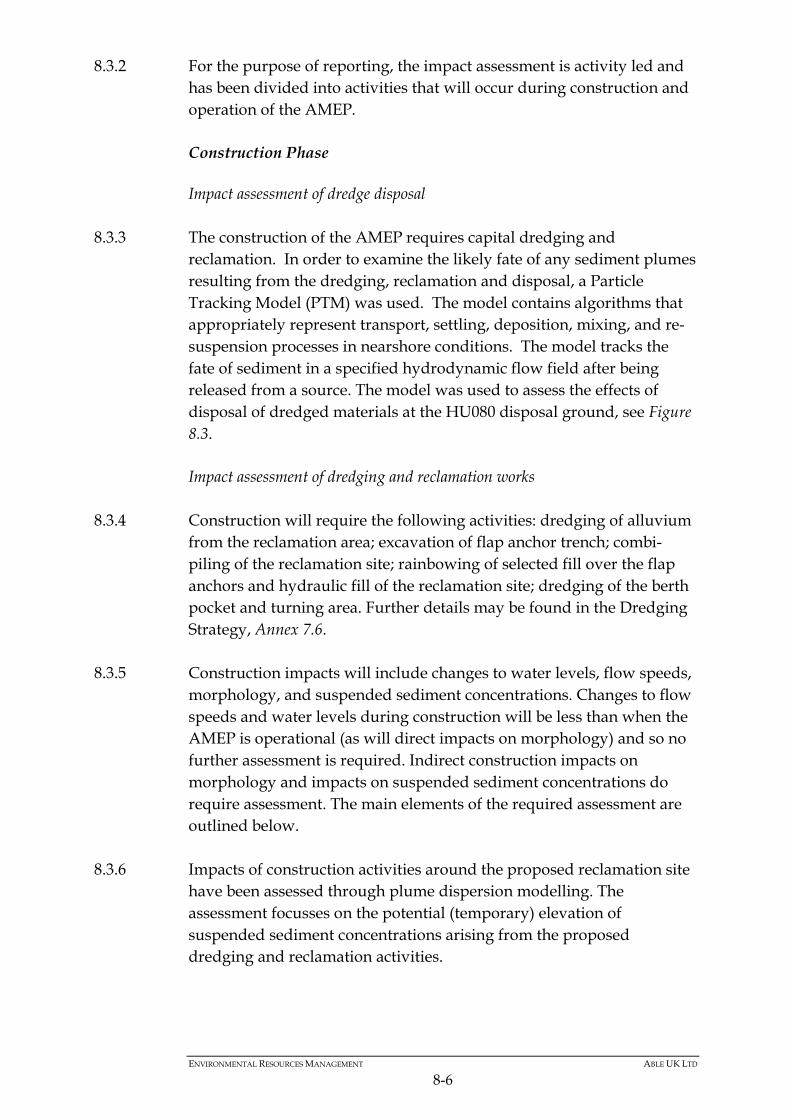
8.3.2 For the purpose of reporting, the impact assessment is activity led and
has been divided into activities that will occur during construction and
operation of the AMEP.
Construction Phase
Impact assessment of dredge disposal
8.3.3 The construction of the AMEP requires capital dredging and
reclamation. In order to examine the likely fate of any sediment plumes
resulting from the dredging, reclamation and disposal, a Particle
Tracking Model (PTM) was used. The model contains algorithms that
appropriately represent transport, settling, deposition, mixing, and re-
suspension processes in nearshore conditions. The model tracks the
fate of sediment in a specified hydrodynamic flow field after being
released from a source. The model was used to assess the effects of
disposal of dredged materials at the HU080 disposal ground, see Figure
8.3.
Impact assessment of dredging and reclamation works
8.3.4 Construction will require the following activities: dredging of alluvium
from the reclamation area; excavation of flap anchor trench; combi-
piling of the reclamation site; rainbowing of selected fill over the flap
anchors and hydraulic fill of the reclamation site; dredging of the berth
pocket and turning area. Further details may be found in the Dredging
Strategy, Annex 7.6.
8.3.5 Construction impacts will include changes to water levels, flow speeds,
morphology, and suspended sediment concentrations. Changes to flow
speeds and water levels during construction will be less than when the
AMEP is operational (as will direct impacts on morphology) and so no
further assessment is required. Indirect construction impacts on
morphology and impacts on suspended sediment concentrations do
require assessment. The main elements of the required assessment are
outlined below.
8.3.6 Impacts of construction activities around the proposed reclamation site
have been assessed through plume dispersion modelling. The
assessment focusses on the potential (temporary) elevation of
suspended sediment concentrations arising from the proposed
dredging and reclamation activities.
Page 7
ENVIRONMENTAL RESOURCES MANAGEMENT ABLE UK LTD
8-7
Operational Phase
Hydrodynamic Modelling
8.3.7 An investigation of the impacts of the AMEP on hydrodynamic
processes within the Humber Estuary has been carried out using
computer modelling techniques (Annexes 8.1, 8.2 and 8.3).
8.3.8 Two and three dimensional (2D and 3D) hydrodynamic numerical
models were constructed, calibrated and validated in order to simulate
baseline flows within the estuary. The model grid extends from Spurn
Head to Trent Falls.
8.3.9 Alterations to the model grid were made to incorporate the changes
represented by the AMEP. Comparisons between the results of model
simulations using this grid with those of the baseline model reveal the
predicted effects of the scheme on estuarine hydrodynamic processes.
Wave Modelling
8.3.10 Simulation of waves within the Humber Estuary was performed using
a phase-averaged, 2D wave spectral transformation model. The model
calculates the shallow water wave transformation processes of depth-
induced wave refraction and shoaling, current induced refraction and
shoaling, depth and steepness-induced wave breaking, wind-wave
growth, wave-wave interaction, and white-capping. Diffraction and
wave reflection processes are approximated by the model, as opposed
to being explicitly simulated.
Sediment Transport Modelling
8.3.11 Simulations of both sandy and muddy material were undertaken with
sediment transport models. Initially a non-cohesive Sediment Transport
(ST) model was used (Annex 8.1) to simulate patterns of sediment
erosion and deposition within the Humber Estuary. This model was
used to investigate the potential impacts of the AMEP as previously
defined in the PEIR (original layout) on morphological patterns driven
by non-cohesive processes. The ST model was also used to provide
initial estimates of the maintenance dredging requirements for the
AMEP berth, and potential changes to third party maintenance
dredging requirements in the vicinity of the AMEP. Subsequent to this
assessment the AMEP quay was set back 80 m towards the land.
8.3.12 After the non-cohesive modelling was complete, a 3D mud (cohesive)
transport model was used (Annex 8.3), together with desk assessments,
Page 8
ENVIRONMENTAL RESOURCES MANAGEMENT ABLE UK LTD
8-8
to predict likely changes to sedimentation patterns around the AMEP
development. This further modelling complemented the initial non-
cohesive modelling undertaken by JBA Consulting and expert
geomorphological assessment is used in this chapter to interpret the
overall conclusions.
8.3.13 It should be noted that all sediment transport models involve a high
level of uncertainty, particularly when used for the purposes of
estimating morphological change.
Morphological Assessment
8.3.14 The sediment transport models have been used to inform predictions of
future changes to morphology as a consequence of the AMEP. This has
been supported by the use of expert geomorphological assessment
(Annexes 8.1, 8.2 and 8.3).
Sensitive Receptors
8.3.15 There are a number of receptors that may be affected by changes to the
hydrodynamic and sedimentary regime. These include sensitive
environmental receptors such as intertidal mudflat and saltmarsh
habitats, and operational receptors including vessels navigating in the
vicinity of AMEP, nearby port facilities (Humber Sea Terminal, Humber
Work Boats, South Killingholme Oil Jetty, Immingham Gas Jetty,
Humber International Terminal, Immingham Bulk Terminal,
Immingham Docks), and Centrica and E.ON power station intakes and
outfalls.
Significance Criteria
8.3.16 This chapter defines the predicted changes to the hydrodynamic and
sedimentary regime of the Humber Estuary resulting from the AMEP.
As these are changes to processes rather than impacts on receptors it is
not appropriate to assign significance levels. The approach adopted in
this chapter is to describe and, where possible, quantify any predicted
changes. The implications of the predicted changes to the
hydrodynamic and sedimentary regime are assessed in terms of the
significance of the potential impacts on various environmental
parameters (e.g. aquatic ecology, water quality, commercial fisheries,
etc.) in the relevant chapters of this ES. Similarly, any measures that
may be required in order to mitigate a potential impact on a receptor
arising from a predicted effect on the hydrodynamic and sedimentary
regime of the estuary are described in the relevant chapters.
Page 9
ENVIRONMENTAL RESOURCES MANAGEMENT ABLE UK LTD
8-9
8.4 CONSULTATION
8.4.1 Annex 2.2 summarises the responses from the consultation including
those that are of relevance to the hydrodynamic and sedimentary
regime, and explains how these matters have been addressed in this
chapter.
8.4.2 Further consultation responses were received on earlier versions of
Annexes 8.1 and 8.2. These comments were addressed in the present
versions of these Annexes and a response log is provided in Annex 8.1.
8.5 BASELINE
Hydrodynamic Regime
Water levels
8.5.1 The Humber Estuary is a macro-tidal estuary with a spring tidal range
of 6.0 - 7.0m at the site of the proposed AMEP. High water levels
increase further upstream as tidal flows are constricted by the
narrowing estuary. Mean High Water Spring levels at Goole are 1.3m
above levels at the estuary mouth at Spurn Head. UKCP09 guidance on
relative sea level rise at AMEP ranges from 0.22m (Low Emissions
Scenario 5th percentile) to 0.90m (High Emissions Scenarion 95th
percentile). Although this is the latest climate change guidance, this
assessment used the more conservative recommendations in PPS 25
(revised Mar 2010) as advised by the EA.
Currents
8.5.2 Currents within the estuary are dominated by the tide. Upstream, the
monthly average freshwater flow rate at Trent Falls of 250 m3/s has
been estimated from Environment Agency data, with a variability of
±110 m3/s (Townend and Whitehead, 2003). Observations of currents
near to Killingholme used to calibrate the hydrodynamic model show
that magnitudes can reach approximately 1.5 m/s offshore and 1.1 m/s
in the nearshore zone during a modest spring tide (15th May 2010).
Predictions of currents provided by the United Kingdom Hydrographic
Office Admiralty TotalTide software, suggest ebb-flow dominance of
current magnitudes throughout the middle estuary. Peak flows occur
within the deeper channels of the estuary, with the greatest flow speeds
of over 2.0 m/s occurring in Halton Middle, upstream of Killingholme
between Halton Flats and Paull Sand.
Page 10
ENVIRONMENTAL RESOURCES MANAGEMENT ABLE UK LTD
8-10
Waves
8.5.3 The wave climate at South Killingholme is dictated by the local fetch
lengths over which the wave-generating force of wind stress can act.
Fetch lengths to the north bank are the shortest, with longer lengths
upstream and downstream, leading to larger waves from these
directions.
8.5.4 A still water level/wave height joint probability analysis study
provides details of the prevailing wave climate at South Killingholme
(ABPmer, 2007). An analysis of wave heights over a multi-year period
highlighted the dominance of south-easterly waves, followed by waves
propagating from the north-west in the direction of Hull.
8.5.5 Wave overtopping calculations were performed using values for water
level, wave height and wave period specified in ABPmer (2007).
Calculations were carried out for a range of return periods (1:2-year,
1:5-year, 1:10-year and 1:200-year) joint probability events, with 100
years of projected climate change added (i.e. 100 years of sea level rise
and increased wave heights) in accordance with PPS25.
Bed shear stresses
8.5.6 The shear stresses experienced on the bed of the Humber Estuary
determine the evolution of the morphology. Bed shear stresses are a
result of both wave and current forcing, primarily through the friction
they exert on the bed. The total bed shear stress consists of skin friction,
form drag and the effects of sediment transport (via momentum
transfer between grains). The stresses due to wave action are irregular
and determined mainly by wind variability but also locally by ship
wake. However the tidal currents within the estuary are far more
predictable and regular. The large magnitudes of the currents in the
deep channels of the estuary mean that their contribution to the bed
shear stress dominates here. Wave-related bed shear stress is more
significant in the shallower sub-tidal and inter-tidal areas.
Estuary Morphology
8.5.7 The sub-tidal bed of the Humber Estuary consists of silt, sand, gravel
and boulder clay at different locations. In shallow subtidal and
intertidal areas along the banks of the estuary the bed consists mostly of
silt and fine sand. Particle size analysis of intertidal and sub-tidal bed
material around the AMEP site has generally revealed surface
sediments to comprise: muds on the upper intertidal areas; sandy muds
Page 11
ENVIRONMENTAL RESOURCES MANAGEMENT ABLE UK LTD
8-11
on the lower intertidal areas, and; sandy muds, muddy sands or
slightly gravelly muddy sands on the subtidal areas (IECS, 2010a).
8.5.8 A recent site investigation involved the collection of multiple vibrocore
samples from the site of the proposed scheme (Buro Happold, 2010).
These showed a surface alluvium layer consisting of varied grain sizes,
with median values equally distributed in the range 0.01mm to 0.3mm.
A thin layer of sand and gravels was intermittently observed below
this, with a thicker layer of stiff glacial till underneath, though this
structure shows significant variation with location.
8.5.9 For the most part, the sub-tidal areas of the Outer Estuary (generally
considered as the Estuary downstream of Grimsby) are predominantly
sand. Further upstream more mixed sediments are typically found,
often consisting of silty sand. On the lower intertidal the sediments
generally consist of sandy silt, fining to silt at the higher levels.
Sedimentary regime
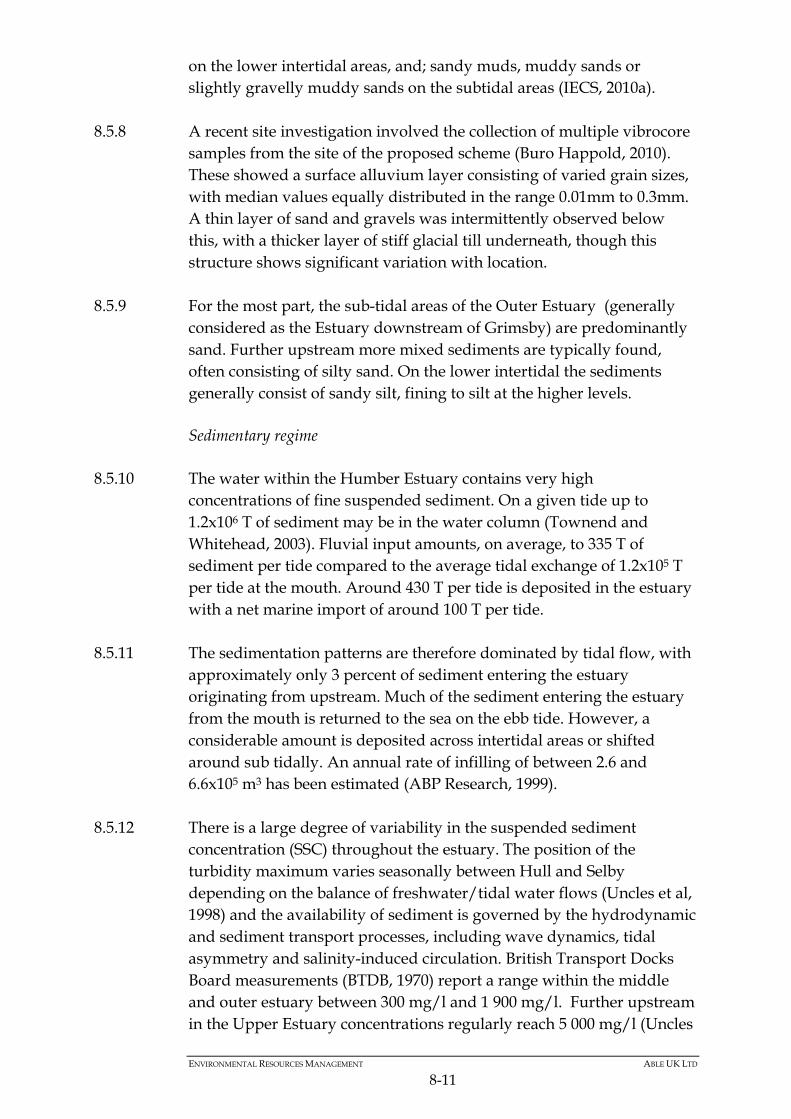
8.5.10 The water within the Humber Estuary contains very high
concentrations of fine suspended sediment. On a given tide up to
1.2x10⁶ T of sediment may be in the water column (Townend and
Whitehead, 2003). Fluvial input amounts, on average, to 335 T of
sediment per tide compared to the average tidal exchange of 1.2x10⁵ T
per tide at the mouth. Around 430 T per tide is deposited in the estuary
with a net marine import of around 100 T per tide.
8.5.11 The sedimentation patterns are therefore dominated by tidal flow, with
approximately only 3 percent of sediment entering the estuary
originating from upstream. Much of the sediment entering the estuary
from the mouth is returned to the sea on the ebb tide. However, a
considerable amount is deposited across intertidal areas or shifted
around sub tidally. An annual rate of infilling of between 2.6 and
6.6x10⁵ m3 has been estimated (ABP Research, 1999).
8.5.12 There is a large degree of variability in the suspended sediment
concentration (SSC) throughout the estuary. The position of the
turbidity maximum varies seasonally between Hull and Selby
depending on the balance of freshwater/tidal water flows (Uncles et al,
1998) and the availability of sediment is governed by the hydrodynamic
and sediment transport processes, including wave dynamics, tidal
asymmetry and salinity-induced circulation. British Transport Docks
Board measurements (BTDB, 1970) report a range within the middle
and outer estuary between 300 mg/l and 1 900 mg/l. Further upstream
in the Upper Estuary concentrations regularly reach 5 000 mg/l (Uncles
Page 12
ENVIRONMENTAL RESOURCES MANAGEMENT ABLE UK LTD
8-12
et al., 1998). At times concentrations of up to 20 000 mg/l have been
recorded in the system (ABPHES, 2008).
8.5.13 Maintenance dredge volumes in the Humber Estuary vary considerably
from year to year. Between 1985 and 2007 the total mass of material
dredged from and disposed into the estuary was in the range 9 to 17
million wet tonnes per annum (ABPHES, 2008). The Sunk Deep
Channel (SDC) was originally dredged to allow deep-draughted vessels
to use deep-water terminals at Immingham. It experiences significant
annual variation in accumulated sediment, requiring an annual
maintenance dredging ranging from none to 9 million tonnes per
annum between 1985 and 2007. Maintenance dredge material at the
`Humber 3A` disposal site is mainly from material arising from
dredging of Immingham Docks, jetties and terminals. Records show
significant variation here also, with disposals in the range 1-7 million
tonnes from 1985 to 2007. The Humber Maintenance Dredging Baseline
Document (ABP Humber Estuary Services, 2008) states that there is no
apparent trend in dredge volumes at Immingham.
8.6 IMPACTS
8.6.1 This section describes the predicted changes to the hydrodynamic and
sedimentary regime as a result of the construction and operation of the
AMEP. Impacts are divided into construction and operational phases,
and are further broken down into hydrodynamic impacts and
sedimentary impacts.
Construction Phase
8.6.2 The potential impacts on the hydrodynamic and sedimentary processes
during the construction of AMEP are associated with the dispersion
and deposition of material from dredging, disposal and reclamation
activities.
Dispersion of sediment during capital dredging and reclamation
8.6.3 The construction of the AMEP requires a significant capital dredging
operation. In total, and including the reclamation area, flap anchor
trench, berths, approach channel, and turning area 1 935 500 m3 will be
extracted from the estuary bed (Annex 7.6) and some material may be
released back into the water column during the process. Therefore the
dredging programme will lead to a temporary increase in sediment in
the water column, which may travel from the dredging site to other
areas of the estuary.
Page 13
ENVIRONMENTAL RESOURCES MANAGEMENT ABLE UK LTD
8-13
8.6.4 Various dredging methods will be applied to carry out the capital
dredging and create the reclamation area for the AMEP. The erodible
material is to be excavated using Trailing Suction Hopper Dredgers
(TSHDs). Within the dredge area, the TSHD suction pipe is lowered to
the seabed, the dredge pump is started and dredging commences. After
dredging, the TSHD will sail to the licensed disposal area to discharge
the load of dredged material by opening the bottom doors. Disposal of
the dredged material will be carried out under the terms of the relevant
marine licence(s).
8.6.5 The unerodible glacial till is to be dredged using a Backhoe Dredger
(BHD), producing large lumps of stiff clay. These will be disposed of at
sites to the north of the SDC.
8.6.6 In order to source material for the reclamation area, a TSHD will sail to
a licensed marine aggregate area and dredge suitable material. For
discharging the dredged material from a TSHD into the reclamation,
several options are possible. For this project the following options are
being proposed:
• Dumping the load by opening the bottom doors;
• Rainbowing by means of pumping the load over the bow, through a
nozzle;
• Pumping the load through a floating and/or sinker pipeline to a
reclamation area. Once above the low water mark, the sand is spread
out using land based equipment
8.6.7 Full details of the proposed capital dredging programme can be found
in the Dredging Strategy (Annex 7.6).
Dispersion of sediment during dredged material disposal
8.6.8 The material is to be disposed of in the estuary at specific disposal sites.
The dredged material consists of erodible (soft clay, silt, sands and
gravels, with an estimated total volume of 981 150 m3, Annex 7.6) and
unerodible (glacial till) material with an estimated total volume of
954 350 m3 (Annex 7.6), which will be dumped at separate sites. Site
HU080 (Middle Shoal) has been proposed as the disposal ground for
the erodible material, whereas the sites HU081, HU082 and/or HU083
have been proposed as the unerodible material disposal site. The
unerodible sites are to the north of the SDC and the erodible site,
Middle Shoal, (HU080) is to the south see Figure 8.3.
Page 14
ENVIRONMENTAL RESOURCES MANAGEMENT ABLE UK LTD
8-14
Figure 8.3 Proposed disposal sites in the Humber Estuary (©OS OpenData™),
reproduced from Annex 8.1 (JBA, 2011)
8.6.9 The unerodible glacial till is to be excavated using a backhoe dredger,
producing large lumps of stiff clay. These will be disposed of at the
sites to the north of the SDC. The disposal of the stiff glacial till clay at
these sites is highly unlikely to add significantly to background SSCs
due to the strongly cohesive nature of the material. The Environmental
Statement prepared for the Hull Riverside Bulk Terminal proposal
reported on monitoring of similar material disposed of at the site
during the Immingham Outer Harbour dredge (ABPmer, 2010). This
monitoring showed that little material had been lost over time.
Moreover a multibeam survey showed the outlines of individual barge
loads to be still in place. Therefore it can be assumed that disposal of
glacial till from the AMEP scheme capital dredge will add negligible
material to the background SSCs.
8.6.10 For the erodible material disposal, the majority of material will be
contained within the dynamic plume that will settle on the bed of the
estuary. Upon disposal, the majority of material will fall to the bed, but
a proportion of the finer material will be entrained in a plume that will
move away from the disposal site with the tides, and disperse. The
plume will therefore add to background SSCs and an assessment has
been performed to examine the significance of this likely impact.
Page 15
ENVIRONMENTAL RESOURCES MANAGEMENT ABLE UK LTD
8-15
8.6.11 The preliminary dredge programme reports that a TSHD will pick up
630 m3 of sediment from the AMEP site and dump it at the disposal site
over a period of 15 minutes. The total cycle time for this procedure
would be 142 minutes. For the dredging of 250 000 m3 of surface
alluvium this would necessitate 400 round trips. The surface alluvium
is not compacted and therefore a density of 1 250 kg/m3 is assumed,
which is typical of superficial sediment in the estuary (ABPHES, 2008).
Therefore approximately 788 tonnes of material will be disposed of
during each return trip. Based upon core samples, an assumption was
made that 25% of the total disposed load would form a plume.
(Annex 8.1).
8.6.12 Figure 8.4 shows the resulting average SSCs (that are attributable to the
dredge disposal operation alone) over the last day of sediment release
throughout the Humber Estuary. This shows that the model predicts
that the enhanced SSCs will travel back and forth with the tidal currents
up to Hull and down to the estuary mouth. The sediment plume is
largely confined to the deeper channels in the short term, with
dispersion around the estuary likely over the longer term. The largest
concentrations occur in the shallower areas, with the average SSC
during day 14 of up to 20 mg/l above ambient.
Figure 8.4 Average SSCs during last day of 14-day period of intermittent sediment
release at Middle Shoal disposal site (from Annex 8.1, JBA 2011)
8.6.13 Away from the disposal site, the modelled plume exhibits largest
concentrations in the shallower water to the north of the SDC. Changes
Page 16
ENVIRONMENTAL RESOURCES MANAGEMENT ABLE UK LTD
8-16
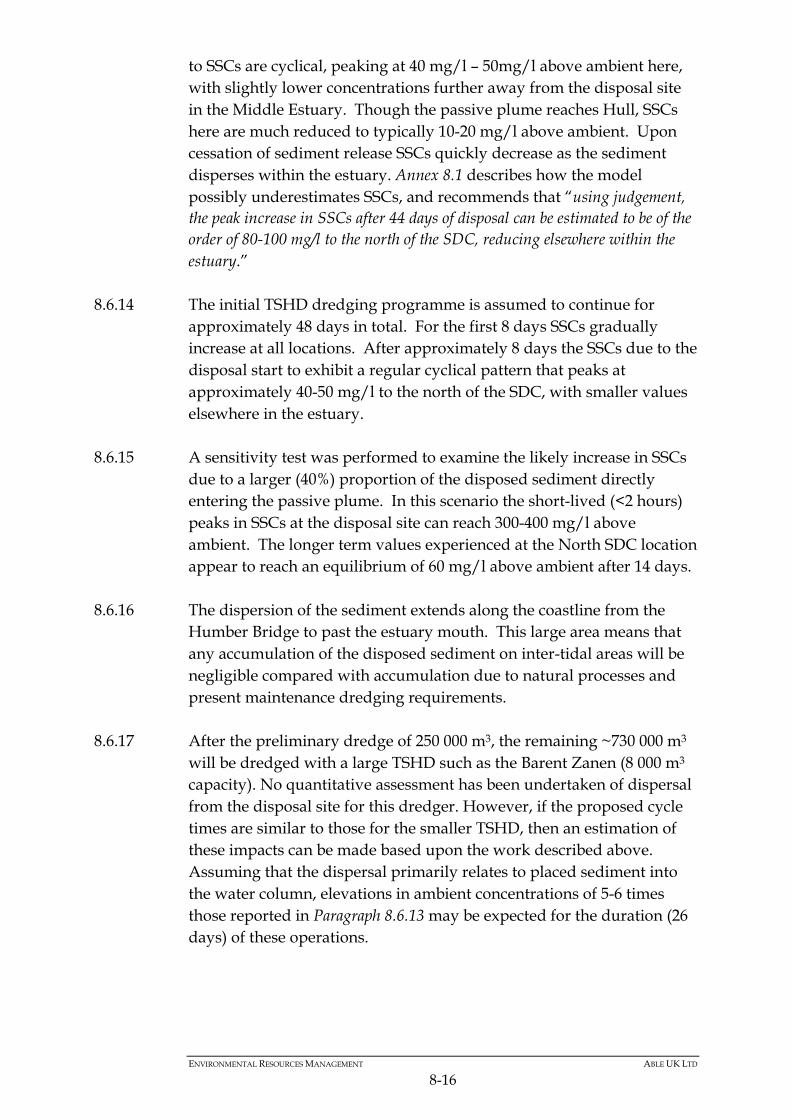
to SSCs are cyclical, peaking at 40 mg/l – 50mg/l above ambient here,
with slightly lower concentrations further away from the disposal site
in the Middle Estuary. Though the passive plume reaches Hull, SSCs
here are much reduced to typically 10-20 mg/l above ambient. Upon
cessation of sediment release SSCs quickly decrease as the sediment
disperses within the estuary. Annex 8.1 describes how the model
possibly underestimates SSCs, and recommends that “using judgement,
the peak increase in SSCs after 44 days of disposal can be estimated to be of the
order of 80-100 mg/l to the north of the SDC, reducing elsewhere within the
estuary.”
8.6.14 The initial TSHD dredging programme is assumed to continue for
approximately 48 days in total. For the first 8 days SSCs gradually
increase at all locations. After approximately 8 days the SSCs due to the
disposal start to exhibit a regular cyclical pattern that peaks at
approximately 40-50 mg/l to the north of the SDC, with smaller values
elsewhere in the estuary.
8.6.15 A sensitivity test was performed to examine the likely increase in SSCs
due to a larger (40%) proportion of the disposed sediment directly
entering the passive plume. In this scenario the short-lived (<2 hours)
peaks in SSCs at the disposal site can reach 300-400 mg/l above
ambient. The longer term values experienced at the North SDC location
appear to reach an equilibrium of 60 mg/l above ambient after 14 days.
8.6.16 The dispersion of the sediment extends along the coastline from the
Humber Bridge to past the estuary mouth. This large area means that
any accumulation of the disposed sediment on inter-tidal areas will be
negligible compared with accumulation due to natural processes and
present maintenance dredging requirements.
8.6.17 After the preliminary dredge of 250 000 m3, the remaining ~730 000 m3
will be dredged with a large TSHD such as the Barent Zanen (8 000 m3
capacity). No quantitative assessment has been undertaken of dispersal
from the disposal site for this dredger. However, if the proposed cycle
times are similar to those for the smaller TSHD, then an estimation of
these impacts can be made based upon the work described above.
Assuming that the dispersal primarily relates to placed sediment into
the water column, elevations in ambient concentrations of 5-6 times
those reported in Paragraph 8.6.13 may be expected for the duration (26
days) of these operations.
Page 17
ENVIRONMENTAL RESOURCES MANAGEMENT ABLE UK LTD
8-17
Dispersion of sediment during dredging operations at AMEP
8.6.18 Sediment plume dispersion studies were undertaken to evaluate the
impacts of dredging on the sediment regime at the dredge site (Annex
8.4).
8.6.19 The capital dredging was characterised as use of a trailer suction
hopper dredger (TSHD) to dredge 750 000 m3 alluvium/clay and
230 000m3 sand/gravel and use of a backhoe to dredge 955 000 m3
glacial till.
8.6.20 The proposed dredging of alluvium (without overflow) by TSHD will
cause increases in suspended sediment concentrations at the E.ON
intake of up to 180mg/l (near bed) and at the Centrica intake of up to
60mg/l (near bed) for a period of around three weeks. Should
overflowing be utilised during the dredging of alluvium the predicted
increases in suspended sediment concentration above background and
the deposition of fine sediment arising from this dredging will be
considerably larger. Overflowing for ten minutes on every load would
result in increases in suspended sediment concentration of up to
800mg/l (near bed) at the Centrica intake and up to 1600mg/l (near
bed) at the E.ON intake for a period of up to three weeks. Whilst this
may represent a significant increase in the background levels of
suspended sediment concentration it is noted that this increase will
occur for a limited period of time given that overflowing would only
occur for 10 minutes in every 150 minutes.
8.6.21 The proposed dredging of sand/gravel by TSHD will cause increases in
suspended sediment concentrations at the Centrica intake of up to
200 mg/l (near bed) and at the E.ON intake of up to 400 mg/l (near
bed) for a period of up to a week.
8.6.22 Whilst this may represent a significant increase in the background
levels of suspended sediment concentration it is noted again that this
increase will occur for a limited period of time.
8.6.23 The predicted infill into other nearby berths arising from the capital
works is small (Annex 8.4). The additional infill is at most estimated to
be in the order of several thousand cubic metres at the South Killhome
Oil Jetty, Immingham Gas Terminal, Humber International Terminal
and the Immingham Bulk Terminal and approximately one hundred
cubic metres at the Humber Sea Terminal. These increases should be
compared with the annual maintenance dredging requirements at these
berths which are of the order of many tens of thousands or hundreds of
thousands of cubic metres per year.
Page 18
ENVIRONMENTAL RESOURCES MANAGEMENT ABLE UK LTD
8-18
Operational Phase
8.6.24 Potential impacts during operation of the AMEP are associated with the
effects of the reclamation on the hydrodynamic regime and, in
particular, the resulting changes to local estuary morphology and
deposition patterns. Potential impacts may also arise due to dispersion
and deposition of sediment associated with maintenance dredging
activities.
Hydrodynamic Impacts – Impacts on tidal levels
8.6.25 The combined impacts on water levels of the AMEP, dredged berths
and the Compensation Site have been assessed using a numerical
hydrodynamic model (Annex 8.1). Simulations of a mean high water
spring tide were performed for the AMEP and Baseline scenarios. The
maximum and minimum water levels were calculated from the
simulations in order to investigate any absolute changes in levels
during times of high and low water.
Figure 8.5 Modelled changes to High Water levels (AMEP minus baseline –
negative shows a reduction in water High Water level). From Annex 8.1
(JBA, 2011).
Page 19
ENVIRONMENTAL RESOURCES MANAGEMENT ABLE UK LTD
8-19
8.6.26 Figure 8.5 shows the modelled impacts on High Water levels. The
hydrodynamic modelling predicted changes to High Water levels of
less than 1cm everywhere except at Humber Sea Terminal (HST) where
a reduction in High Water of 2cm is predicted, and at a location
fronting the AMEP Quay where a reduction of 1cm is predicted. A
small decrease in Low Water levels is predicted (<0.5cm).
Hydrodynamic Impacts – Impacts on flows
8.6.27 Figures 8.6 and 8.7 show modelled changes to peak flood and ebb flows
(respectively) for a mean spring tide. During both flood and ebb flows,
significant reductions in flow speeds are predicted upstream and
downstream of the AMEP, with reductions of more than 0.1 m/s
extending approximately 1 km at peak flood (0.6 km during peak ebb)
in an upstream and downstream direction (Annex 8.1), and with greater
reductions closer to the AMEP.
8.6.28 Although the development shown in Figures 8.5 to 8.7 is superseded,
there is no need to reassess the impacts because the footprint of AMEP
is now smaller, and impacts on flows and tide levels may have reduced
but will not have worsened. The model results may therefore be seen as
conservative.
Figure 8.6 Modelled changes to peak mean spring tide flood flows (AMEP minus
baseline). From Annex 8.1 (JBA, 2011).
Page 20
ENVIRONMENTAL RESOURCES MANAGEMENT ABLE UK LTD
8-20
Figure 8.7 Modelled changes to peak mean spring tide ebb flows (AMEP minus
baseline). From Annex 8.1 (JBA, 2011).
8.6.29 Offshore of the AMEP berthing pocket, flows are predicted to increase
through the turning area by up to 0.25 m/s during peak ebb and up to
0.15 m/s during peak flood. Smaller increases of more than 0.05 m/s
are predicted to extend up to 0.6 km upstream and downstream of the
AMEP.
8.6.30 Although the hydrodynamic model included the Compensation Site,
these effects are not reported in this chapter (they are considered in
detail in Chapter 32). The in-combination assessments described later in
this document show that inclusion of the Compensation Site does not
alter the conclusions in terms of the effects on flows and tide levels
predicted as a consequence of the AMEP.
Impacts on Bed Shear Stress (due to changes in tidal flows)
8.6.31 The changes to the local hydrodynamics (flows) result in changes to
patterns of bed shear stress (which in turn affect patterns of
sedimentation and erosion discussed later in this Chapter). Figures 8.8
and 8.9 show predicted changes to bed shear stress in response to the
AMEP.
Page 21
ENVIRONMENTAL RESOURCES MANAGEMENT ABLE UK LTD
8-21
Figure 8.8 Modelled changes to peak mean spring tide bed shear stress, flood tide
(AMEP minus baseline). From Annex 8.1 (JBA, 2011).
Figure 8.9 Modelled changes to peak mean spring tide bed shear stress, ebb tide
(AMEP minus baseline). From Annex 8.1 (JBA, 2011).
Page 22
ENVIRONMENTAL RESOURCES MANAGEMENT ABLE UK LTD
8-22
8.6.32 Bed shear stress increases in the proposed dredged approach area are
approximately 20% of the baseline stress. Further towards the middle of
the estuary the increases represent a much smaller proportion of the
larger bed stresses experienced here. During each phase of the tide,
flow is suppressed at the sides of the AMEP, leading to decreased bed
shear stresses. A hydrodynamic wake is predicted to occur, reducing
the flow in the lee of the AMEP, again leading to decreased bed shear
stresses in these areas. The berthing areas along the AMEP frontage will
also experience reduced flow due to the increase in depth as a result of
the capital dredging.
8.6.33 The predicted reduction in the baseline bed shear stresses to the north-
west and south-east of the AMEP is likely to lead to increased
accumulation of sediments in these areas, while the predicted increase
in bed shear stress off the North Killingholme Pits could lead to
potential increases in erosion. The results of both sand and mud
transport modelling are discussed later in this chapter including
predicted patterns of increased erosion or deposition, and so this is not
considered futher in this Section.
Impacts on waves and overtopping
8.6.34 Figures 8.10 and 8.11 show model predicted changes to an extreme 200
year joint wave/water level condition, including for 1.19 m of sea level
rise corresponding to earlier more conservative (than the latest UKCP09
guidance) Defra (2006) guidance for sea level rise from 2007 (base wave
data) to 2114 (end of the proposed 100 year life of the AMEP). For both
directions, a wave height of 1.6m was used in conjunction with a water
level of 5.66m AOD. The model predicted changes include for
reflections off the AMEP.
8.6.35 Immediately in front of the AMEP quay, increases in wave height of up
to 0.4 m are predicted. 750 m offshore (for the easterly extreme
condition) the predicted increase has reduced to 0.2 m. In terms of wave
impacts on the shoreline, for the easterly extreme an increase is
predicted along the shoreline between the southern end of the AMEP
and the northwestern flank of HIT (~0.1 m increase in wave height) and
for the northerly extreme condition, an increase in overtopping risk is
predicted where the AMEP meets the shoreline at the northwestern end
(~0.4m increase in wave height focussed on this corner).
8.6.36 Depending upon the nature of management of the predicted siltation at
this location, the predicted increase in overtopping risk may be to some
degree mitigated by sedimentation onto the intertidal area. Detailed
Page 23
ENVIRONMENTAL RESOURCES MANAGEMENT ABLE UK LTD
8-23
reporting of an assessment of overtopping risk is presented in Annex
8.1.
8.6.36 Wave reflection from the AMEP (as previously represented in the PEIR)
quay walls was predicted to result in an increase in the overtopping
risk along the sea defences to the north of the quay for approximately
200 m (the 30 m closest to the quay edge being most susceptible). To
the south of the AMEP, no increase in overtopping risk is predicted
(Annex 8.1). For the final layout, the mitigating effects of a reduction in
the size of AMEP together with a revised 1 in 4 slope rubble mound (to
enhance wave dissipation) have been assessed by JBA Consulting
(Appendix F of Annex 8.1). The revised length of sea defences to the
north of the quay affected by wave reflection impacts is 60m.
Figure 8.10 Modelled increase in wave heights for a 1:200-year water level/wave
height event in 2114 for waves from the east (AMEP minus future 2114
‘baseline’). From Annex 8.1 (JBA, 2011)
Page 24
ENVIRONMENTAL RESOURCES MANAGEMENT ABLE UK LTD
8-24
Figure 8.11 Modelled increase in wave heights for a 1:200-year water level/wave
height event in 2114 for waves from the north (Original AMEP Layout
minus future 2114 ‘baseline’). From Annex 8.1 (JBA, 2011)
Impacts on sediments
8.6.38 The sediment on the bed in the vicinity of the proposed quay varies
between mud, sandy mud, and muddy sand (see Paragraph 8.5.7). For
this reason impacts on sediment transport were assessed through the
use of 2D sand transport (Annex 8.1) and 3D mud transport models
(Annex 8.3). The 3D model was used to investigate the likely effects of
the scheme on suspended sediments and morphology along the
intake/outfall lines and sedimentation onto designated intertidal areas
and into the existing adjacent downstream berths.
8.6.39 The 3D mud transport modelling simulated the effects of the final
AMEP quay whilst the sand transport model was undertaken for an
alternative (earlier) design option with a quay set forward a further
80 m, refer to Figure 8.1.
8.6.40 Impacts on suspended fine sediment concentrations were assessed at
the locations of the Centrica and E.ON intakes (Annex 8.3). Modelled
effects show, during a spring neap cycle and importantly before the
Page 25
ENVIRONMENTAL RESOURCES MANAGEMENT ABLE UK LTD
8-25
formation of signicant areas of deposition, slight reductions in peak
suspended sediment concentrations on the flood tide (up to 15%) and
little change (0-4% reduction) on the ebb tide. This is likely to be
associated with the AMEP berthing pockets which lead to increased
sedimentation. In the longer term, the development of significant levels
of accretion at the northwestern end of the AMEP will lead to an
increased risk of periodically enhanced suspended sediment
concentrations from wave agitation acting on these new deposits.
8.6.41 The results of the sand transport modelling for the original
(preliminary) layout are provided in Annex 8.1. The spatial extent of the
patterns of erosion and deposition have changed substantially as a
result of the quay face for the final AMEP layout being set back 80m
towards the land.
8.6.42 Figure 8.12 presents the results of the 3D mud transport modelling of
the AMEP for the present layout showing predicted patterns of changes
to potential erosion and deposition of fine sediments. Details are
provided in Annex 8.3, including sensitivity tests to waves from the
northwest and southeast.
Figure 8.12 Predicted increases to deposition or erosion after a spring-neap cycle
(14-15 days, AMEP minus baseline).
8.6.43 Figure 8.12 shows deposition into the AMEP berth pocket and
extending upstream and downstream of the AMEP. For the chosen
Page 26
ENVIRONMENTAL RESOURCES MANAGEMENT ABLE UK LTD
8-26
AMEP design no increased deposition is predicted into the existing
neighbouring berth pockets (e.g., HST, South Killingholme Oil Jetty,
Immingham Gas Terminal, and HIT). Increased potential erosion of soft
deposits is seen in the areas flanking the approach channel.
Impacts on Existing and Future Maintenance Dredging Requirements
8.6.44 Annualised sedimentation values are presented in Table 8.2 below. To
convert from masses in the 3D model to volumes, a dry density
of 500 kg/m3 was assumed.
Table 8.2 Annualised changes to deposition and erosion derived from the 3D mud
and 2D sand transport modelling
Area Predicted Annual Increase in Deposition (m3/Year)
Predicted Annual Increase in Deposition (m3/Year)
Predicted Annual Increase in Deposition (m3/Year)
Original Layout Layout with chamfered quay and suspended deck (Layout 1b)
AMEP (80m set back quay)
2D sand transport model*
3D mud transport model
3D mud transport model
Humber Sea Terminal 20,000 to 320,000 14,000 to 36,000 -20,000 to -50,000
South Killingholme Oil Jetty
0 100,000 to 266,000 -36,000 to -92,000
Immingham Gas Terminal 600 to 26,000 74,000 to 186,000 -4,000 to -8,000
Humber International Terminal
100 to 17,000 241,000 to 624,000 -38,000 to -96,000
Immingham Bulk Terminal
700 to 16,000 -58,000 to -110,000 -60,000 to -148,000
AMEP 280,000 to 1,300,000 687,000 to 1,842,000 502,000 to 1,254,000
Inshore of E.ON and Centrica Intakes
Not analysed 338,000 to 882,000 188,000 to 468,000
* The lower figure assumes a 0.3mm median grain size and the higher figure a 0.075mm median grain
size for the estuary bed as a whole.
8.6.45 The modelling (both sand transport and 3D mud modelling) of
alternative layouts that project further into the estuary than the final
scheme, showed an impact in terms of increased maintenance dredging
requirements at adjacent berths. However, 3D mud modelling of the
present AMEP shows no such impact. 3D mud modelling predicted
annual infill is generally 2-3 times higher than observed rates (Annex
8.3). The reasons for this difference include (amongst others) the
inherent simplification in a simple linear scaling of the spring-neap
cycle simulated, the absence of extreme (storm) tide conditions and
storm waves, the motion of ships into and out of the berths and berth
occupancy, assumptions on densities, actual frequency and locations of
maintenance dredging, and natural variability in suspended sediment
Page 27
ENVIRONMENTAL RESOURCES MANAGEMENT ABLE UK LTD
8-27
concentrations in the Humber Estuary. Considering only the last item
reveals year on year differences in maintenance dredging requirements
of a similar order.
8.6.46 Given the level of uncertainty in modelled infill predictions, the
predicted future changes to maintenance dredging requirements are
presented as a range. It should be noted that this is good practice in
sediment transport modelling and that a model predicted infill rate
within a factor of 2-5 of the observed figures is not unreasonable.
Morphological assessment
8.6.47 For the proposed scheme no increase in maintenance dredging
requirements at adjacent berths is predicted. Assessment of the longer
term development of the intertidal morphology to the northwest of the
AMEP was undertaken using both computational modelling and
consideration of the observed effects of the Humber International
Terminal (HIT) reclamation.
8.6.48 Analysis of pre- and post-HIT Admiralty Charts shows, in the area of
the pink oval marked on Figure 8.12, an apparent effect extending for
approximately 600 m alongshore, and with an increase to intertidal
levels of approximately 1.5 m at an equivalent location to the Centrica
and E.ON outfalls. This observation, combined with the sediment
modelling results described in Paragraph 8.6.52 below, indicates a likely
requirement for maintenance at these locations.
8.6.49 For an alternative assessment into the potential longer term
development of the intertidal profile along the intake-outfall lines, the
3D mud model was run for an extended duration, updating the model
bathymetry before each re-running of both the 3D flow and mud
transport models. This work was done for Layout 1b which had the
quay face located 50m seawards of the final AMEP layout. To infer
longer term changes for the final AMEP layout, results were extracted
from the Layout 1b modelling. The sedimentation effects were
abstracted from the Layout 1b model at the locations of the intakes and
outfalls, and also at points 30m and 50m seaward of these locations.
Examining these results allowed longer term changes to be inferred at
the intakes and outfalls as a consequence of the AMEP layout from the
longer term modelling undertaken for Layout 1b.
8.6.50 The long-term sediment transport assessment, in combination with the
desk assessment undertaken into changes observed northwest of the
Humber International Terminal, gives an indication of the possible
longer term changes to morphology that will be experienced to the
northwest of the AMEP. Overall, the inferred longer term morphology
Page 28
ENVIRONMENTAL RESOURCES MANAGEMENT ABLE UK LTD
8-28
changes show little risk of sedimentation at the intakes, but a risk of
significant sedimentation at the outfalls. Inferred changes from Layout
1b show longer term risk of sedimentation of 1-2m at the Centrica
Outfall and 3-3.5m at the E.ON Outfall (Annex 8.3). It should be noted
that because these are indicative results inferred from modelling
undertaken for a previous layout (Layout 1b), this adds to the
uncertainty.
8.6.51 Without any intervention or management, the area of intertidal affected
by an increase in levels towards the northwest of the development is
likely to be approximately 12 hectares. It is quite possible that areas to
the south may also be affected, although as the existing intertidal is
generally higher and wider to the south of the AMEP, the areas affected
are likely to be smaller.
8.6.52 In addition to the assessments described above, a drainage channel is
proposed as part of the AMEP. Annex 8.3 presents an assessment of the
effects of this element of the AMEP for which excavation and
maintenance of a channel through the intertidal will be required at the
southeastern flank of the AMEP. It is estimated that a further 1ha of
intertidal will be affected.
8.7 MITIGATION MEASURES
Construction Phase
8.7.1 Best practice guidelines will be used, and a monitoring programme is
proposed with regards to the operation of the intakes, with monitored
suspended sediment concentrations triggering temporary cessation of
works or a warning that temporary cessation of works may be
imminient. Stop/caution thresholds will be agreed with the operators.
Monitoring might include the deployment of monitoring buoys to
provide real time feedback of suspended sediment concentrations
adjacent to the intakes.
Operational Phase
8.7.2 After completion of studies to assess the predicted changes to
deposition and erosion arising from AMEP, the quay face has been
positioned to avoid any adverse effects on maintenance dredging
requirements at adjacent berths.
8.7.3 The model results have shown the potential for accumulations of
sediment inshore of the Centrica and E.ON intake/outfall lines and this
will need to be monitored and, if necessary, managed (mitigated)
through dredging (e.g. ploughing, see the Dredging Strategy, Annex
Page 29
ENVIRONMENTAL RESOURCES MANAGEMENT ABLE UK LTD
8-29
7.6). A new outfall will be built into the new quay to allow for the
diversion of the outfalls if maintenance dredging proves unduly
onerous. An assessment of the thermal plume dispersion that would
arise from a new outfall built into the quay is included in Annex 9.6. The
assessment demonstrates that such an outfall would not interfere with
the operation of the intakes. There is a lower risk that a similar
diversion may also be required for the Centrica outfall.
8.8 RESIDUAL IMPACTS
Construction Phase
8.8.1 The residual impacts remain as per the impacts described in this
chapter with the exception of approximately 12 hectares of intertidal
affected to the northwest of the AMEP. If dredging is adopted to
manage the sedimentation in the area around the cooling water
infrastructure , then the area of intertidal affected (raised) will reduce.
Operational Phase
8.8.2 The predicted annual maintenance requirement arising from operations
will be in the range 250 000-630 000 dry tonnes from the dredging of the
AMEP Berthing Pocket and Dock. This is likely to require dredging by
TSHD and disposal at the Sunk Deep Channel disposal site HU080,
refer to Annex 7.6.
8.8.3 A further quantity of dredging may arise (depending on the mitigation
approach selected – see Paragraph 8.7.3) from use of dredging
techniques to manage the expected accretion inshore of Centrica and
E.ON Intake/Outfall Lines. However, any dredging used to manage
this accretion would use water injection or ploughing techniques and
would not require offshore disposal.
8.9 IN COMBINATION IMPACTS
Construction Phase
8.9.1 Some of the dredge arisings from the projects listed below will be
disposed of within the same areas as those proposed by AMEP. Table
8.3 details the estimated dredge quantities for each project, as set out in
the relevant promoter’s Environmental Statement, for those disposal
sites that are common to the AMEP Proposal. Able has consulted with
MMO who confirmed that suitable capacity exists (Annex 7.6).
Page 30
ENVIRONMENTAL RESOURCES MANAGEMENT ABLE UK LTD
8-30
Table 8.3 Summary of Capital Dredge Quantities for other Approved Projects
also using the AMEP Disposal Sites
Project SDC Window Sites (HU081,
82, 83)
Middle Shoal (Humber HU080)
AMEP 954 350m3 981 150m3 Hull Riverside Bulk Terminal 548 000m3 0m3 Quay 2005 (Green Port Hull) 0m3 0m3 Grimsby Ro-Ro 45 000m3 0m3 IOT (SDC Channel Deepening) 375 000m3 1 597 000m3 Total 1 888 000m3 2 287 000m3
Operational Phase
Water Levels
8.9.2 An in combination modelling assessment was undertaken (Annex 8.1)
and found that predicted impacts at HST (lowering of High Water by
2 cm) were unaffected by other developments. The model predicts a
decrease in High Water near to Quay 2005 of up to 2cm.
Flows
8.9.3 An in combination modelling assessment was undertaken (Annex 8.1)
and found that changes to flow patterns were distinct and separate for
the various developments. The patterns of change around the AMEP
quay were the same as for the scheme when considered without other
future developments.
Waves
8.9.4 There are no in combination effects on waves.
Bed shear stress
8.9.5 The in combination impacts on current speeds found that there will be
negligible changes just upstream and downstream of the scheme, with
local changes entirely due to the scheme. As stated in Paragraph 8.9.4
there will be no in combination impacts on waves. Therefore the in
combination impacts on bed shear stresses exhibit negligible differences
to those due to the scheme alone.
Page 31
ENVIRONMENTAL RESOURCES MANAGEMENT ABLE UK LTD
8-31
Sediment transport and maintenance dredging
8.9.6 Table 8.2 shows the model predicted likely range of potential changes to
the maintenance dredging requirements at adjacent berths. In practice
the changes to requirements will also depend on a number of
uncertainties and practicalities highlighted in Section 8.6.47.
8.10 SUMMARY AND CONCLUSIONS
8.10.1 This chapter has investigated the impacts of the AMEP on the
hydrodynamic and sedimentary regime and has concluded the
following.
Water Levels
8.10.2 Changes to Low water everywhere of less than 0.5 cm are predicted. A
2 cm lowering of High Water is predicted at the Humber Sea Terminal.
An assessment of in combination effects shows a decrease in High
Water of up to 2cm at Quay 2005 along a length of shoreline
approximately 400m long (equating to a reduction of < 0.001 hectares of
intertidal).
Flows
8.10.3 Flow speeds are reduced upstream and downstream of the AMEP
during flood and ebb tides and over a distance of 0.6 km to 1 km from
the AMEP. Flow speeds are initially increased seawards of the quay.
The scale of changes remained the same when tested in combination
with other developments.
Bed Shear Stress
8.10.4 Significant reductions in bed shear stress are predicted upstream and
downstream of the AMEP, with increases seawards of the AMEP. The
changes to bed shear stresses give an indication of changes to
sedimentation and erosion that have been assessed using sand and mud
transport models.
Waves
8.10.5 Immediately in front of the AMEP quay, increases in wave height of up
to 0.4 m are predicted. 750 m offshore (for the easterly extreme
condition) the predicted increase has reduced to 0.2 m. In terms of wave
impacts on the shoreline, slight increases in the wave height
Page 32
ENVIRONMENTAL RESOURCES MANAGEMENT ABLE UK LTD
8-32
corresponding to 200 year event are predicted along the adjacent
shoreline, with the largest increase predicted immediately adjacent to
the AMEP and to the north (~0.4m). The latest design of the AMEP
(encroaching 80m less into the estuary) plus planned mitigation
through use of rock armour on the northern flank, will reduce this
effect.
Sediments and Maintenance Dredging Requirements
8.10.6 Predicted increases in sedimentation into the AMEP dredged areas and
shorewards of the Centrica and E.ON intakes indicate a need for
significant maintenance dredging. No increases to maintenance
dredging requirements are predicted for Humber Sea Terminal, South
Killingholme Jetty, Immingham Oil Terminal, Humber International
Terminal, or Immingham Bulk Terminal.
8.10.7 In the absence of sediment management activities discussed in Section
8.7.3, bed levels across approximately 12 hectares of intertidal would
rise to the north of the AMEP to form a similar response to that which is
seen north of the HIT reclamation. To the south of the AMEP less
change is predicted on the upper intertidal areas as a result of the
intertidal levels already being higher in response to the HIT
development.
8.10.8 An estimated 1ha of intertidal to the south of the AMEP is likely to be
affected by construction, maintenance, and evolution of a drainage
channel from the proposed drainage outfall (Annex 8.3).
8.10.9 In terms of dispersal of sediments from the disposal site, the peak
increase in SSCs after 44 days of disposal by the smaller TSHD can be
estimated to be of the order of 80-100 mg/l to the north of the SDC,
reducing elsewhere within the estuary. For the larger TSHD,
concentrations of 5-6 times higher might be expected (for up to 26
days).
8.10.10 The proposed dredging of alluvium (without overflow) by TSHD will
cause increases in suspended sediment concentrations at the E.ON
intake of up to 180mg/l (near bed) and at the Centrica intake of up to
60mg/l (near bed) for a period of around three weeks. Should
overflowing be utilised during the dredging of alluvium the predicted
increases in suspended sediment concentration above background
would be up to 800mg/l (near bed) at the Centrica intake and up to
1600mg/l (near bed) at the E.ON intake for a period of up to three
weeks. This increase will occur for a limited period of time given that
overflowing would only occur for 10 minutes in every 150 minutes.
Page 33
ENVIRONMENTAL RESOURCES MANAGEMENT ABLE UK LTD
8-33
8.10.11 The proposed dredging of sand/gravel by TSHD will cause increases in
suspended sediment concentrations at the Centrica intake of up to
200 mg/l (near bed) and at the E.ON intake of up to 400 mg/l (near
bed) for a period of up to a week.
8.10.12 The predicted infill into other nearby berths arising from the capital
works is small (Annex 8.4)