1 8 November 2012 TATE & LYLE PLC STATEMENT OF HALF YEAR RESULTS For the six months to 30 September 2012 Six months to 30 September (Unaudited) Continuing operations 1 £m unless stated otherwise 2012 2011 % change in constant currency 4 Sales 1 631 1 540 + 7% Adjusted results Adjusted operating profit 2 195 194 + 2% Adjusted profit before tax 3 179 177 + 2% Adjusted diluted earnings per share 3 30.7p 30.7p + 1% Statutory results Operating profit 187 255 - 26% Profit before tax 172 241 - 28% Profit for the period (on total operations) 167 177 - 5% Diluted earnings per share (on total operations) 35.1p 37.0p - 4% Net debt 386 410 Dividend per share 7.4p 7.1p + 4.2% Javed Ahmed, Chief Executive, said: “Tate & Lyle made progress in the first six months against the backdrop of a strong first half last year, softer market conditions in Europe and the step change in fixed costs associated with the restart of our SPLENDA ® Sucralose facility in McIntosh, Alabama and business transformation initiatives. Despite facing a number of headwinds this year, I am pleased that the business continues to perform solidly.” Highlights Speciality Food Ingredients sales up 5% (6% in constant currency) with adjusted operating profit 7% lower than the strong first half last year after absorbing the step change in fixed costs and a softer first quarter Bulk Ingredients adjusted operating profit up 6% (7% in constant currency) with strong performance from sweeteners more than offsetting more normal co-product returns following £19 million of additional income in the comparative period Business transformation programme continues with encouraging initial customer response to our new global Commercial and Food Innovation Centre in Chicago and the launch of our new venture fund 4.2% increase in interim dividend to 7.4p (2011 – 7.1p) Outlook In Speciality Food Ingredients, while we expect continued challenging market conditions in Europe, overall we expect to achieve steady volume growth and solid sales growth for the full year. In Bulk Ingredients, we expect the firm demand for liquid sweeteners in the US to continue and demand in our other food markets to remain stable. In Europe, higher corn prices are expected to reduce isoglucose margins in the second half. Market conditions in US ethanol are expected to remain challenging. As usual, the outcome of the 2013 calendar year sweetener pricing rounds will influence performance in the final quarter of the financial year. Overall, while recognising the current level of uncertainty around the wider economy and corn quality and pricing, we continue to expect to make progress this financial year. 1 Excluding the results of discontinued operations in both periods. 2 Before net exceptional charge of £2 million (2011 – credit of £66 million) and amortisation of intangible assets acquired through business combinations of £6 million (2011 – £5 million). 3 Before net exceptional charge of £2 million (2011 – credit of £66 million), amortisation of intangible assets acquired through business combinations of £6 million (2011 – £5 million) and post-retirement pension interest credit of £1 million (2011 – £3 million). 4 Changes in constant currency are calculated by retranslating comparative period results at current period exchange rates.
Transcript
1
8 November 2012 TATE & LYLE PLC
STATEMENT OF HALF YEAR RESULTS For the six months to 30 September 2012
Six months to 30 September (Unaudited)
Continuing operations1
£m unless stated otherwise 2012
2011
% change in constant
currency4
Sales 1 631 1 540 + 7% Adjusted results
Adjusted operating profit2 195 194 + 2%
Adjusted profit before tax3 179 177 + 2%
Adjusted diluted earnings per share3 30.7p 30.7p + 1%
Statutory results Operating profit 187 255 - 26% Profit before tax 172 241 - 28% Profit for the period (on total operations) 167 177 - 5% Diluted earnings per share (on total operations) 35.1p 37.0p - 4%
Net debt 386 410 Dividend per share 7.4p 7.1p + 4.2%
Javed Ahmed, Chief Executive, said: “Tate & Lyle made progress in the first six months against the backdrop of a strong first half last year, softer market conditions in Europe and the step change in fixed costs associated with the restart of our SPLENDA
® Sucralose
facility in McIntosh, Alabama and business transformation initiatives. Despite facing a number of headwinds this year, I am pleased that the business continues to perform solidly.” Highlights
Speciality Food Ingredients sales up 5% (6% in constant currency) with adjusted operating profit 7% lower than the strong first half last year after absorbing the step change in fixed costs and a softer first quarter
Bulk Ingredients adjusted operating profit up 6% (7% in constant currency) with strong performance from sweeteners more than offsetting more normal co-product returns following £19 million of additional income in the comparative period
Business transformation programme continues with encouraging initial customer response to our new global Commercial and Food Innovation Centre in Chicago and the launch of our new venture fund
4.2% increase in interim dividend to 7.4p (2011 – 7.1p)
Outlook In Speciality Food Ingredients, while we expect continued challenging market conditions in Europe, overall we expect to achieve steady volume growth and solid sales growth for the full year. In Bulk Ingredients, we expect the firm demand for liquid sweeteners in the US to continue and demand in our other food markets to remain stable. In Europe, higher corn prices are expected to reduce isoglucose margins in the second half. Market conditions in US ethanol are expected to remain challenging. As usual, the outcome of the 2013 calendar year sweetener pricing rounds will influence performance in the final quarter of the financial year. Overall, while recognising the current level of uncertainty around the wider economy and corn quality and pricing, we continue to expect to make progress this financial year. 1 Excluding the results of discontinued operations in both periods. 2 Before net exceptional charge of £2 million (2011 – credit of £66 million) and amortisation of intangible assets acquired through business combinations of £6
million (2011 – £5 million). 3 Before net exceptional charge of £2 million (2011 – credit of £66 million), amortisation of intangible assets acquired through business combinations of £6 million
(2011 – £5 million) and post-retirement pension interest credit of £1 million (2011 – £3 million). 4 Changes in constant currency are calculated by retranslating comparative period results at current period exchange rates.
2
Cautionary statement This Statement of Half Year Results contains certain forward-looking statements with respect to the financial condition, results, operations and businesses of Tate & Lyle PLC. These statements and forecasts involve risk and uncertainty because they relate to events and depend upon circumstances that will occur in the future. There are a number of factors that could cause actual results or developments to differ materially from those expressed or implied by these forward-looking statements and forecasts. Nothing in this Statement of Half Year Results should be construed as a profit forecast. A copy of this Statement of Half Year Results for the six months ended 30
September 2012 can be found on our
website at www.tateandlyle.com. A hard copy of this statement is also available from The Company Secretary, Tate & Lyle PLC, 1 Kingsway, London WC2B 6AT. SPLENDA
® is a trademark of McNeil Nutritionals, LLC.
Webcast and Conference Call Details
Tate & Lyle will issue its Half Year results announcement on Thursday 8 November 2012. A presentation of the results by Chief Executive, Javed Ahmed and Chief Financial Officer, Tim Lodge will be audio webcast live at 10.00 (UKT). To view and/or listen to a live audio-cast of the presentation, visit http://view-w.tv/p/797-1031-12014/en. Please note that remote listeners will not be able to ask questions during the Q&A session. A webcast replay of the presentation will be available within two hours of the end of the live broadcast on the link above. For those unable to view the webcast, there will also be a teleconference facility for the presentation. Details are given below: Dial in details: UK dial in number: +44 (0) 20 3003 2666 US dial in number: +1 646 843 4608 Password: Tate & Lyle 14 day conference call replay: UK replay number: +44 (0) 20 8196 1998 US replay number: +1 866 583 1035 Replay Access code: 2903268
For more information contact Tate & Lyle PLC: Mathew Wootton, Group VP, Investor and Media Relations Tel: +44 (0) 20 7257 2110 or Mobile: +44 (0) 7500 100 320 Andrew Lorenz, FTI Consulting Tel: +44 (0) 20 7269 7113 or Mobile: +44 (0) 7775 641807
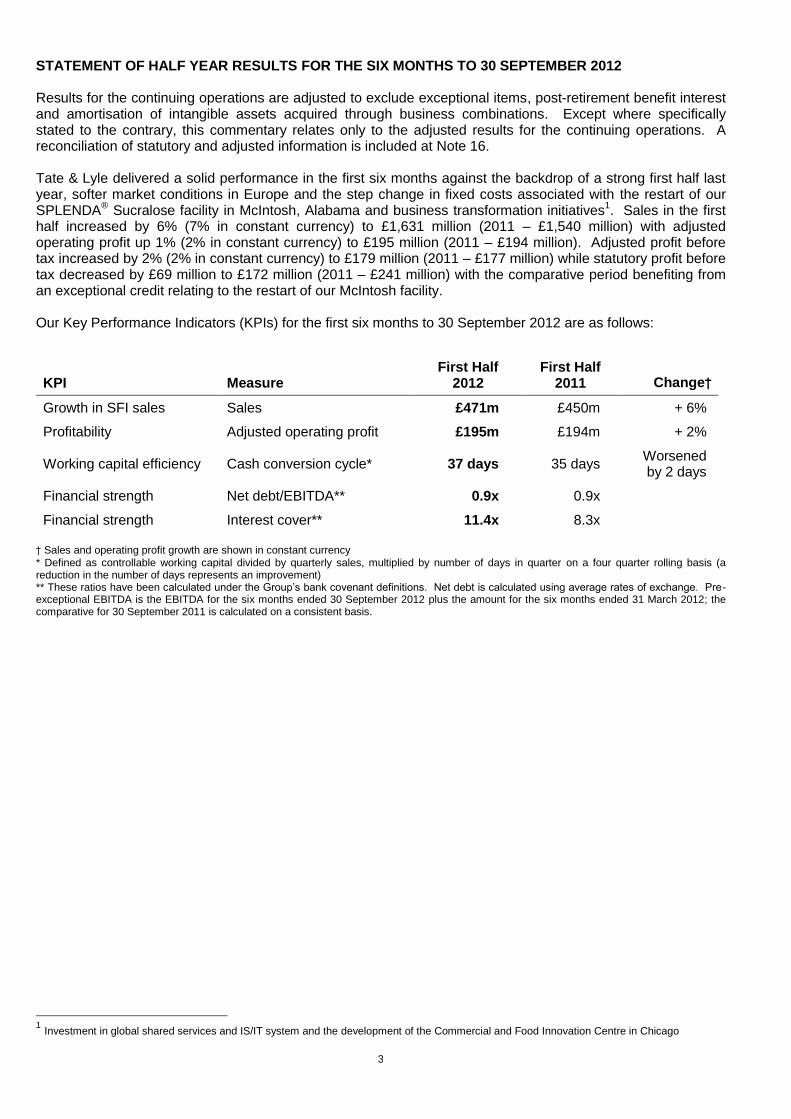
STATEMENT OF HALF YEAR RESULTS FOR THE SIX MONTHS TO 30 SEPTEMBER 2012 Results for the continuing operations are adjusted to exclude exceptional items, post-retirement benefit interest and amortisation of intangible assets acquired through business combinations. Except where specifically stated to the contrary, this commentary relates only to the adjusted results for the continuing operations. A reconciliation of statutory and adjusted information is included at Note 16. Tate & Lyle delivered a solid performance in the first six months against the backdrop of a strong first half last year, softer market conditions in Europe and the step change in fixed costs associated with the restart of our SPLENDA
® Sucralose facility in McIntosh, Alabama and business transformation initiatives
1. Sales in the first
half increased by 6% (7% in constant currency) to £1,631 million (2011 – £1,540 million) with adjusted operating profit up 1% (2% in constant currency) to £195 million (2011 – £194 million). Adjusted profit before tax increased by 2% (2% in constant currency) to £179 million (2011 – £177 million) while statutory profit before tax decreased by £69 million to £172 million (2011 – £241 million) with the comparative period benefiting from an exceptional credit relating to the restart of our McIntosh facility. Our Key Performance Indicators (KPIs) for the first six months to 30 September 2012 are as follows:
Working capital efficiency Cash conversion cycle* 37 days 35 days Worsened by 2 days
Financial strength Net debt/EBITDA** 0.9x 0.9x
Financial strength Interest cover** 11.4x 8.3x
† Sales and operating profit growth are shown in constant currency
* Defined as controllable working capital divided by quarterly sales, multiplied by number of days in quarter on a four quarter rolling basis (a reduction in the number of days represents an improvement) ** These ratios have been calculated under the Group’s bank covenant definitions. Net debt is calculated using average rates of exchange. Pre-exceptional EBITDA is the EBITDA for the six months ended 30 September 2012 plus the amount for the six months ended 31 March 2012; the comparative for 30 September 2011 is calculated on a consistent basis.
1 Investment in global shared services and IS/IT system and the development of the Commercial and Food Innovation Centre in Chicago
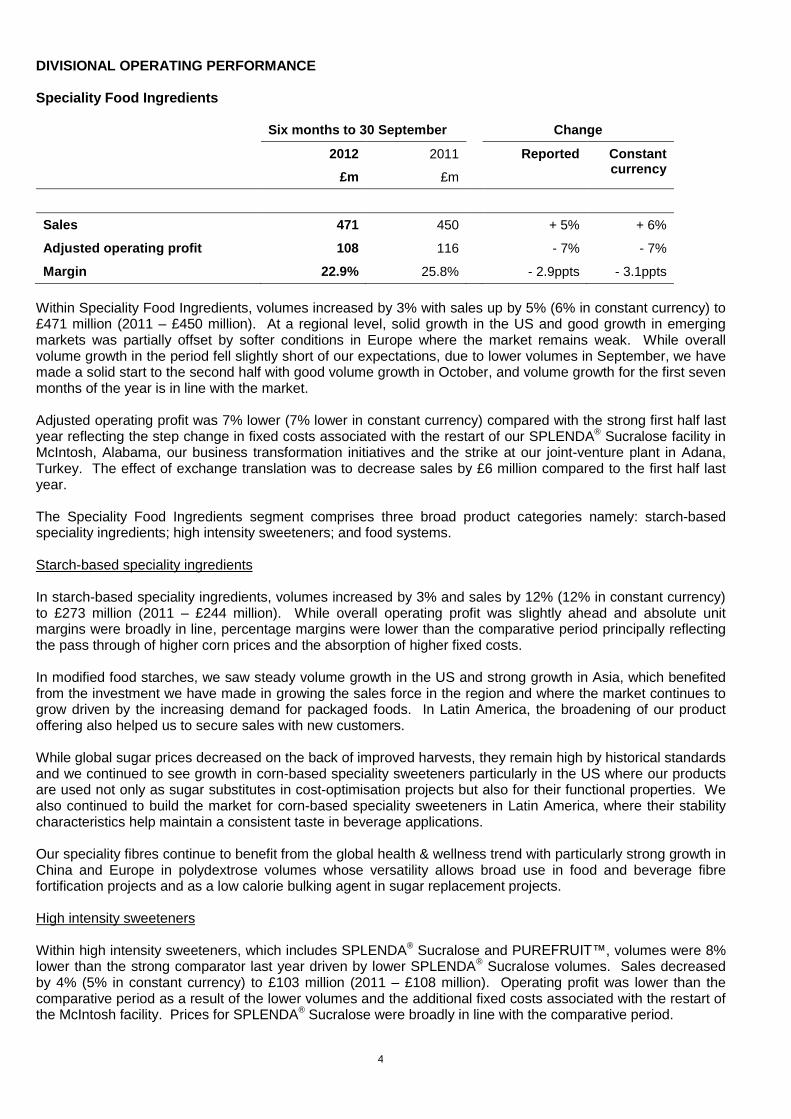
Within Speciality Food Ingredients, volumes increased by 3% with sales up by 5% (6% in constant currency) to £471 million (2011 – £450 million). At a regional level, solid growth in the US and good growth in emerging markets was partially offset by softer conditions in Europe where the market remains weak. While overall volume growth in the period fell slightly short of our expectations, due to lower volumes in September, we have made a solid start to the second half with good volume growth in October, and volume growth for the first seven months of the year is in line with the market. Adjusted operating profit was 7% lower (7% lower in constant currency) compared with the strong first half last year reflecting the step change in fixed costs associated with the restart of our SPLENDA
® Sucralose facility in
McIntosh, Alabama, our business transformation initiatives and the strike at our joint-venture plant in Adana, Turkey. The effect of exchange translation was to decrease sales by £6 million compared to the first half last year. The Speciality Food Ingredients segment comprises three broad product categories namely: starch-based speciality ingredients; high intensity sweeteners; and food systems. Starch-based speciality ingredients In starch-based speciality ingredients, volumes increased by 3% and sales by 12% (12% in constant currency) to £273 million (2011 – £244 million). While overall operating profit was slightly ahead and absolute unit margins were broadly in line, percentage margins were lower than the comparative period principally reflecting the pass through of higher corn prices and the absorption of higher fixed costs. In modified food starches, we saw steady volume growth in the US and strong growth in Asia, which benefited from the investment we have made in growing the sales force in the region and where the market continues to grow driven by the increasing demand for packaged foods. In Latin America, the broadening of our product offering also helped us to secure sales with new customers. While global sugar prices decreased on the back of improved harvests, they remain high by historical standards and we continued to see growth in corn-based speciality sweeteners particularly in the US where our products are used not only as sugar substitutes in cost-optimisation projects but also for their functional properties. We also continued to build the market for corn-based speciality sweeteners in Latin America, where their stability characteristics help maintain a consistent taste in beverage applications. Our speciality fibres continue to benefit from the global health & wellness trend with particularly strong growth in China and Europe in polydextrose volumes whose versatility allows broad use in food and beverage fibre fortification projects and as a low calorie bulking agent in sugar replacement projects. High intensity sweeteners Within high intensity sweeteners, which includes SPLENDA
® Sucralose and PUREFRUIT™, volumes were 8%
lower than the strong comparator last year driven by lower SPLENDA® Sucralose volumes. Sales decreased
by 4% (5% in constant currency) to £103 million (2011 – £108 million). Operating profit was lower than the comparative period as a result of the lower volumes and the additional fixed costs associated with the restart of the McIntosh facility. Prices for SPLENDA
® Sucralose were broadly in line with the comparative period.
5
Lower first half volumes in SPLENDA® Sucralose were driven by two factors. Firstly, the exceptionally strong
volume growth (17%) in the comparative period which resulted from a number of customer new product launches in emerging markets in the first quarter and secondly, softer and competitive market conditions in Europe. We saw a move towards more normal volume growth patterns in the latter part of the first half. We are also making progress developing the market for PUREFRUIT™ Monk-Fruit Extract, our zero calorie fruit-based natural high intensity sweetener, with new product launches in the US table-top market in the period building on the strong consumer interest in natural high intensity sweeteners. At the end of the first half, we launched TASTEVA™ Stevia Sweetener our new stevia-based, natural high intensity sweetener. TASTEVA™ will enable customers seeking a natural sweetener to reduce sugar levels without the bitter/liquorice aftertaste often associated with other high purity, stevia-based sweeteners and further enhance our speciality sweetener portfolio. Food systems Food systems sales were 4% lower (up 4% in constant currency) at £95 million (2011 – £98 million) largely driven by a weakening of the euro. Volumes were lower than the comparative period, down 1%, with solid growth in US and Asia offset by softer market conditions in Europe. Raw material prices remained high during the period and while we made some progress mitigating the impact of higher input costs - through the use of more cost-effective corn-based substitutes and shortening the length of customer contracts - operating margins were somewhat lower than the comparative period as were profits overall. During the period, we expanded and consolidated our European food systems operations through the relocation of technical, marketing, formulation and pilot plant services into a new facility alongside our current production site in Roggenhorst, near Lübeck, Germany. The new facility will give us the ability to provide a fully integrated offering for a range of food applications from one location, enabling us to shorten project development cycles, improve efficiency and help customers get to market faster.
6
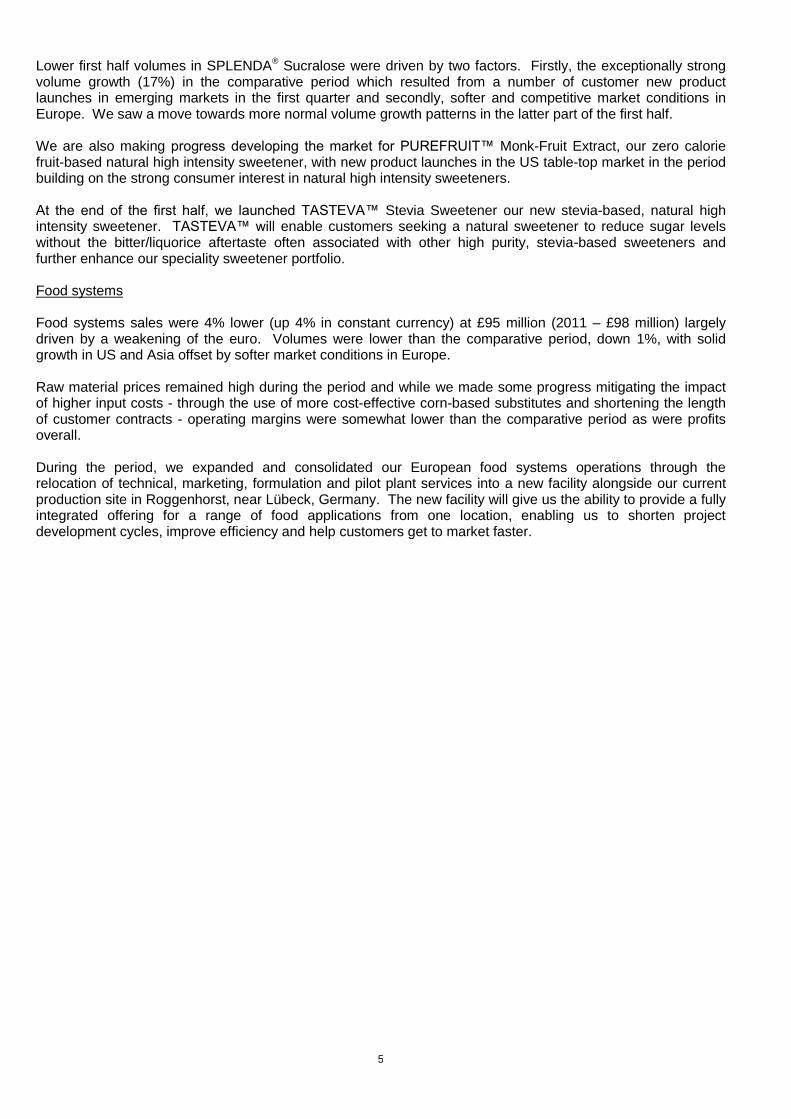
Bulk Ingredients
Six months to 30 September Change
2012
£m
2011
£m
Reported Constant currency
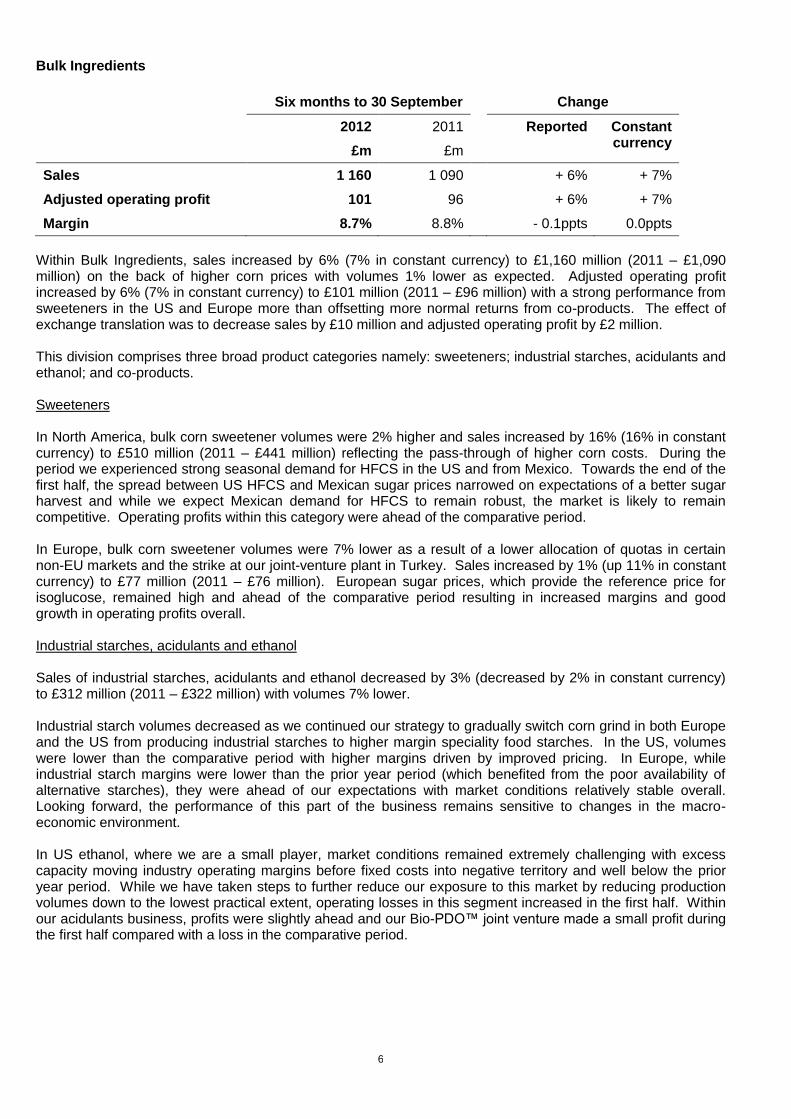
Sales 1 160 1 090 + 6% + 7%
Adjusted operating profit 101 96 + 6% + 7%
Margin 8.7% 8.8% - 0.1ppts 0.0ppts
Within Bulk Ingredients, sales increased by 6% (7% in constant currency) to £1,160 million (2011 – £1,090 million) on the back of higher corn prices with volumes 1% lower as expected. Adjusted operating profit increased by 6% (7% in constant currency) to £101 million (2011 – £96 million) with a strong performance from sweeteners in the US and Europe more than offsetting more normal returns from co-products. The effect of exchange translation was to decrease sales by £10 million and adjusted operating profit by £2 million. This division comprises three broad product categories namely: sweeteners; industrial starches, acidulants and ethanol; and co-products. Sweeteners In North America, bulk corn sweetener volumes were 2% higher and sales increased by 16% (16% in constant currency) to £510 million (2011 – £441 million) reflecting the pass-through of higher corn costs. During the period we experienced strong seasonal demand for HFCS in the US and from Mexico. Towards the end of the first half, the spread between US HFCS and Mexican sugar prices narrowed on expectations of a better sugar harvest and while we expect Mexican demand for HFCS to remain robust, the market is likely to remain competitive. Operating profits within this category were ahead of the comparative period. In Europe, bulk corn sweetener volumes were 7% lower as a result of a lower allocation of quotas in certain non-EU markets and the strike at our joint-venture plant in Turkey. Sales increased by 1% (up 11% in constant currency) to £77 million (2011 – £76 million). European sugar prices, which provide the reference price for isoglucose, remained high and ahead of the comparative period resulting in increased margins and good growth in operating profits overall. Industrial starches, acidulants and ethanol Sales of industrial starches, acidulants and ethanol decreased by 3% (decreased by 2% in constant currency) to £312 million (2011 – £322 million) with volumes 7% lower. Industrial starch volumes decreased as we continued our strategy to gradually switch corn grind in both Europe and the US from producing industrial starches to higher margin speciality food starches. In the US, volumes were lower than the comparative period with higher margins driven by improved pricing. In Europe, while industrial starch margins were lower than the prior year period (which benefited from the poor availability of alternative starches), they were ahead of our expectations with market conditions relatively stable overall. Looking forward, the performance of this part of the business remains sensitive to changes in the macro-economic environment. In US ethanol, where we are a small player, market conditions remained extremely challenging with excess capacity moving industry operating margins before fixed costs into negative territory and well below the prior year period. While we have taken steps to further reduce our exposure to this market by reducing production volumes down to the lowest practical extent, operating losses in this segment increased in the first half. Within our acidulants business, profits were slightly ahead and our Bio-PDO™ joint venture made a small profit during the first half compared with a loss in the comparative period.
7
Co-products Co-product sales increased by 4% (4% in constant currency) to £261 million (2011 – £251 million), with returns reverting to more normal levels during the period. This compares with a strong performance in the first six months of last year where co-products generated £19 million of additional income. Corn harvest and corn quality In the US, the worst drought in the mid-west for 56 years has impacted both the size and quality of this year’s corn harvest. Between 11 June and 11 October 2012, the USDA reduced its forecasted supply from 15.6m to 11.8m bushels (down 24%). As a result, corn prices rose sharply at the end of June
2 and have remained
elevated ever since. Despite lower forecasts for direct consumption of corn into animal feed and lower export demand, the stocks-to-use ratio is still projected by the USDA to fall from 13.7% to 5.6%. As a result, corn prices are expected to remain volatile for the foreseeable future. The extremely dry and hot conditions in the US have also impacted corn quality with aflatoxin, a byproduct of a grain fungus, present in this year’s harvest particularly in those areas hardest hit by the drought. While aflatoxin does not impact the core end products of the corn wet milling process, such as HFCS, it tends to concentrate in corn gluten meal (CGM) and corn gluten feed (CGF) and if certain thresholds are breached it can restrict the end markets into which these co-products can be sold. While the presence of aflatoxin resulted in the sale of a greater proportion of our CGM and CGF in lower value markets in the first few weeks following the harvest, we have taken steps to adjust our corn sourcing programme to help us meet customer requirements in our traditional co-product end markets. Although significant efforts are underway to mitigate the impact of aflatoxin, and we continue to monitor the situation closely, based on what we know today we believe it will result in a small increase in net corn costs for the remainder of the financial year and through to the next harvest. Continued dry and hot conditions in central Europe have also driven up European corn prices and, with sugar prices remaining stable, this is expected to reduce isoglucose margins during the second half.
2 Spot corn prices in the US peaked at 831 cents per bushel on 21 August 2012
8
BUILDING A PLATFORM FOR LONG-TERM GROWTH We continue to make good progress against the milestones we set out in May 2010 as part of our business transformation programme. In June 2012, we opened our new Commercial and Food Innovation Centre in Chicago to customers. The initial response has been very encouraging with a significant number of customers having visited over the last few months. The new Centre, which features research and application laboratories as well as a demonstration kitchen, sensory testing, analytical and pilot plant facilities, not only enhances the way we interact with customers and our access to them, but also enables us to accelerate the volume and efficiency of our pipeline development through the physical colocation of both technical and commercial resources. Our Innovation and Commercial Development (ICD) group continues to work on product development and innovation initiatives. In September, we launched TASTEVA™ Stevia Sweetener, our new zero-calorie stevia-based sweetener developed using a proprietary process that will enable food and beverage manufacturers seeking sweetness from a natural source to reduce sugar levels without the bitter/liquorice aftertaste often associated with other high purity, stevia-based sweeteners. The addition of TASTEVA™ to our natural portfolio, which also includes PUREFRUIT™ Monk Fruit Extract, alongside our other sweetener products further reinforces our offering and market position as a leading global provider of sweetener solutions. In October 2012, we launched our new salt reduction ingredient, SODA-LO™ Salt Microspheres (SODA-LO™). SODA-LO™ has been created using a technology that turns standard salt crystals into free-flowing crystalline microspheres. These smaller, lower-density crystals efficiently deliver salty taste by maximizing surface area relative to volume, making it possible to enjoy the same salt taste while consuming lower levels of salt and also providing customers with a clean label solution. In response to significant price rises and supply constraints in the egg market and the need for our customers
to control recipe costs, during the period we launched new HAMULSION® stabiliser systems, a solution
enabling egg replacement in bakery products of up to 100%. This builds on other initiatives within our food systems business to help reduce input costs including the launch last year of CARCAO™, a carob powder ingredient that can be used as a partial cocoa replacement. In July 2012, the new global IS/IT system was rolled out in our single ingredients business in Europe. Work to fully embed the new system is on-going. As a result, implementation across the rest of the business will move into the next financial year allowing us to build on the experience gained during the initial roll-out. During the first half, £17 million of capital and £10 million of exceptional costs were incurred on the new Commercial Food and Innovation Centre and the rollout of global shared services and the common global IS/IT system. Today, we are also announcing the launch of a new Tate & Lyle Ventures 8-year £30 million fund with Tate & Lyle as the sole investor. The new fund will broaden our global innovation programme by providing a vehicle to access and invest in targeted early-stage speciality food ingredient companies which have the potential for longer term value creation. The new fund builds on our existing venturing capabilities and complements our innovation capabilities within ICD.
GROUP OUTLOOK FOR YEAR ENDING 31 MARCH 2013 In Speciality Food Ingredients, while we expect continued challenging market conditions in Europe, overall we expect to achieve steady volume growth and solid sales growth for the full year. In Bulk Ingredients, we expect the firm demand for liquid sweeteners in the US to continue and demand in our other food markets to remain stable. In Europe, higher corn prices are expected to reduce isoglucose margins in the second half. Market conditions in US ethanol are expected to remain challenging. As usual, the outcome of the 2013 calendar year sweetener pricing rounds will influence performance in the final quarter of the financial year. Overall, while recognising the current level of uncertainty around the wider economy and corn quality and pricing, we continue to expect to make progress this financial year.
9
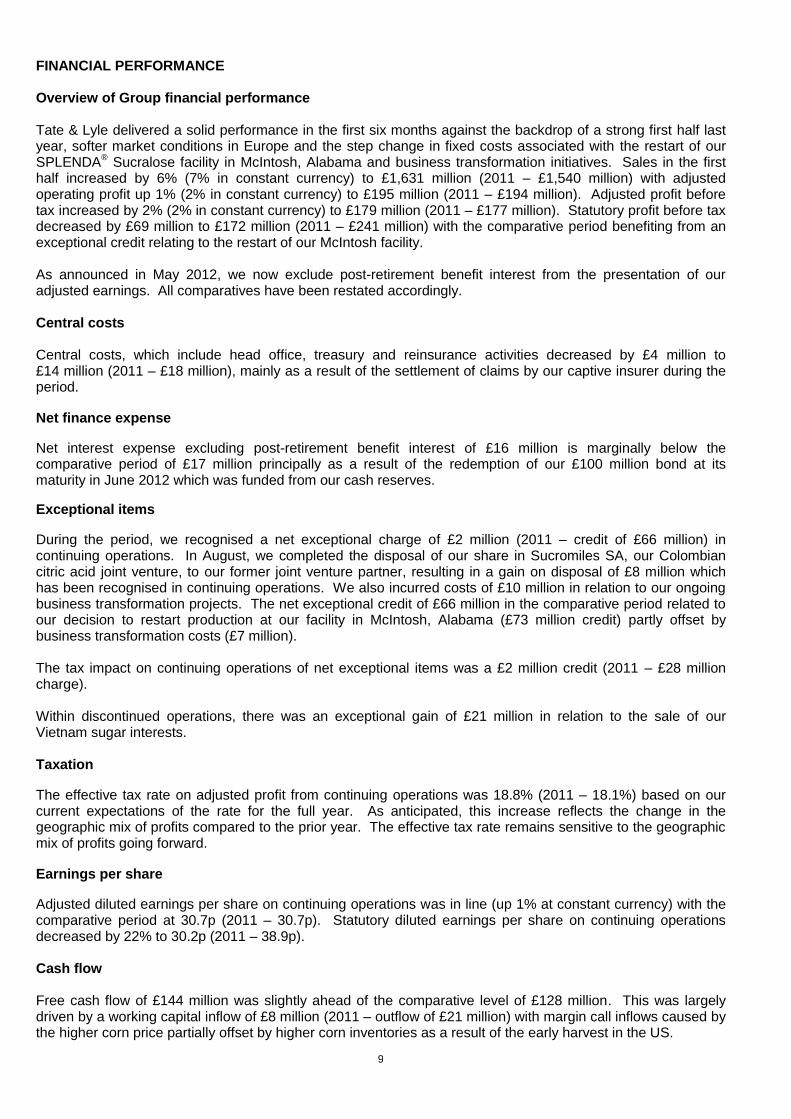
FINANCIAL PERFORMANCE Overview of Group financial performance Tate & Lyle delivered a solid performance in the first six months against the backdrop of a strong first half last year, softer market conditions in Europe and the step change in fixed costs associated with the restart of our SPLENDA
® Sucralose facility in McIntosh, Alabama and business transformation initiatives. Sales in the first
half increased by 6% (7% in constant currency) to £1,631 million (2011 – £1,540 million) with adjusted operating profit up 1% (2% in constant currency) to £195 million (2011 – £194 million). Adjusted profit before tax increased by 2% (2% in constant currency) to £179 million (2011 – £177 million). Statutory profit before tax decreased by £69 million to £172 million (2011 – £241 million) with the comparative period benefiting from an exceptional credit relating to the restart of our McIntosh facility. As announced in May 2012, we now exclude post-retirement benefit interest from the presentation of our adjusted earnings. All comparatives have been restated accordingly. Central costs Central costs, which include head office, treasury and reinsurance activities decreased by £4 million to £14 million (2011 – £18 million), mainly as a result of the settlement of claims by our captive insurer during the period. Net finance expense Net interest expense excluding post-retirement benefit interest of £16 million is marginally below the comparative period of £17 million principally as a result of the redemption of our £100 million bond at its maturity in June 2012 which was funded from our cash reserves. Exceptional items During the period, we recognised a net exceptional charge of £2 million (2011 – credit of £66 million) in continuing operations. In August, we completed the disposal of our share in Sucromiles SA, our Colombian citric acid joint venture, to our former joint venture partner, resulting in a gain on disposal of £8 million which has been recognised in continuing operations. We also incurred costs of £10 million in relation to our ongoing business transformation projects. The net exceptional credit of £66 million in the comparative period related to our decision to restart production at our facility in McIntosh, Alabama (£73 million credit) partly offset by business transformation costs (£7 million). The tax impact on continuing operations of net exceptional items was a £2 million credit (2011 – £28 million charge). Within discontinued operations, there was an exceptional gain of £21 million in relation to the sale of our Vietnam sugar interests. Taxation The effective tax rate on adjusted profit from continuing operations was 18.8% (2011 – 18.1%) based on our current expectations of the rate for the full year. As anticipated, this increase reflects the change in the geographic mix of profits compared to the prior year. The effective tax rate remains sensitive to the geographic mix of profits going forward. Earnings per share Adjusted diluted earnings per share on continuing operations was in line (up 1% at constant currency) with the comparative period at 30.7p (2011 – 30.7p). Statutory diluted earnings per share on continuing operations decreased by 22% to 30.2p (2011 – 38.9p). Cash flow Free cash flow of £144 million was slightly ahead of the comparative level of £128 million. This was largely driven by a working capital inflow of £8 million (2011 – outflow of £21 million) with margin call inflows caused by the higher corn price partially offset by higher corn inventories as a result of the early harvest in the US.
10
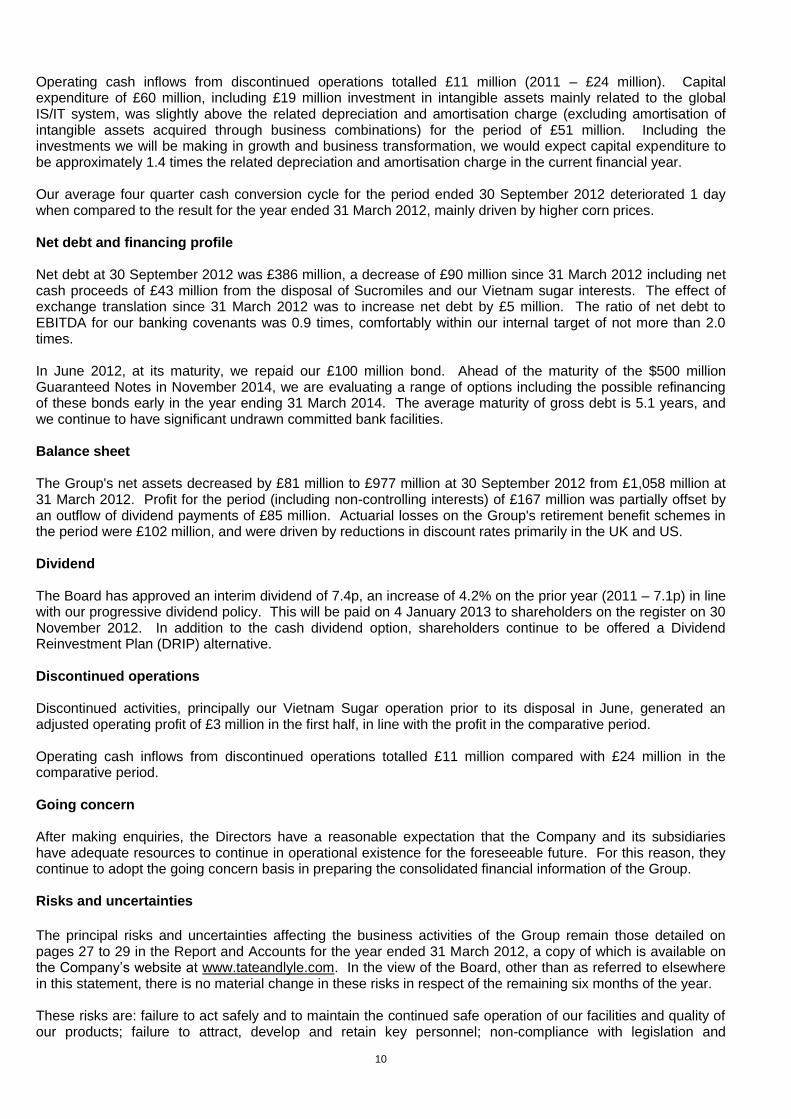
Operating cash inflows from discontinued operations totalled £11 million (2011 – £24 million). Capital expenditure of £60 million, including £19 million investment in intangible assets mainly related to the global IS/IT system, was slightly above the related depreciation and amortisation charge (excluding amortisation of intangible assets acquired through business combinations) for the period of £51 million. Including the investments we will be making in growth and business transformation, we would expect capital expenditure to be approximately 1.4 times the related depreciation and amortisation charge in the current financial year. Our average four quarter cash conversion cycle for the period ended 30 September 2012 deteriorated 1 day when compared to the result for the year ended 31 March 2012, mainly driven by higher corn prices. Net debt and financing profile Net debt at 30 September 2012 was £386 million, a decrease of £90 million since 31 March 2012 including net cash proceeds of £43 million from the disposal of Sucromiles and our Vietnam sugar interests. The effect of exchange translation since 31 March 2012 was to increase net debt by £5 million. The ratio of net debt to EBITDA for our banking covenants was 0.9 times, comfortably within our internal target of not more than 2.0 times. In June 2012, at its maturity, we repaid our £100 million bond. Ahead of the maturity of the $500 million Guaranteed Notes in November 2014, we are evaluating a range of options including the possible refinancing of these bonds early in the year ending 31 March 2014. The average maturity of gross debt is 5.1 years, and we continue to have significant undrawn committed bank facilities. Balance sheet The Group's net assets decreased by £81 million to £977 million at 30 September 2012 from £1,058 million at 31 March 2012. Profit for the period (including non-controlling interests) of £167 million was partially offset by an outflow of dividend payments of £85 million. Actuarial losses on the Group's retirement benefit schemes in the period were £102 million, and were driven by reductions in discount rates primarily in the UK and US. Dividend The Board has approved an interim dividend of 7.4p, an increase of 4.2% on the prior year (2011 – 7.1p) in line with our progressive dividend policy. This will be paid on 4 January 2013 to shareholders on the register on 30 November 2012. In addition to the cash dividend option, shareholders continue to be offered a Dividend Reinvestment Plan (DRIP) alternative. Discontinued operations Discontinued activities, principally our Vietnam Sugar operation prior to its disposal in June, generated an adjusted operating profit of £3 million in the first half, in line with the profit in the comparative period. Operating cash inflows from discontinued operations totalled £11 million compared with £24 million in the comparative period. Going concern After making enquiries, the Directors have a reasonable expectation that the Company and its subsidiaries have adequate resources to continue in operational existence for the foreseeable future. For this reason, they continue to adopt the going concern basis in preparing the consolidated financial information of the Group. Risks and uncertainties
The principal risks and uncertainties affecting the business activities of the Group remain those detailed on pages 27 to 29 in the Report and Accounts for the year ended 31 March 2012, a copy of which is available on the Company’s website at www.tateandlyle.com. In the view of the Board, other than as referred to elsewhere in this statement, there is no material change in these risks in respect of the remaining six months of the year. These risks are: failure to act safely and to maintain the continued safe operation of our facilities and quality of our products; failure to attract, develop and retain key personnel; non-compliance with legislation and
regulation; fluctuations in prices, offtake and availability of raw materials, energy, freight and other operating inputs; failure to protect intellectual property; failure to implement the Group’s programme to transform its operational capabilities; failure to counter negative perceptions of the Group’s products; failure to identify important consumer trends and innovate; failure to manage capital expenditure and working capital, and to deliver key projects; failure to maintain an effective system of internal financial controls; and competitors achieving significant advantage. Impact of changes in exchange rates In comparison to the prior period, our sales and profit has been negatively impacted by exchange rate translation. A strengthening of the average US dollar exchange rate against sterling has been more than offset by the weakening of other currencies, notably the Euro, Hungarian Forint and Mexican Peso. The movement in period-end exchange rates, particularly the weaker US dollar, led to an increase in net debt as a result of the translation of accounts recorded in foreign exchange. The principal average and closing exchange rates used to translate reported results were as follows: Six months to 30 September Year to 31 March 2012
Average rates Closing rates Average rates Closing rates
Statement of Directors’ responsibilities The Directors confirm that this condensed set of consolidated financial information has been prepared in accordance with International Accounting Standard 34 Interim Financial Reporting as adopted by the European Union, and that the interim management report herein includes a fair review of the information required by the Disclosure Rules and Transparency Rules of the Financial Services Authority, paragraphs DTR 4.2.7R and DTR 4.2.8R, namely:
an indication of important events that have occurred during the first six months and their impact on the condensed set of consolidated financial information;
a description of the principal risks and uncertainties for the remaining six months of the financial year; and
material related party transactions in the first six months and any material changes in the related party transactions described in the last Annual Report.
The Directors are responsible for the maintenance and integrity of the Company’s website. UK legislation governing the preparation and dissemination of financial statements may differ from legislation in other jurisdictions.
The Directors of Tate & Lyle PLC are listed in the Tate & Lyle Annual Report for the year ended 31 March 2012. In April 2012, Dr Ajai Puri joined the Board as a non-executive director. For and on behalf of the Board of Directors: Javed Ahmed Tim Lodge Chief Executive Chief Financial Officer 7 November 2012
13
Independent review report to Tate & Lyle PLC
Introduction
We have been engaged by the company to review the condensed set of consolidated financial information in the Statement of Half Year Results for the six months ended 30 September 2012, which comprises the consolidated income statement, the consolidated statement of comprehensive income, the consolidated statement of financial position, the consolidated statement of cash flows, the consolidated statement of changes in shareholders’ equity and related notes. We have read the other information contained in the Statement of Half Year Results and considered whether it contains any apparent misstatements or material inconsistencies with the information in the condensed set of financial statements. Directors’ responsibilities
The Statement of Half Year Results is the responsibility of, and has been approved by, the Directors. The Directors are responsible for preparing the Statement of Half Year Results in accordance with the Disclosure and Transparency Rules of the United Kingdom's Financial Services Authority. As disclosed in Note 1, the annual financial statements of the Group are prepared in accordance with International Financial Reporting Standards as adopted by the European Union. The condensed set of financial statements included in this half-yearly financial report has been prepared in accordance with International Accounting Standard 34, Interim Financial Reporting, as adopted by the European Union. Our responsibility
Our responsibility is to express to the Company a conclusion on the condensed set of consolidated financial information in the Statement of Half Year Results based on our review. This report, including the conclusion, has been prepared for and only for the Company for the purpose of the Disclosure and Transparency Rules of the Financial Services Authority and for no other purpose. We do not, in producing this report, accept or assume responsibility for any other purpose or to any other person to whom this report is shown or into whose hands it may come save where expressly agreed by our prior consent in writing. Scope of review
We conducted our review in accordance with International Standard on Review Engagements (UK and Ireland) 2410, ‘Review of Interim Financial Information Performed by the Independent Auditor of the Entity’ issued by the Auditing Practices Board for use in the United Kingdom. A review of interim financial information consists of making enquiries, primarily of persons responsible for financial and accounting matters, and applying analytical and other review procedures. A review is substantially less in scope than an audit conducted in accordance with International Standards on Auditing (UK and Ireland) and consequently does not enable us to obtain assurance that we would become aware of all significant matters that might be identified in an audit. Accordingly, we do not express an audit opinion. Conclusion
Based on our review, nothing has come to our attention that causes us to believe that the condensed set of consolidated financial information in the Statement of Half Year Results for the six months ended 30 September 2012 is not prepared, in all material respects, in accordance with International Accounting Standard 34 as adopted by the European Union and the Disclosure and Transparency Rules of the United Kingdom's Financial Services Authority. PricewaterhouseCoopers LLP Chartered Accountants London 7 November 2012
14
CONSOLIDATED INCOME STATEMENT (UNAUDITED)
Six months to 30 September
Six months to 30 September
Year to
31 March
Notes
2012
£m
2011
£m
2012
£m
Continuing operations
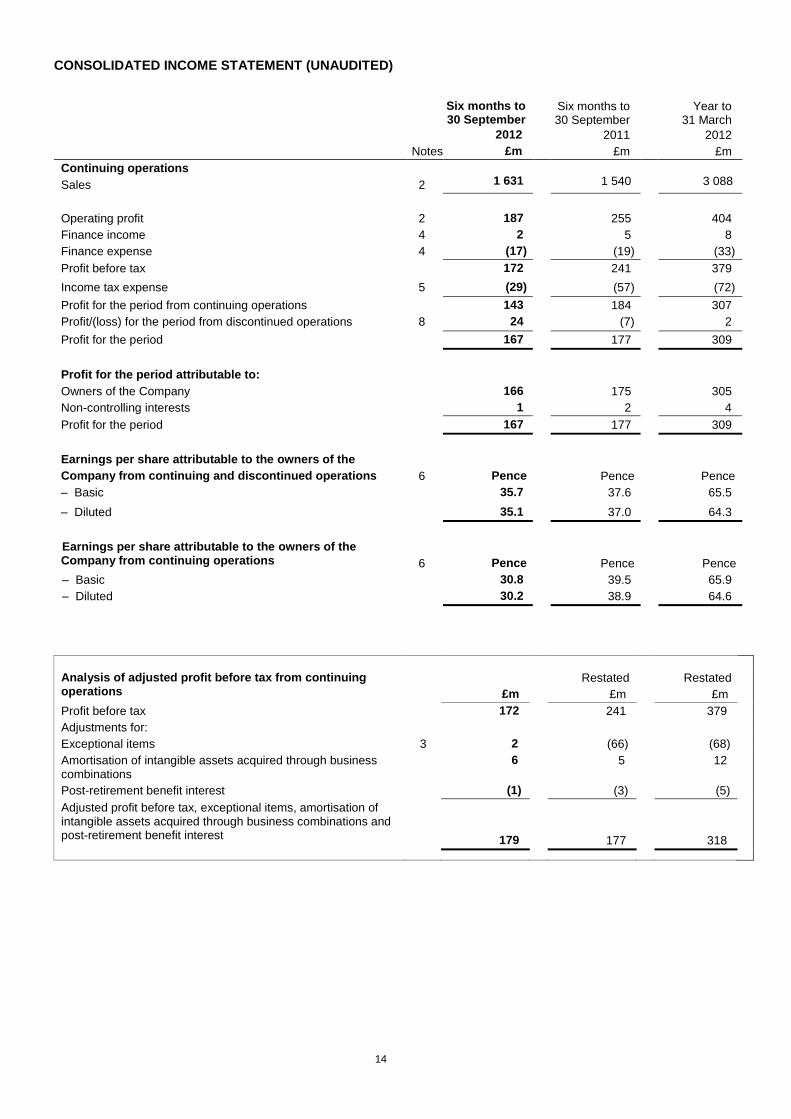
Sales
2
1 631
1 540
3 088
Operating profit 2 187 255 404
Finance income 4 2 5 8
Finance expense 4 (17) (19) (33)
Profit before tax 172 241 379
Income tax expense 5 (29) (57) (72)
Profit for the period from continuing operations 143 184 307
Profit/(loss) for the period from discontinued operations 8 24 (7) 2
Profit for the period 167 177 309
Profit for the period attributable to:
Owners of the Company 166 175 305
Non-controlling interests 1 2 4
Profit for the period 167 177 309
Earnings per share attributable to the owners of the
Company from continuing and discontinued operations
6
Pence
Pence
Pence
– Basic 35.7 37.6 65.5
– Diluted 35.1 37.0 64.3
Earnings per share attributable to the owners of the Company from continuing operations
6
Pence
Pence
Pence
– Basic 30.8 39.5 65.9
– Diluted 30.2 38.9 64.6
Analysis of adjusted profit before tax from continuing operations
£m
Restated
£m
Restated
£m
Profit before tax 172 241 379
Adjustments for:
Exceptional items 3 2 (66) (68)
Amortisation of intangible assets acquired through business combinations
6 5 12
Post-retirement benefit interest (1) (3) (5)
Adjusted profit before tax, exceptional items, amortisation of intangible assets acquired through business combinations and post-retirement benefit interest
179
177
318
15
CONSOLIDATED STATEMENT OF COMPREHENSIVE INCOME (UNAUDITED)
Six months to 30 September
Six months to 30 September
Year to
31 March
2012
£m
2011
£m
2012
£m
Profit for the period 167 177 309
Actuarial losses in post-employment benefit plans (102) (128) (87)
Net fair value losses on cash flow hedges (2) (7) (2)
Cash flow hedges reclassified and reported in the income statement during the year
3
–
(3)
Valuation losses on available-for-sale financial assets – – (1)
Net exchange differences (25) (14) (30)
Items recycled to income statement on disposal (14) – (11)
Deferred tax relating to the above components 18 36 27
Other comprehensive expense for the period, net of tax (122) (113) (107)
Total comprehensive income for the period 45 64 202
Total comprehensive income relating to continuing operations 27 71 211
Total comprehensive income/(expense) relating to discontinued operations
18
(7)
(9)
45 64 202
Attributable to:
Owners of the Company 43 61 198
Non-controlling interests 2 3 4
45 64 202
Dividends per share Pence Pence Pence
– Proposed at the end of the period 7.4 7.1 17.8
– Paid in the period 17.8 16.9 24.0
16
CONSOLIDATED STATEMENT OF FINANCIAL POSITION (UNAUDITED)
30 September 30 September 31 March
Notes
2012
£m
2011
£m
2012
£m
ASSETS
Non-current assets
Goodwill and other intangible assets 329 328 325
Property, plant and equipment 896 904 922
Investments in associates 6 5 5
Available-for-sale financial assets 25 22 23
Derivative financial instruments 62 61 57
Deferred tax assets 38 63 37
Trade and other receivables 4 – 2
Retirement benefit surplus 113 85 146
1 473 1 468 1 517
Current assets
Inventories 434 343 450
Trade and other receivables 347 329 332
Current tax assets 4 4 3
Derivative financial instruments 108 106 80
Cash and cash equivalents 9 419 531 424
1 312 1 313 1 289
Assets held for sale 11 3 72 100
1 315 1 385 1 389
TOTAL ASSETS 2 788 2 853 2 906
SHAREHOLDERS’ EQUITY
Capital and reserves attributable to the owners
of the Company:
Share capital 117 117 117
Share premium 406 406 406
Capital redemption reserve 8 8 8
Other reserves 89 155 128
Retained earnings 357 250 374
977 936 1 033
Non-controlling interests – 26 25
TOTAL SHAREHOLDERS’ EQUITY 977 962 1 058
LIABILITIES
Non-current liabilities
Trade and other payables 1 – 4
Borrowings 9 803 822 805
Derivative financial instruments 16 25 19
Deferred tax liabilities 22 27 25
Retirement benefit deficit 330 318 286
Provisions for other liabilities and charges 14 21 18
1 186 1 213 1 157
Current liabilities
Trade and other payables 418 336 382
Current tax liabilities 56 49 49
Borrowings and bank overdrafts 9 57 141 141
Derivative financial instruments 83 129 94
Provisions for other liabilities and charges 11 16 10
625 671 676
Liabilities held for sale 11 – 7 15
625 678 691
TOTAL LIABILITIES 1 811 1 891 1 848
TOTAL SHAREHOLDERS’ EQUITY AND LIABILITIES 2 788 2 853 2 906
17
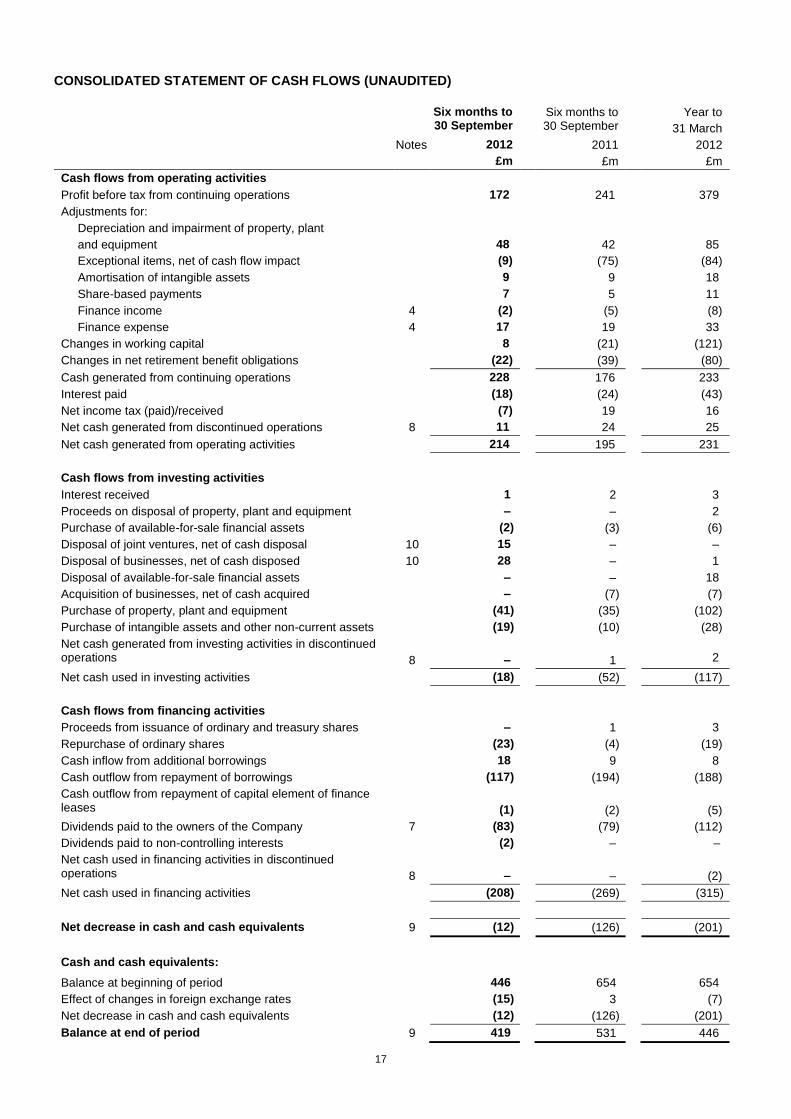
CONSOLIDATED STATEMENT OF CASH FLOWS (UNAUDITED)
Six months to 30 September
Six months to 30 September
Year to
31 March
Notes 2012
£m
2011
£m
2012
£m
Cash flows from operating activities
Profit before tax from continuing operations 172 241 379
Adjustments for:
Depreciation and impairment of property, plant
and equipment
48
42
85
Exceptional items, net of cash flow impact (9) (75) (84)
Amortisation of intangible assets 9 9 18
Share-based payments 7 5 11
Finance income 4 (2) (5) (8)
Finance expense 4 17 19 33
Changes in working capital 8 (21) (121)
Changes in net retirement benefit obligations (22) (39) (80)
Cash generated from continuing operations 228 176 233
Interest paid (18) (24) (43)
Net income tax (paid)/received (7) 19 16
Net cash generated from discontinued operations 8 11 24 25
Net cash generated from operating activities 214 195 231
Cash flows from investing activities
Interest received 1 2 3
Proceeds on disposal of property, plant and equipment – – 2
Purchase of available-for-sale financial assets (2) (3) (6)
Disposal of joint ventures, net of cash disposal 10 15 – –
Disposal of businesses, net of cash disposed 10 28 – 1
Disposal of available-for-sale financial assets – – 18
Acquisition of businesses, net of cash acquired – (7) (7)
Purchase of property, plant and equipment (41) (35) (102)
Purchase of intangible assets and other non-current assets (19) (10) (28)
Net cash generated from investing activities in discontinued operations
8
–
1
2
Net cash used in investing activities (18) (52) (117)
Cash flows from financing activities
Proceeds from issuance of ordinary and treasury shares – 1 3
Repurchase of ordinary shares (23) (4) (19)
Cash inflow from additional borrowings 18 9 8
Cash outflow from repayment of borrowings (117) (194) (188)
Cash outflow from repayment of capital element of finance leases
(1)
(2)
(5)
Dividends paid to the owners of the Company 7 (83) (79) (112)
Dividends paid to non-controlling interests (2) – –
Net cash used in financing activities in discontinued operations
8
–
–
(2)
Net cash used in financing activities (208) (269) (315)
Net decrease in cash and cash equivalents 9 (12) (126) (201)
Cash and cash equivalents:
Balance at beginning of period 446 654 654
Effect of changes in foreign exchange rates (15) 3 (7)
Net decrease in cash and cash equivalents (12) (126) (201)
Balance at end of period 9 419 531 446
18
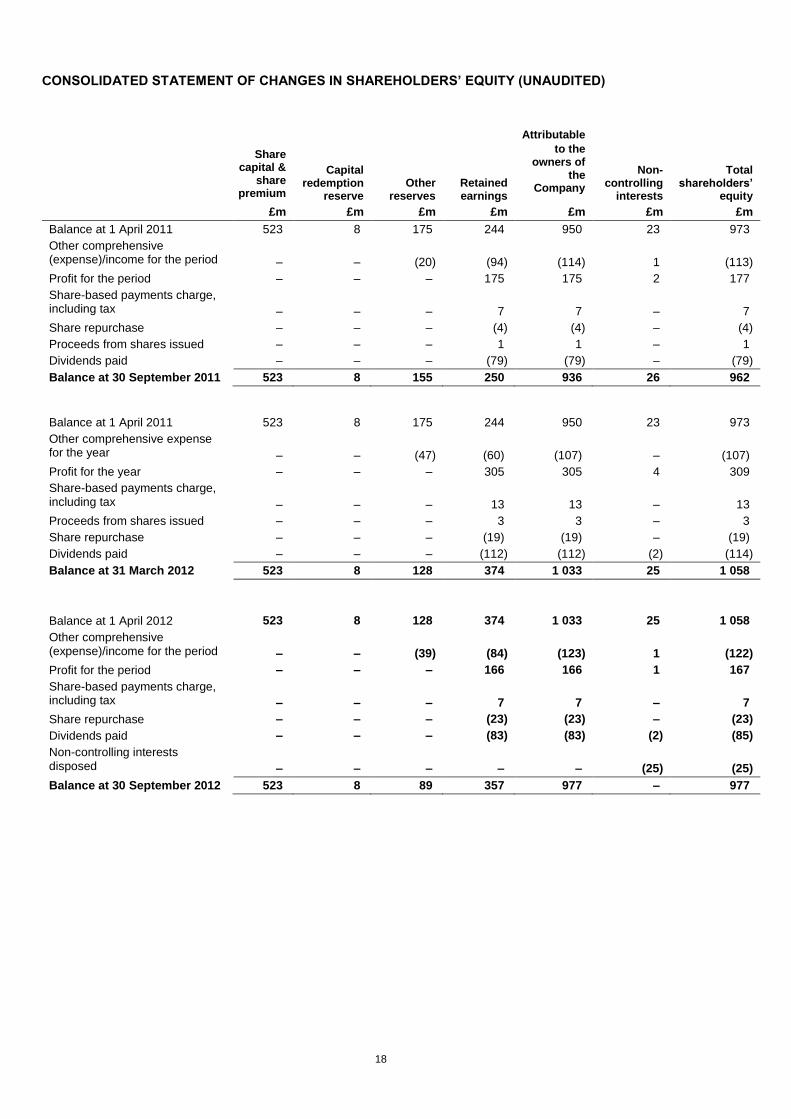
CONSOLIDATED STATEMENT OF CHANGES IN SHAREHOLDERS’ EQUITY (UNAUDITED)
Share capital &
share premium
Capital redemption
reserve
Other reserves
Retained earnings
Attributable
to the owners of
the Company
Non-controlling
interests
Total shareholders’
equity
£m £m £m £m £m £m £m
Balance at 1 April 2011 523 8 175 244 950 23 973
Other comprehensive (expense)/income for the period
–
–
(20)
(94)
(114)
1
(113)
Profit for the period – – – 175 175 2 177
Share-based payments charge, including tax
–
–
–
7
7
–
7
Share repurchase – – – (4) (4) – (4)
Proceeds from shares issued – – – 1 1 – 1
Dividends paid – – – (79) (79) – (79)
Balance at 30 September 2011 523 8 155 250 936 26 962
Balance at 1 April 2011 523 8 175 244 950 23 973
Other comprehensive expense for the year
–
–
(47)
(60)
(107)
–
(107)
Profit for the year – – – 305 305 4 309
Share-based payments charge, including tax
–
–
–
13
13
–
13
Proceeds from shares issued – – – 3 3 – 3
Share repurchase – – – (19) (19) – (19)
Dividends paid – – – (112) (112) (2) (114)
Balance at 31 March 2012 523 8 128 374 1 033 25 1 058
Balance at 1 April 2012 523 8 128 374 1 033 25 1 058
Other comprehensive (expense)/income for the period
–
–
(39)
(84)
(123)
1
(122)
Profit for the period – – – 166 166 1 167
Share-based payments charge, including tax
–
–
–
7
7
–
7
Share repurchase – – – (23) (23) – (23)
Dividends paid – – – (83) (83) (2) (85)
Non-controlling interests disposed
–
–
–
–
–
(25)
(25)
Balance at 30 September 2012 523 8 89 357 977 – 977
19
1. Presentation of half year financial information
General information
The principal activities of Tate & Lyle PLC are the development, manufacture and marketing of food and industrial ingredients that have been made from renewable resources. The Group operates over 30 production facilities globally through its subsidiary companies, partnerships and joint ventures. The Company is a public limited company incorporated and domiciled in the United Kingdom. The address of its registered office is 1 Kingsway, London WC2B 6AT. The Company has its primary listing on the London Stock Exchange. Basis of preparation
This condensed set of consolidated financial information for the six months ended 30 September 2012 has been prepared on a going concern basis in accordance with the Disclosure and Transparency Rules of the Financial Services Authority and with IAS 34 Interim Financial Reporting as adopted by the European Union. The condensed set of consolidated financial information should be read in conjunction with the annual financial statements for the year ended 31 March 2012, which have been prepared in accordance with IFRSs as adopted by the European Union.
Having reviewed the Group’s latest projected results, cash flows, liquidity position and borrowing facilities, the Directors have a reasonable expectation that the Group has adequate resources to continue in existence for the foreseeable future. Accordingly, it is appropriate to continue to adopt the going concern basis in preparing the condensed set of consolidated financial information. All businesses from the former Sugars segment are reported as discontinued operations. In the current period, a number of disposals occurred which are detailed in Note 10. The condensed set of consolidated financial information is unaudited, but has been reviewed by the external auditors. The condensed set of consolidated financial information in the Statement of Half Year Results does not constitute statutory accounts within the meaning of Section 434 of the Companies Act 2006. The Group’s published consolidated financial statements for the year ended 31 March 2012 were approved by the Board of Directors on 30 May 2012 and filed with the Registrar of Companies. The report of the auditors on those accounts was unqualified and did not contain an emphasis of matter paragraph or a statement under Section 498 (2) or (3) of the Companies Act 2006. The condensed set of consolidated financial information for the six months ended 30 September 2012 on pages 14 to 35 was approved by the Board of Directors on 7 November 2012. Changes in accounting policy and disclosures
The accounting policies adopted in the preparation of the condensed set of consolidated financial information are consistent with those of the Group’s Annual Report and Accounts for the year ended 31 March 2012, other than the adoption, with effect from 1 April 2012, of new or revised accounting standards, as set out below:
Amendment to IFRS 7 Financial instruments: Transfers of financial assets
The adoption of these standards and interpretations has not had a material effect on the results or financial position of the Group. In the current period, post-retirement benefit interest has been excluded from adjusted earnings. All comparatives have been restated accordingly. The following new standards, new interpretations and amendments to standards and interpretations have been issued but are not effective for the financial year beginning 1 April 2012 and have not been early adopted:
IFRS 9 Financial Instruments
IFRS 10 Consolidated Financial Statements
IFRS 11 Joint Arrangements
IFRS 12 Disclosure of Interest in Other Entities
IFRS 13 Fair Value Measurement
Amendment to IAS 19 Employee Benefits
Annual improvements 2011
The amendment to IAS 19 will change the basis on which the financing charge is calculated by applying the discount rate to the net defined benefit obligation. For the period ended 30 September 2012, calculating the finance charge in accordance with the new requirements would have increased net finance costs, recognised outside adjusted earnings, by £4 million (2011 – £6 million). Under its current accounting policies the Group recognises actuarial gains and losses directly in other comprehensive income, as required by the new standard. The adoptions of the other standards may affect disclosures in the Group’s financial statements.
20
1. Presentation of half year financial information (continued)
Changes in accounting policy and disclosures (continued)
In May 2011, the IASB issued IFRS 11 Joint Arrangements which, subject to final EU endorsement, is expected to have a delayed effective date of accounting periods beginning on or after 1 January 2014. While the net result and net assets of the Group will remain unchanged, the presentation of the Consolidated Income Statement, Consolidated Statement of Financial Position and Consolidated Statement of Cash Flow will change significantly as IFRS 11 prohibits proportionate consolidation of joint ventures which is the Group’s current accounting policy, as allowed under IAS 31. Under IFRS 11, joint ventures will be equity accounted. Operating segment results will remain unchanged and continue to proportionately consolidate joint ventures reflecting internal reporting to the Group’s Chief Operating Decision Maker. Use of adjusted measures
Tate & Lyle presents adjusted operating profit, profit before tax and earnings per share information. These measures are used by Tate & Lyle for internal performance analysis and incentive compensation arrangements for employees. The terms ‘adjusted’ and ‘exceptional items’ are not defined terms under IFRS and may therefore not be comparable with similarly titled measures reported by other companies. They are not intended to be a substitute for, or superior to, GAAP measurements of profit. The term ‘adjusted’ refers to the relevant measure being reported excluding exceptional items, post-retirement benefit interest and amortisation of intangible assets acquired through business combinations. A reconciliation to reported information is provided in Note 16. Seasonality
The Group's principal exposure to seasonality is in relation to working capital. The Group's inventories are subject to seasonal fluctuations reflecting crop harvesting and purchases. Inventory levels typically increase progressively from September to November and gradually reduce in the first six months of the calendar year.
21
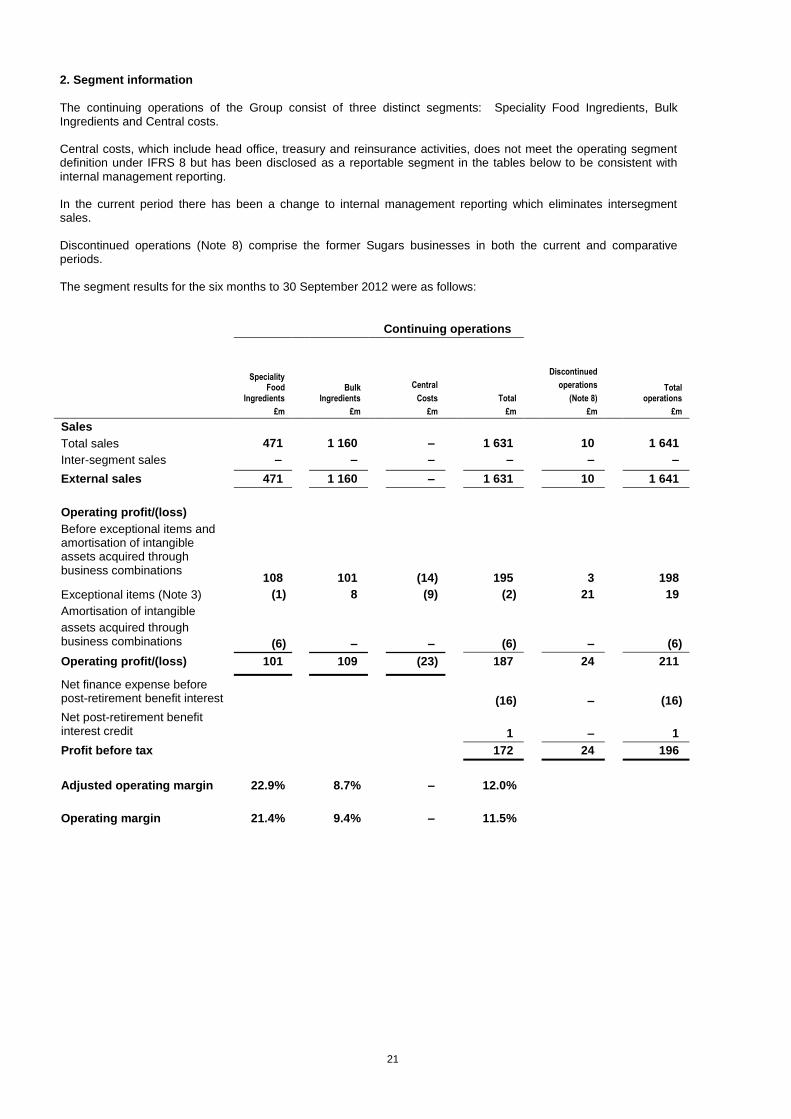
2. Segment information
The continuing operations of the Group consist of three distinct segments: Speciality Food Ingredients, Bulk Ingredients and Central costs. Central costs, which include head office, treasury and reinsurance activities, does not meet the operating segment definition under IFRS 8 but has been disclosed as a reportable segment in the tables below to be consistent with internal management reporting. In the current period there has been a change to internal management reporting which eliminates intersegment sales. Discontinued operations (Note 8) comprise the former Sugars businesses in both the current and comparative periods. The segment results for the six months to 30 September 2012 were as follows:
Continuing operations
Speciality Food
Ingredients
Bulk Ingredients
Central
Costs
Total
Discontinued
operations
(Note 8)
Total operations
£m £m £m £m £m £m
Sales
Total sales 471 1 160 – 1 631 10 1 641
Inter-segment sales – – – – – –
External sales 471 1 160 – 1 631 10 1 641
Operating profit/(loss)
Before exceptional items and amortisation of intangible assets acquired through business combinations
108
101
(14)
195
3
198
Exceptional items (Note 3) (1) 8 (9) (2) 21 19
Amortisation of intangible
assets acquired through business combinations
(6)
–
–
(6)
–
(6)
Operating profit/(loss) 101 109 (23) 187 24 211
Net finance expense before post-retirement benefit interest
(16)
–
(16)
Net post-retirement benefit interest credit
1
–
1
Profit before tax 172 24 196
Adjusted operating margin 22.9% 8.7% – 12.0%
Operating margin 21.4% 9.4% – 11.5%
22
2. Segment information (continued)
The comparative segment results for the six months to 30 September 2011 were as follows:
Continuing operations
Speciality Food
Ingredients
Bulk Ingredients
Central
costs
Total
Discontinued
operations
(Note 8)
Total operations
£m £m £m £m £m £m
Sales
Total sales 505 1 130 – 1 635 50 1 685
Inter-segment sales (55) (40) – (95) – (95)
External sales 450 1 090 – 1 540 50 1 590
Operating profit/(loss)
Before exceptional items and amortisation of intangible assets acquired through business combinations
116
96
(18)
194
3
197
Exceptional items (Note 3) 70 – (4) 66 – 66
Amortisation of intangible
assets acquired through business combinations
(5)
–
–
(5)
–
(5)
Operating profit/(loss) 181 96 (22) 255 3 258
Net finance expense before post-retirement benefit interest
(17)
–
(17)
Net post-retirement benefit interest credit
3
–
3
Profit before tax 241 3 244
Adjusted operating margin 25.8% 8.8% – 12.6%
Operating margin 40.2% 8.8% – 16.6%
23
2. Segment information (continued)
The segment results for the year to 31 March 2012 were as follows: Continuing operations
Speciality Food
Ingredients
Bulk
Ingredients
Central costs
Total
Discontinued operations
(Note 8)
Total operations
£m £m £m £m £m £m
Sales
Total sales 992 2 277 – 3 269 72 3 341
Inter-segment sales (105) (76) – (181) – (181)
External sales 887 2 201 – 3 088 72 3 160
Operating profit/(loss)
Before exceptional items and amortisation of intangible assets acquired through business combinations 214 172 (38) 348 5 353
Exceptional items (Note 3) 70 7 (9) 68 11 79
Amortisation of intangible assets acquired through business combinations
(12)
–
–
(12) –
(12)
Operating profit/(loss) 272 179 (47) 404 16 420
Net finance (expense)/ income before post-retirement benefit interest
(30)
1
(29)
Net post-retirement benefit interest credit
5
–
5
Profit before tax 379 17 396
Adjusted operating margin 24.1% 7.8% – 11.3%
Operating margin 30.7% 8.1% – 13.1%
24
3. Exceptional items
Six months to Six months to Year to
30 September 30 September 31 March
2012 2011 2012
£m £m £m
Continuing
Gain on disposal of joint venture – Sucromiles (a) 8 – –
Business transformation costs (b) (10) (7) (15)
Reversal of fixed asset impairment – McIntosh and Decatur assets (c) – 53 60
Reversal of provision – McIntosh (c) – 20 23
(2) 66 68
Discontinued
Gain on disposal of subsidiary – Vietnam Sugar (d) 21 – –
Gain on disposal of minority holdings – International Sugar Trading (e) – – 11
21 – 11
Total 19 66 79
Continuing operations
(a) On 1 August 2012, the Group completed the disposal of its share in Sucromiles SA (Sucromiles), its Colombian citric acid
joint venture, to its former joint venture partner, Organizacion Ardila Lulle. After recycling foreign exchange revaluation gains previously held in reserves to the income statement, a gain on disposal of £8 million was recorded and is reported in the Bulk Ingredients segment. Further details are set out in Note 10.
(b) The Group has recognised an exceptional charge of £10 million (30 September 2011 – £7 million, 31 March 2012 –
£15 million) in relation to business transformation costs. The Group incurred £9 million (30 September 2011 – £4 million; 31 March 2012 – £9 million) of costs that did not meet the capitalisation criteria associated with the implementation of a common global IS/IT platform and Global Shared Services Centre, and £1 million (30 September 2011 – £2 million; 31 March 2012 – £5 million) in relation to the relocation of employees and restructuring associated with the new Commercial and Food Innovation Centre in Chicago, Illinois. In the prior period, £1 million (31 March 2012 – £1 million) of closure and other restructuring costs were incurred in relation to the Food Systems business. These costs are reported in the Speciality Food Ingredients segment (£1 million; 30 September 2011 – £3 million; 31 March 2012 – £6 million) and within Central costs (£9 million; 30 September 2011 – £4 million; 31 March 2012 – £9 million).
(c) In May 2011, the Group took the decision to re-open the mothballed facility in McIntosh, Alabama and restart the production
of sucralose. This decision has resulted in the reversal of £53 million of the impairment charge previously recognised against property, plant and equipment. In addition, £23 million (30 September 2011 – £20 million) of the provision in respect of obligations relating to the mothballed facility was no longer required and was also reversed. These exceptional items were reported within the Speciality Food Ingredients segment.
In addition, in November 2010 the Group signed an agreement with Amyris, Inc. to manufacture Trans-beta-Farnesene using assets located at the Decatur, Illinois plant that were previously redundant. Commercial viability of the new production process was proven in the second half of the year to 31 March 2012 resulting in a £7 million reversal of the write down previously recognised against property, plant and equipment. This exceptional item was reported within the Bulk Ingredients segment.
The tax impact on continuing net exceptional items is a £2 million credit (30 September 2011 - £28 million charge; 31 March 2012 – £31 million charge). Tax credits on exceptional costs are only recognised to the extent that losses incurred will result in tax recoverable in the future. In addition, in the prior year there was an exceptional tax credit of £10 million which represented the recognition of a deferred tax asset in respect of foreign tax credits recognised in association with the disposal of the ethanol facility in Fort Dodge, Iowa. Discontinued operations
(d) On 29 June 2012, the Group completed the sale of Vietnam Sugar to TH Milk Food Stock Company. After recycling foreign
exchange revaluation gains previously held in reserves to the income statement, a gain on disposal of £21 million was recorded. Further details are set out in Note 10.
(e) In the prior year, the Group completed the sale of its minority holdings in Egypt and Saudi Arabia relating to the former
International Sugar Trading business and received £18 million in cash consideration. After recycling foreign exchange revaluation gains to the income statement, the Group recorded an exceptional gain of £11 million.
The tax impact on discontinued net exceptional items for the period is £nil (30 September 2011 - £nil; 31 March 2012 – £15 million).
25
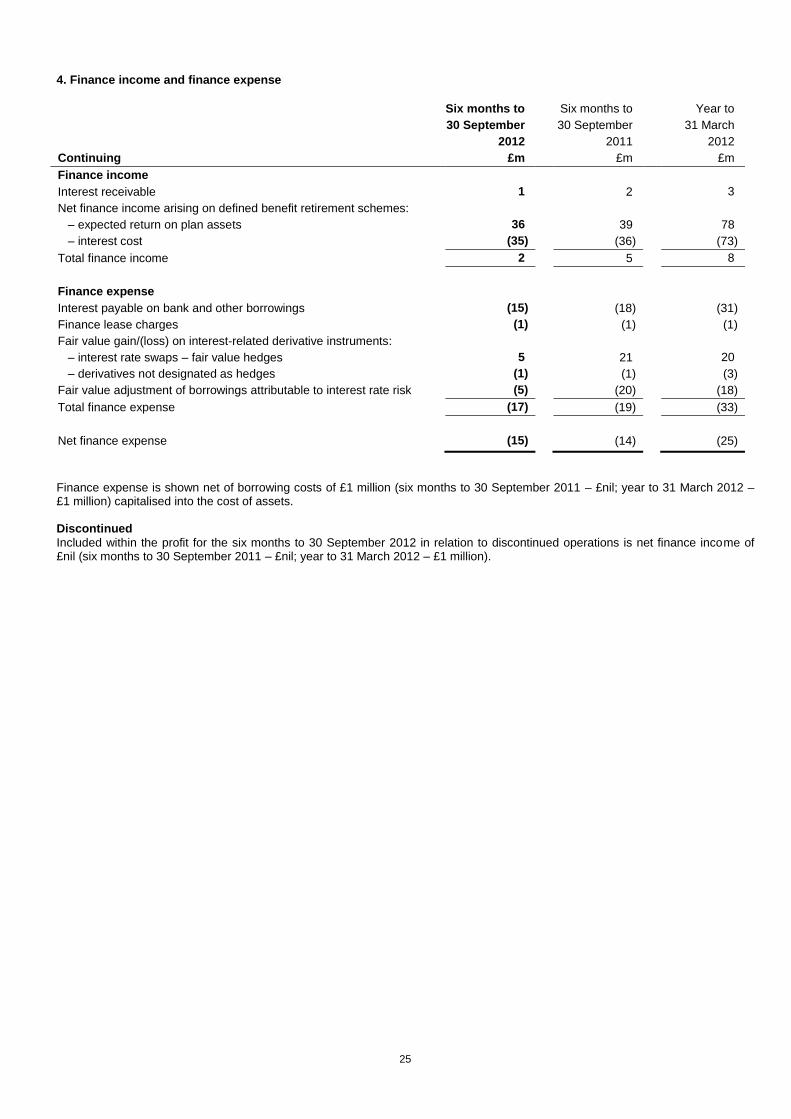
4. Finance income and finance expense
Six months to Six months to Year to
30 September 30 September 31 March
2012 2011 2012
Continuing £m £m £m
Finance income
Interest receivable
1
2
3
Net finance income arising on defined benefit retirement schemes:
– expected return on plan assets 36 39 78
– interest cost (35) (36) (73)
Total finance income 2 5 8
Finance expense
Interest payable on bank and other borrowings (15) (18) (31)
Finance lease charges (1) (1) (1)
Fair value gain/(loss) on interest-related derivative instruments:
– interest rate swaps – fair value hedges 5 21 20
– derivatives not designated as hedges (1) (1) (3)
Fair value adjustment of borrowings attributable to interest rate risk (5) (20) (18)
Total finance expense (17) (19) (33)
Net finance expense (15) (14) (25)
Finance expense is shown net of borrowing costs of £1 million (six months to 30 September 2011 – £nil; year to 31 March 2012 – £1 million) capitalised into the cost of assets.
Discontinued
Included within the profit for the six months to 30 September 2012 in relation to discontinued operations is net finance income of £nil (six months to 30 September 2011 – £nil; year to 31 March 2012 – £1 million).
26
5. Income tax expense
Six months to Six months to Year to
30 September 30 September 31 March
2012 2011 2012
Continuing £m £m £m
Current tax:
In respect of the current period
– UK
–
–
–
– Overseas 14 8 7
Deferred tax charge
Exceptional tax credit
14
15
–
8
49
–
7
73
(10)
Adjustments in respect of previous years – – 2
Income tax expense 29 57 72
Details of the exceptional tax credit in the year to 31 March 2012 are set out in Note 3.
Six months to Six months to Year to
30 September 30 September 31 March
2012 2011 2012
Discontinued £m £m £m
Current tax:
– Overseas taxation – 10 15
– 10 15
Deferred tax – – –
Income tax expense – 10 15
In the prior period within discontinued operations, overseas taxation includes a £9 million charge (year to 31 March 2012 – £15 million charge) relating to outstanding tax matters associated with starch facilities which formed part of the former Food & Industrial Ingredients, Europe segment, which are in the process of litigation. These facilities were disposed of by the Group in the year ended 31 March 2008.
27
6. Earnings per share Basic
Basic earnings per share is calculated by dividing the profit attributable to owners of the Company by the weighted average number of ordinary shares in issue during the period, excluding ordinary shares purchased by the Company and held in the employee share ownership trust or in treasury.
Six months to
30 September 2012
Six months to
30 September 2011
Continuing Discontinued Continuing Discontinued
operations operations Total Operations operations Total
Profit/(loss) attributable to owners of the Company (£m)
143
23
166
184
(9)
175
Weighted average number of ordinary shares in issue (millions)
464.7
464.7
464.7
465.9
465.9
465.9
Basic earnings/(loss) per share 30.8p 4.9p 35.7p 39.5p (1.9)p 37.6p
Year to
31 March 2012
Continuing Discontinued
operations operations Total
Profit/(loss) attributable to owners of the Company (£m) 307 (2) 305
Weighted average number of ordinary shares in issue (millions) 465.7 465.7 465.7
Basic earnings/(loss) per share 65.9p (0.4)p 65.5p
Diluted
Diluted earnings per share is calculated by adjusting the weighted average number of ordinary shares in issue to assume conversion of all potential dilutive ordinary shares. Potential dilutive ordinary shares arise from share options, and the Group’s long term share incentive plans. For non-performance related share plans, a calculation is performed to determine the number of shares that could have been acquired at fair value (determined as the average annual market share price of the Company’s shares) based on the monetary value of the subscription rights attached to outstanding share options. For performance related share plans, a calculation is performed to determine the satisfaction or otherwise, of the performance conditions at the end of the reporting period, and the number of shares which would be issued based on the status at the end of the reporting period.
Six months to
30 September 2012
Six months to
30 September 2011
Continuing Discontinued Continuing Discontinued
operations operations Total Operations operations Total
Profit/(loss) attributable to owners of the Company (£m)
143
23
166
184
(9)
175
Weighted average number of diluted shares (millions)
472.9
472.9
472.9
473.9
473.9
473.9
Diluted earnings/(loss) per share 30.2p 4.9p 35.1p 38.9p (1.9)p 37.0p
Year to
31 March 2012
Continuing Discontinued
operations operations Total
Profit/(loss) attributable to owners of the Company (£m) 307 (2) 305
Weighted average number of diluted shares (millions) 474.9 474.9 474.9
Diluted earnings/(loss) per share 64.6p (0.3)p 64.3p
The adjustment for the dilutive effect of share options at 30 September 2012 was 8.2 million (30 September 2011 – 8.0 million; 31 March 2012 – 9.2 million).
28
6. Earnings per share (continued) Adjusted earnings per share
Adjusted earnings per share is stated after excluding exceptional items, amortisation of intangible assets acquired through business combinations and post-retirement benefit interest, as follows:
Six months to 30 September
Restated
Six months to 30 September
Restated
Year to 31 March
Continuing operations 2012 2011 2012
Profit attributable to owners of the Company (£m) 143 184 307
Adjustments for (£m):
– exceptional items (Note 3)
– amortisation of intangible assets acquired through
business combinations
– net post-retirement benefit interest credit
– tax effect on the above adjustments
– exceptional tax credit
2
6
(1)
(5)
–
(66)
5
(3)
25
–
(68)
12
(5)
14
(10)
Adjusted profit (£m) 145 145 250
Adjusted basic earnings per share from continuing operations 31.2p 31.2p 55.8p
Adjusted diluted earnings per share from continuing operations 30.7p 30.7p 54.7p
7. Dividends
The Directors have declared an interim dividend of 7.4p per share for the six months to 30 September 2012 (30 September 2011 – 7.1p per share), payable on 4 January 2013. The final dividend for the year to 31 March 2012 of £83 million, representing 17.8p per share, was paid during the six months to 30 September 2012.
29
8. Discontinued operations
In July 2010, the Group announced its intention to sell the remaining businesses within the former Sugars segment. Accordingly, the results of these Sugars businesses are presented as discontinued operations in both the current and comparative periods. In the current period, the Group completed the sale of Vietnam Sugar along with the disposal of its remaining International Sugar Trading interests and assets in its Israel Sugar operations. Further details can be found in Note 10. The results relating to International Sugar Trading and Israel Sugar are presented within the Other category below. In the prior period, Other also includes £9 million of income tax expense (year to 31 March 2012 – £15 million) in respect of outstanding tax matters associated with the starch facilities that formed part of the former Food & Industrial Ingredients, Europe segment, which are in the process of litigation.
Six months to 30 September 2012
Vietnam Sugar
Other
Total
£m £m £m
Sales 9 1 10
Operating profit before exceptional items 3 – 3
Exceptional items (Note 3) 21 – 21
Operating profit and profit before tax 24 – 24
Income tax expense (Note 5) – – –
Profit for the period 24 – 24
Non-controlling interests (1) – (1)
Profit attributable to owners of the Company 23 – 23
Six months to 30 September 2011
Vietnam Sugar
Other
Total
£m £m £m
Sales 18 32 50
Operating profit/(loss) before exceptional items 4 (1) 3
Exceptional items (Note 3) – – –
Operating profit/(loss) and profit/(loss) before tax 4 (1) 3
Income tax expense (Note 5) – (10) (10)
Profit/(loss) for the period 4 (11) (7)
Non-controlling interests (2) – (2)
Profit/(loss) attributable to owners of the Company 2 (11) (9)
Year to 31 March 2012
Vietnam Sugar
Other
Total
£m £m £m
Sales 31 41 72
Operating profit/(loss) before exceptional items 7 (2) 5
Exceptional items (Note 3) – 11 11
Operating profit 7 9 16
Finance income 2 – 2
Finance expense – (1) (1)
Profit before tax 9 8 17
Income tax expense (Note 5) – (15) (15)
Profit/(loss) for the period 9 (7) 2
Non-controlling interests (4) – (4)
Profit/(loss) attributable to owners of the Company 5 (7) (2)
30
8. Discontinued operations (continued)
Net cash flows from discontinued operations are as follows:
Six months to 30 September 2012
Vietnam Sugar
Other
Total
£m £m £m
Net cash generated from operating activities 4 7 11
Six months to 30 September 2011
Vietnam Sugar
Other
Total
£m £m £m
Net cash generated from operating activities 14 10 24
Net cash generated from investing activities 1 – 1
Year to 31 March 2012
Vietnam Sugar
Other
Total
£m £m £m
Net cash generated from operating activities 10 15 25
Net cash generated from investing activities 2 – 2
Net cash used in financing activities (2) – (2)
31
9. Net debt
The components of the Group’s net debt profile are as follows:
30 September 2012
30 September 2011
31 March 2012
£m
£m £m
Non-current borrowings (803) (822) (805)
Current borrowings and bank overdrafts (57) (141) (141)
Debt-related derivative instruments 55 22 24
Cash and cash equivalents 419 531 424
Assets held for sale – cash and cash equivalents – – 22
Net debt (386) (410) (476)
Derivative financial instruments presented within assets and liabilities in the statement of financial position of £71 million net asset (30 September 2011 – £13 million; 31 March 2012 – £24 million) comprise net debt-related instruments of £55 million asset (30 September 2011 – £22 million; 31 March 2012 – £24 million) and non net debt-related instruments of £16 million asset (30 September 2011 – £9 million liability; 31 March 2012 – £nil). Additional net non-debt related instruments of £16 million asset at 30 September 2011 and £8 million asset at 31 March 2012 were included in assets and liabilities held for sale (Note 11).
Movements in the Group’s net debt profile are as follows:
Six months to
30 September Six months to
30 September Year to
31 March
2012 2011 2012
£m £m £m
Balance at beginning of period (476) (464) (464)
Cash outflow from movement in borrowings 100 187 185
Decrease in cash and cash equivalents in the period (12) (126) (201)
Inception of finance leases – – (7)
Fair value and other movements 7 6 7
Exchange (5) (13) 4
Decrease/(increase) in net debt in the period 90 54 (12)
Balance at end of the period (386) (410) (476)
32
10. Disposals Continuing operations Sucromiles On 1 August 2012, the Group completed the disposal of its share in Sucromiles SA (Sucromiles), its Colombian citric acid joint venture, to its former joint venture partner, Organizacion Ardila Lulle, for consideration of £20 million. After recycling foreign exchange revaluation gains to the income statement, an exceptional gain on disposal of £8 million was recorded within continuing operations. Discontinued operations Vietnam Sugar On 29 June 2012, the Group completed the sale of Vietnam Sugar to TH Milk Food Stock Company for consideration of £45 million. After recycling foreign exchange revaluation gains to the income statement, an exceptional gain on disposal of £21 million was recorded within discontinued operations. EU Sugars During the period, the Group received £2 million in respect of a working capital settlement from its disposal of the EU Sugars business to American Sugar Refining during the year ended 31 March 2011. Other During the period, the Group disposed of the remaining assets in the Israel Sugar business, resulting in a profit of £2 million. This has been offset by losses from the disposal of other assets within Group relating to Sugar operations which are discontinued. The calculations of the results on disposal in the current period, split between continuing and discontinued operations, are shown below:
Exceptional gain within continuing operations (Note 3) 8 − 8
Operating loss within discontinued operations (Note 8) − (2) (2)
Exceptional gain within discontinued operations (Note 3) − 21 21
Operating gain within discontinued operations (Note 8) − 2 2
8 21 29
Cash flows:
Cash consideration 20 50 70
Cash disposed (5) (22) (27)
Cash inflow in the period 15 28 43
33
11. Assets and liabilities classified as held for sale
Assets held for sale as at 30 September 2012 are shown in the table below. These assets principally comprise of land and buildings relating to the former Molasses business.
30 September 30 September 31 March
2012 2011 2012
£m £m £m
Assets
Property, plant and equipment 2 21 22
Intangible assets – 2 2
Inventories – 6 25
Trade and other receivables – 9 15
Derivative financial instruments – 16 13
Cash and cash equivalents – – 22
Available-for-sale financial assets 1 18 1
Total assets held for sale 3 72 100
Liabilities
Trade and other payables – (7) (9)
Derivative financial instruments – – (5)
Current tax liabilities – – (1)
Total liabilities held for sale – (7) (15)
12. Capital expenditure
In the six months to 30 September 2012, there were additions to intangible assets of £19 million (30 September 2011 – £13 million; 31 March 2012 – £30 million) and additions to property, plant and equipment of £40 million (30 September 2011 – £35 million; 31 March 2012 – £116 million).
30 September 30 September 31 March
2012 2011 2012
£m £m £m
Commitments for the acquisition of property, plant and equipment 17 41 21
Commitments for the acquisition of intangible assets – 11 10
Total commitments 17 52 31
13. Contingent liabilities Sale of EU Sugars As announced in May 2012, American Sugar Holdings (ASR) has set out a number of claims it believes it has under the Sale and Purchase Agreement. These claims are still yet to be fully quantified, but in large part relate to the turbulence in the supply of raw sugar to the EU during the period prior to closing and the increase in certain rolling re-export commitments of the business. The claims notified by ASR, and the validity of the notification itself, are still under review by our legal advisers. Whitefox Technologies Whitefox Technologies (Whitefox) supplied certain equipment and technology intended for use in certain of the Group’s ethanol production facilities in 2007 which the Group believes was not fit for purpose. Tate & Lyle is seeking damages from Whitefox of approximately US$20 million. Whitefox claims damages exceeding €100 million for breach of contract, damage to certain equipment and other losses. In June 2012, a jury trial in the Supreme Court of the State of New York found in favour of Tate & Lyle. The formal judgement of the Court based on the jury verdict is still awaited. Whitefox have indicated an intention to appeal the decision. Other claims In addition to the above, the Group is subject to claims and litigation generally arising in the ordinary course of its business, some of which are for substantial amounts. Such claims and litigation are strenuously defended, but provision is made for liabilities that are considered likely to arise on the basis of current information and legal advice and after taking into account the Group’s insurance arrangements. While there is always uncertainty as to the outcome of any claim or litigation, it is not expected that claims and litigation existing at the statement of financial position date will have a material adverse effect on the Group’s financial position.
34
14. Related party disclosures
The Group’s significant related parties are its associates and joint ventures as disclosed in the Tate & Lyle Annual Report for the year ended 31 March 2012. There were no material differences in related parties or in the nature of related party transactions during the period. 15. Foreign exchange rates
The following exchange rates have been applied to translate the financial statements of the Group’s principal overseas operations:
Six months to Six months to Year to
30 September 30 September 31 March
Average foreign exchange rates 2012 2011 2012
US Dollar £1 = $ 1.58 1.62 1.60
Euro £1 = € 1.25 1.14 1.15
Hungarian Forint £1 = Ft 359.97 308.50 333.25
Mexican Peso £1 = $ 21.10 19.85 20.26
30 September 30 September 31 March Period end foreign exchange rates 2012 2011 2012
US Dollar £1 = $ 1.61 1.56 1.60 Euro £1 = € 1.25 1.16 1.20 Hungarian Forint £1 = Ft 357.81 341.06 353.74 Mexican Peso £1 = $ 20.75 21.54 20.49
35
16. Reconciliation of adjusted financial information
Adjusted information is presented as it provides both management and investors with valuable additional information on the performance of the business. The following items are excluded from adjusted information:
– discontinued operations; – exceptional items including losses on disposal of businesses, and closure and restructuring provisions; – post-retirement benefit interest; and – amortisation of intangible assets acquired through business combinations.
The following table shows the reconciliation of the statutory information presented in the income statement to the adjusted information:
Six months to 30 September 2012 Six months to 30 September 2011
Reported
£m
Exceptional/Adjusting
items
£m
Adjusted
£m
Reported£m
Exceptional/
Adjusting items
£m
Restated
Adjusted
£m
Continuing operations
Sales 1 631 – 1 631 1 540 – 1 540
Operating profit 187 8 195 255 (61) 194
Net finance expense (15) (1) (16) (14) (3) (17)
Profit before tax 172 7 179 241 (64) 177
Income tax (expense)/credit (29) (5) (34) (57) 25 (32)
Profit attributable to the owners of the Company
143
2
145
184
(39)
145
Basic earnings per share (pence)
30.8
0.4
31.2
39.5
(8.3)
31.2
Diluted earnings per share (pence)
30.2
0.5
30.7
38.9
(8.2)
30.7
Tax rate 16.9% 18.8% 23.5% 18.1%
Discontinued operations
Sales 10 – 10 50 – 50
Operating profit/(loss) 24 (21) 3 3 – 3
Net finance income – – – – – –
Profit before tax 24 (21) 3 3 – 3
Income tax expense – – – (10) – (10)
Non-controlling interests (1) – (1) (2) – (2)
Profit/(loss) attributable to the owners of the Company
23
(21)
2
(9)
–
(9)
Basic earnings/(loss) per share (pence)
4.9
(4.4)
0.5
(1.9)
–
(1.9)
Diluted earnings/(loss) per share (pence)
4.9
(4.5)
0.4
(1.9)
–
(1.9)
Total operations
Sales 1 641 – 1 641 1 590 – 1 590
Operating profit 211 (13) 198 258 (61) 197
Net finance expense (15) (1) (16) (14) (3) (17)
Profit/(loss) before tax 196 (14) 182 244 (64) 180
Income tax (expense)/credit (29) (5) (34) (67) 25 (42)
Non-controlling interests (1) – (1) (2) – (2)
Profit attributable to the owners of the Company
166
(19)
147
175
(39)
136
Basic earnings per share (pence)
35.7
(4.0)
31.7
37.6
(8.3)
29.3
Diluted earnings per share (pence)
35.1
(4.0)
31.1
37.0
(8.2)
28.8
Tax rate 14.7% 18.3% 27.3% 23.4%
`
36
ADDITIONAL INFORMATION
For the six months to 30 September 2012 Ratio analysis
As at
30 September
2012
As at
30 September
2011
Year to
31 March
2012
Net debt to EBITDA (a)
= Net debt 396 397 481
Pre-exceptional EBITDA 457 445 450
= 0.9 times = 0.9 times = 1.1 times
Interest cover (a)
= Operating profit before amortisation of acquired intangible assets and exceptional items
Net interest and finance expense
366 349 364
32 42 33
= 11.4 times = 8.3 times 11.1 times
Earnings dividend cover
= Adjusted basic earnings per share from continuing operations
Dividend per share
31.2 31.2 55.8
7.4 7.1 24.9
= 4.2 times = 4.4 times = 2.2 times
Cash dividend cover (b)
= Free cash flow from continuing operations 144 128 79
Cash dividends 35 33 116
= 4.1 times = 3.9 times = 0.7 times
Gearing
= Net debt 386 410 476
Total shareholders’ equity 980 962 1 058
= 39% = 43% = 45%
Cash conversion cycle (c)
Average quarterly cash conversion cycle 37 days 35 days 36 days
(a) These ratios have been calculated under the Group’s bank covenant definitions and are based on unrounded figures.
Net debt is calculated using average rates of exchange. (b) Free cash flow is defined as cash generated from continuing operating activities, less interest paid, less income tax paid,
less the purchase of property, plant and equipment, less the purchase of intangible and other non-current assets. Cash dividends refer to dividends paid or proposed in respect of the reporting period, excluding the impact of any scrip dividend option where available.
(c) Defined as controllable working capital divided by quarterly sales, multiplied by number of days in quarter.