+ All Categories
Home > Documents > 8 Pataua - nrc.govt.nz

8 Pataua - nrc.govt.nz

Date post: 16-Oct-2021
Category:
Upload: others
View: 3 times
Download: 0 times
Share this document with a friend
13
72 Coastal Erosion Hazard Zone Assessment for Selected Northland Sites T+T Ref. 1012360 Northland Regional Council October 2020 8 Pataua Description and geomorphology Pataua North is located approximately 17 km east of Whangarei. The site includes both the open coast beach (Parauwanui Beach) and the estuary shoreline located on the either side of the Pataua River. The open coast shoreline is approximately 2.3 km long and is situated between Kowhaitai Creek and rock reef in the north to the mouth of the Pataua River in the south. The site has a sandy beach comprising medium to coarse sand. The beach has a berm width of approximately 5 m above the high tide line. The dune is generally well vegetated with spinifex and a foredune is developing along the northern section of open coast shoreline. The dune crest elevation is relatively high ranging from approximately RL 5 to 12 m along the site. The estuary shoreline includes approximately 830 m of shoreline on the northern side of the river and 1.5 km on the southern side of the river. The northern estuary shoreline has sections of soft cliff fronted by a fine sand and silt foreshore. The southern estuary shoreline is lower lying and comprises a grass reserve bank that has a vertical erosion scarp of less than 1 m in elevation. A medium to coarse sand, shelly beach slope fronts the bank. Local considerations There are no erosion protection structures located on the open coast section of the site. The northern estuary shoreline has a number of relatively short tipped rock seawalls. The southern estuary shoreline is protected by a series of timber groyne structures. Beach nourishment has also occurred at the northern point of the southern shoreline, which has resulted in the shoreline building out in this location. A rock revetment structure is located on the southern estuary shoreline situated between the foot bridge and the boat ramp. A boat ramp exists on both sides of the estuary shoreline, and vehicle access to the foreshore also exists at the eastern end of the southern estuary shoreline. Site Photograph A (northern end of open coast shoreline) Site Photograph B (northern side of estuary shoreline) Site Photograph C (southern side of estuary shoreline) Coastal Erosion Hazard Assessment The site is split into nine cells based on differences in geomorphology, dune and bank height and shoreline movement trends. Adopted component values are presented within Table 8-1. Short-term erosion values range from 10 to 25 m on the open coast to 2 to 6 m within
Transcript

72

Coastal Erosion Hazard Zone Assessment for Selected Northland Sites T+T Ref. 1012360 Northland Regional Council October 2020

8 Pataua

Description and geomorphology

Pataua North is located approximately 17 km east of Whangarei. The site includes both the open coast beach (Parauwanui Beach) and the estuary shoreline located on the either side of the Pataua River.

The open coast shoreline is approximately 2.3 km long and is situated between Kowhaitai Creek and rock reef in the north to the mouth of the Pataua River in the south. The site has a sandy beach comprising medium to coarse sand. The beach has a berm width of approximately 5 m above the high tide line. The dune is generally well vegetated with spinifex and a foredune is developing along the northern section of open coast shoreline. The dune crest elevation is relatively high ranging from approximately RL 5 to 12 m along the site.

The estuary shoreline includes approximately 830 m of shoreline on the northern side of the river and 1.5 km on the southern side of the river. The northern estuary shoreline has sections of soft cliff fronted by a fine sand and silt foreshore. The southern estuary shoreline is lower lying and comprises a grass reserve bank that has a vertical erosion scarp of less than 1 m in elevation. A medium to coarse sand, shelly beach slope fronts the bank.

Local considerations

There are no erosion protection structures located on the open coast section of the site. The northern estuary shoreline has a number of relatively short tipped rock seawalls. The southern estuary shoreline is protected by a series of timber groyne structures.

Beach nourishment has also occurred at the northern point of the southern shoreline, which has resulted in the shoreline building out in this location. A rock revetment structure is located on the southern estuary shoreline situated between the foot bridge and the boat ramp.

A boat ramp exists on both sides of the estuary shoreline, and vehicle access to the foreshore also exists at the eastern end of the southern estuary shoreline.

Site Photograph A (northern end of open coast shoreline)

Site Photograph B (northern side of estuary shoreline)

Site Photograph C (southern side of estuary shoreline)

Coastal Erosion Hazard Assessment

The site is split into nine cells based on differences in geomorphology, dune and bank height and shoreline movement trends.

Adopted component values are presented within Table 8-1. Short-term erosion values range from 10 to 25 m on the open coast to 2 to 6 m within

73

Coastal Erosion Hazard Zone Assessment for Selected Northland Sites T+T Ref. 1012360 Northland Regional Council October 2020

the estuary. Long-term rates range from variable (-0.15 to +0.2m/year) on the open coast, slight erosion on the northern estuary shoreline (-0.02 to -0.1 m/year) and variable on the southern estuary shoreline (-0.05 to +0.1m/year).

Histograms of individual components and resultant CEHZ distances using a Monte Carlo technique are shown in Figure 8-1 to Figure 8-9. Coastal Erosion Hazard Zone widths are presented within Table 8-2 to 8-4 and Figure 8-10.

CEHZ1 lines are typically 27 to 34 m on the open beach and 10 to 17 m within the estuary, although Cells F to H have been rounded to a minimum 10 m. CEHZ2 values are 57 to 67 m on

the open beach and rounded to 25 to 31 m within the estuary. CEHZ3 values are 69 to 77 m on the open coast and 25 to 36 m within the estuary. CEHZ’s have been mapped in agreement with the calculated values, although where CEHZs from the sea and estuary intersected at the southern tip of the Patau spit, the hazard zone was truncated.

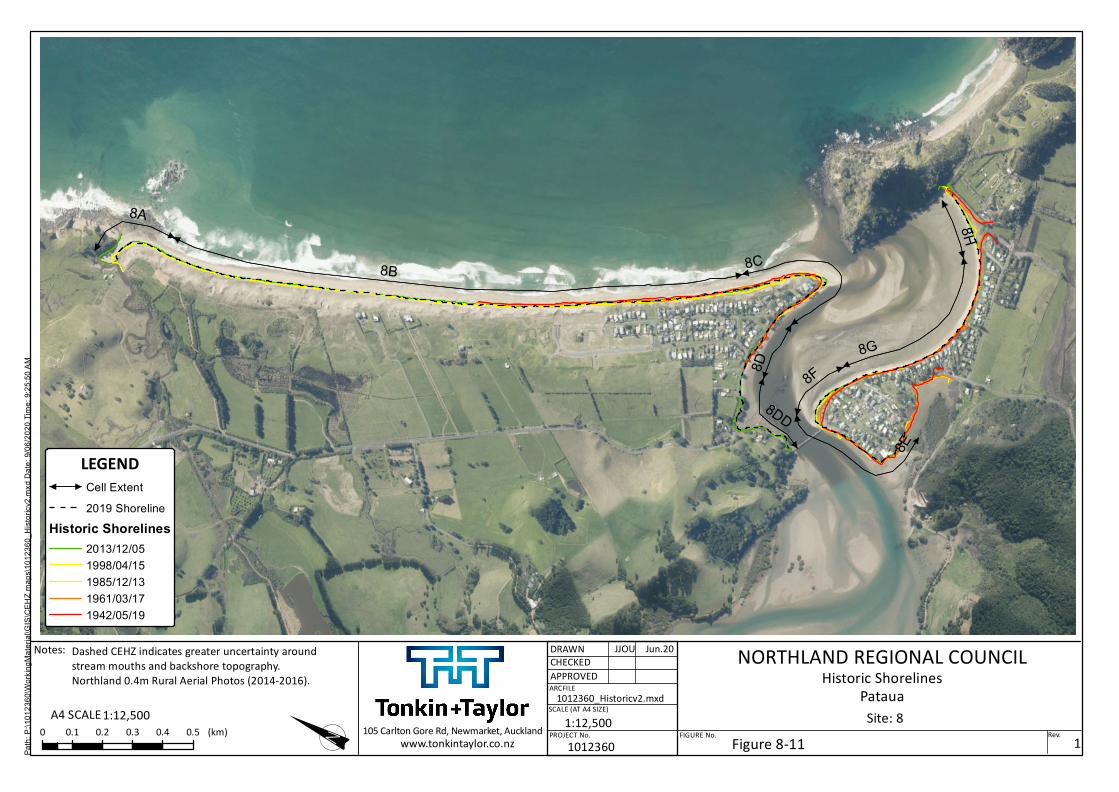
Note that cell 8A and 8B have experienced some minor accretion since about 1998 over approximately 700 m, with CEHZs offset from the accreted most recent shoreline.

Figure 8-11 shows the available historic shorelines for Pataua.

74

Coastal Erosion Hazard Zone Assessment for Selected Northland Sites T+T Ref. 1012360 Northland Regional Council October 2020

Table 8-1 Component values for Erosion Hazard Assessment

Site 8. Pataua

Cell 8A 8B 8C 8D 8DD 8E 8F 8G 8H

Cell centre (NZTM) E 1737351 1737351 1737989 1737613 1737613 1737440 1737606 1737927 1738284

N 6047838 6047838 6046744 6046777 6046777 6046363 6046609 6046354 6046430

Chainage, m (from N/W) 0-280 280-2080 2080-2550 2550-2780 2780-3050 3050-3400 3400-3870 3870-4780 4780-5000

Morphology Dune Dune Inlet Estuary Bank Soft Cliff Estuary Bank Estuary Bank Estuary Bank Estuary Bank

Short-term (m)

Min 10 10 10 2 0 2 2 2 2

Mode 15 15 15 4 0 4 4 4 4

Max 25 20 20 6 0 6 6 6 6

Dune/Cliff elevation (m above toe or scarp)

Min 5.5 6.8 4.9 3.3 2.1 0.8 1.5 1.7 1.3

Mode 6.7 10.2 7.6 5.0 2.6 1.5 1.8 2.3 1.6

Max 7.9 12.4 10.4 7.6 3.3 2.1 2.1 3.0 2.2

Stable angle (deg)

Min 30 30 30 30 26.6 30 30 30 32

Mode 32 32 32 32 30.2 32 32 32 32

Max 34 34 34 34 33.7 34 34 34 34

Long-term (m) -ve erosion +ve accretion

Min 0.2 0.1 0.1 -0.05 -0.05 -0.02 0.05 0.05 0.1

Mode 0.1 -0.05 -0.05 -0.075 -0.075 -0.06 0 0 0

Max -0.1 -0.15 -0.15 -0.1 -0.1 -0.1 -0.05 -0.05 -0.05

Closure slope (beaches)

Min 0.038 0.038 0.038 0.08 0.75 0.08 0.08 0.08 0.08

Mode 0.028 0.028 0.028 0.0715 0.5 0.0715 0.0715 0.0715 0.0715

Max 0.024 0.024 0.02 0.063 0.25 0.063 0.063 0.063 0.063

SLR 2080 (m)

RCP 2.6 0.16 0.16 0.16 0.16 0.16 0.16 0.16 0.16 0.16

RCP 4.5 0.21 0.21 0.21 0.21 0.21 0.21 0.21 0.21 0.21

RCP 8.5M 0.33 0.33 0.33 0.33 0.33 0.33 0.33 0.33 0.33

RCP 8.5H+ 0.51 0.51 0.51 0.51 0.51 0.51 0.51 0.51 0.51

SLR 2130 (m)

RCP 2.6 0.28 0.28 0.28 0.28 0.28 0.28 0.28 0.28 0.28

RCP 4.5 0.42 0.42 0.42 0.42 0.42 0.42 0.42 0.42 0.42

RCP 8.5M 0.85 0.85 0.85 0.85 0.85 0.85 0.85 0.85 0.85

RCP 8.5H+ 1.17 1.17 1.17 1.17 1.17 1.17 1.17 1.17 1.17

75

Coastal Erosion Hazard Zone Assessment for Selected Northland Sites T+T Ref. 1012360 Northland Regional Council October 2020

2020 2080 2130

Figure 8-1 Histograms of parameter samples and the resultant shoreline distances for 2020, 2080 and 2130 timeframes for cell 8A

2020 2080 2130

Figure 8-2 Histograms of parameter samples and the resultant shoreline distances for 2020, 2080 and 2130 timeframes for cell 8B

2020 2080 2130

Figure 8-3 Histograms of parameter samples and the resultant shoreline distances for 2020, 2080 and 2130 timeframes for cell 8C

76

Coastal Erosion Hazard Zone Assessment for Selected Northland Sites T+T Ref. 1012360 Northland Regional Council October 2020

2020 2080 2130

Figure 8-4 Histograms of parameter samples and the resultant shoreline distances for 2020, 2080 and 2130 timeframes for cell 8D

2020 2080 2130

Figure 8-5 Histograms of parameter samples and the resultant shoreline distances for 2020, 2080 and 2130 timeframes for cell 8DD

2020 2080 2130

Figure 8-6 Histograms of parameter samples and the resultant shoreline distances for 2020, 2080 and 2130 timeframes for cell 8E

77

Coastal Erosion Hazard Zone Assessment for Selected Northland Sites T+T Ref. 1012360 Northland Regional Council October 2020

2020 2080 2130

Figure 8-7 Histograms of parameter samples and the resultant shoreline distances for 2020, 2080 and 2130 timeframes for cell 8F

2020 2080 2130

Figure 8-8 Histograms of parameter samples and the resultant shoreline distances for 2020, 2080 and 2130 timeframes for cell 8G

2020 2080 2130

Figure 8-9 Histograms of parameter samples and the resultant shoreline distances for 2020, 2080 and 2130 timeframes for cell 8H

78

Coastal Erosion Hazard Zone Assessment for Selected Northland Sites T+T Ref. 1012360 Northland Regional Council October 2020

Table 8-2 Coastal Erosion Hazard Zone Widths for 2020

Site 8. Pataua

Pro

bab

ility

of

CEH

Z (m

) Ex

ceed

ance

A B C D DD E F G H

Min -15 -16 -14 -5 -3 -3 -3 -3 -3

99% -16 -18 -16 -6 -4 -3 -4 -4 -4

95% -17 -19 -17 -6 -4 -4 -4 -4 -4

90% -18 -20 -18 -7 -4 -4 -4 -5 -4

80% -19 -21 -19 -7 -4 -4 -5 -5 -5

70% -20 -22 -20 -8 -4 -5 -5 -5 -5

66% -20 -22 -20 -8 -4 -5 -5 -6 -5

60% -21 -22 -20 -8 -4 -5 -5 -6 -5

50% -22 -23 -21 -8 -5 -5 -5 -6 -5

40% -23 -23 -22 -9 -5 -5 -6 -6 -6

33% -23 -24 -22 -9 -5 -6 -6 -6 -6

30% -24 -24 -22 -9 -5 -6 -6 -6 -6

20% -25 -25 -23 -9 -5 -6 -6 -7 -6

10% -27 -26 -24 -10 -5 -6 -7 -7 -6

5% -28 -27 -25 -10 -5 -7 -7 -7 -7

1% -29 -28 -26 -11 -6 -7 -7 -8 -7

Max -31 -29 -28 -12 -6 -7 -8 -8 -8

79

Coastal Erosion Hazard Zone Assessment for Selected Northland Sites T+T Ref. 1012360 Northland Regional Council October 2020

Table 8-3 Coastal Erosion Hazard Zone Widths Projected for 2080

Site 8. Patua

Cell 8A 8B 8C 8D 8DD

RCP scenario 2.6 4.6 8.5 8.5+ 2.6 4.6 8.5 8.5+ 2.6 4.6 8.5 8.5+ 2.6 4.6 8.5 8.5+ 2.6 4.6 8.5 8.5+

Pro

bab

ility

of

CEH

Z (m

) Ex

ceed

ance

Min -9 -11 -14 -19 -17 -19 -22 -27 -16 -17 -21 -26 -11 -11 -13 -15 -8 -8 -8 -9

99% -13 -15 -19 -24 -21 -23 -27 -33 -20 -22 -25 -31 -12 -13 -15 -17 -8 -9 -10 -11

95% -16 -17 -21 -27 -24 -25 -29 -35 -22 -24 -28 -34 -13 -14 -15 -18 -9 -9 -10 -12

90% -17 -19 -23 -29 -25 -27 -31 -37 -24 -25 -29 -35 -13 -14 -16 -18 -9 -10 -11 -12

80% -19 -21 -25 -31 -27 -29 -33 -38 -26 -27 -31 -37 -14 -15 -16 -19 -10 -10 -12 -13

70% -21 -22 -26 -32 -28 -30 -34 -40 -27 -29 -33 -39 -14 -15 -17 -19 -10 -11 -12 -14

66% -21 -23 -27 -33 -29 -30 -34 -40 -27 -29 -33 -39 -15 -15 -17 -19 -10 -11 -12 -14

60% -22 -24 -28 -34 -29 -31 -35 -41 -28 -30 -34 -40 -15 -15 -17 -20 -10 -11 -12 -14

50% -23 -25 -29 -35 -30 -32 -36 -42 -29 -31 -35 -41 -15 -16 -17 -20 -10 -11 -13 -15

40% -25 -26 -30 -36 -31 -33 -37 -43 -30 -32 -36 -42 -15 -16 -18 -20 -11 -11 -13 -15

33% -26 -27 -31 -37 -32 -34 -38 -44 -31 -32 -37 -43 -16 -16 -18 -21 -11 -12 -14 -16

30% -26 -28 -32 -38 -32 -34 -38 -44 -31 -33 -37 -44 -16 -16 -18 -21 -11 -12 -14 -16

20% -28 -29 -33 -40 -34 -35 -39 -46 -32 -34 -38 -45 -16 -17 -19 -21 -11 -12 -14 -17

10% -30 -32 -36 -42 -35 -37 -41 -47 -34 -36 -40 -47 -17 -17 -19 -22 -12 -13 -15 -18

5% -32 -34 -38 -44 -36 -38 -42 -49 -35 -37 -42 -49 -17 -18 -20 -22 -12 -13 -16 -19

1% -35 -37 -41 -48 -39 -41 -45 -51 -37 -39 -44 -51 -18 -19 -20 -23 -13 -14 -17 -21

Max -40 -42 -46 -53 -42 -44 -49 -56 -41 -43 -48 -56 -19 -20 -22 -24 -14 -15 -19 -24

CEHZ1 -27 -34 -33 -17 -12

80

Coastal Erosion Hazard Zone Assessment for Selected Northland Sites T+T Ref. 1012360 Northland Regional Council October 2020

Site 8. Patua

Cell 8E 8F 8G 8H

RCP scenario 2.6 4.6 8.5 8.5+ 2.6 4.6 8.5 8.5+ 2.6 4.6 8.5 8.5+ 2.6 4.6 8.5 8.5+

Pro

bab

ility

of

CEH

Z (m

) Ex

ceed

ance

Min -7 -7 -9 -11 -3 -4 -5 -7 -4 -4 -6 -8 0 -1 -2 -5

99% -8 -9 -10 -13 -4 -5 -7 -9 -5 -5 -7 -10 -2 -3 -4 -7

95% -9 -10 -11 -14 -5 -6 -8 -10 -6 -6 -8 -10 -3 -4 -5 -8

90% -9 -10 -12 -14 -6 -6 -8 -11 -6 -7 -8 -11 -4 -5 -6 -9

80% -10 -11 -12 -15 -6 -7 -9 -11 -7 -7 -9 -12 -5 -5 -7 -10

70% -10 -11 -13 -15 -7 -8 -9 -12 -7 -8 -10 -12 -6 -6 -8 -10

66% -10 -11 -13 -15 -7 -8 -9 -12 -7 -8 -10 -12 -6 -7 -8 -11

60% -11 -11 -13 -16 -7 -8 -10 -12 -8 -8 -10 -13 -6 -7 -9 -11

50% -11 -12 -13 -16 -8 -8 -10 -13 -8 -9 -10 -13 -7 -8 -9 -12

40% -11 -12 -14 -16 -8 -9 -10 -13 -9 -9 -11 -13 -7 -8 -10 -12

33% -12 -12 -14 -17 -8 -9 -11 -13 -9 -9 -11 -14 -8 -8 -10 -13

30% -12 -12 -14 -17 -9 -9 -11 -13 -9 -10 -11 -14 -8 -9 -10 -13

20% -12 -13 -15 -17 -9 -10 -11 -14 -9 -10 -12 -14 -8 -9 -11 -13

10% -13 -13 -15 -18 -10 -10 -12 -15 -10 -11 -12 -15 -9 -10 -12 -14

5% -13 -14 -16 -18 -10 -11 -13 -15 -11 -11 -13 -16 -10 -10 -12 -15

1% -14 -15 -16 -19 -11 -12 -13 -16 -11 -12 -14 -16 -11 -11 -13 -16

Max -15 -16 -18 -20 -13 -13 -15 -18 -13 -13 -15 -18 -12 -13 -15 -18

CEHZ1 -13 -10 -10 -10

81

Coastal Erosion Hazard Zone Assessment for Selected Northland Sites T+T Ref. 1012360 Northland Regional Council October 2020

Table 8-4 Coastal Erosion Hazard Zone Widths Projected for 2130

Site 8. Patua

Cell 8A 8B 8C 8D 8DD

RCP scenario 2.6 4.6 8.5 8.5+ 2.6 4.6 8.5 8.5+ 2.6 4.6 8.5 8.5+ 2.6 4.6 8.5 8.5+ 2.6 4.6 8.5 8.5+

Pro

bab

ility

of

CEH

Z (m

) Ex

ceed

ance

Min -3 -7 -18 -26 -17 -21 -34 -42 -15 -19 -31 -40 -15 -17 -22 -27 -11 -12 -13 -14

99% -9 -13 -26 -36 -22 -26 -40 -49 -21 -25 -38 -48 -17 -19 -25 -29 -12 -13 -16 -17

95% -12 -17 -31 -41 -25 -30 -44 -54 -24 -29 -43 -53 -18 -20 -26 -30 -12 -14 -17 -19

90% -15 -19 -33 -43 -27 -32 -46 -56 -26 -31 -45 -56 -19 -20 -26 -31 -13 -15 -18 -20

80% -17 -22 -36 -47 -30 -35 -49 -60 -29 -34 -49 -59 -19 -21 -27 -32 -14 -15 -19 -22

70% -20 -24 -39 -49 -33 -37 -51 -62 -32 -36 -51 -62 -20 -22 -28 -32 -14 -16 -21 -23

66% -20 -25 -40 -50 -33 -38 -52 -63 -32 -37 -52 -63 -20 -22 -28 -32 -14 -16 -21 -24

60% -22 -26 -41 -52 -34 -39 -53 -64 -33 -38 -53 -64 -20 -22 -28 -33 -15 -17 -22 -24

50% -24 -28 -43 -54 -36 -41 -55 -66 -35 -40 -55 -66 -21 -23 -29 -33 -15 -17 -23 -26

40% -26 -31 -45 -56 -38 -42 -57 -68 -37 -42 -57 -68 -21 -23 -29 -33 -15 -18 -24 -27

33% -27 -32 -47 -58 -39 -44 -58 -69 -38 -43 -58 -70 -21 -23 -29 -34 -16 -18 -24 -28

30% -28 -33 -48 -58 -39 -44 -59 -70 -38 -43 -59 -71 -21 -23 -29 -34 -16 -18 -25 -28

20% -31 -36 -50 -61 -41 -46 -61 -72 -40 -45 -61 -73 -22 -24 -30 -35 -16 -19 -26 -30

10% -35 -39 -54 -65 -44 -49 -64 -75 -43 -48 -64 -77 -23 -25 -31 -35 -17 -20 -28 -33

5% -37 -42 -57 -69 -46 -51 -66 -77 -45 -50 -67 -80 -23 -25 -31 -36 -17 -21 -30 -35

1% -42 -47 -62 -74 -49 -54 -70 -82 -48 -53 -72 -86 -24 -26 -32 -37 -18 -22 -32 -39

Max -50 -56 -73 -85 -53 -58 -75 -88 -53 -60 -81 -96 -26 -28 -34 -39 -20 -24 -37 -45

CEHZ2 -57 -66 -67 -31 -30

CEHZ3 -69 -77 -80 -36 -35

82

Coastal Erosion Hazard Zone Assessment for Selected Northland Sites T+T Ref. 1012360 Northland Regional Council October 2020

Site 8. Patua

Cell 8E 8F 8G 8H

RCP scenario 2.6 4.6 8.5 8.5+ 2.6 4.6 8.5 8.5+ 2.6 4.6 8.5 8.5+ 2.6 4.6 8.5 8.5+

Pro

bab

ility

of

CEH

Z (m

) Ex

ceed

ance

Min -3 -7 -18 -26 -17 -21 -34 -42 -15 -19 -31 -40 -15 -17 -22 -27

99% -9 -13 -26 -36 -22 -26 -40 -49 -21 -25 -38 -48 -17 -19 -25 -29

95% -12 -17 -31 -41 -25 -30 -44 -54 -24 -29 -43 -53 -18 -20 -26 -30

90% -15 -19 -33 -43 -27 -32 -46 -56 -26 -31 -45 -56 -19 -20 -26 -31

80% -17 -22 -36 -47 -30 -35 -49 -60 -29 -34 -49 -59 -19 -21 -27 -32

70% -20 -24 -39 -49 -33 -37 -51 -62 -32 -36 -51 -62 -20 -22 -28 -32

66% -20 -25 -40 -50 -33 -38 -52 -63 -32 -37 -52 -63 -20 -22 -28 -32

60% -22 -26 -41 -52 -34 -39 -53 -64 -33 -38 -53 -64 -20 -22 -28 -33

50% -24 -28 -43 -54 -36 -41 -55 -66 -35 -40 -55 -66 -21 -23 -29 -33

40% -26 -31 -45 -56 -38 -42 -57 -68 -37 -42 -57 -68 -21 -23 -29 -33

33% -27 -32 -47 -58 -39 -44 -58 -69 -38 -43 -58 -70 -21 -23 -29 -34

30% -28 -33 -48 -58 -39 -44 -59 -70 -38 -43 -59 -71 -21 -23 -29 -34

20% -31 -36 -50 -61 -41 -46 -61 -72 -40 -45 -61 -73 -22 -24 -30 -35

10% -35 -39 -54 -65 -44 -49 -64 -75 -43 -48 -64 -77 -23 -25 -31 -35

5% -37 -42 -57 -69 -46 -51 -66 -77 -45 -50 -67 -80 -23 -25 -31 -36

1% -42 -47 -62 -74 -49 -54 -70 -82 -48 -53 -72 -86 -24 -26 -32 -37

Max -50 -56 -73 -85 -53 -58 -75 -88 -53 -60 -81 -96 -26 -28 -34 -39

CEHZ2 -27 -21 -22 -21

CEHZ3 -32 -26 -26 -25

8B

8G

8E

8A

8F

8C

8H

8D

8DD

LEGEND2019 ShorelineCell ExtentCEHZ1CEHZ2CEHZ3

Dashed CEHZ indicates greater uncertainty around stream mouths and backshore topography.Northland 0.4m Rural Aerial Photos (2014-2016).

Path:

P:\10

1236

0\Work

ingMa

terial

\GIS

\CEH

Z map

s\101

2360

_CEH

Z001

_v2.m

xd D

ate: 2

9/05/2

020 T

ime:

6:07:4

8 am

! 1Figure 8-10

NORTHLAND REGIONAL COUNCILCoastal Erosion Hazard Assessment

PatauaSite: 81:12,500

1012360

1012360_CEHZ001_v2.mxd

JJOU May.20

0 0.1 0.2 0.3 0.4 0.5 (km)A4 SCALE 1:12,500

Notes:

105 Carlton Gore Rd, Newmarket, Aucklandwww.tonkintaylor.co.nz Rev.

SCALE (AT A4 SIZE)

PROJECT No.

ARCFILE

DRAWNCHECKEDAPPROVED

FIGURE No.

8B

8G

8E

8A

8F

8C

8H

8D

8DD

LEGENDCell Extent2019 Shoreline

Historic Shorelines2013/12/051998/04/151985/12/131961/03/171942/05/19

Dashed CEHZ indicates greater uncertainty around stream mouths and backshore topography.Northland 0.4m Rural Aerial Photos (2014-2016).

Path:

P:\1

0123

60\W

orking

Mater

ial\G

IS\C

EHZ m

aps\1

0123

60_H

istori

cv2.m

xd D

ate: 9

/06/20

20 Ti

me: 9

:25:50

AM

! 1Figure 8-11

NORTHLAND REGIONAL COUNCILHistoric Shorelines

PatauaSite: 81:12,500

1012360

1012360_Historicv2.mxd

JJOU Jun.20

0 0.1 0.2 0.3 0.4 0.5 (km)A4 SCALE 1:12,500

Notes:

105 Carlton Gore Rd, Newmarket, Aucklandwww.tonkintaylor.co.nz Rev.

SCALE (AT A4 SIZE)

PROJECT No.

ARCFILE

DRAWNCHECKEDAPPROVED

FIGURE No.


Recommended