Use Of Databases For Research and Conservation of the Eastern Arc Mountains Authors: Burgess, N. D., Fjeldså, J., and Botterweg, R. Source: Journal of East African Natural History, 87(1) : 159-180 Published By: Nature Kenya/East African Natural History Society URL: https://doi.org/10.2982/0012- 8317(1998)87[159:UODFRA]2.0.CO;2 BioOne Complete (complete.BioOne.org) is a full-text database of 200 subscribed and open-access titles in the biological, ecological, and environmental sciences published by nonprofit societies, associations, museums, institutions, and presses. Your use of this PDF, the BioOne Complete website, and all posted and associated content indicates your acceptance of BioOne’s Terms of Use, available at www.bioone.org/terms-of-use. Usage of BioOne Complete content is strictly limited to personal, educational, and non - commercial use. Commercial inquiries or rights and permissions requests should be directed to the individual publisher as copyright holder. BioOne sees sustainable scholarly publishing as an inherently collaborative enterprise connecting authors, nonprofit publishers, academic institutions, research libraries, and research funders in the common goal of maximizing access to critical research. Downloaded From: https://bioone.org/journals/Journal-of-East-African-Natural-History on 25 May 2020 Terms of Use: https://bioone.org/terms-of-use
Transcript
Use Of Databases For Research and Conservation of theEastern Arc Mountains
Authors: Burgess, N. D., Fjeldså, J., and Botterweg, R.
Source: Journal of East African Natural History, 87(1) : 159-180
Published By: Nature Kenya/East African Natural History Society
BioOne Complete (complete.BioOne.org) is a full-text database of 200 subscribed and open-access titlesin the biological, ecological, and environmental sciences published by nonprofit societies, associations,museums, institutions, and presses.
Your use of this PDF, the BioOne Complete website, and all posted and associated content indicates youracceptance of BioOne’s Terms of Use, available at www.bioone.org/terms-of-use.
Usage of BioOne Complete content is strictly limited to personal, educational, and non - commercial use.Commercial inquiries or rights and permissions requests should be directed to the individual publisher ascopyright holder.
BioOne sees sustainable scholarly publishing as an inherently collaborative enterprise connecting authors, nonprofitpublishers, academic institutions, research libraries, and research funders in the common goal of maximizing access tocritical research.
Downloaded From: https://bioone.org/journals/Journal-of-East-African-Natural-History on 25 May 2020Terms of Use: https://bioone.org/terms-of-use
Journal of East African Natural History 87: 159-180 (1998)
USE OF DATABASES FOR RESEARCH AND CONSERVATIONOF THE EASTERN ARC MOUNTAINS
N.D. Burgess, J. FjeldsaDanish Centre for Tropical Biodiversity
R. BotterwegTanzanian Biodiversity Database, Department of Zoology
P.O. Box 3560, University of Dar es Salaam, Dar es Salaam, Tanzania
ABSTRACT
The establishment and use of computer databases to hold biological records iscommon in many countries. Such systems can accommodate a large volume ofdata with many potential uses, but many databases have failed due to poordesign or programming, or to the lack of a proper user-need analysis. In allbiological databases there are problems with the data being used. The mostcommon problems are uneven collection effort, taxonomic confusion leading tounreliable records, difficulties with finding exact collection localities,differences in map projections leading to inaccurate record positions and more.
Data in databases, either the raw biological records, or interpreted/modelledrange distributions, can be used for analyses of value to both conservationistsand to academic biogeographers. However, all such analyses are highlyinfluenced by the analytical scale, and results from one scale cannot be used atanother. This is a fundamental problem with analyses using computerised data,especially for conservation planning. Data at different scales can be used toillustrate areas of high species richness, or areas where species of narrowdistributional range congregate, although the results from one scale may not beapplicable at another.
Computer programs can be used to select areas so that all species in thedatabase are covered. The last method, using the principles ofcomplementarity, is the most efficient way to select 'ideal' conservation areas.With such an analysis the theoretical minimum number of areas required toconserve all the species within a given database (e.g. all the birds in SubSaharan Africa) can be chosen. However, all such analyses are only indicative,as they do not take into consideration population viability, threats to the areasselected, or other 'real-world' variables that are important when conservationplans are being formulated.
For academics the patterns of species richness and range-restriction (i.e.endemism) can be used in large-scale models that can develop and testhypotheses to explain why species are distributed as they are and howevolution/extinction may have operated over time in order to produce thepatterns observed. Such studies can have relevance to the development ofconservation plans at the broad scale.
Downloaded From: https://bioone.org/journals/Journal-of-East-African-Natural-History on 25 May 2020Terms of Use: https://bioone.org/terms-of-use
160
INTRODUCTION
N. Burgess, J. Fjeldsa & R. Botterweg
'Database' or 'Databank' are terms describing systems that hold information in an organisedand retrievable form. However, the terms have increasingly come to mean computerisedsystems that can rapidly extract, display, and analyse large volumes of data.
More powerful computers, at affordable prices, have resulted in many biologistsbecoming interested in computer databases which are able to a) store information on manysites in a country (or larger area) where certain vegetation types, habitats, or species arefound; b) update taxonomy for species and records as these change in the literature (which isvery hard with paper-based systems); and, c) undertake complex analyses that cannot be doneby hand. For example, biological data can be overlain with vegetation maps, climate maps,topographical maps, population maps, protected areas maps etc., and various types ofanalyses can be undertaken (for discussion see: Scott et ai., 1993; Stoms & Estes, 1993;Turpie & Crowe, 1994; Lombard, 1995; Tushabe et ai., in press; Reynolds et ai., in press).The increasing availability and types of satellite derived data (see Olivieri et ai., 1995 forreview) means that there is a ready supply of digital information, in vast quantities, onvarious physical and biological parameters of the earth, which can be used to compareagainst biological data sources (e.g. Erhlich & Lambin, 1996; Lambin & Erhlich, 1996;N0hr & J0rgensen, 1996; J0rgensen & N0hr, 1996; Fjeldsa et ai., 1997). With the additionof more and more data, and the better interfacing between computers, the possibilities forinteresting analyses increase every year.
The computerisation of biological and physical data has also allowed the 'true'distribution of species to be modelled using physical data which are readily available (e.g.climate and soil data), even if the species is rare and infrequently recorded (Walker, 1990;Stoms, 1992; Scott et ai., 1993; Margules & Austin, 1994; Margules & Redhead, 1996;Tushabe et ai., in press). Searches on the ground can confirm how accurate these predictionsare, allowing the model in the computer to be refined, or confidence limits to be placed onthe accuracy of the model.
The aim of this paper is to review the type of databases/databanks available for tropicalconservation planning and to assess their strengths and weaknesses. We will illustrate thefundamental importance of geographical scale to the design and use of databases, includingtwo existing systems that hold data on the Eastern Arc area of eastern Africa. We reviewfactors that cause problems with the data added to biodiversity databases, and look at howdata in these systems can be analysed to detect areas important for biodiversity. Therelevance of these systems to research and conservation in the Eastern Arc is stressed.
DATABASE SYSTEMS
A number of non-computerised database systems have existed for decades. Collectively thesesystems hold a lot of data, but typically the data cannot easily be retrieved or manipulated. Inrecent years there has been an explosion of computerised database systems. These have thesame general functions as the traditional databases, but can hold far more data, manipulate it,and undertake analyses that were previously impossible.
Downloaded From: https://bioone.org/journals/Journal-of-East-African-Natural-History on 25 May 2020Terms of Use: https://bioone.org/terms-of-use
Databases for research and conservation 161
Human mind
StrengthsPeople who have life-long experience of a biological group have great accumulatedknowledge on species distribution, habitat preferences etc. The minds of such people can tellif data are flawed in some way, or assess if a result is ecologically reasonable. Theirknowledge and skills are still essential for a computerised database program if it is toproduce meaningful results.
Weaknesses
The human mind makes mistakes, especially when it comes to remembering precise details.There are also limits to the types and quantity of data that can be stored. The human mind isthus a poor system to save large numbers of geographical co-ordinates etc. A furtherweakness is that people die and their accumulated information is then lost.
Museum collections
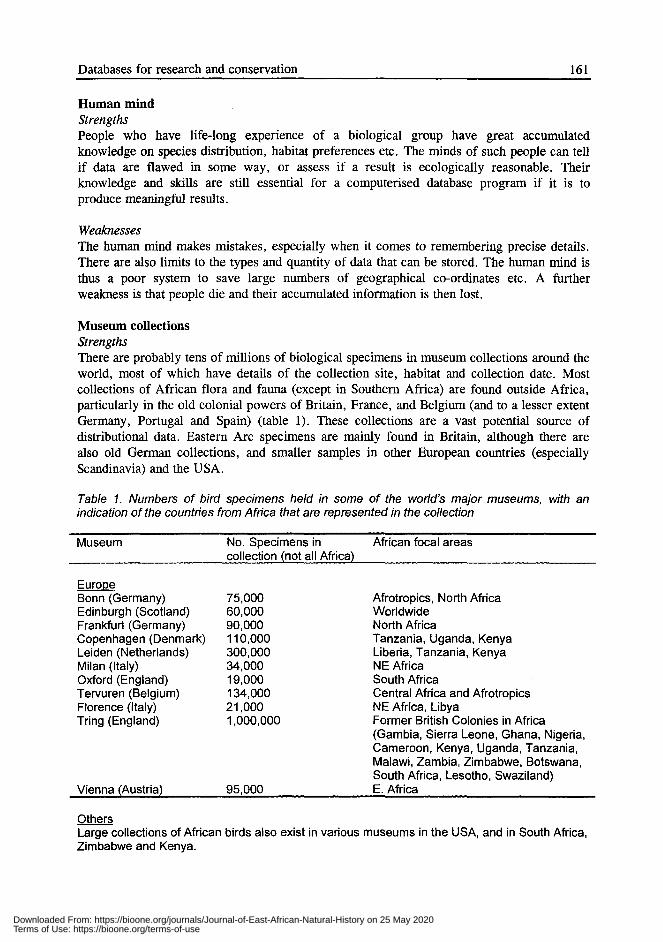
StrengthsThere are probably tens of millions of biological specimens in museum collections around theworld, most of which have details of the collection site, habitat and collection date. Mostcollections of African flora and fauna (except in Southern Africa) are found outside Africa,particularly in the old colonial powers of Britain, France, and Belgium (and to a lesser extentGermany, Portugal and Spain) (table 1). These collections are a vast potential source ofdistributional data. Eastern Arc specimens are mainly found in Britain, although there arealso old German collections, and smaller samples in other European countries (especiallyScandinavia) and the USA.
Table 1. Numbers of bird specimens held in some of the world's major museums, with anindication of the countries from Africa that are represented in the collection
Tanzania, Uganda, KenyaLiberia, Tanzania, KenyaNE AfricaSouth Africa
Central Africa and AfrotropicsNE Africa, LibyaFormer British Colonies in Africa
(Gambia, Sierra Leone, Ghana, Nigeria,Cameroon, Kenya, Uganda, Tanzania,Malawi, Zambia, Zimbabwe, Botswana,South Africa, Lesotho, Swaziland)E. Africa
Others
Large collections of African birds also exist in various museums in the USA, and in South Africa,Zimbabwe and Kenya.
Downloaded From: https://bioone.org/journals/Journal-of-East-African-Natural-History on 25 May 2020Terms of Use: https://bioone.org/terms-of-use
162 N. Burgess, J. Fjeldsa & R. Botterweg
Weaknesses
The data contained in museum collections are generally very difficult to access. Collectionsof European museums are largely or even totally non-computerised, largely because fundinglevels have been declining for many years and routine collection management (prevention ofinfestations by pests) is now the main activity carried out. Many European museums alsonow have data access policies that are designed to ensure that museum data are not obtainedfor free, and then used for profit (scientific or financial) by others. However, these policiescan also stifle beneficial collaborative endeavours with those more familiar with
computerisation procedures. Conversely, most museum collections in the USA arecomputerised, and the Government's open data-access policy means that data must be givento those requesting it. South African museum collections are also typically computerised, buthold little data of relevance to eastern Africa.
Some data and specimens from these overseas museums have been repatriated to easternAfrican countries. More is likely in the future, but the management of specimen collectionsin eastern Africa (particular in the hot and humid coastal areas) is difficult and expensive.The management of computerised data, on the other hand, represents a smaller problem andis considerably cheaper.
Paper-based systemsStrengthsPaper-based systems can hold information that is not standardised and thus cannot easily beentered into a computer. For example, a paper-based file on a particular species couldcontain lists of localities, references on the species, and distribution maps at different scales.Once organised they can provide a convenient way to hold these kinds of data, which may bethe basis of a programme of data computerisation, or the source of verification forcomputerised data.
Weaknesses
This form of data is very static. It cannot easily be manipulated, cannot be easily provided toother parties, and its use requires considerable additional work, particularly if they are to beput into a standardised computer database.
Point-locality computer databasesStrengthsThe main advantage of such systems is that they can hold precise locality details for a verylarge number of biological specimens. They also hold various other attributes of thespecimens: dates, season, weather, collector name, collection method, habitat etc. Whensufficient data are compiled then many different analyses are possible by using differentcombinations of datafields. Point locality data for different specimens can also be extractedand presented on maps using the many different GIS systems now commercially available.Computerised databases in Kenya and Tanzania hold a lot of data on the species of theEastern Are, but the coverage is far from complete, and a lot of further data are availableelsewhere in the world, but have not been entered on the systems in eastern Africa.
Weaknesses
The design and establishment of a functional point-locality database is much more complexthan initial discussions with computer scientists might suggest. Considerable investments oftime and money have been made around the world to establish biological database systems
Downloaded From: https://bioone.org/journals/Journal-of-East-African-Natural-History on 25 May 2020Terms of Use: https://bioone.org/terms-of-use
Databases for research and conservation 163
that have never worked. Common reasons for failure are: a) over-complication, b) poorprogramming, c) use of software which cannot transfer data to newer systems, d)unreasonable expectations of the possibilities of computers, e) lack of a clear purpose for thedatabase, f) lack of data-entry capacity (people), g) entering large volumes of poor qualitydata, h) insufficient data checking, and so loss of database credibility. In eastern Africa thepoint-locality biodiversity databases in Uganda, Kenya and Tanzania are functioning quitewell using the commercially available Microsoft ACCESS programme, a small number ofstaff, and normal PC computers (Reynolds et at., in press). Inputting new data into thesesystems and checking existing data are, however, extremely time consuming. Experts areneeded to ensure that data-typists do not enter large numbers of errors. There are noshortcuts here and unregulated entering of data will result in an unusable database.
Geographic information systems and related programmesGeographic Information Systems (GIS) are computerised tools designed to assemble andanalyse spatial data. These data can be on species, vegetation, human population, or anynumber of other mappable variables. There are two main types of systems, and somederivations or specialised applications of the main themes. Vector-based GIS systems holddata in the form of x-y co-ordinates, which make up polygons, and thus link closely to thedatabase systems described above. There are several commercially available systems,including the market-leader: Arc Info/Arc View. Raster-based GIS systems hold data assquares, with the number of squares needed to represent a mapped feature being dependenton the size the feature and the size of the squares used to map it. A commercially availablesystem of this type is IDRISI. The WORLDMAP software, developed by Paul Williams ofthe Natural History Museum in London, stores maps of species distributions on the basis ofpresence/absence records within grids, and is thus similar to a raster-based GIS.
StrengthsAll types of GIS systems (and WORLDMAP) can be linked to point-locality databases, andthus data from other sources can be imported and analysed. The grid structure of raster-basedGIS and WORLDMAP is advantageous when comparing with other grid-based data sources,for example satellite-derived weather, topographical, and image data. WORLDMAP softwareis specifically developed for fast interactive analyses of biodiversity data using sophisticatedanalytical procedures, but without the need for expensive computers and GIS training(Williams, 1995). It is thus within the reach of almost all biodiversity scientists with amodern computer. Vector-based GIS systems, however, offer the greatest flexibility to workat different scales and high degrees of complexity.
Weaknesses
Raster-based GIS systems and WORLDMAP have the general disadvantage of a pre-set datastructure (grid), although this is more serious in WORLDMAP where data cannot betransferred between grid sizes. It is also difficult to export WORLDMAP maps to othersoftware and thus the mapping and flexibility advantages of GIS systems cannot be realisedeasily. Vector-based GIS systems (especially Arc Info) are expensive in terms of machineryand training before they can be used, although such problems are declining as simplerprogrammes are produced. All these systems have a general problem with data-availabilityand quality, and a further problem is that poor quality data can easily be 'hidden' beneathsophisticated analysis and attractive graphical presentation.
Downloaded From: https://bioone.org/journals/Journal-of-East-African-Natural-History on 25 May 2020Terms of Use: https://bioone.org/terms-of-use
164 N. Burgess, J. Fje1dsa & R. Botterweg
The use of distributional modellingBiological data have not been gathered evenly from all parts of the world, and indeed thereare substantial biases towards some places opposed to others. Moreover, it is not possible toconduct extensive surveys of the vast unknown areas that exist, for example in the CentralAfrican swamp forests, or war zones. Thus some biodiversity studies have 'modelled'potential species distributions using available (incomplete) data. Modelling approaches aremost useful for species that, although poorly known, have a reasonable number of collectionsites and whose habitat preference is known.
AdvantagesModelling approaches may reduce collection biases in point-locality databases, and thus mayprovide species distribution patterns that are closer to the 'truth' (Scott et at., 1993;
Margules & Redhead, 1996;Tushabe et at., in press). Computer-based modelling can evengive a statistical confidence limit to the estimated occurrence of a species (Margules &Redhead, 1996). It is also repeatable and testable as the data are retained and the analysescan be re-run using the same, or another statistical routine. Modelling potential speciesranges can also be done using the accumulated expertise in the brains of world experts (heretermed 'mental modelling'), assisted by detailed habitat, climatic and topographic maps.
DisadvantagesComputer modelling requires adequate biological data points and the availability of physicaldata at the same level of resolution. In the Eastern Arc there would be problems to obtainadequate climate data from which to construct the models, although smoothed and computermodelled climatic maps, derived from satellite information, are available (e.g. CRES, 1995).Vegetation data are often available, but may date from the colonial period and thus do notreflect the current situation on the ground. Older biological data may also be a problem assuitable habitat, and thus the relevant species, may have disappeared. Mental modellingapproaches have been used in the construction of many range maps in textbooks, and canalso give an assessment of the likely distributions for species that have not previously beenmapped in this way. Regardless of what system is employed, there is no known way to modelthe distribution of a species known only from one locality, of which there are quite a numberwithin Africa, including in the Eastern Arc.
ISSUES RELATED TO COMPUTERISED DATABASES
The remainder of this paper will be devoted to those issues that are particularly important forthe establishment of computer databases, including the types of analytical procedures that aremost commonly undertaken with computerised data. Strengths and weaknesses are broughtout where possible, and links are made to the situation in the Eastern Arc.
The importance of scaleThe scale of an analysis, the data used, and the required results are all closely interlinked andhave a fundamental influence on decisions concerning computerised databases. In general,scale of design in a computerised database has similar divisions to that recognised incommunity and landscape ecology (e.g. Forman, 1995; Stoms & Estes, 1993; Whittaker,1977). Thus, databases can be constructed for analyses at the following levels of scale:global, continental (epsilon), regional (delta), landscape (gamma) and within-community
Downloaded From: https://bioone.org/journals/Journal-of-East-African-Natural-History on 25 May 2020Terms of Use: https://bioone.org/terms-of-use
Databases for research and conservation 165
(alpha). In this situation 'beta' diversity is not relevant, as it relates to environmentalgradients, and so can be analysed using an alpha level database. Also, the 'point' level is notrelevant, as this is the unit of data gathering for most types of databases.
In general, the larger the scale of the analytical area and the 'coarser' the analyticalfilters, the larger the scale at which data can be stored in the database. When looking attheoretical questions at the global scale (e.g. Levin, 1992; Williams & Gaston, 1997), a 5 oreven a 10 degree square grid might be adequate, but such a grid would not provide anyuseful information for conservation planning at the national scale (figure I). Conversely, fora continental scale analyses of biodiversity patterns and processes, the gathering and inputtingof all available data from the literature and museum collections as data-points would be sotime consuming that it would require several lifetimes to complete. Useful results can in thiscase be obtained from presence/absence gridded systems (Burgess et al., in press; Williamset al., in press; figure I). Some of the problems of using different scales on the results of aspecies-richness analyses have been presented elsewhere (Levin, 1992; Stoms, 1992).
Perhaps the most urgent challenge facing all distributional databases in the Afrotropicalregion (and elsewhere) is to either improve the quality of the distributional data, or make useof the available data by following some generally agreed rules (Frietag & van Jaarsveld,1995; Stoms & Estes, 1993). Precise distributional maps at a high resolution using recentlygathered point records from field studies covering the entire potential range of a specieswould solve most database problems, but these are generally not available for even the wellstudied groups like birds. Such data could only be created through a major programme ofintense survey work, but at a time when the amount of fieldwork is probably declining inmost parts of Africa, such an aim is unrealistic. However, even if such survey programmeswere completed data would still remain incomplete and it is thus extremely relevant to ask"how complete the data must be to change the qualitative results and inferences that aredrawn from them" (Kodric-Brown & Brown, 1993).
A partial solution to these dilemmas is to use detailed point records only for small-scale(alpha level) investigations, and rely on range maps or modelled distributions for gamma(landscape) or epsilon (regional) studies. Both approaches, however, rely on the advice ofexperts, who in the African context are declining in number, ageing and often living outsideAfrica. They are typically not being replaced by nationals from countries within Africa(unlike in South America and SE Asia), and even where they do exist these people are oftenseverely hampered by a lack of funds and have little access to reference literature needed todo their work.
Considerations at the global scaleAt the scale of the globe, analyses often aim to test general hypotheses or provide a generalindication of the distribution of biodiversity. Such analyses have often relied on extremelylarge grids (5 x 5 degree or 10 x 10 degree) as the analytical unit (e.g. Gaston & Williams,1993; Williams & Gaston, 1994), or whole countries (e.g. Mittermeier, 1988). However,such a scale of analysis tends to hide much of the variation in the data, and thus cannot beused for conservation planning.
Regional
Analyses at the regional scale can provide both a regional overview of biodiversity, and alsoallow theoretical questions on the reasons behind this distribution to be addressed. WithinAfrica there are two biogeographical regions (Palaearctic and Afrotropical-or three if theCape Region is also recognised), and various offshore islands (e.g. Socotra, Sao Tome,
Downloaded From: https://bioone.org/journals/Journal-of-East-African-Natural-History on 25 May 2020Terms of Use: https://bioone.org/terms-of-use
166 N. Burgess, J. Fjeldsa & R. Botterweg
.. ,\ .~..
tLr~~\
·~W'···.... .
. ... . '/,., . :' . ~ .
A
C
B
Figure 1. Biodiversity results at the different scales of analyses: A) Global scale distributionaldata-WORLOMAP analysis of bumblebee distribution; B) Regional scale distributional dataWORLOMAP analysis of Afrotropical amphibians: C) Landscape/country scale distributionaldata-WORLOMAP analysis of eastern African forest birds, and 0) Point locality scale ofdistribution data-records of Afrixalus uluguruensis-in eastern African forests. Black dots arerecords and open dots are interpreted range.
Downloaded From: https://bioone.org/journals/Journal-of-East-African-Natural-History on 25 May 2020Terms of Use: https://bioone.org/terms-of-use
Databases for research and conservation 167
Principe etc.) which have their own unique biodiversity. It is thus important to decide thelimits of the study area before data compilation begins, and selecting one region (e.g. theAfrotropics) might be reasonable (e.g. Burgess et aI., 1997).
Because a region like the Afrotropics is so large the data compilation exercise and thetype of database used needs to be considered. It is important to ascertain whether most dataare in the form of range maps, point locality maps, a mixture of types, or in the form ofalready computerised specimen data. For this region (apart from South Africa), the availablesources of biological data are varied, and are often old. Computerised specimen databases arefew and not easily accessible. Some species are still known only from one locality, often asthe holotype specimen. The scale of the analytical region, and the types of data available thussuggest the use of a relatively simple database, which does not rely on specimen localitiesalone, and which accommodates the data in quite large units. Raster-based GIS or theWORLDMAP software could be suitable for such a study (see Burgess et aI., 1997; in press)(figure 1; table 2).
Table 2. Factors believed to affect species richness at each ecological scale and of relevance todatabase design and operation
An example of a database that has been constructed to work at this scale, is the AfricanVertebrates database of the Danish Centre for Tropical Biodiversity, the Percy FitzPatrickInstitute in Cape Town, and the Natural History Museum and York University in Britain.The primary aim of this project is to present and understand the reasons behind thedistribution of species in the Afrotropical Region. Species distribution maps use a 1 x 1degree grid as the mapping unit. A one-degree square may not be ideal, but using a finerscale would give a false impression of accuracy given the generalised nature of muchavailable distributional data, and a coarser scale would loose the ability to assess variation inthe distribution patterns.
The data gathering process started by creating a species list for the taxa to be mapped.This required consultation with standard taxonomical lists (e.g. see Burgess et aI. (thisvolume) for references), which were updated to include newly described species.Distributional data for the species are then gathered from various sources to make the mapsand these data are input into WORLDMAP, which is specially developed for rapidinteractive analysis of biodiversity data (Williams, 1995). For specimen data considerablechecking of localities was required and standard national gazetteers were extensively used.Experts were also consulted extensively. Supporting material on how the species maps weremade is stored in paper-based filing systems and also in a computer spreadsheet format.There are problems with this approach as there are with all others, but it allowed results tobe produced within the time-scale of a single funding proposal (three years).
Downloaded From: https://bioone.org/journals/Journal-of-East-African-Natural-History on 25 May 2020Terms of Use: https://bioone.org/terms-of-use
168 N. Burgess, J. Fjeldsa & R. Botterweg
Some of the main problems are outlined below. Firstly, species data are often patchy and,for many species, sparse. Extrapolations therefore have to be made, most notably to try andproduce reasonable distributional maps for Afrotropical species that are known from only afew locality records. It also has to be accepted that only the vertebrates (and probably not allthe reptiles, small mammals and amphibians), butterflies and some plant groups have beenstudied in sufficient detail to allow them to be mapped with any confidence. The majority ofthe invertebrates (the majority of biodiversity) are so poorly known that they cannot bemapped at all.
Secondly a decision had to be made on whether to map species distributions as they usedto be, or as they are now after man has altered habitats and reduced species ranges. The bestexample of this is black rhinoceros Diceros bicomis, which used to be widely distributed butis now extremely rare and found in a few well-protected sites. In our database such speciesare mapped according to their distribution around the 1939-1945 war and hence ranges aretoo generous for a number of species, especially the larger mammals. Decisions also have tobe made over the best ways of mapping species that are rare and only known from a fewlocalities; for example if a dense forest specialist species may be known from 25 specimenscollected over 100 years from a large area in the Congolian forest-should the species beassumed to occur throughout the area, or should only the confirmed records be used inanalysis and the distribution regarded as patchy or disjunct? Moreover, in the case oftaxonomically unstable species, decisions have to be made on where to split, or where tolump, or in the worst cases where to omit data from whole genera as unusable. These andother decisions have had to be made, at a species-by-species (or genus by genus) level for thec. 4000 species contained in this database. Expert taxonomists, documentation, and somerules are essential in this work, if it is to be defended scientifically.
LandscapeThe Landscape scale includes those analyses within a single country, which is generally thescale at which national biodiversity databases are constructed. Individual countries will needto know how many species they have, which ones are endemic, what their populations andhabitat preferences are, and where they are found. This is particularly important for politicalaspects of conservation, such as the implementation of the Convention on BiologicalDiversity. At this scale, and for these types of analyses, species record (point) localitydatabases are to be preferred over range maps and other estimation methods (Frietag & vanJaarsveld, 1995; Frietag et ai., 1996), although modelling of distributions (e.g. Tushabe etai., in press) may also be important where locality records are sparse. However, one of thecriticisms of range maps-that they tend to reflect historical rather than current distributionalranges-is also true of point data, as these are compiled from many years of exploration, andthese areas may now be a large town, or the species may have been lost due to the activitiesof man (e.g. Happold, 1995). A further problem with points is that they are biased towardswell-collected sites, such as biological field stations and along roads and rivers. Modellingspecies records against habitat and other attributes may assist in the creation of more accuratedistributional data at the landscape scale (e.g. Margules & Austin, 1994). However, therewill still be problems where the models are based on either old localities, or old vegetationmaps, as the predictions will include areas where the species habitat is no longer found. Afurther problem is that data for groups other than vertebrates and butterflies (i.e. almost allinvertebrates and most plants) are not comprehensive enough to allow them to be modelled.
In Tanzania, a database system has been designed to work principally at the national orlandscape scale, holding point locality records. It aims to hold detailed and precise locality
Downloaded From: https://bioone.org/journals/Journal-of-East-African-Natural-History on 25 May 2020Terms of Use: https://bioone.org/terms-of-use
Databases for research and conservation 169
records for all species in Tanzania, especially those which are endemic to the country, orglobally threatened by extinction. The purpose is to use these data for conservation planning,decision-making, and to prevent developments being undertaken in places where there is avaluable component of species. The database is situated at the Zoology Department of theUniversity of Dar es Salaam and holds mainly zoological data, although a similar databasehas also been started in the Botany Department to contain plant records. The first task ofdatabase development was to select hardware and software, and then start to enter data. Dataare entered using the commercially available Microsoft Access database system, which isrobust and simple to use. The database is linked to the commercially available MapInfo andIORISI mapping software, which allows the data held to be displayed and maps producedtogether with lists of the most important species and where they are found. Some analysescan also be undertaken.
The structure of this database (figure 2) shows the general arrangement of the data andthe links to other software programs. The data in the databases are held according to astandard list of the species in Tanzania, checked through the standard scientific literaturementioned above. Data are then compiled for these species, especially those of the greatestconservation interest. Data have been obtained from studies completed at the University ofDar es Salaam, and from collaborating scientists working in Tanzania, and from the olderdata already held in foreign museums.
LOCALITY TABLE
FIELDNAMELONGITUDE DEGREES EAST (DECIMALS)LATITUDE DEGREES SOUTH (DECIMALS)
SPECIMEN TABLE 1
FIELDNAME
LONGITUDE DEGREES EAST (DRCrl'lALS) I------~I----LATITUDE DEGREES SOUTH (DECIMALS)
---------------~
IORISI GRIDMAP
GRID TABLE I I
FIELONAKE
QUADRAT ID NO. I >
AIlSENCE/PRESENCE -'
Figure 2. Data structure of the Tanzanian Biodiversity Database (University of Oar es Salaam)
Within habitat (Alpha)For the Eastern Arc Mountains, the within-habitat (alpha) and the associated 'between similarhabitat' (beta) scales are most often used for analytical purposes (e.g. Burgess et al., thisvolume; Cordeiro, this volume; Fjeldsa & Rabol, 1995). At this scale point locality data areused, with no extrapolations. Such data are best held in point locality databases, and onceentered they can be exported and mapped for the whole of the Eastern Arc (figure 1).
Gathering data for these analyses typically involves both new fieldwork and the criticalappraisal of older studies. New work is very important as, for example in the Eastern Are,there are still forested areas that have never been explored. At this scale it is often possible touse distributional data from biological groups that are poorly known at the level of the whole
Downloaded From: https://bioone.org/journals/Journal-of-East-African-Natural-History on 25 May 2020Terms of Use: https://bioone.org/terms-of-use
170 N. Burgess, J. Fjeldsa & R. Botterweg
country, but where there have been detailed studies more locally (e.g. the spiders andmillipedes of the Eastern Arc are reasonably known and this data can be compiled-seeBurgess et ai., this volume). It is at this scale that detailed management decisions are made.Conservation projects in the Eastern Arc are eager to obtain relevant biodiversity data, andincreasingly they support field data collection using standardised methods (see Johansson etai., this volume) to provide the data they require for management planning purposes.
Data gathering for management purposes is well advanced in the East UsambaraMountains (Johansson et ai., this volume) and will start during 1999 in parts of theUdzungwa Mountains. In the future it is hoped to complete such programmes for eachEastern Arc forest, as has been achieved for all the Ugandan forest reserves. Data collectedin the East Usambaras are stored within a module of the Tanzania Biodiversity Database atthe University of Dar es Salaam, but specialised data-entry forms have been designed for usein the field, which are then linked to the fields on the data-entry screen in the computer andthus to the Access database (figure 2).
The importance of data-qualityThe quality of the data in a database is extremely important when it comes to presentingresults and drawing conclusions. The old proverb of 'rubbish in and rubbish out' is highlyrelevant to computerised databases, especially because the use of graphical and statisticalprograms can to a large extent hide the fact that the underlying data are bad. In databasesystems there are a number of potentially serious data problems. These are outlined belowwith examples from the Eastern Arc Mountains.
Survey effortThis may be the most serious problem of all in biological databases. Biological field stationsillustrate the problem quite clearly; they are places where specialist researchers visit andwhile they are there they discover new species. These may remain known from only this siteif further fieldwork is not carried out, making the field station seem very important in termsof species richness and the number of narrowly distributed endemics. Such areas can bedescribed as 'over-collected' in comparison to the average. The opposite-gross 'undercollection' with regard to the average-is also found in Africa. Reasons for relative undercollection are that some areas are so remote (e.g. centre of the Congo Basin forests; withinthe extensive Miombo woodlands and deserts) or so dangerous (e.g. areas with prolongedwars such as Mozambique and Angola) that there have been few investigations of their floraand fauna. These areas will always score poorly for richness and generally also forendemism. Smoothing the effects of survey coverage is becoming an important scientificdiscussion (e.g. Tushabe et ai., in press). Even in the relatively well-collected South Africa,there are still serious problems of variations in survey effort (e.g. Lombard et ai., 1995).
In the Eastern Arc, the East and West Usambaras have been sampled more than otherareas because of the Mazumbai Field Station in the West Usambaras, and the AmaniResearch Station in the East Usambaras. The lack of a similar station further south inTanzania is perhaps the major reason that detailed exploration of the Udzungwa Range didnot start until the later 1970s (Rodgers & Homewood, 1982). The lower coverage of theUdzungwas and other smaller ranges (e.g. Ukaguru and Nguru) influences the results ofanalyses using data held in biological databases. Moreover, local effects, such as the ease ofaccess to Morningside and Bagilo in the Uluguru Mountains, as opposed to an area near amunitions factory on the same mountain, results in clusters of records from the same fewsites.
Downloaded From: https://bioone.org/journals/Journal-of-East-African-Natural-History on 25 May 2020Terms of Use: https://bioone.org/terms-of-use
Databases for research and conservation 171
Localities
The exact position of a particular locality is extremely important in a point locality database.It may seem like a simple matter to locate the place where a collection was made and thenadd the co-ordinates to the computer system in use. However, this is not always the case.Firstly, for old specimens, some localities were written as the port of shipping, which inTanzania was often Zanzibar, Lindi, or Tanga. These specimens may have come from theinterior. More recent collections are often located to a village near a forest, because (beforeGPS systems) there was no possibility to know precisely where you were in a dense forest orextensive savannah woodland. This may mean that specimens are mapped outside the habitatfrom where they actually came. A further problem is that many villages in Africa (especiallyin Tanzania under the Ujamaa programme) have moved, been re-established in a differentlocation, or changed their name. This makes the use of modem maps to locate the position ofold specimens difficult, and makes the precision of some records in point-locality databasesspurious.
An example of a locality problem in the Eastern Arc is the use of the name Bagilo as thelocality for numerous specimens from the northern Uluguru Mountains. This locality is avillage outside the forest, but the specimens given this collection name were almost certainlycollected inside the forest. Similar problems are found with the localities' Amani' in the EastUsambaras and 'Mazumbai' in the West Usambaras, which are the sites of biological stationsand specimens bearing this name will have often come from nearby forests. Uncritical use ofthese data will tend to locate the areas of highest biological importance in odd places (towns,villages and field stations).
Taxonomists
The taxonomy of all organisms in the world is still unstable, and different taxonomists oftendisagree about the way that a particular group should be organised. As taxonomic units(normally species) are the basis of a biological database, constant changing of names andredefinition of species makes database design and maintenance very difficult. The level ofactivity and 'style' of a particular taxonomist can also be a problem. For example, if therehas been one taxonomist working for 30 years on the amphibians of one country there willprobably be a lot of species recorded, probably including a number of endemics described bythat taxonomist. If the adjacent country (which may have similar habitats) has never had sucha person, then the number of species known will be fewer and the number of endemics willprobably be less. These differences may not be real, but cannot be estimated from theavailable data. This can cause some areas to have inflated species-richness and speciesendemism figures. Alternatively there could be two taxonomists in adjacent countries and onewas a 'splitter' who recognised many species on small morphological differences, and theother a 'lumper' who did not. Data for these two countries would be difficult to compare,even if the effort they had expended was similar.
The birds of the Eastern Arc Mountains have been studied by several taxonomists over along period of time. However, there have been long-standing disagreements on whetherforms of birds on some of the mountains should be regarded as full species, or sub-species.Recent analysis of the DNA of these birds (e.g. Roy et ai., 1997) tends to support the subspecies being regarded as full species, but the controversy is likely to continue making it verydifficult to organise Eastern Arc bird records in a database that will satisfy all people.
As another example, the presence of West African plant species in the Eastern Arc is notdisputed (see Lovett, this volume), but there are some complications in that much of thetaxonomy of the Congo Basin has been undertaken by French and Belgian botanists and most
Downloaded From: https://bioone.org/journals/Journal-of-East-African-Natural-History on 25 May 2020Terms of Use: https://bioone.org/terms-of-use
172 N. Burgess, J. Fjeldsa & R. Botterweg
of Tanzanian plant taxonomy has been done by German and British botanists. Some plantspecies currently regarded as endemic to the Eastern Arc could actually be the same asspecies which are already described, but the relevant specimens have not been compared indifferent herbaria.
MapsMost distribution maps are created according to the latitude longitude system, using a varietyof projections to take account of the curvature of the earth. In such maps a single equallysized square on the map will cover a different land area on the ground. The grids are largestclose to the equator and become smaller towards the poles, for example at the equator a 1 x 1degree square will have a land area of 12,308 km2, while at the southern part of SouthAfrica, a 1 x 1 degree grid will cover 10,188 km2• Such variations can affect the results ofanalyses as the larger grid close to the equator could hold more species simply due to thespecies-area relationship (e.g. Rosenzweig, 1995).
These problems are not confined to grid area, as projection problems can also cause themisplacement of different features on a map. For example, it is quite common to see maps ofAfrica where mapped boundaries of a forest reserve are not coincident with the boundaries ofthe forest (e.g. 1997 Tanzanian Land Cover maps). This is not because they do not agree onthe ground, but because there have been problems with overlaying mapped data fromdifferent projections. Even if GPS co-ordinates are used, the same problems can occurbecause the GPS data are related to different 'datum points' and these can vary from thoseused to construct available paper or GIS maps of an area. Such problems can easily lead tobiodiversity data from one system being mapping in the wrong place by another system.
Errors
There are errors inherent in many aspects of biological science. In biological databases, coordinates can be written .down incorrectly, specimens can be incorrectly identified, andnames can be transcribed wrongly. If data for biodiversity databases are taken from museumcollections the rates of error are probably higher than in the published literature, and anidentification error rate of 5 % for smaller mammal species, for example, is regarded asquite good. Adding these data to computerised databases might tend to lend an aspect ofprecision to data, which actually contain a fair number of errors. Such problems areincreasingly serious in difficult to identify groups where the taxonomy is confused.
ANALYSES OF DATA IN BIODIVERSITY DATABASES
As outlined earlier the aims of a database, related to the scale of the area being covered, arelinked to the types of analyses that can be undertaken. Despite these issues there are anumber of commonly applied analyses of biodiversity data, most of which have beendeveloped over the past 10 years. Many of these analytical methods are under constantdevelopment and there is considerable scientific debate on the merits and disadvantages of thevarious analytical approaches and what they can be used for (e.g. Pressey & Nicholls, 1989;Vane-Wright et ai., 1991; Pressey et ai., 1993; van Jaarsveld, 1995).
Species richnessThis is a simple measure of the number of species found in a certain area. Analyses arenormally undertaken within a gridded system and thus species richness relates to the number
Downloaded From: https://bioone.org/journals/Journal-of-East-African-Natural-History on 25 May 2020Terms of Use: https://bioone.org/terms-of-use
Databases for research and conservation 173
of species found in that particular square (figure 3). This number is related to the grid size.For example in a 1 x 1 degree square database each grid might be expected to contain morespecies than in a 15' x 15' square database. However, this relationship is not linear, somegrid squares may cover only one habitat and thus the difference in species number betweenthe 1 x 1 degree and 15' x 15' grids will be less than in squares which cover a widealtitudinal range or other forms of habitat heterogeneity.
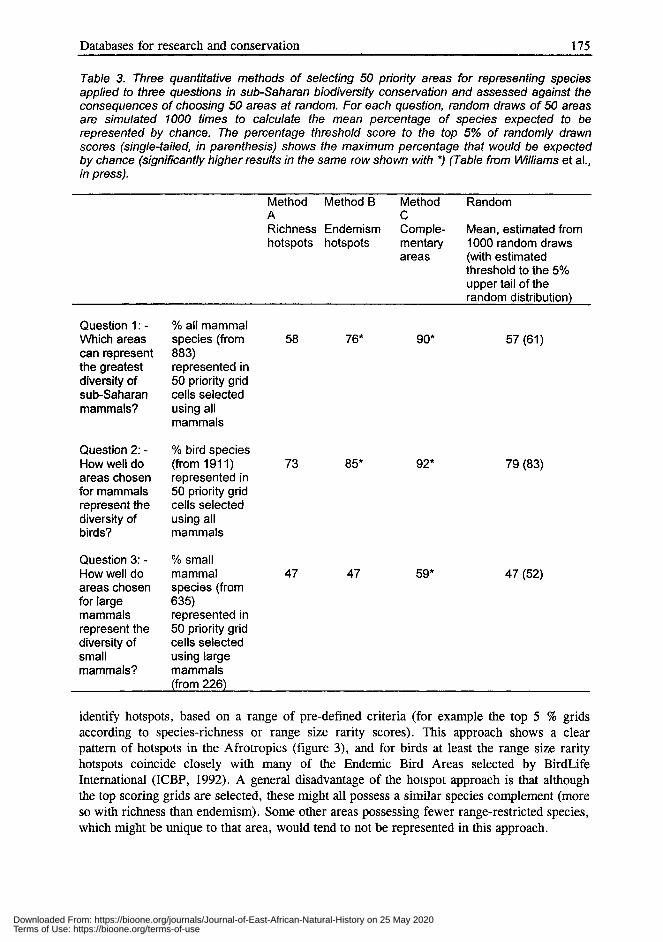
The main strength of species richness information is that it is simple to calculate and tounderstand. It can show areas where there are a lot of species and those where there are few,but provides very little information on how important the species recorded are. Speciesrichness scores have been used to generate lists of priorities for conservation. A generaldisadvantage of using species richness for conservation planning is that it will tend to selectecotones, areas with high heterogeneity, and thus not the most unique places (see Fjeldsa &Lovett, 1997a). Moreover, tests of the efficiency of species richness versus other methodsfor selecting a set of areas to represent all species in a particular database, show that speciesrichness is poor for this purpose, often no better than selecting areas at random (Williams etaI., in press) (table 3).
Range size rarityThis is a measure of the rarity of a particular species within the database. The main purposeof all such methods is to highlight areas that possess a high number of species with a smalldistribution and thus target conservation action to the prevention of species extinction.Williams et aI. (in press) have shown that range size rarity is better at representing all themammal species in a Afrotropical database than species richness (table 3), and that it isconsiderably better than selecting grids randomly. This is an important indication thatconservation priorities selected using rarity are more efficient than those selected usingrichness.
There are many ways to calculate rarity values, using cut off approaches (e.g. selectingspecies with ranges of smaller than 50,000 sq. km, selecting species found in less than 10grid squares etc.), or with more continuous approaches (e.g. of calculating the inverse rangesizes for all species in a database and then adding together the inverse range size scores forall species in a particular grid to get a score for that grid (Figure 3». The cut-off approacheshave the advantage of being simple to implement but lack flexibility and cannot easily deal withspecies that fall marginally outside the pre-selected range. The continuous approach, using inverserange scores added up within grids, is also quite easy to understand in that grids with many specieswith small ranges will have higher scores than grids with many species with large ranges.However, there is a problem in that the range restrictedness scores are partially related to speciesrichness, because values for grids with large number of species with small scores (large range)can be the same as scores for grids with one species with a large score (small range).Calculating the mean endemism scores for grids can help solve this problem. A disadvantage isthat range size rarity approaches will tend to locate areas where the habitat patches are smalland the species they contain can only possibly have small ranges.
HotspotsThe hotspots approach was originally devised to select areas of the world that possessed 5 %
of the worlds species of plants within a reasonably constrained geographical area (Myers,1988; 1990). The term has subsequently been used in a variety of ways to describe areas withhigh biodiversity values (either species richness or endemism), and has a generallyunderstood but not very precise meaning. Data in biodiversity databases can be used to
Downloaded From: https://bioone.org/journals/Journal-of-East-African-Natural-History on 25 May 2020Terms of Use: https://bioone.org/terms-of-use
174 N. Burgess, J. Fjeldsa & R. Botterweg
A B
c o
Figure 3. Analytical procedures to select priority areas. a) species richness-WORLDMAPanalysis of species richness of forest mammals in eastern Africa; b) range size rarity(=endemism)-WORLDMAP analysis of forest mammals in eastern Africa; c) part of hotspots-WORLDMAP analysis of endemism hotspots for forest mammals in the AfrotropicalRegion (top 100 grids; 9.5%); d) complementarity-WORLDMAP analysis of minimum set ofareas (identified using the Greedy Area complementarity algorithm) to represent forestmammals in the Afrotropical Region at least once. Numbers indicate ranked importance, withlow numbers having higher rank. Analysis shows only eastern Africa.
Downloaded From: https://bioone.org/journals/Journal-of-East-African-Natural-History on 25 May 2020Terms of Use: https://bioone.org/terms-of-use
Databases for research and conservation 175
Table 3. Three quantitative methods of selecting 50 priority areas for representing speciesapplied to three questions in sub-Saharan biodiversity conservation and assessed against theconsequences of choosing 50 areas at random. For each question, random draws of 50 areasare simulated 1000 times to calculate the mean percentage of species expected to berepresented by chance. The percentage threshold score to the top 5% of randomly drawnscores (single-tailed, in parenthesis) shows the maximum percentage that would be expectedby chance (significantly higher results in the same row shown with *) (Table from Williams et aI.,in press).
Question 1: Which areas
can representthe greatestdiversity ofsub-Saharanmammals?
% all mammal
species (from883)represented in50 priority gridcells selected
using allmammals
Method Method BMethodRandomA
CRichness Endemism
Comple-Mean, estimated fromhotspots
hotspotsmentary1000 random drawsareas
(with estimatedthreshold to the 5%upper tail of therandom distribution)
species (from635)represented in50 priority gridcells selected
using largemammals
(from 226)
73
47
85*
47
92*
59*
79 (83)
47 (52)
identify hotspots, based on a range of pre-defined criteria (for example the top 5 % gridsaccording to species-richness or range size rarity scores). This approach shows a clearpattern of hotspots in the Afrotropics (figure 3), and for birds at least the range size rarityhotspots coincide closely with many of the Endemic Bird Areas selected by BirdLifeInternational (ICBP, 1992). A general disadvantage of the hotspot approach is that althoughthe top scoring grids are selected, these might all possess a similar species complement (moreso with richness than endemism). Some other areas possessing fewer range-restricted species,which might be unique to that area, would tend to not be represented in this approach.
Downloaded From: https://bioone.org/journals/Journal-of-East-African-Natural-History on 25 May 2020Terms of Use: https://bioone.org/terms-of-use
176 N. Burgess, J. Fjeldsa & R. Botterweg
The hotspots approach (e.g. figure 3) brings out the importance of the Eastern ArcMountains for all groups so far analysed (birds, mammals, snakes, amphibians and plants). Itis suspected that the hotspot methodology would also result in the Eastern Arc being selectedfor most other groups as well, especially invertebrates (see Burgess et al., this volume).
ComplementarityComplementarity works by first choosing the area that contains the most species in adatabase, and secondly an area which adds the largest number of species not already selectedin the first area, and so on until all the species are covered. The computer can be told torepresent each species once, twice or more times in the set of areas chosen, or to rank theareas in terms of their species richness or range size rarity scores. Such an analysis selects amore scattered selection of grids (figure 3), but these grids include all the species, which isnot the case when areas are selected using either species richness or range-size rarity(Williams et al., in press; table 3). Various algorithms have been proposed to docomplementarity analyses, and there has been a considerable debate in the literature on whichare the most efficient (i.e. take the smallest area of land (or numbers of grids) to achieve apre-defined objective) (see Williams et al., 1996 and Williams et aI, in press for discussion).
Complementarity is important because it selects priority areas by looking at the fullspecies and distributional content of the database, with the aim of achieving the objective setby the investigator. There are at least two problems though. One problem is that placeswhere a species of animal or plant has been described and never found again areautomatically selected. Some of these species may be scientifically dubious and perhapsshould be omitted from a database before this type of analysis is run. A further (andpotentially more serious) problem is that a grid with two or more narrowly overlappingspecies will be selected as the more efficient solution to selecting a 'minimum set' of areas,when in fact it might be biologically better to choose areas within the core ranges of bothspecies (Larsen, 1997). Some of the areas selected by the complementarity approach maytherefore represent ecotones and border areas that fulfil the computational objective, but thatcontain marginal and perhaps non-viable populations (Gaston, 1994). Despite the problems,on the regional or continental scale minimum sets identified using complementarity provideuseful guidance on areas where conservation actions could be considered (Williams et al.,1996). In all cases there needs to be a detailed consideration of the situation on the ground ifthe results are being used for conservation planning, and problems caused by the scale ofdata (see figure 4) should never be underestimated.
DISCUSSION AND CONCLUSIONS
Computerised databases are here to stay and will become increasingly useful to biologistsworking on both theoretical and conservation-related subjects. The scale of the problem to betackled using the database, and the sheer quantity of data involved and the resources availablewill to some extent determine the type of database used. For rapid results at a large scalewithin the lifetime of a single funding proposal relatively crude map distribution databasesmay be acceptable. However, in the longer time frame, and for single countries and smallerscales than this, point locality databases are essential. These allow data to be moved betweenscales of analysis and provide the full details on every specimen or record, which are notavailable in map database systems. It is possible that all available data on the biodiversity ofAfrica could be added to point locality databases within one lifetime, if there were reasonable
Downloaded From: https://bioone.org/journals/Journal-of-East-African-Natural-History on 25 May 2020Terms of Use: https://bioone.org/terms-of-use
Databases for research and conservation 177
resources devoted to the project. However, at present it is much more likely that thedatabasing will be undertaken in a piece-meal fashion by countries and projects. It can onlybe hoped that these efforts can be joined up at some point in the future.
There is a general and serious problem of very uneven survey coverage in Africa.Drawing defensible conclusions from biodiversity data, when some areas have been studiedin detail for more than 100 years by scientists from allover the world and from manydifferent disciplines, and other areas have hardly even been even visited by a biologist, is noteasy. Modelling potential or likely distributions using the available biological data and otheravailable data sources such as climate, topography etc., offers a partial solution to theproblem (e.g. Tushabe et at., in press), although there are still problems with old data (forexample the vegetation map used by Tushabe et at., in press was from 1964). At least thissolution is realistic and the methods exist to do it. The alternative-that of mass collection ofmany areas and the identification of everything that is collected is probably not realistic,particularly because of the differences of opinion between different taxonomists on thevalidity of many species, and the political instability of many countries in Africa today.
ACKNOWLEDGEMENTS
This paper owes a great debt to the discussions held with many people over the past threeyears, particularly Helen de Klerk of the FitzPatrick Institute in South Africa, Paul Williamsof the Natural History Museum in London, and Carsten Rahbek, Bent Otto Poulsen and PoulAndersen of the Danish Centre for Tropical Biodiversity in the Zoological Museum of theUniversity of Copenhagen, Denmark. It also incorporates much of the discussion receivedwhen this paper was presented orally to the Eastern Arc Conference in December 1997 inMorogoro, Tanzania.
The Danish Centre for Tropical Biodiversity thanks the many people who have assisted inthe development of databases for Afrotropical Biodiversity, especially the Percy FitzPatrickInstitute in South Africa, and the taxonomists mentioned in the paper in this conferencevolume on the fauna of the Eastern Arc Mountains. The Biodiversity database of theUniversity of Dar es Salaam thanks the GEF Project on Developing the Capacity forBiodiversity Conservation in East Africa for the financial support to its establishment, andthe Zoology Department of the University of Dar es Salaam for office space and technicalassistance. It also thanks all those who have provided data used here, especially Dr AlanRodgers (larger mammals of Tanzania), the FINNIDA-Catchment Forestry-FrontierTanzania biodiversity survey project in the East Usambara Mountains, and several museumdatabases in USA. Paul Williams provided WORLDMAP and altered it for our requirements.He also allowed us to use the figure on the large-scale distribution of bumblebees. We thankDr Alan Rodgers and Professor Kim Howell for their comments on the manuscript.
REFERENCES
Burgess, N.D., H. de Klerk, J. Fjeldsa, C. Rahbek & T. Crowe (1997). MappingAfrotropical birds: links between atlas studies and conservation priority analyses. AfricanBird Ctub 4: 93-98.
Downloaded From: https://bioone.org/journals/Journal-of-East-African-Natural-History on 25 May 2020Terms of Use: https://bioone.org/terms-of-use
178 N. Burgess, J. Fjeldsa & R. Botterweg
Burgess, N.D., H. de Klerk, J. Fjeldsa, T. Crowe & C. Rahbek (in press). A preliminaryassessment of congruence between biodiversity patterns in Afrotropical forest mammalsand birds. Ostrich
Burgess, N.D., J. Fjeldsa & R. Botterweg (this volume). The faunal importance of theEastern Arc Mountains of Kenya and Tanzania. Journal of the East African NaturalHistory 87: 37-58.
Cordeiro, N.J. (this volume). Preliminary analysis of the nestedness patterns of montaneforest birds of the Eastern Arc Mountains. Journal of the East African Natural History87: 101-118.
CRES (1995). An African data sampler. CD-ROM, CRES, Australia.Ehrlich, D. & E.F. Lambin (1996). Broad scale land-cover classification and interannual
climate variability. International Journal of Remote Sensing 17: 845-862.Fjeldsa, J. & J.C. Lovett (1997a). Biodiversity and Environmental Stability: Guest editorial.
Biodiversity and Conservation 6: 315-323.Fjeldsa, J. & J.C. Lovett (1997b). Geographical patterns of phylogenetic relicts and
phylogenetically subordinate species in tropical Africa forest biota. Biodiversity andConservation 6: 323-344.
Fjeldsa, J. & J. Rab01 (1995). Variation in avian communities between isolated units of theEastern Arc mountain forests, Tanzania. Gerfaut 85: 3-18.
Fjeldsa, J., D. Ehrlich, E. Lambin & E. Prins (1997). Are biodiversity 'hotspots' correlatedwith current ecological stability? A pilot study using the NOAA-AVHRR remote sensingdata. Biodiversity and Conservation 6: 399-420.
Forman, R.T.T. (1995). Land mosaics: the ecology of landscapes and regions. CambridgeUniversity Press, Cambridge.
Frietag, S. & A.S. van Jaarsveld (1995). Towards conserving regional mammalian speciesdiversity: a case study and data critique. South African Journal of Zoology 30: 136-144.
Frietag, S., A.a. Nicholls & A.S. van Jaarsveld (1996). Nature reserve selection in theTransvaal, South Africa: what data should we be using. Biodiversity and Conservation 5:685-698.
Gaston, K.J. (1994). Rarity. Chapman and Hall, London.Gaston, K.J. & P.H. Williams (1993). Mapping the world's species: the higher taxon
approach. Biodiversity Letters 1: 2-8.Happold, D.C.D. (1995). The interaction between humans and mammals in Africa in relation
to conservation: a review. Biodiversity and Conservation 4: 395-414.ICBP (1992). Putting biodiversity on the map: priority areas for global conservation. ICBP,
Cambridge.Jaarsveld van, A.S. (1995). Where to with reserve selection and conservation planning in
South Africa? South African Journal of Zoology 30: 164-168.Johansson, S.G., P. Cunneyworth, N. Doggart & R. Botterweg (this volume). Biodiversity
surveys in the East Usambara Mountains: preliminary findings and managementimplications. Journal of the East African Natural History 87: 139-158.
J0fgensen, A.F. & H. N0hr (1996). The use of satellite images for mapping of landscape andbiological diversity in the Sahel. International Journal of Remote Sensing 17: 91-109.
Kodric-Brown, A. & J.H. Brown (1993). Incomplete data sets in community ecology andbiogeography: a cautionary tale. Ecological Applications 3: 736-742.
Lambin, E.F. & D. Ehrlich (1996). The surface temperature-vegetation index space for landcover and land-cover change analysis. International Journal of Remote Sensing 17: 463487.
Downloaded From: https://bioone.org/journals/Journal-of-East-African-Natural-History on 25 May 2020Terms of Use: https://bioone.org/terms-of-use
Databases for research and conservation 179
Larsen, J. B. (1997). Testing some possible ways to establish conservation priorities forAfrotropica1 mammals, using WORLDMAP. Unpublished Masters thesis: University ofCopenhagen.
Levin, S.A. (1992). The problem of pattern and scale in ecology. Ecology 73: 1943-1967.Lombard, A.T. (1995). The problems with multi-species conservation: do hotspots, ideal
reserves and existing reserves coincide? South African Journal of Zoology 30: 145-163.Lombard, A.T., A.O. Nicholls & P.V. August (1995). Where should nature reserves be
located in South Africa? A snakes perspective. Conservation Biology 9: 363-372.Lovett, J.C. (this volume). Importance of the Eastern Arc Mountains for vascular plants.
Journal of East African Natural History 87: 59-74.Margules, C.R. & M.P. Austin (1994). Biological models for monitoring species decline: the
construction and use of data-bases. Philosophical Transactions of the Royal Society,London B 344: 69-75.
Margules, C.R. & T.D. Redhead (1996). Guidelines for using the BioRap Methodology andTools. CSIRO for the World Bank, Australia.
Mittermeier, R.A. (1988). Primate diversity and the tropical forest. Case Studies from Braziland Madagascar and the importance of the megadiversity countries. In E.O. Wilson (ed.),Biodiversity. National Academy Press, Washington D.C. Pp 145-154.
Myers, N. (1988). Threatened biotas: 'hot spots' in tropical forests. The Environmentalist 8:187-208.
Myers, N. (1990). The biological challenge: extended hot-spots analysis. TheEnvironmentalist 10: 243-256.
N0hr, H. & A.F. J0rgensen (1996). Mapping of biological diversity in Sahel by means ofsatellite image analyses and ornithological surveys. Biodiversity and Conservation 6: 545566.
Olivieri, S., J. Harrison & J.R. Busby (1995). Data and information management andcommunication. In V.H. Heywood & R.T. Watson (eds), Global BiodiversityAssessment. Cambridge University Press, Cambridge. Pp 607-671.
Reynolds, J., H. Tushabe & P. Kasoma (1999). The establishment of a National BiodiversityData Bank for Uganda. EANHS Bulletin 29(3): 6-9.
Rodgers, W.A. & K.M. Homewood (1982). Biological values and conservation prospects forthe forests and primate populations of the Udzungwa Mountains, Tanzania. BiologicalConservation 24: 285-304.
Rosenzweig, M.L. (1995). Species diversity in space and time. Cambridge University Press,Cambridge.
Roy, S.M., J.C.M. da Silva, P. Arctander, J. Garcia-Moreno & J. Fjeldsa (1997). The roleof montane regions in the speciation of South American and African birds. In D.P.Mindell (ed.), Avian Molecular Evolution and Systematics. Academic Press, London andNew York. Pp 325-343.
Scott, J.M., F. Davis, B. Csuti, R. Noss, B. Butterfield, C. Groves, H. Anderson, S.Caicco, F. D'Erchia, T.C. Edwards, J. Ulliman & R.G. Wright (1993). Gap analysis: ageographical approach to protection of biological diversity. Wildlife Monographs 123:1-41.
Downloaded From: https://bioone.org/journals/Journal-of-East-African-Natural-History on 25 May 2020Terms of Use: https://bioone.org/terms-of-use
180 N. Burgess, J. Fjeldsa & R. Botterweg
Stoms, D.M. (1992). Effect of habitat map generalisation in biodiversity assessment.Programmetric Engineering and Remote Sensing 58: 1587-1591.
Stoms, D.M. & J.E. Estes (1993). A remote sensing research agenda for mapping andmonitoring biodiversity. International Journal for Remote Sensing 14: 1839-1860.
Turpie, J.K. & T.M. Crowe (1994). Patterns of distribution, diversity and endemism oflarger African mammals. South African Journal of Zoology 29: 19-32.
Tushabe, H., D. Pomeroy & J. Reynolds (in press). Predicting bird species occurrence forconservation planning in Uganda. Ostrich
Vane-Wright, R.I., C.J. Humphries & P.H. Williams (1991). What to protect: systematicsand the agony of choice. Biological Conservation 55: 255-268.
Walker, P.A. (1990). Modelling wildlife distributions using a geographic informationsystem: kangaroos in relation to climate. Journal of Biogeography 17: 279-289.
Whittaker, R.H. (1977). Evolution of species diversity in land communities. EvolutionaryBiology 10: 1-67.
Williams, P.H. (1995). Using WORLDMAP for Windows 95: Priority Areas forBiodiversity, version IV. The Natural History Museum: London.
Williams, P.H., N.D. Burgess & C. Rahbek (in press). Hotspots of richness, hotspots ofendemism, and complementarity areas: their success in representing the diversity of subSaharan mammals, their consequences for birds, and their application to large 'flagship'species mammals for representing small mammals. In A. Entwistle, & N. Dunstone (eds),Future priorities for the conservation of mammalian biodiversity. Cambridge UniversityPress, Cambridge.
Williams, P.H. & K.J. Gaston (1994). Measuring more of biodiversity: can higher-taxonrichness predict wholesale species richness? Biological Conservation 67: 211-217.
Williams, P.H., D. Gibbon, C. Margules, A. Rebelo, C.J. Humphries & R. Pressey (1996).A comparison of richness hotspots, rarity hotspots and complementarity areas forconserving the diversity of British Birds. Conservation Biology 10: 155-174.
Downloaded From: https://bioone.org/journals/Journal-of-East-African-Natural-History on 25 May 2020Terms of Use: https://bioone.org/terms-of-use


![o ] d v l o t · 2019. 11. 29. · h/d^ Dh^d /^ KEE d WZ/KZ dK ^ Zs/ X { h v } v r } v ] µ ] } } v ( ] u Z } Á ] } ( ( ( } Á } l ] v P } v } v v Ç o ] o X](https://static.documents.pub/doc/80x56/60d7e9029d3b55306d126f1e/o-d-v-l-o-t-2019-11-29-hd-dhd-kee-d-wzkz-dk-zs-x-h-v-v-r-.jpg)

![Ergoespirometría: Interpretación clíniccardiología ... · > < d c c < f e c a l p m l k j h ] t l y d [ v d j h y h y t v v d v ] d i l w l t o j t D L Y H W X \ I H](https://static.documents.pub/doc/80x56/5f69f3e3db1624519530e0ae/ergoespirometra-interpretacin-clniccardiologa-d-c-c-.jpg)
![D v } Ç W DW h · ^d d W ] ] v } v ] ] } v U ] ( o ] o D v } Ç W DW h W DW h o u > ] v } ( Z } } ( D ] o Æ u ] v u µ Z l Z W DW Á ] Ç ] (](https://static.documents.pub/doc/80x56/5f49524df68c617e1e3c1dab/d-v-w-dw-h-d-d-w-v-v-v-u-o-o-d-v-w-dw-h-w-dw-h-o-u.jpg)


![« l h q g h h n h j f e g b ] h j h ^ k d h ] h d j m ... · Вербена 20 B x e v± h d l y [ j v » 15-40 » Горошек душистый 12-15 B x e ± h d l y [ j v »](https://static.documents.pub/doc/80x56/5fc8ba3d25b3a81c851de257/-l-h-q-g-h-h-n-h-j-f-e-g-b-h-j-h-k-d-h-h-d-j-m-20-b-x.jpg)

![E H D UV 8 UV X V D UF WR V LQ Q R UWK H D V …...' 1 $ E D V H G S R S X OD WLR Q H V WLP D WH IR U J UL]]O\ E H D UV 8 UV X V D UF WR V LQ Q R UWK H D V WH UQ % ULWLV K & R OX P](https://static.documents.pub/doc/80x56/5e583f87ba1f1b1e854ff3aa/e-h-d-uv-8-uv-x-v-d-uf-wr-v-lq-q-r-uwk-h-d-v-1-e-d-v-h-g-s-r-s-x-od-wlr.jpg)

