+ All Categories
Home > Documents > 80 China CERI Commodity Report — Natural Gas PD …€¦ · urrently, most natural gas trade in...

80 China CERI Commodity Report — Natural Gas PD …€¦ · urrently, most natural gas trade in...

Date post: 07-Apr-2018
Category:
Upload: ngoque
View: 216 times
Download: 1 times
Share this document with a friend
18
Relevant Independent Objecve Currently, most natural gas trade in Asia is via liquefied natural gas (LNG) due to limited pipeline infrastructure, but China and India, the emerging natural gas giants, also have access to inland gas resources, primarily from Russia and the various Central Asian Republics (CAR). The rapid increase in Asian demand, combined with slow economic recovery in Europe, has led gas rich Russia, and the CARs to look at exporng their gas to the Asia Pacific. Subsequently, there have been several interregional pipeline projects that have been proposed. Table 1 summarizes some of these projects. If all of these pipeline projects went forward, the potenal for LNG imports into China and India would be severely diminished. However, a majority of pipeline projects have become stalled due to disagreements on gas price negoaons, or from various geopolical tensions. This is parcularly true between China and Russia where China has refused to sign a long-term oil- linked contract for the Altai pipeline that would put pipeline prices close to LNG prices. Regardless of its disputes with Russia, China has been able to secure over 6 BCFPD of gas from various CARs. For example, it has been willing to pay the tariff charges between $10-$13/ MMBTU for Turkmenistan gas because they allowed China equity in upstream gas producon. 4 Lastly, it is important to remember that China has onshore shale gas reserves of 134.4 tcm (4.7 x 10 3 TCF), of which it hopes to produce approximately 0.6 BCFPD from these shale gas reserves by 2015. 5 It has been quesoned whether Russia has missed the opportunity to enter the Asia Pacific market. Most of Russia’s proposed interregional pipeline projects to Asia have not gone forward. China is explained in the preceding paragraph, but Japan and Russia have failed to come to an agreement due to an unresolved territorial dispute over the Kuril Islands. 6 South Korea has also had difficules accessing Russian natural gas as an offshore pipeline is uneconomic, and an onshore pipeline will need to go through North Korea, which would create either the risk of a substanal tariff to North Korea, or the risk of North Korea cung off gas supplies to South Korea. Despite the difficules of seng up onshore pipelines, Russia has commied itself to building LNG December 2013 CERI Commodity Report — Natural Gas Interregional Natural Gas Pipelines in Asia: An Alternave to LNG Zoey Walden Asia-Pacific is expected to become a rapidly growing hub for natural gas consumpon. China is ancipated to be the largest consumer with the Naonal Development and Reform Commiee (NDRC) projecng in their 12 th Five Year Plan a substanal increase in natural gas consumpon at a rate of ~1.9 billion cubic feet per day (BCFPD) to reach 22 BCFPD by 2015, and increasing even further to 36 BCFPD by 2020. 1 The NDRC foresees that between 7-9 BCFPD would need to be imported by 2015 with domesc producon supplying the remainder. 2 Yet, China is only a fracon of the upcoming Asian market with total Asian demand potenally reaching 89 BCFPD for the year 2020. 3 Figure 1 depicts the projected Asian demand as determined by the IEA World Energy Outlook for 2011. Figure 1: Forecasted Asian Demand Source: IEA, CERI 0 20 40 60 80 100 120 140 160 2011 2013 2015 2017 2019 2021 2023 2025 2027 2029 2031 2033 2035 BCFPD Rest of Non-OECD Asia India China Rest of Asia Oceania South Korea Japan CERI Commodity Report – Natural Gas Editor-in-Chief: Dinara Millington ([email protected]) Contents Featured Arcle ................................................................................. 1 Natural Gas Prices.............................................................................. 4 Weather ............................................................................................ 6 Consumpon and Producon............................................................. 8 Transportaon................................................................................... 10 Storage .............................................................................................. 12 Liquefied Natural Gas ........................................................................ 15 Drilling Acvity .................................................................................. 17
Transcript

Relevant • Independent • Objective

Currently, most natural gas trade in Asia is via liquefied natural gas (LNG) due to limited pipeline infrastructure, but China and India, the emerging natural gas giants, also have access to inland gas resources, primarily from Russia and the various Central Asian Republics (CAR). The rapid increase in Asian demand, combined with slow economic recovery in Europe, has led gas rich Russia, and the CARs to look at exporting their gas to the Asia Pacific. Subsequently, there have been several interregional pipeline projects that have been proposed. Table 1 summarizes some of these projects. If all of these pipeline projects went forward, the potential for LNG imports into China and India would be severely diminished. However, a majority of pipeline projects have become stalled due to disagreements on gas price negotiations, or from various geopolitical tensions. This is particularly true between China and Russia where China has refused to sign a long-term oil-linked contract for the Altai pipeline that would put pipeline prices close to LNG prices. Regardless of its disputes with Russia, China has been able to secure over 6 BCFPD of gas from various CARs. For example, it has been willing to pay the tariff charges between $10-$13/MMBTU for Turkmenistan gas because they allowed China equity in upstream gas production.4 Lastly, it is important to remember that China has onshore shale gas reserves of 134.4 tcm (4.7 x 10³ TCF), of which it hopes to produce approximately 0.6 BCFPD from these shale gas reserves by 2015.5 It has been questioned whether Russia has missed the opportunity to enter the Asia Pacific market. Most of Russia’s proposed interregional pipeline projects to Asia have not gone forward. China is explained in the preceding paragraph, but Japan and Russia have failed to come to an agreement due to an unresolved territorial dispute over the Kuril Islands.6 South Korea has also had difficulties accessing Russian natural gas as an offshore pipeline is uneconomic, and an onshore pipeline will need to go through North Korea, which would create either the risk of a substantial tariff to North Korea, or the risk of North Korea cutting off gas supplies to South Korea. Despite the difficulties of setting up onshore pipelines, Russia has committed itself to building LNG

December 2013

CERI Commodity Report — Natural Gas

Interregional Natural Gas Pipelines in Asia: An Alternative to LNG Zoey Walden Asia-Pacific is expected to become a rapidly growing hub for natural gas consumption. China is anticipated to be the largest consumer with the National Development and Reform Committee (NDRC) projecting in their 12th Five Year Plan a substantial increase in natural gas consumption at a rate of ~1.9 billion cubic feet per day (BCFPD) to reach 22 BCFPD by 2015, and increasing even further to 36 BCFPD by 2020.1 The NDRC foresees that between 7-9 BCFPD would need to be imported by 2015 with domestic production supplying the remainder.2 Yet, China is only a fraction of the upcoming Asian market with total Asian demand potentially reaching 89 BCFPD for the year 2020.3 Figure 1 depicts the projected Asian demand as determined by the IEA World Energy Outlook for 2011. Figure 1: Forecasted Asian Demand

Source: IEA, CERI

0

20

40

60

80

100

120

140

160

20

11

20

13

20

15

20

17

20

19

20

21

20

23

20

25

20

27

20

29

20

31

20

33

20

35

BC

FPD

Rest of Non-OECD Asia

India

China

Rest of Asia Oceania

South Korea

Japan

CERI Commodity Report – Natural Gas Editor-in-Chief: Dinara Millington ([email protected]) Contents Featured Article ................................................................................. 1 Natural Gas Prices.............................................................................. 4 Weather ............................................................................................ 6 Consumption and Production............................................................. 8 Transportation................................................................................... 10 Storage .............................................................................................. 12 Liquefied Natural Gas ........................................................................ 15 Drilling Activity .................................................................................. 17

CERI Commodity Report - Natural Gas

Page 2

Project Capacity (BCFPD) Start Date

Myanmar

Myanmar-China Pipeline ~1 2013 (Operational)

Russia

Altai Pipeline ~2.9 2015+

Sakhalin-Khabarovsk-Vladivostok (SKV)Pipeline

~0.6 2011 (Operational)

SKV Expansion ~2.9 (combined cap.) 2020

Power of Siberia Gas Transmission Project (PSGTP)

~5.9 with ~3.7 to China 2017

Russia-Japan Pipeline ~1.5-1.9 Unknown

South Korea Natural Gas Project ~1 2017+

Central Asian Republics (CAR)

Central-Asia China Gas Pipeline (CACGP) Lines A & B

~2.9 2011 (Operational)

CACGP Line C ~2.4 2014 reach full cap Dec. 2015

CACGP “Line D” ~0.5 2016

CACGP “Line D” ~1.9 (total Line D) 2020

Turkmenistan-Afghanistan-Pakistan-India (TAPI)

~2.6 2017+

Iran

Iran-Pakistan-India Pipeline ~3 Unknown

Source: Various sources

Table 1: Interregional Pipeline Projects to Asia

Figure 2: Russia’s Transmission Network

Source: Gazprom7

Relevant • Independent • Objective

Page 3

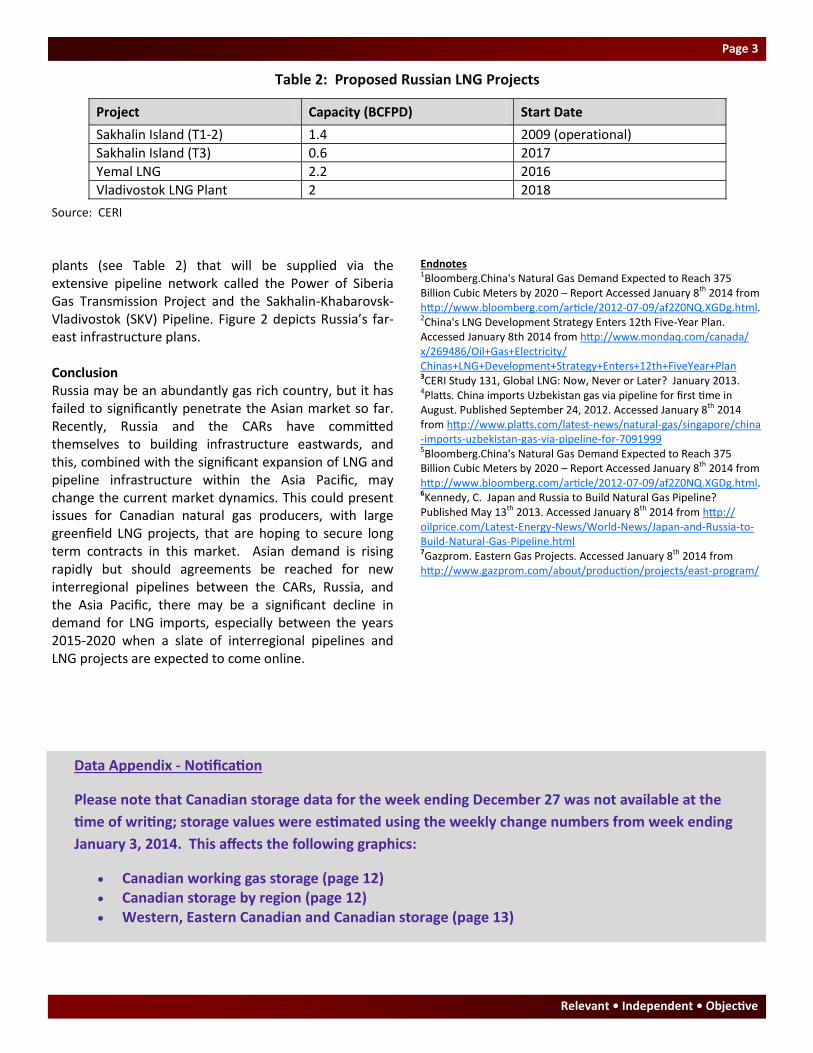
plants (see Table 2) that will be supplied via the extensive pipeline network called the Power of Siberia Gas Transmission Project and the Sakhalin-Khabarovsk-Vladivostok (SKV) Pipeline. Figure 2 depicts Russia’s far-east infrastructure plans. Conclusion Russia may be an abundantly gas rich country, but it has failed to significantly penetrate the Asian market so far. Recently, Russia and the CARs have committed themselves to building infrastructure eastwards, and this, combined with the significant expansion of LNG and pipeline infrastructure within the Asia Pacific, may change the current market dynamics. This could present issues for Canadian natural gas producers, with large greenfield LNG projects, that are hoping to secure long term contracts in this market. Asian demand is rising rapidly but should agreements be reached for new interregional pipelines between the CARs, Russia, and the Asia Pacific, there may be a significant decline in demand for LNG imports, especially between the years 2015-2020 when a slate of interregional pipelines and LNG projects are expected to come online.

Endnotes 1Bloomberg.China's Natural Gas Demand Expected to Reach 375 Billion Cubic Meters by 2020 – Report Accessed January 8th 2014 from http://www.bloomberg.com/article/2012-07-09/af2Z0NQ.XGDg.html. 2China's LNG Development Strategy Enters 12th Five-Year Plan. Accessed January 8th 2014 from http://www.mondaq.com/canada/x/269486/Oil+Gas+Electricity/Chinas+LNG+Development+Strategy+Enters+12th+FiveYear+Plan 3CERI Study 131, Global LNG: Now, Never or Later? January 2013. 4Platts. China imports Uzbekistan gas via pipeline for first time in August. Published September 24, 2012. Accessed January 8th 2014 from http://www.platts.com/latest-news/natural-gas/singapore/china-imports-uzbekistan-gas-via-pipeline-for-7091999 5Bloomberg.China's Natural Gas Demand Expected to Reach 375 Billion Cubic Meters by 2020 – Report Accessed January 8th 2014 from http://www.bloomberg.com/article/2012-07-09/af2Z0NQ.XGDg.html. 6Kennedy, C. Japan and Russia to Build Natural Gas Pipeline? Published May 13th 2013. Accessed January 8th 2014 from http://oilprice.com/Latest-Energy-News/World-News/Japan-and-Russia-to-Build-Natural-Gas-Pipeline.html 7Gazprom. Eastern Gas Projects. Accessed January 8th 2014 from http://www.gazprom.com/about/production/projects/east-program/

Project Capacity (BCFPD) Start Date

Sakhalin Island (T1-2) 1.4 2009 (operational)

Sakhalin Island (T3) 0.6 2017

Yemal LNG 2.2 2016

Vladivostok LNG Plant 2 2018

Table 2: Proposed Russian LNG Projects

Source: CERI

Data Appendix - Notification

Please note that Canadian storage data for the week ending December 27 was not available at the

time of writing; storage values were estimated using the weekly change numbers from week ending

January 3, 2014. This affects the following graphics:

Canadian working gas storage (page 12) Canadian storage by region (page 12) Western, Eastern Canadian and Canadian storage (page 13)

CERI Commodity Report - Natural Gas

Page 4

SOU

RC

E: C

ERI,

Pla

tts

Gas

Dai

ly P

rice

Gu

ide.

SO

UR

CE:

CER

I, P

latt

s G

as D

aily

Pri

ce G

uid

e.

SOU

RC

E: C

ERI,

Pla

tts

Gas

Dai

ly P

rice

Gu

ide.

SO

UR

CE:

CER

I, P

latt

s G

as D

aily

Pri

ce G

uid

e.

-10123456789

10

11

12

13

14

15 J

an

-05

Ja

n-0

6J

an

-07

Ja

n-0

8J

an

-09

Ja

n-1

0J

an

-11

Ja

n-1

2J

an

-13

Henry H

ub/R

ockies

Be

gin

nin

g o

f N

ex

t M

on

th

S

po

t P

ric

e Ro

ck

ies

He

nry

Hu

b Dif

fere

nti

al

US

$/M

MB

tu

-10123456789

10

11

12

13

14

15 J

an

-05

Ja

n-0

6J

an

-07

Jan

-08

Jan

-09

Jan

-10

Jan

-11

Jan

-12

Jan

-13

Henry H

ub/S

outhern C

alifornia

Be

gin

nin

g o

f N

ex

t M

on

th

S

po

t P

ric

e

So

uth

ern

C

ali

forn

ia

Hen

ry H

ub

Dif

fere

nti

al

US

$/M

MB

tu

-10123456789

10

11

12

13

14

15 J

an

-05

Jan

-06

Jan

-07

Jan

-08

Jan

-09

Jan

-10

Jan

-11

Jan

-12

Jan

-13

US

$/M

MB

tu

AE

CO

-C

He

nry

Hu

b

Dif

fere

nti

al

Henry H

ub/A

EC

O

Be

gin

nin

g o

f N

ex

t M

on

th

S

po

t P

ric

e

-2-10123456789

10

11

12

13

14

15 J

an

-05

Ja

n-0

6J

an

-07

Ja

n-0

8J

an

-09

Ja

n-1

0J

an

-11

Ja

n-1

2J

an

-13

US

$/M

MB

tu

He

nry H

ub/C

hic

ag

o

Be

gin

nin

g o

f N

ex

t M

on

th

S

po

t P

ric

e

Ch

ica

go

He

nry

Hu

b

Dif

fere

nti

al

Relevant • Independent • Objective

Page 5

SOU

RC

E: C

anad

ian

Gas

Ass

oci

atio

n.

SOU

RC

E: C

ERI,

Can

adia

n G

as A

sso

ciati

on

, Sta

tisti

cs C

anad

a.

SOU

RC

E: N

OA

A.

SOU

RC

E: C

ERI,

NO

AA

, EIA

.

0

100

200

300

400

500

600

700

800

JF

MA

MJ

JA

SO

ND

5-Y

ear

Av

g.

201

22

01

3

Canadian H

eating D

egree D

ays

0

100

200

300

400

500

600

700

800

900

JF

MA

MJ

JA

SO

ND

5-Y

ear

Av

g.

201

22

01

3

US

H

eating D

egree D

ays

01234567

0

200

400

600

800

1,0

00

1,2

00 J

an

-09

Ju

l-09

Jan

-10

Ju

l-10

Jan

-11

Ju

l-11

Jan

-12

Ju

l-12

Jan

-13

Ju

l-1

3

De

gre

e D

ay

sC

on

su

mp

tio

n

Ca

na

dia

n H

ea

tin

g D

eg

re

e D

ays vs R

esid

en

tia

l a

nd

Co

mm

erc

ia

l C

on

su

mp

tio

n

De

gre

e D

ay

sB

CF

PD

CE

RI E

sti

mate

010

20

30

40

50

60

0

200

400

600

80

0

1,0

00

1,2

00 J

an

-09

Ju

l-09

Jan

-10

Ju

l-10

Jan

-11

Ju

l-11

Jan

-12

Ju

l-12

Jan

-13

Ju

l-13

De

gre

e D

ay

sC

on

su

mp

tio

n

US

H

ea

tin

g D

eg

re

e D

ays vs

Re

sid

en

tia

l a

nd

C

om

me

rc

ia

l C

on

su

mp

tio

n

Deg

ree D

ays

BC

FP

D

CE

RI E

sti

mate

CERI Commodity Report - Natural Gas

Page 6

SOU

RC

E: E

nvi

ron

men

t C

anad

a.

SOU

RC

E: E

nvi

ron

men

t C

anad

a.

SOU

RC

E: N

OA

A.

SOU

RC

E: N

OA

A.

Relevant • Independent • Objective

Page 7

SOU

RC

E: N

OA

A.

SOU

RC

E: E

nvi

ron

men

t C

anad

a.

SOU

RC

E: N

OA

A.

CERI Commodity Report - Natural Gas

Page 8

SOU

RC

E: S

tati

stics

Can

ada.

SO

UR

CE:

Sta

tisti

cs C

anad

a, N

EB.

SOU

RC

E: E

IA.

SOU

RC

E: E

IA.

02468

10

12

14

16 J

an

-09

Ju

l-09

Jan

-10

Ju

l-10

Jan

-11

Ju

l-11

Jan

-12

Ju

l-12

Jan

-13

Ju

l-13

Ind

us

tria

l &

Po

we

rC

om

me

rcia

lR

esid

en

tia

l

Canadian C

onsum

ption

BC

FP

D

02468

10

12

14

16

18

20 J

an

-09

Ju

l-0

9J

an

-10

Ju

l-1

0J

an

-11

Ju

l-1

1J

an

-12

Ju

l-1

2J

an

-13

Ju

l-1

3

BC

, Y

uko

n, N

WT

AB

SK

E.

Co

as

t

Canadian M

arketable P

roduction

By P

ro

vin

ce

/R

eg

io

n

BC

FP

D

0

20

40

60

80

100

120

140 J

an

-09

Ju

l-0

9J

an

-10

Ju

l-1

0J

an

-11

Ju

l-1

1J

an

-12

Ju

l-1

2J

an

-13

Ju

l-1

3

Ind

us

tria

lE

lectr

ic P

ow

er

Co

mm

erc

ial

Re

sid

en

tia

l

BC

FP

D

US

C

onsum

ption

By S

ector

0

10

20

30

40

50

60

70

80 J

an

-09

Ju

l-0

9J

an

-10

Ju

l-1

0J

an

-11

Ju

l-1

1J

an

-12

Ju

l-1

2J

an

-13

Ju

l-1

3

US

To

tal

Lo

uis

ian

aG

OM

Fed

era

l W

ate

rsT

ex

as

US

M

arketable P

roduction

BC

FP

D

Relevant • Independent • Objective

Page 9

SOU

RC

E: S

tati

stics

Can

ada,

NEB

. SO

UR

CE:

Sta

tisti

cs C

anad

a, N

EB.

SOU

RC

E: S

tati

stics

Can

ada,

NEB

. SO

UR

CE:

Sta

tisti

cs C

anad

a, N

EB.

0.0

0.5

1.0

1.5

2.0

2.5

3.0

3.5

4.0

JF

MA

MJ

JA

SO

ND

201

12

01

22

01

3

BC

, Y

ukon, N

WT

M

arketable

BC

FP

D

02468

10

12

14

16

JF

MA

MJ

JA

SO

ND

201

12

01

22

01

3

AB

M

arketable P

roduction

BC

FP

D

0.0

0.5

1.0

JF

MA

MJ

JA

SO

ND

201

12

01

22

01

3

SK

M

arketable P

roduction

BC

FP

D

0.0

0

0.2

5

0.5

0

JF

MA

MJ

JA

SO

ND

201

12

01

22

01

3

East C

oast M

arketable P

roduction

BC

FP

D

CERI Commodity Report - Natural Gas

Page 10

SOU

RC

E: C

ERI.

SO

UR

CE:

CER

I.

SOU

RC

E: N

EB.

SOU

RC

E: N

EB.

02468

10

12

14

16

JF

MA

MJ

JA

SO

ND

201

12

01

22

01

3

BC

FP

D

System

Field R

eceipts

Tra

nsC

an

ad

a +

W

estc

oa

st; M

on

th

ly A

ve

ra

ge

02468

10

12

14

16

Dec-1

2F

eb

-13

Ap

r-13

Ju

n-1

3A

ug

-13

Oct-

13

Dec-1

3

Em

pre

ss

McN

eil

lA

B-B

CA

llia

nc

e

BC

FP

D

Alberta S

ystem

D

eliveries

0123456789

10

No

v-1

2J

an

-13

Ma

r-1

3M

ay

-13

Ju

l-1

3S

ep

-13

No

v-1

3

Kin

gs

ga

teM

on

ch

yE

lmo

reH

un

tin

gd

on

Canadian G

as E

xports to the U

S

By E

xp

ort P

oin

t -W

est

BC

FP

D

0123456789

10

No

v-1

2Jan

-13

Mar-

13

May-1

3Ju

l-13

Sep

-13

No

v-1

3

Em

ers

on

Iro

qu

ois

Oth

ers

Nia

ga

ra

Canadian G

as E

xports to the U

S

By E

xp

ort P

oin

t -E

ast

BC

FP

D

Relevant • Independent • Objective

Page 11

SOU

RC

E: N

EB.

SOU

RC

E: N

EB.

SOU

RC

E: N

EB, E

IA.

SOU

RC

E: N

EB.

02468

10

12

14

No

v-1

2J

an

-13

Ma

r-1

3M

ay

-13

Ju

l-1

3S

ep

-13

No

v-1

3

We

st

Mid

We

st

Ea

st

US

Im

ports of C

anadian G

as

BC

FP

D

02468

10

12

14

No

v-1

2J

an

-13

Ma

r-1

3M

ay-1

3J

ul-

13

Se

p-1

3N

ov-1

3

We

st

Mid

Wes

tE

as

t

Average C

anadian E

xport P

rice

By U

S R

eg

io

n

C$

/GJ

01234

No

v-1

2Jan

-13

Mar-

13

May-1

3Ju

l-13

Sep

-13

No

v-1

3

Co

urt

rig

ht

Sa

rnia

St.

Cla

irO

the

r

BC

FP

D

Canadian G

as Im

ports

By Im

port P

oin

t

02468

10

12

14 Sep

-12

No

v-1

2J

an

-13

Ma

r-1

3M

ay

-13

Ju

l-1

3S

ep

-13

Can

ad

aM

ex

ico

Total U

S P

ipeline G

as Im

ports

BC

FP

D

CERI Commodity Report - Natural Gas

Page 12

SOU

RC

E: C

ERI,

Pla

tts

Gas

Dai

ly.

SOU

RC

E: C

ERI,

Pla

tts

Gas

Dai

ly.

SOU

RC

E: C

ERI,

Pla

tts

Gas

Dai

ly.

SOU

RC

E: C

ERI,

Pla

tts

Gas

Dai

ly.

0

100

200

300

400

500

600

700

800

900

JF

MA

MJ

JA

SO

ND

5-Y

ear

Av

g.

201

22

01

3

BC

F, M

on

th E

nd

Canadian W

orking G

as S

torage

0

500

1,0

00

1,5

00

2,0

00

2,5

00

3,0

00

3,5

00

4,0

00

4,5

00

De

c-1

2F

eb

-13

Ap

r-1

3J

un

-13

Au

g-1

3O

ct-

13

De

c-1

3

Ea

st

We

st

Pro

du

cin

g R

eg

ion

BC

F, M

on

th E

nd

US

S

torage by R

egion

0

500

1,0

00

1,5

00

2,0

00

2,5

00

3,0

00

3,5

00

4,0

00

4,5

00

JF

MA

MJ

JA

SO

ND

5-Y

ear

Av

g.

201

22

01

3

BC

F, M

on

th E

nd

US

Low

er-48 W

orking G

as S

torage

0

100

200

300

400

50

0

600

700

800

Dec-1

2F

eb

-13

Ap

r-13

Ju

n-1

3A

ug

-13

Oct-

13

Dec-1

3

We

st

Ea

st

Canadian S

torage by R

egion

BC

F, M

on

th E

nd

Relevant • Independent • Objective

Page 13

SOU

RC

E: C

ERI,

Pla

tts

Gas

Dai

ly.

SOU

RC

E: C

ERI,

Pla

tts

Gas

Dai

ly.

SOU

RC

E: C

ERI,

Pla

tts

Gas

Dai

ly.

-120

-100

-80

-60

-40

-200

20

40

60

80

JF

MA

MJ

JA

SO

ND

WC

_IJ

_W

D

5-Y

ear

Av

g.

201

22

01

3

BC

F, M

on

th E

nd

We

ste

rn

C

an

ad

a S

to

ra

ge

-150

-100

-500

50

100

150

JF

MA

MJ

JA

SO

ND

5-Y

ear

Av

g.

201

22

01

3

Ca

na

dia

n S

to

ra

ge

BC

F, M

on

th E

nd

-80

-60

-40

-200

20

40

60

80

JF

MA

MJ

JA

SO

ND

5-Y

ear

Av

g.

201

22

01

3

Ea

ste

rn

C

an

ad

ia

n S

to

ra

ge

BC

F, M

on

th E

nd

CERI Commodity Report - Natural Gas

Page 14

SOU

RC

E: C

ERI,

Pla

tts

Gas

Dai

ly.

SOU

RC

E: C

ERI,

Pla

tts

Gas

Dai

ly.

SOU

RC

E: C

ERI,

Pla

tts

Gas

Dai

ly.

SOU

RC

E: C

ERI,

Pla

tts

Gas

Dai

ly.

-15

0

-10

0

-500

50

100

JF

MA

MJ

JA

SO

ND

5-Y

ear

Av

g.

201

22

01

3

US

W

este

rn

C

on

su

min

g R

eg

io

n S

to

ra

ge

BC

F, M

on

th E

nd

-500

-400

-300

-200

-1000

100

200

300

40

0

500

JF

MA

MJ

JA

SO

ND

5-Y

ear

Av

g.

201

22

01

3

US

E

aste

rn

S

to

ra

ge

BC

F, M

on

th E

nd

-250

-200

-150

-100

-500

50

100

150

200

JF

MA

MJ

JA

SO

ND

5-Y

ear

Av

g.

201

22

01

3

US

P

ro

du

cin

g R

eg

io

n S

to

ra

ge

BC

F, M

on

th E

nd

-10

00

-800

-600

-400

-2000

200

400

600

800

JF

MA

MJ

JA

SO

ND

5-Y

ear

Av

g.

201

22

01

3

US

S

to

ra

ge

BC

F, M

on

th E

nd

Relevant • Independent • Objective

Page 15

SOU

RC

E: U

S D

OE.

SO

UR

CE:

US

DO

E.

SOU

RC

E: U

S D

OE.

SO

UR

CE:

US

DO

E.

02468

10

12

14

16

18

20

22

24

No

v-1

2Jan

-13

Mar-

13

May-1

3Ju

l-13

Sep

-13

No

v-1

3

Fre

ep

ort

La

ke

Ch

arl

es

Sa

bin

e P

as

sC

am

ero

nG

old

en

Pas

sG

ulf

LN

G

US

G

OM

LN

G Im

ports B

y Facility

BC

F

05

10

15

20

25

30

35

40

No

v-1

2J

an

-13

Ma

r-1

3M

ay-1

3J

ul-

13

Sep

-13

No

v-1

3

Eg

yp

tN

ige

ria

Tri

nid

ad

No

rwa

yQ

ata

rY

em

en

Pe

ru

BC

F

US

LN

G Im

ports B

y O

rigin

02468

10

12

14

16

18

20

22

24

No

v-1

2J

an

-13

Ma

r-1

3M

ay

-13

Ju

l-1

3S

ep

-13

No

v-1

3

Co

ve

Po

int

Elb

a Is

lan

dE

ve

rett

NE

Ga

tew

ay

Nep

tun

e

Eastern U

S LN

G Im

ports B

y Facility

BC

F

0123456789

10

JF

MA

MJ

JA

SO

ND

201

12

01

22

01

3

Volum

e-W

eighted A

verage LN

G P

rice

US

$/M

MB

tu

CERI Commodity Report - Natural Gas

Page 16

SOU

RC

E: U

S D

OE,

NEB

. SO

UR

CE:

US

DO

E.

SOU

RC

E: E

IA, U

S D

OE.

SO

UR

CE:

US

DO

E.

01234567

No

v-1

2J

an

-13

Ma

r-1

3M

ay

-13

Ju

l-1

3S

ep

-13

No

v-1

3

Japan

US

LN

G E

xports to Japan

BC

F

01234567

No

v-1

2J

an

-13

Ma

r-13

May

-13

Ju

l-1

3S

ep

-13

No

v-1

3

Un

ited

Kin

gd

om

Bra

zil

So

uth

Ko

rea

Jap

an

US

LN

G R

e-E

xports

By D

estin

atio

n

BC

F

Relevant • Independent • Objective

Page 17

SOU

RC

E: C

ERI,

CA

OD

C, B

aker

Hu

ghes

, Div

estc

o.

SOU

RC

E: C

ERI,

CA

OD

C, D

ive

stco

.

SOU

RC

E: C

ERI,

CA

OD

C, D

ive

stco

. SO

UR

CE:

CER

I, C

AO

DC

, Div

est

co.

0

500

1,0

00

1,5

00

2,0

00

2,5

00

3,0

00 Ja

n-0

5J

an

-06

Ja

n-0

7J

an

-08

Ja

n-0

9J

an

-10

Ja

n-1

1J

an

-12

Ja

n-1

3J

an

-14

US

WC

SB

North A

merican A

ctive R

igs

Rig

s

0

100

200

300

400

500

600

700

800

900

1,0

00 Jan

-05

Jan

-06

Jan

-07

Jan

-08

Jan

-09

Jan

-10

Jan

-11

Jan

-12

Jan

-13

Jan

-14

Acti

ve R

igs

To

ta R

ig D

rillin

g F

leet

Canadian R

ig Fleet U

tilization

Rig

s

0

100

200

300

400

500

600

700 Ja

n-0

9J

ul-

09

Ja

n-1

0J

ul-

10

Ja

n-1

1J

ul-

11

Ja

n-1

2J

ul-

12

Ja

n-1

3J

ul-

13

Ja

n-1

4

SK

AB

BC

WC

SB

A

ctive R

igs by P

rovince

Rig

s

-

10

0

20

0

30

0

40

0

50

0

60

0

70

0

80

0

15

913

17

21

25

29

33

37

41

45

49

5-Y

ea

r A

vg

.2

01

32

01

4

Western C

anada A

ctive R

igs

We

ek

ly A

ve

ra

ge

Rig

s

We

ek

Nu

mb

er

CERI Commodity Report - Natural Gas

Page 18

SOU

RC

E: C

ERI,

Bak

er H

ugh

es.

SO

UR

CE:

CER

I, B

aker

Hu

ghe

s.

SOU

RC

E: C

ERI,

Bak

er H

ugh

es.

0%

10%

20%

30

%

40%

50%

60%

70%

80%

90%

100%

0

200

400

600

800

1,0

00

1,2

00

1,4

00

1,6

00

1,8

00

2,0

00

2,2

00

2,4

00 Ja

n-0

5J

an

-06

Ja

n-0

7J

an

-08

Ja

n-0

9J

an

-10

Ja

n-1

1J

an

-12

Ja

n-1

3J

an

-14

Oil-D

ire

cte

dG

as-D

ire

cte

dG

as-D

ire

cte

d %

US

T

otal A

ctive R

igs

Rig

s

0

500

1,0

00

1,5

00

2,0

00

2,5

00 Jan

-05

Jan

-06

Jan

-07

Jan

-08

Jan

-09

Jan

-10

Jan

-11

Jan

-12

Jan

-13

Jan

-14

To

tal O

il-d

irecte

dG

oM

Gas-d

irecte

dO

nsh

ore

Gas-d

irecte

d

Rig

s

US

T

otal A

ctive R

igs

0

20

40

60

80

10

0

120 J

an

-05

Jan

-06

Jan

-07

Ja

n-0

8J

an

-09

Jan

-10

Ja

n-1

1J

an

-12

Jan

-13

Ja

n-1

4

Oil-d

irec

ted

Ga

s-d

ire

cte

d

US

G

ulf of M

exico A

ctive R

igs

Rig

s


Recommended