I-435/I-35/K-10 Interchange Concept Study 58 KDOT Project No. 435-46 KA-1002-01 8.1 Construction Phasing Given the size and significant cost of the proposed interchange improvements, it was determined that the project should be divided into smaller, more manageable construction phases. The first step was to establish the phasing criteria, then identify the construction phases and finally to develop a potential construction timeline. 8.1.1 Phasing Criteria General criteria were established for developing a phasing plan. This criteria helped to identify individual construction phases as well as the phasing sequence: • Independent Utility – Each phase should be able to stand on its own with reasonable interim access provided and with appropriate termini and transitions to existing pavement. • Real and Perceived Public Benefit - Each project should have a significant real and perceived public benefit addressing economic development opportunities, deteriorating infrastructure segments, and known congestion and safety issues. • Cost Feasibility – Each phase generally should not cost more than $200 million in today’s dollars to better facilitate funding. • Construction Time – Limit the overall length of construction time to three to four years to address pricing uncertainties. • Constructability – Each phase and the sequence of the phases should facilitate feasible construction methods and maintenance of traffic during construction. 8.1.2 Construction Phases Several scenarios were developed to arrive at a Preferred Phasing Plan for the proposed improvements. Some scenarios focused more on infrastructure maintenance priorities while others focused more on traffic capacity priorities. Some scenarios had up to seven smaller phases while other scenarios had three larger phases. Another consideration in developing the phasing plan was the coordination with the adjacent I-435 and US-69 Interchange Improvements. That project had its own construction phases and sequencing priorities as well. Two of those phases directly affect Johnson County Gateway phases. As a result, an overall phasing plan was developed to meet the needs of both interchange improvement projects. Given the funding constraints, time frame to complete the improvements, and the overriding desire to prioritize capacity issues, a Preferred Phasing Plan was selected. This plan described the individual construction phases and the sequence of construction of the Johnson County Gateway interchange and the directly affected phases of the I-435 and US-69 8.0 Phasing Plan interchange. The phasing plan was presented to KDOT executive staff on July 21, 2010 and approved. The preferred phasing plan was then used in T-WORKS project selection meetings. Project 1 - Yellow Project The Yellow Project, as shown in Figure 76, will construct two auxiliary lanes southbound (SB) and northbound (NB) on I-35 between 119th Street and I-35. This will address the back-up of traffic on the existing westbound (WB) I-435 to SB I-35 flyover ramp and will also address the heavy SB and NB I-35 traffic between 119th Street and I-435. Figure 76 - Project 1 - Yellow Project PROJECT 1 10 435 435 35 35 Ridgeview Road Lackman Road Pflumm Road Santa Fe Trail Drive Renner Boulevard 95th Street 105th Street 101st Terrace College Boulevard Kansas City Road Strang Line Road 119th Street The Yellow Project adds two auxiliary lanes to NB and SB I-35 between I-435 and 119th Street.
Transcript
I-435/I-35/K-10 Interchange Concept Study
58KDOT Project No. 435-46 KA-1002-01
8.1 Construction PhasingGiven the size and significant cost of the proposed interchange improvements, it was determined that the project should be divided into smaller, more manageable construction phases. The first step was to establish the phasing criteria, then identify the construction phases and finally to develop a potential construction timeline.
8.1.1 Phasing Criteria
General criteria were established for developing a phasing plan. This criteria helped to identify individual construction phases as well as the phasing sequence:
• Independent Utility – Each phase should be able to stand on its own with reasonable interim access provided and with appropriate termini and transitions to existing pavement.
• Real and Perceived Public Benefit - Each project should have a significant real and perceived public benefit addressing economic development opportunities, deteriorating infrastructure segments, and known congestion and safety issues.
• Cost Feasibility – Each phase generally should not cost more than $200 million in today’s dollars to better facilitate funding.
• Construction Time – Limit the overall length of construction time to three to four years to address pricing uncertainties.
• Constructability – Each phase and the sequence of the phases should facilitate feasible construction methods and maintenance of traffic during construction.
8.1.2 Construction PhasesSeveral scenarios were developed to arrive at a Preferred Phasing Plan for the proposed improvements. Some scenarios focused more on infrastructure maintenance priorities while others focused more on traffic capacity priorities. Some scenarios had up to seven smaller phases while other scenarios had three larger phases.
Another consideration in developing the phasing plan was the coordination with the adjacent I-435 and US-69 Interchange Improvements. That project had its own construction phases and sequencing priorities as well. Two of those phases directly affect Johnson County Gateway phases. As a result, an overall phasing plan was developed to meet the needs of both interchange improvement projects.
Given the funding constraints, time frame to complete the improvements, and the overriding desire to prioritize capacity issues, a Preferred Phasing Plan was selected. This plan described the individual construction phases and the sequence of construction of the Johnson County Gateway interchange and the directly affected phases of the I-435 and US-69
8.0 Phasing Planinterchange. The phasing plan was presented to KDOT executive staff on July 21, 2010 and approved. The preferred phasing plan was then used in T-WORKS project selection meetings.
Project 1 - Yellow Project
The Yellow Project, as shown in Figure 76, will construct two auxiliary lanes southbound (SB) and northbound (NB) on I-35 between 119th Street and I-35. This will address the back-up of traffic on the existing westbound (WB) I-435 to SB I-35 flyover ramp and will also address the heavy SB and NB I-35 traffic between 119th Street and I-435.
Figure 76 - Project 1 - Yellow Project
PROJECT 1
10
435
435
35
35
Rid
gevi
ew R
oad
Lac
kman
Roa
d
Pfl
umm
Roa
dSan
ta F
e Tr
ail D
rive
Ren
ner
Bou
leva
rd
95th Street
105th Street
101st Terrace
College Boulevard
Kan
sas
City
Roa
d
Strang
Line
Road
119th Street
The Yellow Project adds two auxiliary lanes to NB and SB I-35 between I-435 and 119th Street.
59KDOT Project No. 435-46 KA-1002-018.0 Phasing Plan
I-435 and US 69 Red Project
The I-435 and US-69 Red Project, as shown in Figure 77, will add auxiliary lanes to I-435 between I-35 and Quivira. This will help address the congestion of traffic merging from NB I-35 onto eastbound (EB) I-435. It will also help address the heavy WB I-435 traffic between Quivira and I-35.
The auxiliary lane improvements with the Yellow and Red Projects will address the number 1 and 3 concerns of the Johnson County Gateway interchange as identified previously in this report and as shown in Figure 78. They will provide a free flow traffic level of service until 2025 as described in Section 8.2.1.
Figure 77 - I-435 and US 69 Red Project
Figure 78 - Problem Areas Identified by the Public
PROJECT 1I-435/US-69 PROJECT
10
435
435
35
35
Rid
gevi
ew R
oad
Lac
kman
Roa
d
Pfl
umm
Roa
dSan
ta F
e Tr
ail D
rive
Ren
ner
Bou
leva
rd
95th Street
105th Street
101st Terrace
The I-435 and US 69 Red Project adds one auxiliary lane to WB and EB I-435 between I-35 and Quivira Road.
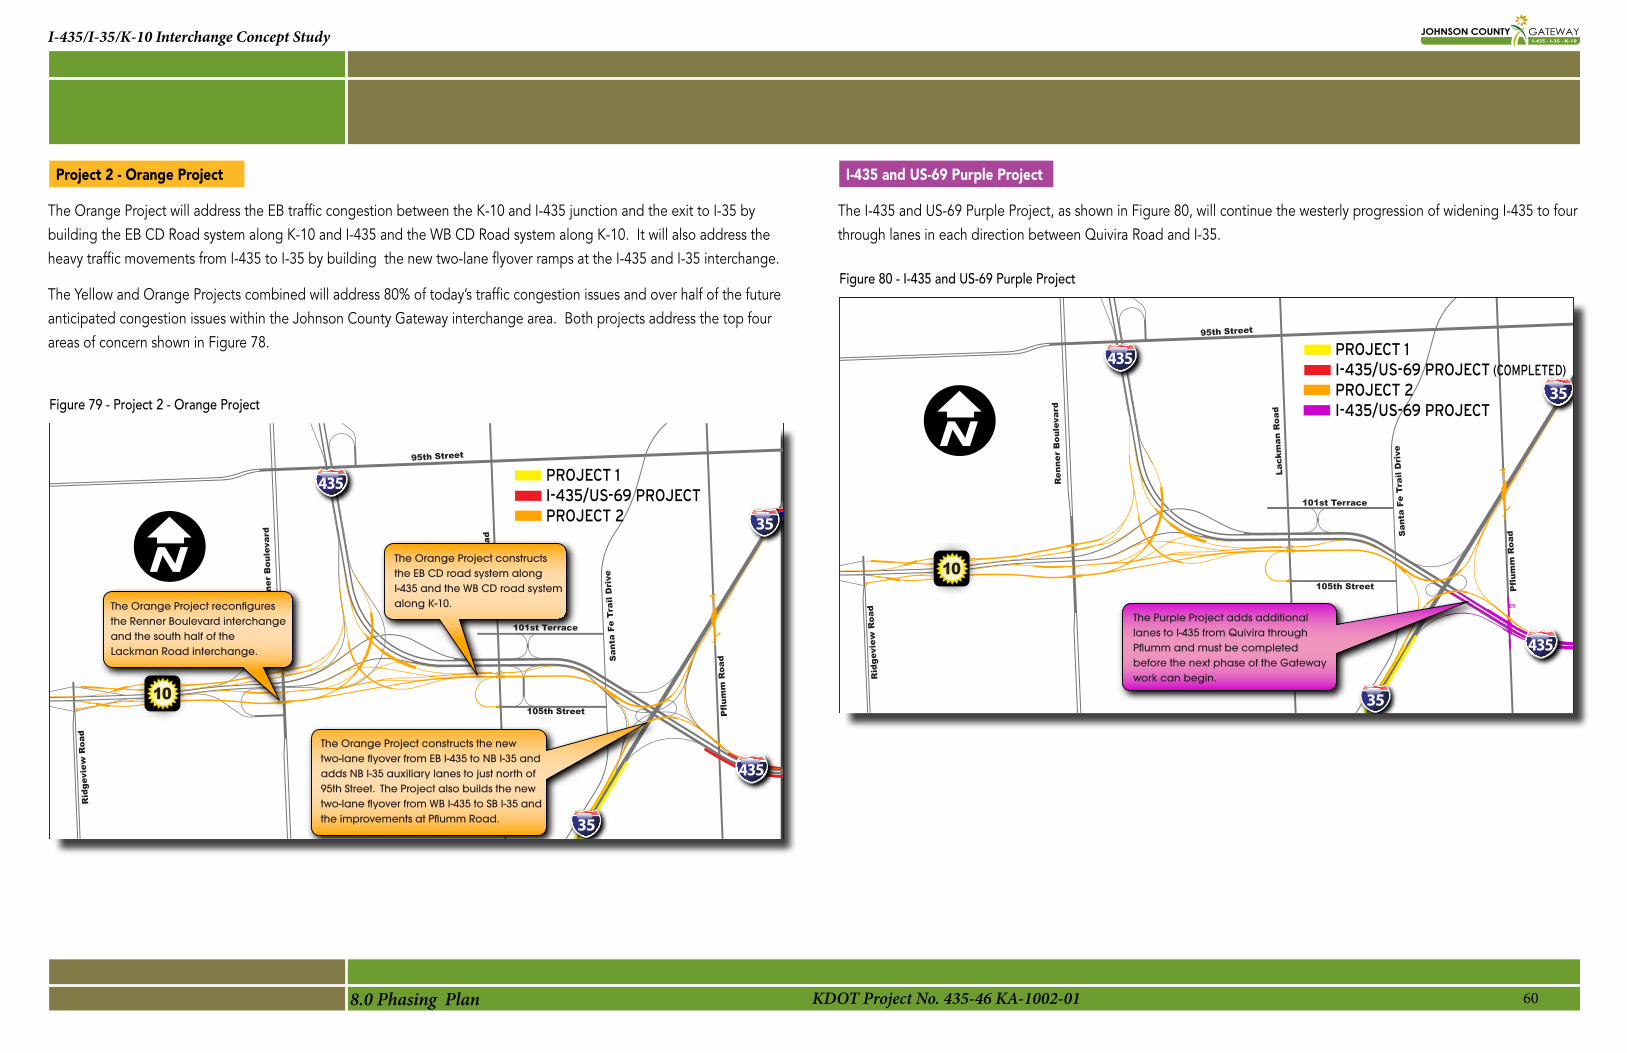
The Orange Project will address the EB traffic congestion between the K-10 and I-435 junction and the exit to I-35 by building the EB CD Road system along K-10 and I-435 and the WB CD Road system along K-10. It will also address the heavy traffic movements from I-435 to I-35 by building the new two-lane flyover ramps at the I-435 and I-35 interchange.
The Yellow and Orange Projects combined will address 80% of today’s traffic congestion issues and over half of the future anticipated congestion issues within the Johnson County Gateway interchange area. Both projects address the top four areas of concern shown in Figure 78.
I-435 and US-69 Purple Project
The I-435 and US-69 Purple Project, as shown in Figure 80, will continue the westerly progression of widening I-435 to four through lanes in each direction between Quivira Road and I-35.
Figure 79 - Project 2 - Orange Project
PROJECT 1I-435/US-69 PROJECTPROJECT 2
The Orange Project constructs the new two-lane flyover from EB I-435 to NB I-35 and adds NB I-35 auxiliary lanes to just north of 95th Street. The Project also builds the new two-lane flyover from WB I-435 to SB I-35 and the improvements at Pflumm Road.
10
435
435
35
35
Rid
gevi
ew R
oad
Lac
kman
Roa
d
Pfl
umm
Roa
dSan
ta F
e Tr
ail D
rive
Ren
ner
Bou
leva
rd
95th Street
105th Street
101st Terrace
The Orange Project reconfigures the Renner Boulevard interchange and the south half of the Lackman Road interchange.
The Orange Project constructs the EB CD road system along I-435 and the WB CD road system along K-10.
10
435
435
35
35
Rid
gevi
ew R
oad
Lac
kman
Roa
d
Pfl
umm
Roa
dSan
ta F
e Tr
ail D
rive
Ren
ner
Bou
leva
rd
95th Street
105th Street
101st Terrace
The Purple Project adds additional lanes to I-435 from Quivira through Pflumm and must be completed before the next phase of the Gateway work can begin.
Besides providing additional mainline capacity to I-435 and K-10, the Green Project, as shown in Figure 81, constructs the K-10 and Ridgeview Road interchange and completes the K-10 and Renner Boulevard interchange. The Green Project, in combination with the Orange and Yellow Projects, addresses nearly 80% of the future anticipated congestion issues within the interchange area.
Project 4 – Red Project
The Red Project, as shown in Figure 82, completes the improvements by addressing all the remaining traffic issues within the interchange area. This includes building the WB I-435 CD Road system and the remaining work on I-435 to the north. It also includes the new NB I-35 to WB I-435 flyover ramp and SB widening of I-35 north of I-435. Finally, the Red Project reconfigures the I-435 and 95th Street interchange and completes the I-435 and Lackman Road interchange.
Figure 81 - Project 3 - Green Project Figure 82 - Project 4 - Red Project
PROJECT 1PROJECT 2I-435/US-69 PROJECTPROJECT 3
10
435
435
35
35
Rid
gevi
ew R
oad
Lac
kman
Roa
d
Pfl
umm
Roa
dSan
ta F
e Tr
ail D
rive
Ren
ner
Bou
leva
rd
95th Street
105th Street
101st Terrace
The Green Project improves mainline capacity along K-10 from Woodland to I-435 and along I-435 from K-10 to I-35.
The Green Project completes the interchange improvements at Renner and Ridgeview.
The Green Project utilizes existing WB I-435 /WB K-10 as an interim WB CD road.
Figure 83 summarizes the various colored phases of both the Johnson County Gateway and the I-435 and US-69 interchange projects.
8.1.3 Construction Phasing SquenceA potential timeline showing the duration of each phase and the sequencing of all the phases was also developed, as shown in Figure 84. This timeline includes all Johnson County Gateway project phases in the upper half and the affected I-435 and US-69 phases in the lower half. This timeline is dependent on future programming decisions as well as the progress of design, right-of-way acquisition, and utility relocations.
The Yellow Project is the only phase of the Johnson County Gateway interchange improvements which is currently programmed for construction, it is scheduled to let in February 2012. The I-435 and US-69 Red Project will also be let in 2011. Construction of the I-435/US-69 Red Project and the Gateway Yellow Project auxiliary lanes would all occur in 2012. The schedule of the remaining phases of both interchanges is dependent upon available funding.
Figure 83 - Regional Phasing Plan
Figure 84 - Construction Timeline
LENEXA
November 2010
2012 Project 1 - YellowProject 2 - OrangeProject 3 - GreenProject 4 - Red OVERLAND PARK
I-435 & US 69InterchangeProject Area
2005-20082009-20112011-2013BrownPurpleBlueYellow
OLATHE
Ren
ner
Bou
leva
rd
Rid
gevi
ew R
oad
Woo
dlan
d R
oad
Lack
man
Roa
d
35435
435
87th Street
103rd Street
95th Street
119th Street
69Q
uivi
ra R
oad
Ant
ioch
Roa
d
Pfl
umm
Roa
d
Johnson CountyGateway Interchange
Project Area
1
$16 M
$244 M
$191 M
$132 M
$115 M
$51 M
2 3 4 5 6 7 8 9 10 11
Years12 13 14 15 16 17 18 19 20
John
son
Co
unty
Ga
tew
ay
Inte
rcha
nge
Project 1 - Yellow Project**
Project 2 - Orange Project*
Project 3 - Green Project*
Project 4 - Red Project*
I-435 & US-69 Red Project
I-435 & US-69 Purple Project* I-435
& U
S-69
Inte
rcha
nge
* Pending future programming decisions, design, right-of-way and utility relocations.
** Yellow Project programmed for February 2012 letting.
*** Costs shown are 2016 estimated construction costs.
8.2 Interim Traffic AnalysisA traffic analysis at targeted locations was performed to determine the operational performance of interim connections established for each of the colored phases. While the desired levels of service would not be achieved until all the interchange improvements were made, the objective was to make sure that any interim situations did not make traffic operations worse than the baseline condition with no improvements made.
8.2.1 Yellow ProjectPositive traffic operations are expected from the construction of the auxiliary lanes along I-35 with the Johnson County Gateway Yellow Project and construction of the I-435 auxiliary lanes with the I-435 and US 69 Interchange Red Project. These improvements will result in the following benefits as shown in Figure 85:
• Reduced travel times by 2 minutes (37%) in the AM and 3 minutes (45%) in the PM under 2008 traffic conditions. • Traffic is expected to remain near free-flow conditions through 2020 and is not expected to return to current 2008
conditions until between 2025 and 2030. • The Level of Service (LOS) is improved within the construction area from LOS F to LOS C in existing 2008
conditions. There are no secondary traffic impacts from constructing the improvements, meaning that travel speeds increase on the improved roadway segments and do not decrease on unimproved roadway segments within the interchange area.
8.2.2 Orange ProjectThe Orange Project shows an overall improvement in traffic operation over the baseline conditions. With the primary objective of improving eastbound traffic congestion, LOS is significantly improved in the eastbound direction to LOS C or better. In the westbound section, given the downstream constraints of an unimproved K-10 section, westbound traffic operations remain LOS F but with an increase in the throughput (number of vehicles able to travel through the area in the peak hour increased by nearly 600 vehicles, or almost 15% over the baseline).
Adding interim auxiliary lanes between Ridgeview Road and Woodland Road were considered to improve traffic operations. However, with interim upstream and downstream constraints in place, the additional cost could not be justified. Depending on the timing of additional K-10 improvements west of Woodland Road, however, it might be desirable to add an interim westbound auxiliary lane with the Orange Project.
8.2.3 Green ProjectThe Green Project shows overall improvement in traffic operation through the core of the Johnson County Interchange with the exception of westbound K-10. Westbound traffic on K-10 is constrained by the lack of additional improvements to K-10 west of Woodland Road. Until K-10 is widened to its ultimate section west to K-7, traffic will back up as far east as Renner Boulevard.
Northbound traffic on I-435 flows at a good LOS D or better until near the 87th Street interchange after the project transitions back to existing pavement. On southbound/eastbound I-435, all improved segments operate at LOS D or better, including the temporary weave that is introduced between the existing 95th Street on-ramp and the off-ramp to the K-10 and I-35 CD road.
8.0 Phasing Plan
Figure 85 - Yellow Project Plus I-435 and US 69 Red Project Travel Time Results
8.3 Cost EstimatesConceptual cost estimates were developed to determine the cost of each phase of the Johnson County Gateway interchange improvements. These costs were inflated to 2016 dollars to coincide with the project costs included with other T-WORKS projects. The complete cost estimates are included in Appendix C. A summary of the costs are shown in Table 15.
These costs take into account a number of practical improvements which were evaluated as part of the concept study. The total savings to the project was $25 million.
Even with these practical improvements, the cost to reconstruct the interchange is significant. At the same time, however, the economic benefits to the region are even greater. An economic impact analysis was performed by KDOT with the
8.0 Phasing Plan
Table 15 - Johnson County Gateway Cost Estimate
Table 16 - Johnson County Gateway Cost Savings
Grading and Drainage
Surfacing
Walls
Bridges
Signing/Pavement Marking
Lighting and Tra�c Signals
ITS
Tra�c Control
Mine Remediation
Interim Improvements
Subtotal Construction Costs
Contingency (10%)
Total Construction Cost(2010 Dollars)
Total Construction Cost(2016 Dollars)
$2,240,000
$6,799,000
$0
$0
$371,000
$75,000
$131,000
$1,199,000
$858,000
$12,000,000
$1,000,000
$13,000,000
$16,000,000
$39,918,000
$18,205,000
$16,337,000
$81,709,000
$2,333,000
$1,750,000
$1,357,000
$1,547,000
$13,000,000
$8,461,000
$185,000,000
$18,000,000
$203,000,000
$244,000,000
$40,577,000
$34,963,000
$8,574,000
$46,260,000
$4,066,000
$2,500,000
$73,000
$4,229,000
$3,708,000
$145,000,000
$14,000,000
$159,000,000
$191,000,000
$27,124,000
$26,993,000
$11,195,000
$26,637,000
$3,516,000
$2,000,000
$820,000
$2,167,000
$0
$100,000,000
$10,000,000
$110,000,000
$132,000,000
$109,859,000
$86,960,000
$36,106,000
$154,606,000
$10,286,000
$6,325,000
$2,381,000
$9,142,000
$13,000,000
$13,027,000
$442,000,000
$43,000,000
$485,000,000
$583,000,000
Construction Element Yellow Project Orange Project Green Project Red Project Total Project
1. WB K-10 CD Rd
2. K-10 and Ridgeview Road Interchange
3. I-435 and 95th Street Interchange
4. Detention Areas
5. EB Lackman Rd. entrance to I-35
6. SB I-35 to EB I-435 Ramp
7. SB I-435 CD Rd
8. SB I-35 to EB I-435 Flyover
$1 million
$2 million
$1.5 million
$3 million
$2.5 million
$0.5 million
$2 million
$12.5 million
$25 million
Sharp skew resulting in need for tunnel under WB Ridgeview Rd exit.
Conventional diamond interchange requiring widening of Ridgeview bridge to accommo-date turn lanes.
Single Point Diamond Interchange proposed due to space and adjacent intersections.
Signi�cant increase in detention just west of Lackman Rd., increase in size of K-10 and I-435 culvert crossings, and substantial mitigation of downstream impacts.
Separate ramps for SB and NB Lackman tra�c.
30 mph ramp layout require tall retaining walls.
Sharp skew resulting in need for tunnel under SB Renner Rd entrance
Fourth level �yover for SB I-35 to EB I-435 tra�c.
Reduced skew to allow for traditional bridge crossing. Increases right-of-way but reduces structural costs
Implemented Diverging Diamond Interchange which does not require widening Ridgeview Bridge.
Tight Diamond Interchange with reduction of adjacent access to right-in and right-out only.
Smaller increase in detention, smaller increase in culvert sizes, and reduced downstream mitigation by increasing detention with K-10 culvert crossing between Ridgeview Rd. and Renner Rd.
NB and SB Lackman tra�c combined into one loop ramp reducing construction and right-of-way costs.
25 mph ramp requiring much shorter walls.
Reduced skew to allow for traditional bridge crossing reducing structural costs.
Build loop ramp noted in Item No. 5 due to low tra�c volumes and signi�cant reduction in bridge work.
1. Yellow Project and the I-435 and US-69 auxiliary lanes of the Red Project on I-435 between I-35 and Quivira:
• $800+M of additional Gross Regional Product plus Traveler Benefit• Creation of 1,300+ jobs
2. Total Gateway Project: (Including Orange, Green and Red Phases)
• $1.2+B of additional Gross Regional Product plus Traveler Benefit• Creation of 3,500+ jobs
The economic analysis evaluated factors to develop these benefits, but it is worth noting:
• These benefits are based on the comparison of two situations; the Build and No-Build situations.These are the benefits in year 2035, but are reported in 2010 dollars (basically, it’s a look into the future, but in current dollars).
• Approximately 1,300 to 3,500 jobs can be directly attributed to these projects.• These numbers are a result of improved travel time, congestion relief, safety improvements, improved reliability,
and expansion of markets areas.• These are permanent jobs, not simply construction jobs, while construction jobs are created, they are not reported
in these numbers.
8.4 SummaryThe proposed Phasing Plan addresses the identified needs and priorities as currently documented. It is important to remember that this plan will need to be revisited as needs and priorities change over time. Examples of changes that may occur include the availability of funding, new local and regional developments and street projects, condition of the existing pavement and bridges, and unanticipated changes to traffic volumes and travel patterns.
More specifically regarding new street projects, as new projects come up within the interchange area the following considerations will need to be made:
• Does this project compliment or contradict the goals of the Gateway plan?• Is there a need for the project today and will the cost be a ‘throw away’ cost?• If it is, how do we justify it in the short-term?• Does it impact the overall Gateway plan?
Therefore, the Johnson County Gateway report is an important tool that provides a roadmap for future improvements. At the same time, it needs to be a living document that adapts to the changing environment.