Thesis Report On SPUR GEAR TOOTH STRESS ANALYSIS AND STRESS REDUCTION USING STRESS REDUCING GEOMETRICAL FEATURES Submitted in the partial fulfillment of requirement for the award of the degree of Master of Engineering IN CAD/CAM AND ROBOTICS Submitted by MANOJ HARIHARAN Roll No. : 8048113 Under the guidance of Mr. A. S. JAWANDA Assistant Professor TIET, Patiala Department of Mechanical EngineeringTHAPAR INSTITUTE OF ENGINEERING AND TECHNOLOGY (DEEMED UNIVERSITY) PATIALA (PUNJAB)-147004 2006
Transcript
8/18/2019 8048113 ono
http://slidepdf.com/reader/full/8048113-ono 1/86
Thesis Report
On
SPUR GEAR TOOTH STRESS ANALYSIS AND STRESS
REDUCTION USING STRESS REDUCING GEOMETRICALFEATURES
Submitted in the partial fulfillment of requirement for the award of thedegree of
Master of Engineering
IN
CAD/CAM AND ROBOTICS
Submitted by
MANOJ HARIHARANRoll No. : 8048113
Under the guidance of
Mr. A. S. JAWANDAAssistant Professor
TIET, Patiala
Department of Mechanical Engineering THAPAR INSTITUTE OF ENGINEERING AND TECHNOLOGY
(DEEMED UNIVERSITY)PATIALA (PUNJAB)-147004
2006
8/18/2019 8048113 ono
http://slidepdf.com/reader/full/8048113-ono 2/86
CERTIFICATE
This is to certify that the thesis report entitled SPUR GEAR TOOTH STRESS
ANALYSIS AND STRESS REDUCTION USING STRESS REDUCING GEOMETRICALFEATURES submitted by Mr. MANOJ HARIHARAN in the partial fulfillment of the
requirement for the award of the degree ofMaster of Engineering in CAD/CAM AND
ROBOTICS to Thapar Institute of Engineering and Technology (Deemed
University), Patiala, is a record of candidate’s own work carried out by him under my
supervision and guidance. The matter embodied in this report has not been submitted in
part or full to any other university or institute for the award of any degree.
(Mr. A. S. JAWANDA)
Assistant Professor,
Mechanical Engineering Department.
Thapar Institute of Engg. &Technology,
Patiala
(Dr. S.K. MOHAPATRA) (Dr T. P. SINGH)
Professor and Head, Dean of Academic Affairs
Mechanical Engineering Department. Thapar Institute of Engg .& Technology
Thapar Institute of Engg. &Technology Patiala
Patiala
8/18/2019 8048113 ono
http://slidepdf.com/reader/full/8048113-ono 3/86
ACKNOWLEDGEMENT
I express my sincere gratitude to my guide, Mr. A. S. JAWANDA, Assistant Professor,
Mechanical Engg. Department at Thapar Institute of Engineering & Technology, for their
valuable guidance, proper advice, painstaking and constant encouragement during the
course or my work on this seminar.
I also feel very much obliged to Dr. S.K MOHAPATRA, Professor & Head, Department
of Mechanical Engg. for his encouragement and inspiration for execution of the seminar
work.
I am deeply indebted to my parents for their inspiration and ever encouraging moral
support, which enabled me to pursue my studies.
I am also very thankful to the entire faculty and staff members of Mechanical engineering
Department for their direct–indirect help and cooperation.
Dated: MANOJ HARIHARAN
(ROLL NO. 8048113)
8/18/2019 8048113 ono
http://slidepdf.com/reader/full/8048113-ono 4/86
ABSTRACT
Gears have a wide variety of applications. Their applications vary from
watches to very large mechanical units like the lifting devices and automotives.
Gears generally fail when the working stress exceeds the maximum permissible
stress. Number of studies has been done by various authors to analyse the gear
for stresses. Gears have been analysed for different points of contact on the
tooth profile and the corresponding points of contact on the pinion.
In this study the technology of gears is presented along with the various
types of failures that gears have. The causes of these failures are studied andone type of stress related failure due to fatigue failure of a gear tooth due to
stress concentration is detailed. Various studies have been done for variation of
moment. Studies have also been done to find the highest point single tooth
contact. The point after being found is point of application of force. Then the
variation stress in root fillet region is found, which is then used for the study of
variation of various parameters of stress reducing features. The effect and use of
stress relief feature in geometry of gear is studied as reported by researchers.
A study of the optimum size and location of the stress relief features for
pinion and gear is proposed which help in reducing the fatigue failure in gears.
8/18/2019 8048113 ono
http://slidepdf.com/reader/full/8048113-ono 5/86
List of Figures
Sr. No. Figure Title Page
Figure 1.1 Law of Gearing 2
Figure 1.2 Generation of an involute and involute action 4
Figure 1.3 Construction of an Involute curve 5
Figure 1.4 Tooth Action 5
Figure 1.5 Spur gears 6
Figure 1.6 Rack and Pinion gears 7
Figure 1.7 Gear Nomenclature 8
Figure 1.8 Circles of a Gear Layout 12
Figure 1.9 Definition for lowest and highest point of single tooth contact 12
Figure 1.10 S N Curve 15
Figure 1.11 Bending fatigue (N vs Sf ) 15
Figure 1.12 Case hardening of gears 17
Figure 1.13 Effect of Case Surface treatments on fatigue failure 17
Figure 1.14 Endurance limit vs. Tensile strength 18
Figure 4.3 Global sensitivity analysis m=2 T=25 30
Figure 4.4 Global sensitivity analysis m=2 T=50 31
Figure 4.5 Method to find H 32
Figure 4.6 Variation of H DIA M=2 P=50 33
Figure 4.7 Variation of H DIA M=2 P=100 34
Figure 4.8 Variation of H DIA M=5 P=90 34
Figure 4.9 Variation of H DIA M=5 P=350 35
Figure 4.10 Variation of H DIA M=6 P=108 35
Figure 4.11 Variation of H DIA M=6 P=360 36
Figure 4.12 Variation of H DIA M=7 P=140 36
Figure 4.13 Variation of H DIA M=7 P=350 37
8/18/2019 8048113 ono
http://slidepdf.com/reader/full/8048113-ono 6/86
8/18/2019 8048113 ono
http://slidepdf.com/reader/full/8048113-ono 7/86
Figure 4.42 Graph showing effect of variation of hole size at tooth center56
Figure 4.43 Variation along curve 1&557
Figure 4.44 Fillet stress vs. parametric placement of holes on curves 1 / 5 58
Figure 4.45 Graph of fillet stress vs. hole axis offset for dia 0.2 mm 59
Figure 4.46 Graph of deflection vs. hole axis offset for dia 0.2 mm 59
Figure 4.47 Graph of fillet stress vs. hole axis offset for dia 0.5 mm 60
Figure 4.48 Graph of deflection vs. hole axis offset for dia 0.5 mm 60
Figure 4.49 Graph of fillet stress vs. hole axis offset for dia 0.8 mm 61
Figure 4.50 Graph of deflection vs. hole axis offset for dia 0.8 mm 61
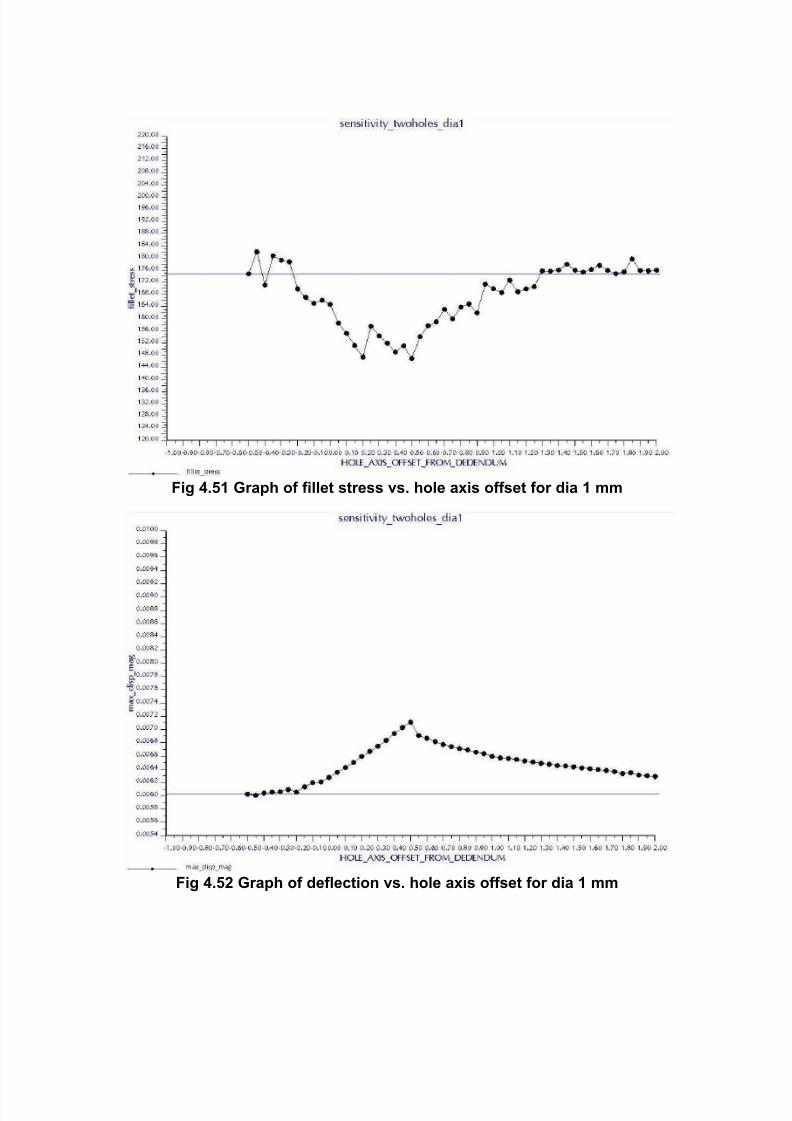
Figure 4.51 Graph of fillet stress vs. hole axis offset for dia 1 mm 62
Figure 4.52 Graph of deflection vs. hole axis offset for dia 1 mm 62
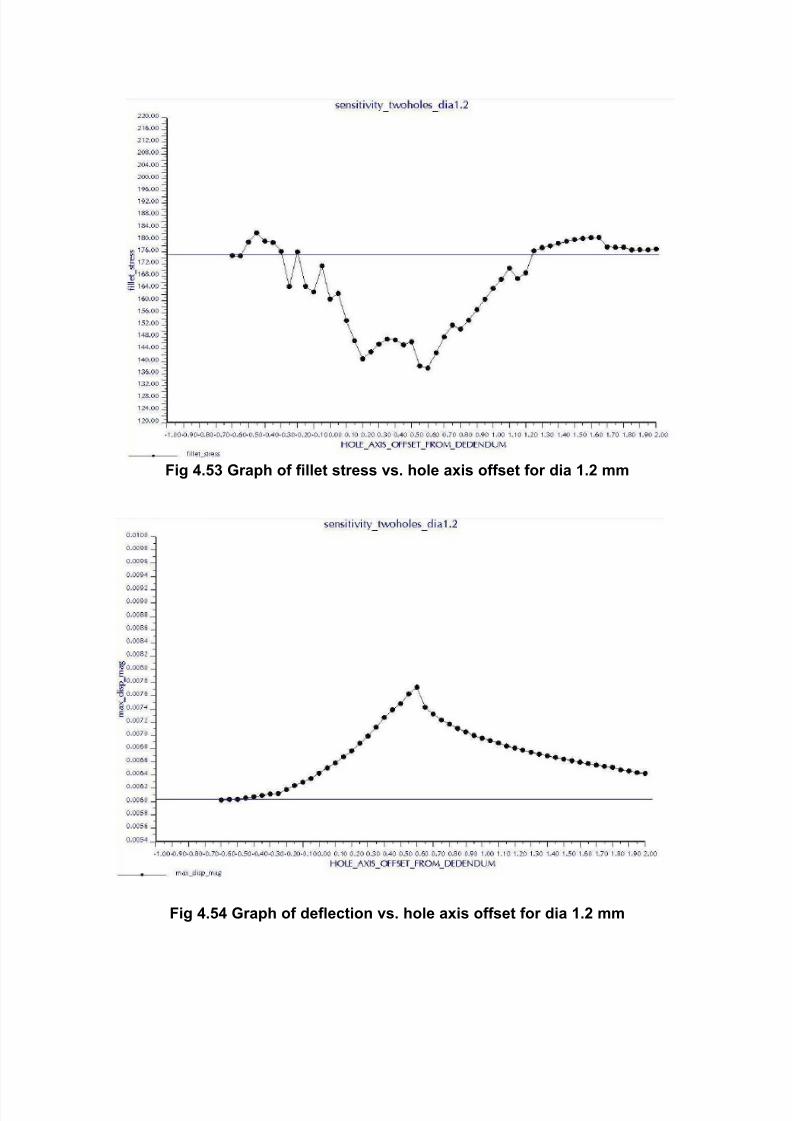
Figure 4.53 Graph of fillet stress vs. hole axis offset for dia 1.2 mm 63
Figure 4.54 Graph of deflection vs. hole axis offset for dia 1.2 mm 63
Figure 4.55 Graph of fillet stress vs. hole axis offset for dia 1.4 mm 64
Figure 4.56 Graph of deflection vs. hole axis offset for dia 1.4 mm 64
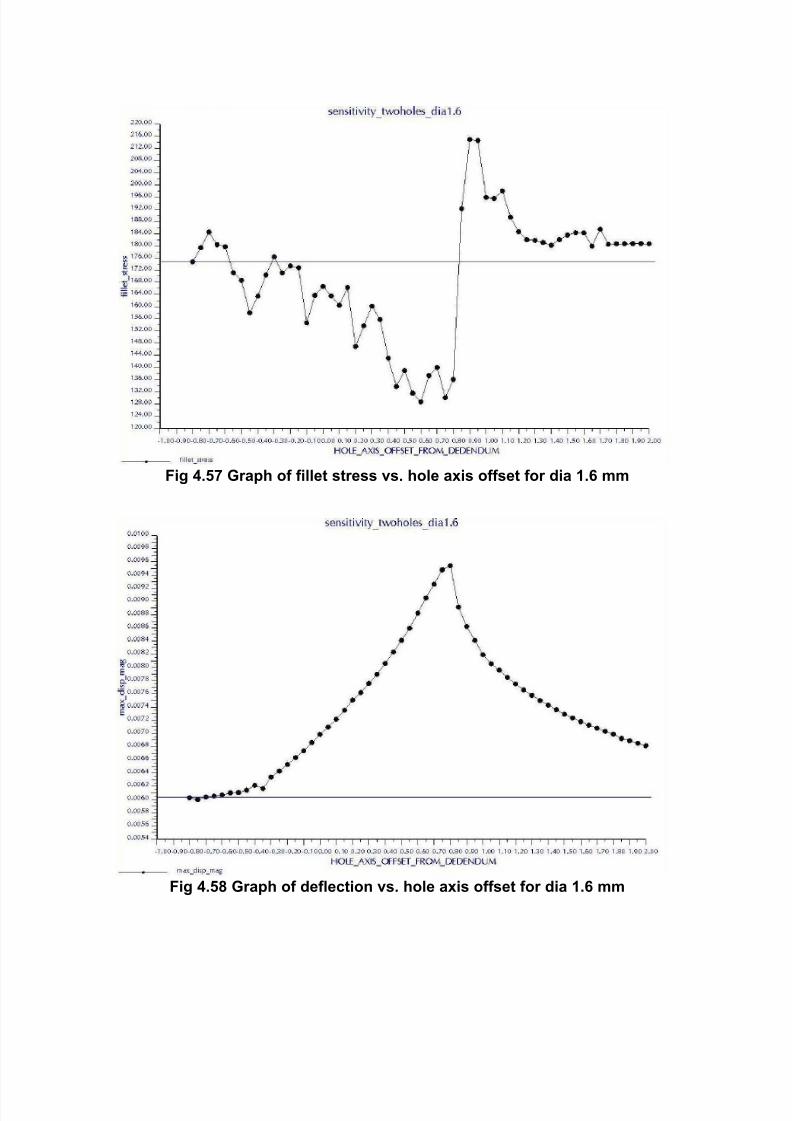
Figure 4.57 Graph of fillet stress vs. hole axis offset for dia 1.6 mm 65
Figure 4.58 Graph of deflection vs. hole axis offset for dia 1.6 mm 65
Figure 4.59 Graphs of fillet stress and deflection for offset = 0.1 X Hole dia 67
Figure 4.60 Graphs of fillet stress and deflection for offset = 0.15 X Hole dia 67Figure 4.61 Graphs of fillet stress and deflection for offset = 0.2 X Hole dia 68
Figure 4.62 Graphs of fillet stress and deflection for offset = 0.25 X Hole dia 68
Figure 4.63 Graphs of fillet stress and deflection for offset = 0.3 X Hole dia 69
Figure 4.64 Graphs of fillet stress and deflection for offset = 0.35 X Hole dia 69
Figure 4.65 Graphs of fillet stress and deflection for offset = 0.4 X Hole dia 70
Figure 4.66 Graphs of fillet stress and deflection for offset = 0.45 X Hole dia 70
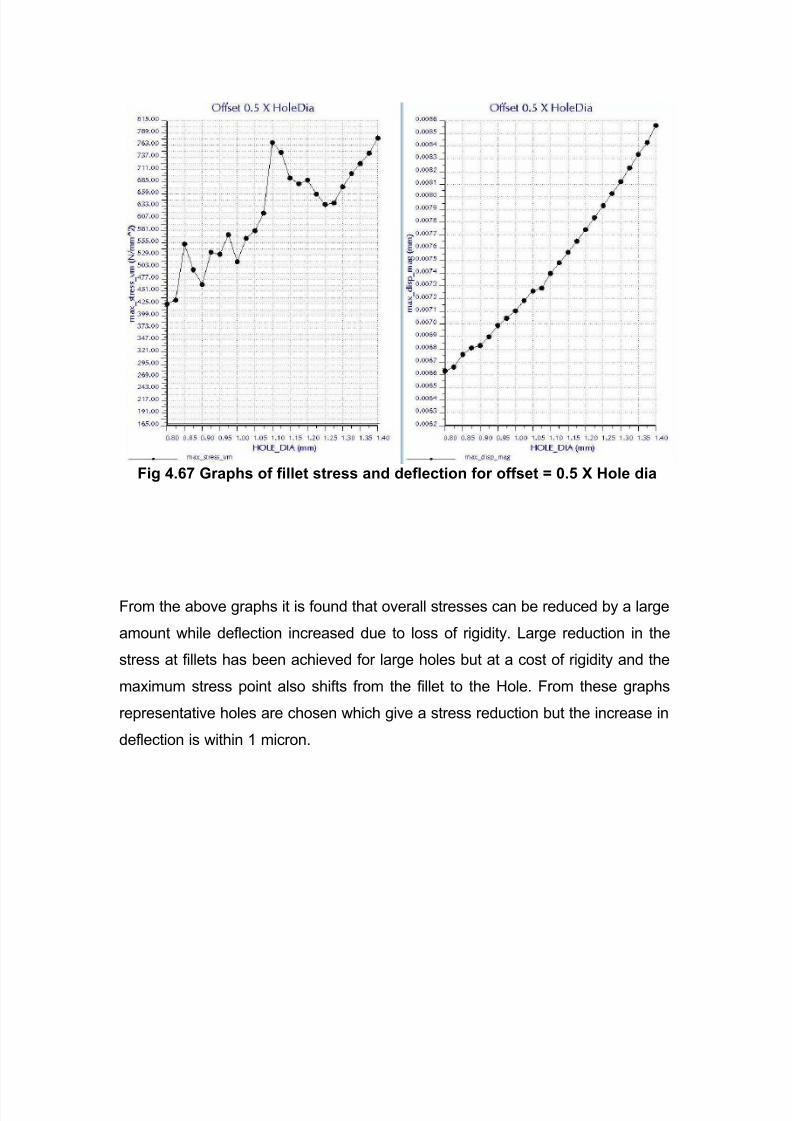
Figure 4.67 Graphs of fillet stress and deflection for offset = 0.5 X Hole dia 71
Figure 4.68 Optimized Model of gear tooth 72
Figure 4.69 Showing fatigue analysis on Dia 1.025 offset 0.15 X Hole dia 73
Figure 4.70 Showing fatigue analysis on gear without hole 73
8/18/2019 8048113 ono
http://slidepdf.com/reader/full/8048113-ono 8/86
INDEX
CERTIFICATE i
ACKNOWLEDGEMENT ii
ABSTRACT iii
LIST OF FIGURES iv
CHAPTER-1 INTRODUCTION
FIGURE 1.10 GEAR TECHNOLOGY
FIGURE 1.11 CONJUGATE ACTION
FIGURE 1.12 SPUR GEARS
FIGURE 1.13 GEAR NOMENCLATUREFIGURE 1.14 HIGHEST POINT OF SINGLE TOOL
CONTACT
FIGURE 1.15 GEAR DESIGN PROCEDURE
FIGURE 1.16 FATIGUE FAILURE IN GEARS
FIGURE 1.17 DESIGN AGAINST FATIGUE
FIGURE 1.18 FACTORS THAT AFFECT FATIGUE
LIFE AND SOLUTIONS
FIGURE 1.19 ENDURANCE LIMIT
FIGURE 1.20 CONTACT RATIO
1
1
3
6
812
13
14
16
16
17
18
CHAPTER-2 LITERATURE REVIEW 20
CHAPTER-3 PROBLEM DEFINITION
3.1 IMPLEMENTATION
26
26
CHAPTER-4 RESULTS AND DISCUSSION
4.1 EXPERIMENTATION AND STUDIES4.2 FINAL CONCLUSION
4.3 SCOPE FOR FURTHER WORK
29
29
74
74
REFERENCES 75
8/18/2019 8048113 ono
http://slidepdf.com/reader/full/8048113-ono 9/86
CHAPTER-1
INTRODUCTION
1.1 GEAR TECHNOLOGY
Gears are the most common means of transmitting power in the modern
mechanical engineering world. They vary from a tiny size used in watches to the
large gears used in watches to the large gears used in lifting mechanisms and
speed reducers. They form vital elements of main and ancillary mechanisms inmany machines such as automobiles, tractors, metal cutting machine tools etc.
Toothed gears are used to change the speed and power ratio as well as direction
between input and output.
Law of Gearing
A primary requirement of gears is the constancy of angular velocities or
proportionality of position transmission. Precision instruments require positioning
fidelity. High-speed and/or high-power gear trains also require transmission at
constant angular velocities in order to avoid severe dynamic problems. Constant
velocity (i.e., constant ratio) motion transmission is defined as "conjugate action"
of the gear tooth profiles. A geometric relationship can be derived for the form of
the tooth profiles to provide conjugate action, which is summarized as the Law of
Gearing as follows:
"A common normal to the tooth profiles at their point of contact must, in all
positions of the contacting teeth, pass through a fixed point on the line-of-centers
called the pitch point."
Any two curves or profiles engaging each other and satisfying the law of gearing
are conjugate curves.
8/18/2019 8048113 ono
http://slidepdf.com/reader/full/8048113-ono 10/86
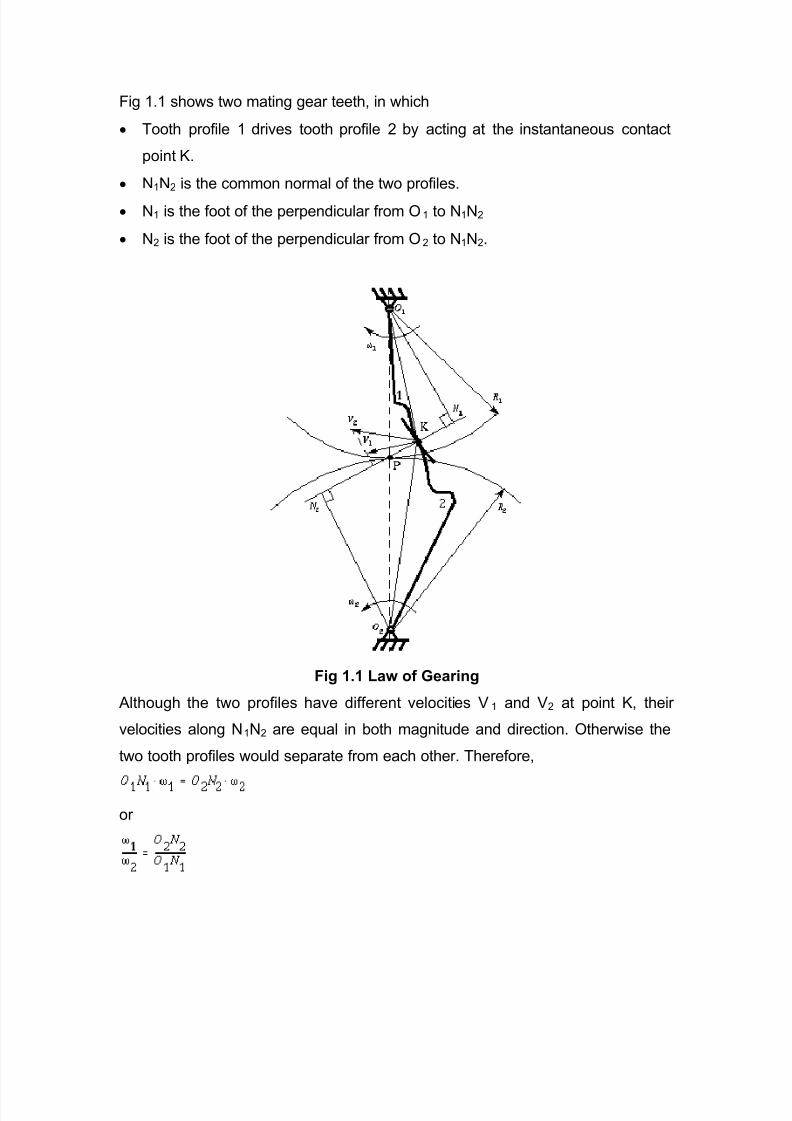
Fig 1.1 shows two mating gear teeth, in which
• Tooth profile 1 drives tooth profile 2 by acting at the instantaneous contact
point K.
• N1N2 is the common normal of the two profiles.
• N1 is the foot of the perpendicular from O1 to N1N2
• N2 is the foot of the perpendicular from O2 to N1N2.
Fig 1.1 Law of Gearing
Although the two profiles have different velocities V1 and V2 at point K, their
velocities along N1N2 are equal in both magnitude and direction. Otherwise the
two tooth profiles would separate from each other. Therefore,
or
8/18/2019 8048113 ono
http://slidepdf.com/reader/full/8048113-ono 11/86
It is noticed that the intersection of the tangency N1N2 and the line of center O1O2
is at point P, and
Thus, the relationship between the angular velocities of the driving gear to thedriven gear, or velocity ratio, of a pair of mating teeth is
Point P is very important to the velocity ratio, and it is called the pitch point. Pitch
point divides the line between the line of centers and its position decides the
velocity ratio of the two teeth. The above expression is the fundamental law of
gear-tooth action.
1.2 Conjugate Action
Mating gear teeth acting against each other to produce rotary motion are similar
to cams. When the tooth profiles, or cams, are designed so as to produce a
constant angular-velocity ratio during meshing, these are said to have conjugate
action. In theory, at least, it is possible arbitrarily to select any profile for one
tooth and then to find a profile for the meshing tooth which will give conjugate
action. One of these solutions is the involute profile, which, with few exceptions,
is in universal use for gear teeth.
There are two forms of tooth profile commonly used:-
a) Cycloidal teeth
b) Involute teeth
An advantage of the cycloidal teeth over the involute one is that wear of
cycloidal tooth is not as fast as with involute tooth. For this reason, gears
transmitting very large amount of power are sometimes cut with cycloidal teeth.
On the other hand, involute teeth are very easy to manufacture and the actual
distance between the centers may deviate slightly from the theoretical distance
without affecting the velocity ratio or general performance. Because of this
8/18/2019 8048113 ono
http://slidepdf.com/reader/full/8048113-ono 12/86
distinct advantage, gears with involute cut teeth are used much more than those
with cycloidal teeth.
Involute properties
There are almost an infinite number of curves that can be developed to satisfy
the law of gearing, and many different curve forms have been tried in the past.
Modern gearing (except for clock gears) is based on involute teeth. This is due to
three major advantages of the involute curve:
5 Conjugate action is independent of changes in center distance.
6 The form of the basic rack tooth is straight-sided, and therefore is
relatively simple and can be accurately made; as a generating tool it
imparts high accuracy to the cut gear tooth.
7 One cutter can generate all gear teeth numbers of the same pitch.
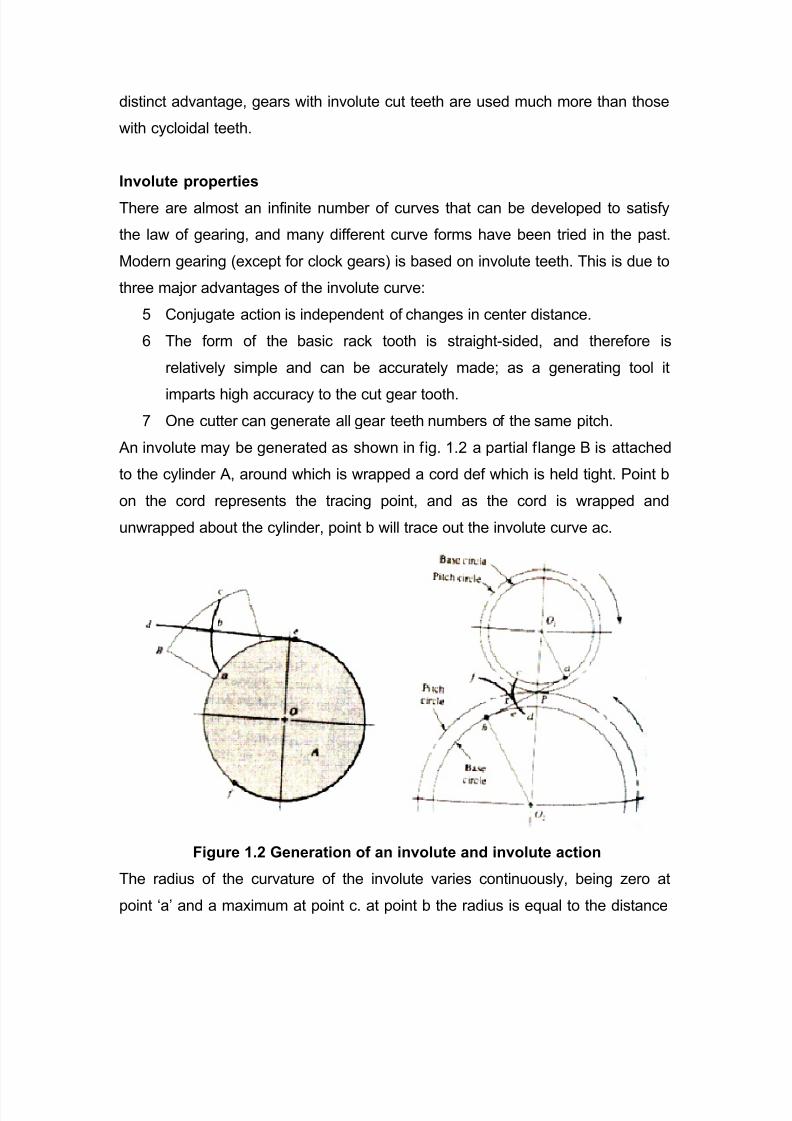
An involute may be generated as shown in fig. 1.2 a partial flange B is attached
to the cylinder A, around which is wrapped a cord def which is held tight. Point b
on the cord represents the tracing point, and as the cord is wrapped and
unwrapped about the cylinder, point b will trace out the involute curve ac.
Figure 1.2 Generation of an involute and involute action
The radius of the curvature of the involute varies continuously, being zero at
point ‘a’ and a maximum at point c. at point b the radius is equal to the distance
8/18/2019 8048113 ono
http://slidepdf.com/reader/full/8048113-ono 13/86
be, since point “be” is instantaneously rotating about point e. Thus generating
line “de” is normal to the involute at all point of intersection and at the same time,
is always tangent to the cylinder A. The circle on which the involute is generated
is called the base circle.
Figure 1.3 Construction of an Involute curve
Figure 1.4 Tooth Action
8/18/2019 8048113 ono
http://slidepdf.com/reader/full/8048113-ono 14/86
The design of the gear is usually done for the permissible bending stress
on which basis the face width of the gear is calculated. The value of the bending
stress is taken equal to the elastic limit of the material in bending divided by a
factor of safety. The value of the factor of safety varies from 1.5 to 3.0 and
depends on the type of application.
For calculating the face width of the gear, the following formula is
considered.
F = W t /K v * m * Y *σ b
Where, F = Face width
Wt = Tangential load
Kv = Velocity factor
m = Module
Y = Lewis form factor
σb = Permissible bending stress
1.3 SPUR GEARS
Fig 1.5 Spur gears
Spur gears: - This is a cylindrical shaped gear in which the teeth are parallel to
the axis. It has the largest applications and, also, it is the easiest to manufacture.
Spur gears are the most common type used. Tooth contact is primarily rolling,
with sliding occurring during engagement and disengagement. Some noise is
normal, but it may become objectionable at high speeds.
8/18/2019 8048113 ono
http://slidepdf.com/reader/full/8048113-ono 15/86
Fig 1.6 Rack and Pinion gears
Rack and pinion: - This is a linear shaped gear which can mesh with a spur
gear with any number of teeth. The spur rack is a portion of a spur gear with an
infinite radius. Rack and pinion gears are essentially a variation of spur gears
and have similar lubrication requirements.
8/18/2019 8048113 ono
http://slidepdf.com/reader/full/8048113-ono 16/86
1.4 GEAR NOMENCLATURE
Fig 1.7 Gear Nomenclature
ADDENDUM (a) is the height by which a tooth projects beyond the pitch circle or
pitch line.
BASE DIAMETER (Db) is the diameter of the base cylinder from which the
involute portion of a tooth profile is generated.
BACKLASH (B) is the amount by which the width of a tooth space exceeds the
thickness of the engaging tooth on the pitch circles. As actually indicated bymeasuring devices, backlash may be determined variously in the transverse,
normal, or axial-planes, and either in the direction of the pitch circles or on the
line of action. Such measurements should be corrected to corresponding values
on transverse pitch circles for general comparisons.
8/18/2019 8048113 ono
http://slidepdf.com/reader/full/8048113-ono 17/86
BORE LENGTH is the total length through a gear, sprocket, or coupling bore.
CIRCULAR PITCH (p) is the distance along the pitch circle or pitch line between
corresponding profiles of adjacent teeth.
CIRCULAR THICKNESS (t) is the length of arc between the two sides of a gear
tooth on the pitch circle, unless otherwise specified.
CLEARANCE-OPERATING (c) is the amount by which the dedendum in a given
gear exceeds the addendum of its mating gear.
CONTACT RATIO (mc) in general, the number of angular pitches through which
a tooth surface rotates from the beginning to the end of contact.
DEDENDUM (b) is the depth of a tooth space below the pitch line. It is normally
greater than the addendum of the mating gear to provide clearance.
DIAMETRAL PITCH (P) is the ratio of the number of teeth to the pitch diameter.
FACE WIDTH (F) is the length of the teeth in an axial plane.
FILLET RADIUS (r f ) is the radius of the fillet curve at the base of the gear tooth.
FULL DEPTH TEETH are those in which the working depth equals 2.000 divided
by the normal diametrical pitch.
GEAR is a machine part with gear teeth. When two gears run together, the one
with the larger number of teeth is called the gear.
HUB DIAMETER is outside diameter of a gear, sprocket or coupling hub.
8/18/2019 8048113 ono
http://slidepdf.com/reader/full/8048113-ono 18/86
HUB PROJECTION is the distance the hub extends beyond the gear face.
INVOLUTE TEETH of spur gears, helical gears and worms are those in which
the active portion of the profile in the transverse plane is the involute of a circle.
LONG- AND SHORT-ADDENDUM TEETH are those of engaging gears (on a
standard designed center distance) one of which has a long addendum and the
other has a short addendum.
KEYWAY is the machined groove running the length of the bore. A similar
groove is machined in the shaft and a key fits into this opening.
OUTSIDE DIAMETER (Do) is the diameter of the addendum (outside) circle.
PITCH CIRCLE is the circle derived from a number of teeth and a specified
diametrical or circular pitch. Circle on which spacing or tooth profiles is
established and from which the tooth proportions are constructed.
PITCH CYLINDER is the cylinder of diameter equal to the pitch circle.
PINION is a machine part with gear teeth. When two gears run together, the one
with the smaller number of teeth is called the pinion.
PITCH DIAMETER (D) is the diameter of the pitch circle. In parallel shaft gears,
the pitch diameters can be determined directly from the center distance and the
number of teeth.
PRESSURE ANGLE (ø) is the angle at a pitch point between the line of pressure
which is normal to the tooth surface, and the plane tangent to the pitch surface.
In involute teeth, pressure angle is often described also as the angle between the
8/18/2019 8048113 ono
http://slidepdf.com/reader/full/8048113-ono 19/86
8/18/2019 8048113 ono
http://slidepdf.com/reader/full/8048113-ono 20/86
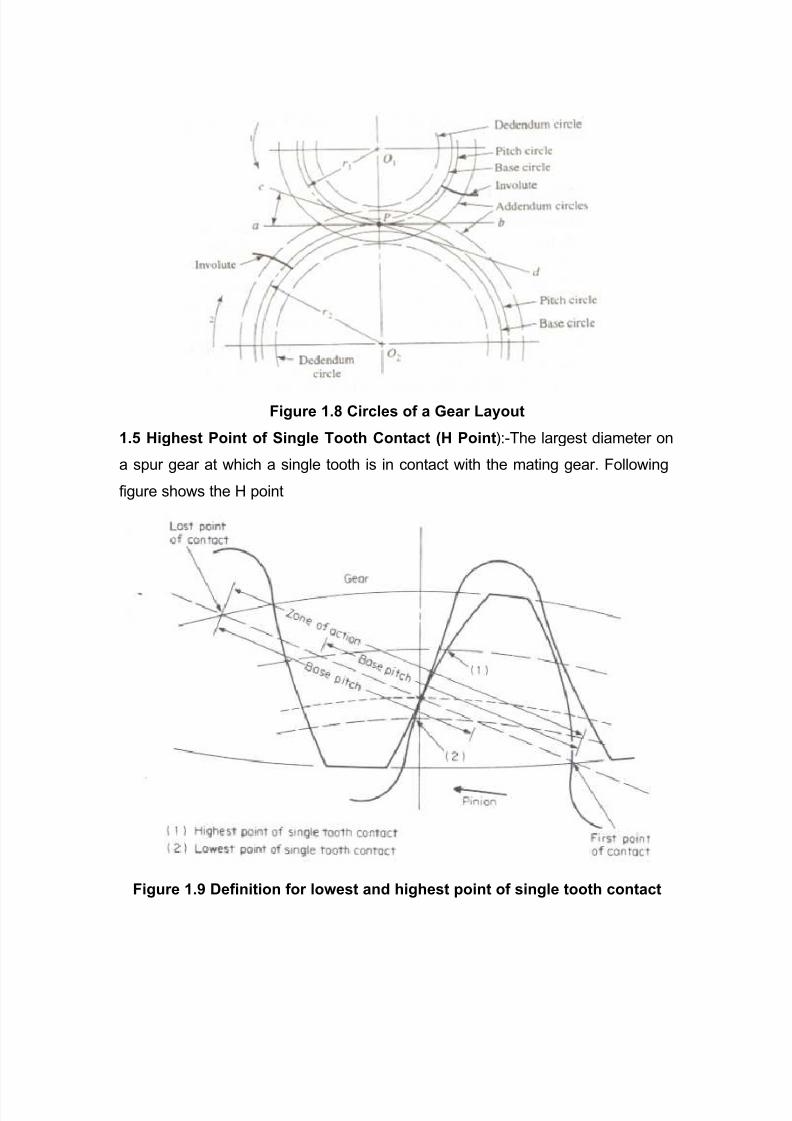
Figure 1.8 Circles of a Gear Layout
1.5 Highest Point of Single Tooth Contact (H Point):-The largest diameter on
a spur gear at which a single tooth is in contact with the mating gear. Following
figure shows the H point
Figure 1.9 Definition for lowest and highest point of single tooth contact
8/18/2019 8048113 ono
http://slidepdf.com/reader/full/8048113-ono 21/86
1.6 GEAR DESIGN PROCEDURE
Following are the formulas used in Gear design:-
1. The Pitch Diameter d mm from the equation d=m x N (10-3)
2. The pitch line velocity V mm/sec. V= πdn/60.
3. The transmitted load Wt in Newton from the equation
Wt=H/V
Where H= power in Watts
4. The velocity factor Kv = 6/( 6+V)
5. The face width F in mm
F= Wt/ (Kv.m.Y.σp )
Where p = permissible bending Stress in the M Pa
6. The minimum and maximum face width 3p and 5p respectively in mm.
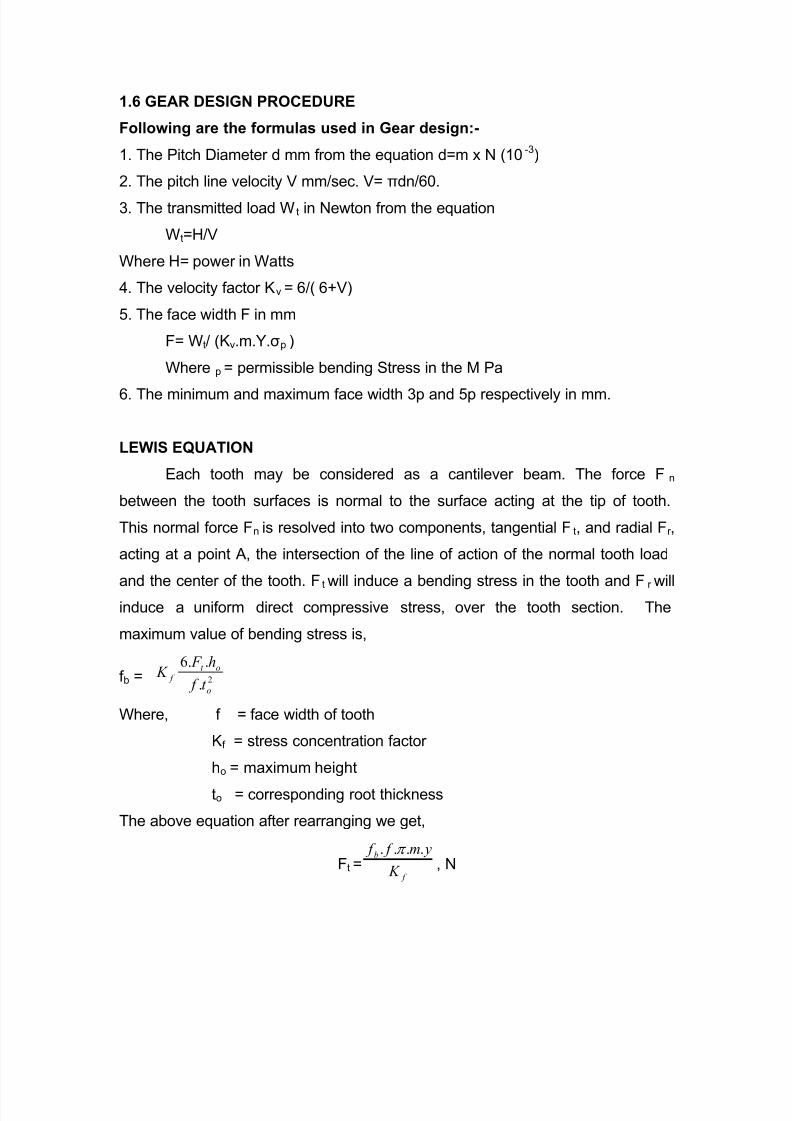
LEWIS EQUATION
Each tooth may be considered as a cantilever beam. The force Fn
between the tooth surfaces is normal to the surface acting at the tip of tooth.
This normal force Fn is resolved into two components, tangential Ft, and radial Fr ,
acting at a point A, the intersection of the line of action of the normal tooth load
and the center of the tooth. Ftwill induce a bending stress in the tooth and F
rwill
induce a uniform direct compressive stress, over the tooth section. The
maximum value of bending stress is,
f b = 2.
..6
o
ot f
t f
h F K
Where, f = face width of tooth
Kf = stress concentration factor
ho = maximum height
to = corresponding root thickness
The above equation after rearranging we get,
Ft = f
b
K
ym f f .... π
, N
8/18/2019 8048113 ono
http://slidepdf.com/reader/full/8048113-ono 22/86
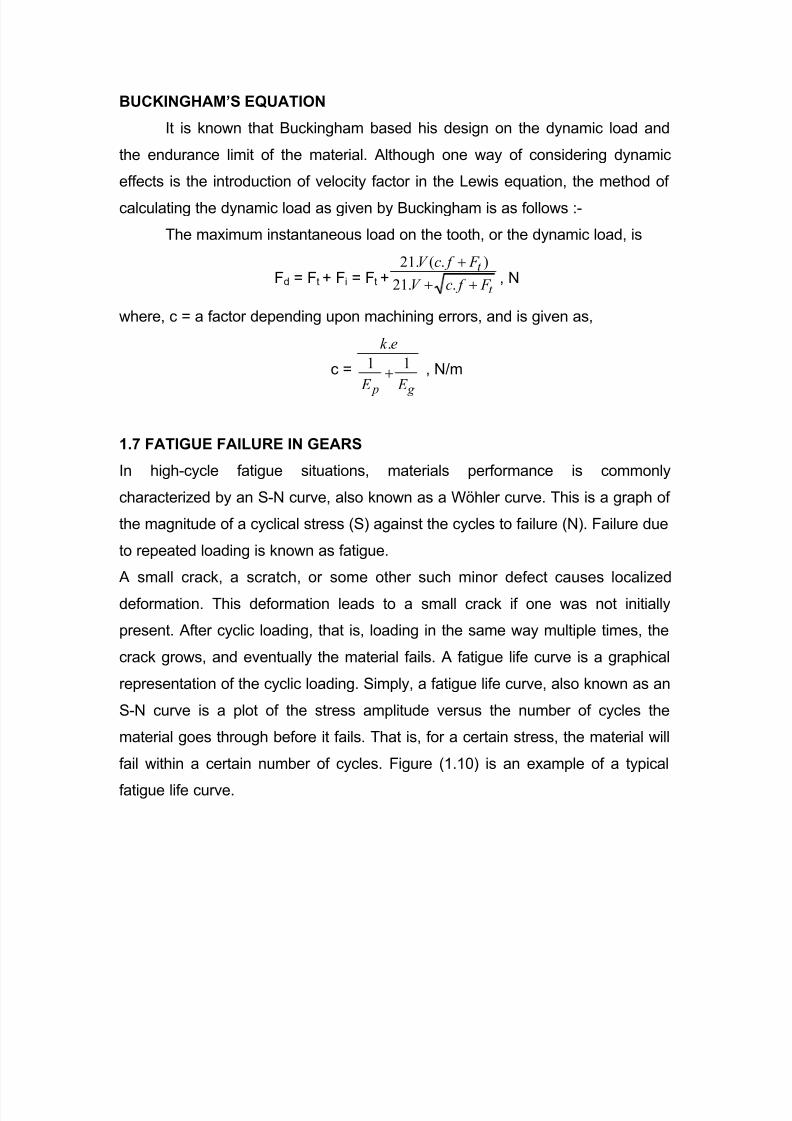
BUCKINGHAM’S EQUATION
It is known that Buckingham based his design on the dynamic load and
the endurance limit of the material. Although one way of considering dynamic
effects is the introduction of velocity factor in the Lewis equation, the method of
calculating the dynamic load as given by Buckingham is as follows :-
The maximum instantaneous load on the tooth, or the dynamic load, is
Fd = Ft + Fi = Ft +t
t
F f cV
F f cV
++
+
..21
).(.21, N
where, c = a factor depending upon machining errors, and is given as,
c =
g p E E
ek
11
.
+ , N/m
1.7 FATIGUE FAILURE IN GEARS
In high-cycle fatigue situations, materials performance is commonly
characterized by an S-N curve, also known as a Wöhler curve. This is a graph of
the magnitude of a cyclical stress (S) against the cycles to failure (N). Failure due
to repeated loading is known as fatigue.
A small crack, a scratch, or some other such minor defect causes localized
deformation. This deformation leads to a small crack if one was not initially
present. After cyclic loading, that is, loading in the same way multiple times, the
crack grows, and eventually the material fails. A fatigue life curve is a graphical
representation of the cyclic loading. Simply, a fatigue life curve, also known as an
S-N curve is a plot of the stress amplitude versus the number of cycles the
material goes through before it fails. That is, for a certain stress, the material will
fail within a certain number of cycles. Figure (1.10) is an example of a typical
fatigue life curve.
8/18/2019 8048113 ono
http://slidepdf.com/reader/full/8048113-ono 23/86
Figure 1.10 S-N Curve
Figure 1.11 Bending fatigue (N vs Sf )
8/18/2019 8048113 ono
http://slidepdf.com/reader/full/8048113-ono 24/86
1.8 Design against fatigue failure
Dependable design against fatigue failure requires thorough education and
supervised experience in mechanical engineering or materials science. There are
three principle approaches to life assurance for mechanical parts that displayincreasing degrees of sophistication:
Figure 1.21 Design to keep stress below threshold of fatigue limit (infinite
lifetime concept);
Figure 1.22 Design (conservatively) for a fixed life after which the user is
instructed to replace the part with a new one (a so-called lifed part, finite
lifetime concept, or "safe-life" design practice);
Figure 1.23 Instruct the user to inspect the part periodically for cracks
and to replace the part once a crack exceeds a critical length. This
approach usually uses the technologies of nondestructive testing and
requires an accurate prediction of the rate of crack-growth between
inspections. This is often referred to as damage tolerant design or
"retirement-for-cause".
1.9 Factors That Affect Fatigue Life and Solutions
The Mean Stress is defined as:
The Mean stress has the affect that as the mean stress is increased, fatigue life
decreases. This occurs because the stress applies is greater. The scratches and
other imperfections on the surface will cause a decrease in the life of a material.Therefore making an effort to reduce these imperfections by reducing sharp
corners, eliminating unnecessary drilling and stamping, shot peening, and most
of all careful fabrication and handling of the material. Another Surface treatment
is called case hardening, which increases surface hardness and fatigue life. This
is achieved by exposing the component to a carbon-rich atmosphere at high
8/18/2019 8048113 ono
http://slidepdf.com/reader/full/8048113-ono 25/86
temperatures. Carbon diffuses into the material filling interstices and other
vacancies in the material, up to 1 mm in depth.
Figure 1.12 Case Hardening of Gears
Figure 1.13 Effect of Case Surface treatments on fatigue failure
1.10 Endurance Limit: - The stress level below which a specimen will withstand
cyclic stress indefinitely without exhibiting fatigue failure. Rigid, elastic, lowdamping materials such as thermosetting plastics and some crystalline
thermoplastics do not exhibit an endurance limit / Fatigue Limit.
8/18/2019 8048113 ono
http://slidepdf.com/reader/full/8048113-ono 26/86
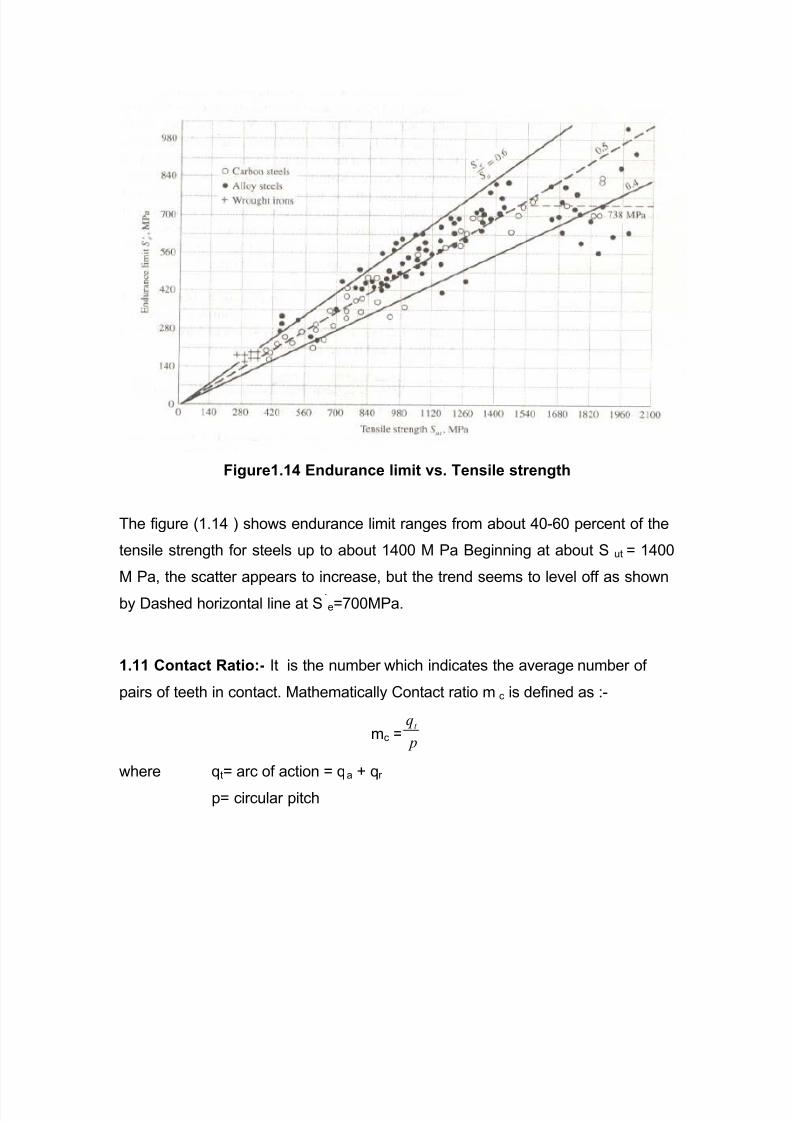
Figure1.14 Endurance limit vs. Tensile strength
The figure (1.14 ) shows endurance limit ranges from about 40-60 percent of the
tensile strength for steels up to about 1400 M Pa Beginning at about Sut = 1400
M Pa, the scatter appears to increase, but the trend seems to level off as shown
by Dashed horizontal line at S`e=700MPa.
1.11 Contact Ratio:- It is the number which indicates the average number of
pairs of teeth in contact. Mathematically Contact ratio mc is defined as :-
mc = p
qt
where qt= arc of action = qa + qr
p= circular pitch
8/18/2019 8048113 ono
http://slidepdf.com/reader/full/8048113-ono 27/86
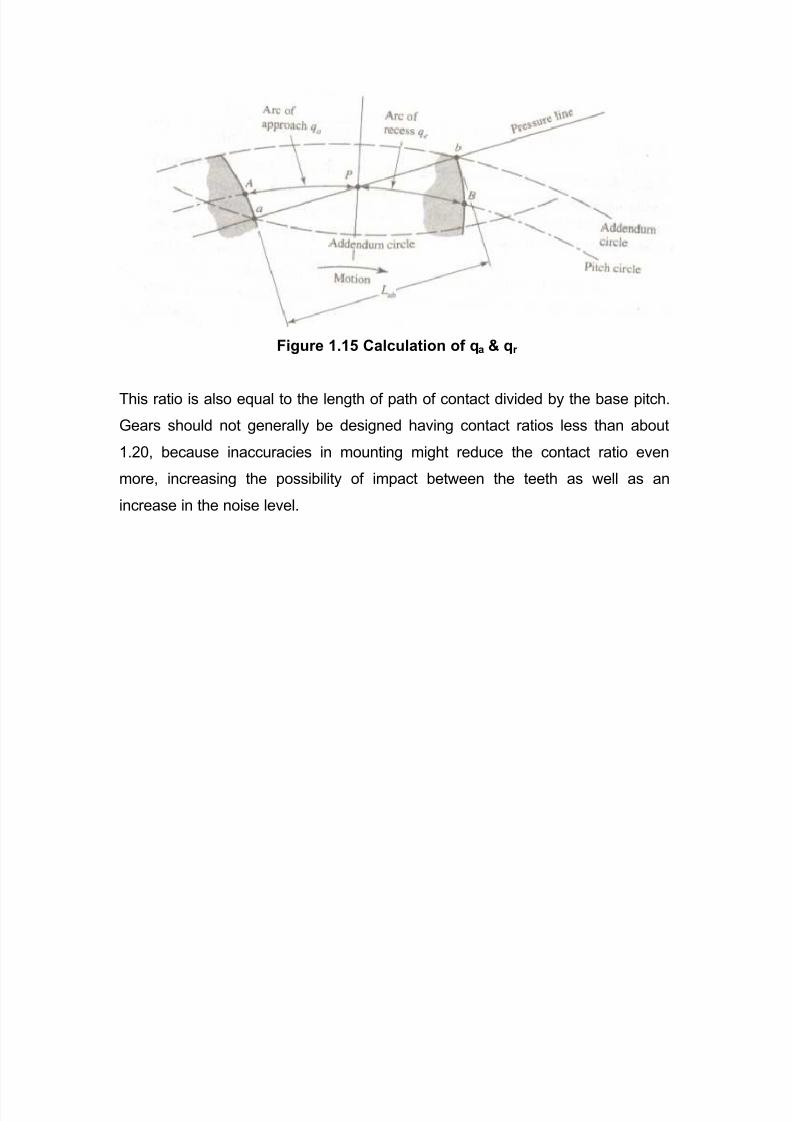
Figure 1.15 Calculation of qa & qr
This ratio is also equal to the length of path of contact divided by the base pitch.
Gears should not generally be designed having contact ratios less than about
1.20, because inaccuracies in mounting might reduce the contact ratio even
more, increasing the possibility of impact between the teeth as well as an
increase in the noise level.
8/18/2019 8048113 ono
http://slidepdf.com/reader/full/8048113-ono 28/86
CHAPTER 2
LITERATURE REVIEW
The Lewis equation, as discussed before, is used for calculating bending
stress for various tangential loads at different points on the tooth profile. The
drawback in the stress analysis of the gear tooth using this equation doesn’t give
the desired results at desired points on the tooth profile. Therefore, investigators,
analyzing the gear tooth for stresses, have done several studies.
Fredette and Brown [11] used holes drilled across the entire tooth as a
function of size and location. The ultimate objective of this work was to find the
overall effect of hole size and location on the critical stresses in the gear.
.Many of these researchers used the finite element analysis techniques for
the analysis of the gear tooth. Wilcox, L [20] gave an analytical method for
calculating stresses in bevel and hypoid gear teeth.
More recently number of authors had also done the analysis of the gears
for the applied bending forces.
Litwin, Chen, Lu, [13] and Handschuh [16] again applied finite element
analysis on a loaded tooth for the determination of load share, real contact ratio,
precision of motion and the stress analysis. It was the work done in parts by
these authors i.e. Litwin did the determination of the load share, real contact ratio
was determined by Chen and Lu and Handschuh did the stress analysis.
A program was given by Gosselin, Claude, Clautier [12] predicting the
motion error of spiral bevel gear sets under load, and explored some of the
influences of the unloaded motion error curve shape and amplitude over the
8/18/2019 8048113 ono
http://slidepdf.com/reader/full/8048113-ono 29/86
kinematical behavior under load. The effects of tooth composite deflection
caused by bending and shearing, tooth contact deformation and initial profile
separation due to profile mismatch were considered in the development.
Chen and Tsai [17] developed a finite element model applied to an
involute gear considering friction effects. The loss of Torque transmission due to
friction and effective friction coefficient were evaluated and computed.
Moriwaki [15] developed a technique named Global Local Finite Element
Analysis (GLFEM) and applied it to a gear tooth for its stress analysis. He
realized that for doing the stress analysis of the gear using the finite element
analysis, a load acts at a point on the tooth profile and for that a fine subdivision
is required at the applied load point. In GLFEM, no fine subdivision is required for
the analysis. This method also guarantees an easy determination of the critical
section. In fact, GLFEM is a numerical analysis technique that combines finite
element solutions and the classical analytical ones on the basis of the energy
principle. The application of finite element method for LTCA was also the subject
of research by Chao and Baxter [19], Drago and Uppaluri [18].
Chen and Tsay [5] investigated the contact stress and bending stress of a
helical gear set with localized bearing contact, by means of finite element
analysis (FEA). They proposed a helical gear set comprised of an involute pinion
and double crowned gear. Mathematical models of the complete tooth geometry
of the pinion and the gear had been derived based on the theory of gearing. A
mesh generation program was also developed for finite element analysis.
Chien-Hsing Li, Hong-Shun Chiou [6] established a batch module
called, ”integration of finite element analysis and optimum design” by taking gear
systems as testing examples. This batch module consisted of I-DEAS,
ABAQUS/Standard and MOST software, which serve as the preprocessor, the
numerical solver and the optimizer, respectively. A simple and practical method
8/18/2019 8048113 ono
http://slidepdf.com/reader/full/8048113-ono 30/86
was developed, through which this module was enabled which would search for
contact nodes and elements and also it would automatically define the contact
surfaces for contact analysis. For the testing example, a simple gear-pair system
and a complete planetary gear system were used for this integrated module. The
module would automatically construct the geometrical model, analyze the contact
stress and solve for the optimal solutions when gearing parameters are input.
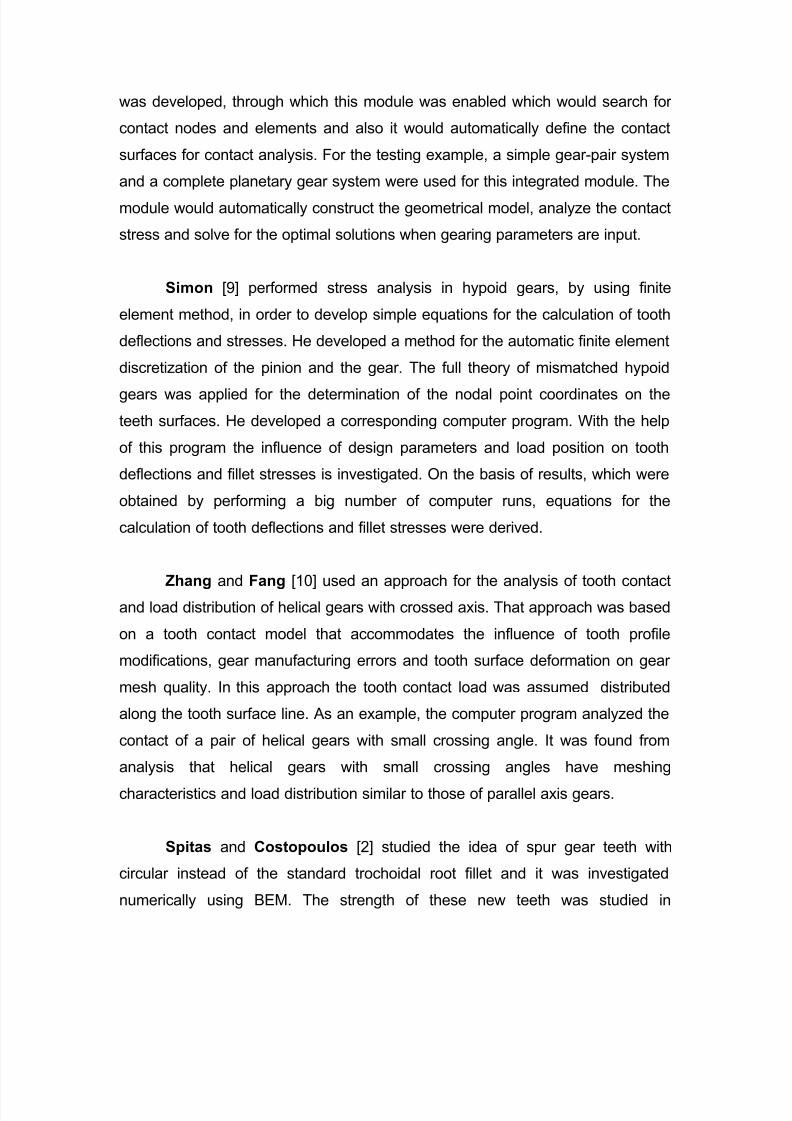
Simon [9] performed stress analysis in hypoid gears, by using finite
element method, in order to develop simple equations for the calculation of tooth
deflections and stresses. He developed a method for the automatic finite element
discretization of the pinion and the gear. The full theory of mismatched hypoid
gears was applied for the determination of the nodal point coordinates on the
teeth surfaces. He developed a corresponding computer program. With the help
of this program the influence of design parameters and load position on tooth
deflections and fillet stresses is investigated. On the basis of results, which were
obtained by performing a big number of computer runs, equations for the
calculation of tooth deflections and fillet stresses were derived.
Zhang and Fang [10] used an approach for the analysis of tooth contact
and load distribution of helical gears with crossed axis. That approach was based
on a tooth contact model that accommodates the influence of tooth profile
modifications, gear manufacturing errors and tooth surface deformation on gear
mesh quality. In this approach the tooth contact load was assumed distributed
along the tooth surface line. As an example, the computer program analyzed the
contact of a pair of helical gears with small crossing angle. It was found from
analysis that helical gears with small crossing angles have meshing
characteristics and load distribution similar to those of parallel axis gears.
Spitas and Costopoulos [2] studied the idea of spur gear teeth with
circular instead of the standard trochoidal root fillet and it was investigated
numerically using BEM. The strength of these new teeth was studied in
8/18/2019 8048113 ono
http://slidepdf.com/reader/full/8048113-ono 31/86
8/18/2019 8048113 ono
http://slidepdf.com/reader/full/8048113-ono 32/86
combined semi-analytical and FEM software had been used for performing
meshing simulations.
Parker and Vijayakar [8] investigated the dynamic response of a spur
gear pair using a finite element/contact mechanics model. The gear pair was
analyzed across a wide range of operating speeds. The non-linearity source was
contact loss of the meshing teeth, which occurred for large torques despite the
use of high precision gears. Using a detailed contact analysis at each time step
as the gears rolled through the mesh, dynamic mesh forces were calculated. A
semi-analytical model near the tooth surface was matched to a finite element
solution away from the tooth surface.
Hiremagalur and Ravani [3] studied the effect of backup ratio in spur
gear root stresses analysis and design. Backup ratio was considered important
in understanding rim failures that start at the tooth root. Here an analytical
approach, based on theory of elasticity, was used to provide a computational
formulation for root stress calculations in spur gears.
Now a day’s composite material finds increasing applications ranging from
spacecraft to small instruments. Many types of gear pump use composite gears,
however little literature is available on their use. Vijayrangan and Ganesan [14]
obtained results by static stress analysis of composite gears using a three-
dimensional finite element approach. Performance of two orthotropic material
gears were presented and compared with mild steel gear. From the results it was
concluded that composite material such as graphite/epoxy could be thought of as
a material for power transmission gears.
Dally and Riley [23] tried to minimize the stress in a finite plate by drilling a hole
in it. They optimized the hole profile for minimizing the photo elastic stress. For
optimization they used the software ANSYS 5.3. They not only did their study on a hole
profile but also on the square profile and got the results.
8/18/2019 8048113 ono
http://slidepdf.com/reader/full/8048113-ono 33/86
The idea of using holes to reduce stresses is not a new one. In 1990,
Dippery experimented with the use of supplementary holes in a structure as a
method of reducing the stress concentration that was already present. His result
showed that stress concentration reductions are possible in a generic shape
using holes as stress relief.
Yang [22] showed that similar reductions are possible in gears. His work
was limited to hole placement in the region of relatively low stress of the bending
gear tooth.
CHAPTER 3
8/18/2019 8048113 ono
http://slidepdf.com/reader/full/8048113-ono 34/86
PROBLEM DEFINITION
Gears which are very rigid develop high stress concentration at the root
and contact point when subjected to loads. Due to these high stresses at the rootand contact point there is a higher chance of fatigue failure at these locations. As
the contact point shifts along the profile of the tooth a surface fatigue failure is
more likely but the quick shifting of the load and enhanced material properties
due to surface treatments means that this failure is not as critical. The repeated
stress that occurs on the fillets is practically found to be the deciding factor in
fatigue failure of the gear tooth. There is scope of improved design of gears by
an introduction of stress relief features. These reduce stiffness which causes a
more distributed lower stress at the fillets increases gear life. Stress relief
features provide flexibility and help in reducing the points of stress concentration.
It is proposed to investigate the effect of stress relief features of different size,
shape, location and number. A study is done for spur gear with involute profile
shapes for effects of stress relief feature of hole. The work done by Fredette L.
and Brown M [11] is to be studied and furthered in this work.
3.1 Implementation
Hardware Used: - Pentium 4 CPU 3.00GHz 256 MB of RAM, Display 64 MB.
Software Used:-
All the modeling is done in the CAD/CAE software Pro-Engineer Wildfire 3.0 and
the analysis is done in Pro-Mechanica Wildfire 3.0.
Experiments and Studies
Four different studies are done on spur gears having different
specifications.
The following are the specifications of the gear that have been used for
the analysis. All the gears have pressure angle (ø) 20°, they use the general
formulas of gear design as follows:-
8/18/2019 8048113 ono
http://slidepdf.com/reader/full/8048113-ono 35/86
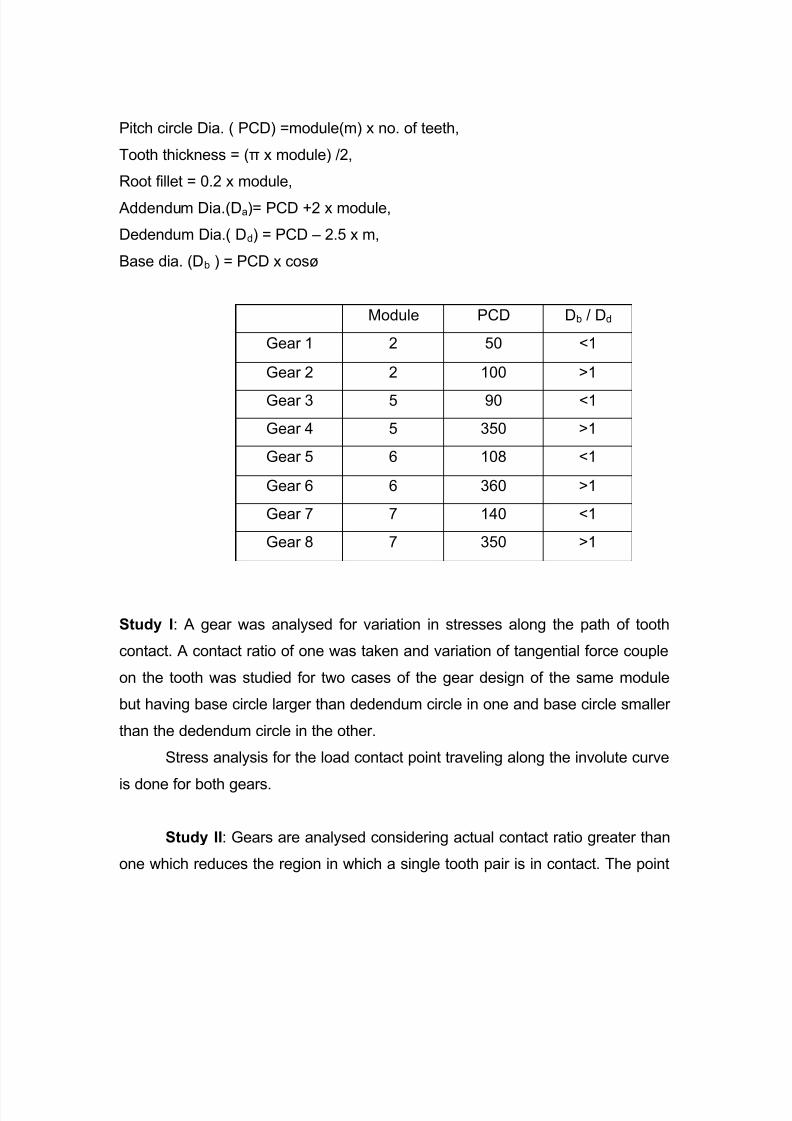
Pitch circle Dia. ( PCD) =module(m) x no. of teeth,
Tooth thickness = (π x module) /2,
Root fillet = 0.2 x module,
Addendum Dia.(Da)= PCD +2 x module,
Dedendum Dia.( Dd) = PCD – 2.5 x m,
Base dia. (Db ) = PCD x cosø
Module PCD Db / Dd
Gear 1 2 50 <1
Gear 2 2 100 >1
Gear 3 5 90 <1
Gear 4 5 350 >1
Gear 5 6 108 <1
Gear 6 6 360 >1
Gear 7 7 140 <1
Gear 8 7 350 >1
Study I: A gear was analysed for variation in stresses along the path of tooth
contact. A contact ratio of one was taken and variation of tangential force couple
on the tooth was studied for two cases of the gear design of the same module
but having base circle larger than dedendum circle in one and base circle smaller
than the dedendum circle in the other.
Stress analysis for the load contact point traveling along the involute curve
is done for both gears.
Study II: Gears are analysed considering actual contact ratio greater than
one which reduces the region in which a single tooth pair is in contact. The point
8/18/2019 8048113 ono
http://slidepdf.com/reader/full/8048113-ono 36/86
of contact where maximum stress occurs is determined for all eight test gears
and the study of variation of this H_dia. for contact ratio greater than one is done.
Study III: Comparison of stress analysis for highest load at H_dia. for all
eight test gears is done. The representative weak profile which is suitable for
stress relief studies is then selected.
Study IV: The fillets which are the most stressed regions in the tooth
profile are made as the feature of focus, the selected gears are tested and the
trailing fillet which has maximum stress is chosen for stress relief studies.
Stress relief features are made along the Dedendum, root-fillet, flank and
involute profiles. Global sensitivity analysis is done taking the maximum stress at
the fillets as a measure for location of hole, offset from the profile, diameter of the
hole and multiple holes.
The studies described above are done in sequence in order to arrive at the
suitable point of force application on a gear tooth which causes highest stresses
at the fillets.
The gear which would practically be the most stressed is selected from the eight.
Then the effect of stress reducing feature of hole is done. The aim of studies is to
arrive at an optimized design of the hole as the stress relief feature of a gear
tooth.
8/18/2019 8048113 ono
http://slidepdf.com/reader/full/8048113-ono 37/86
CHAPTER 4
RESULTS AND DISCUSSION
4.1 Experimentation and studies
STUDY 1
This study is done only on the gears having the specifications of
module=2, T=25 & Module=2, T=50. Measure of tangential force couple on the
tooth is taken. The distance of the point where load is applied is measured from
the base circle. A study is done on the tangential force couple variation on the
tooth along the entire involute curve.
Stress analysis is done to get the sensitivity of the stress at the fillets to
traveling of the load contact point along the involute curve.
The graphs below show the variation of force couple.
Figure 4.1 Couple variation graph for module =2, T=25
8/18/2019 8048113 ono
http://slidepdf.com/reader/full/8048113-ono 38/86
Figure 4.2 Couple variation graph for module =2, T=50
Figure 4.3 Global sensitivity analysis for m=2 T=25
8/18/2019 8048113 ono
http://slidepdf.com/reader/full/8048113-ono 39/86
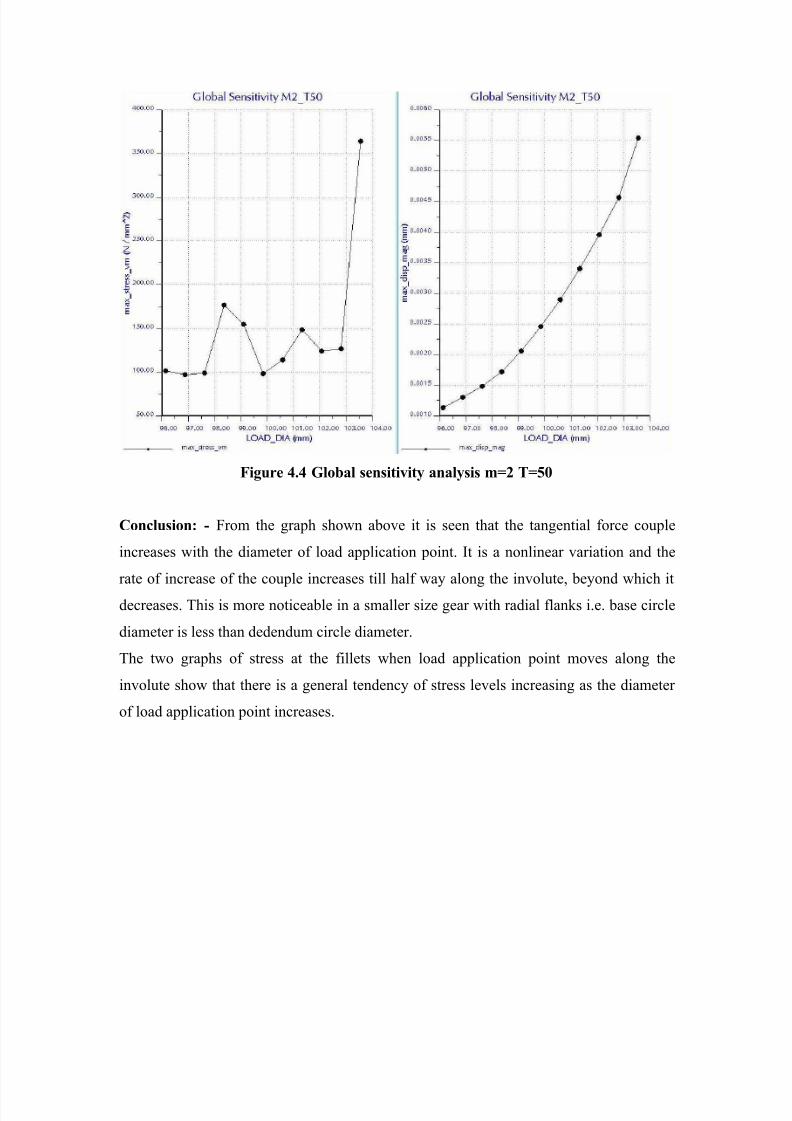
Figure 4.4 Global sensitivity analysis m=2 T=50
Conclusion: - From the graph shown above it is seen that the tangential force couple
increases with the diameter of load application point. It is a nonlinear variation and the
rate of increase of the couple increases till half way along the involute, beyond which it
decreases. This is more noticeable in a smaller size gear with radial flanks i.e. base circle
diameter is less than dedendum circle diameter.
The two graphs of stress at the fillets when load application point moves along the
involute show that there is a general tendency of stress levels increasing as the diameter
of load application point increases.
8/18/2019 8048113 ono
http://slidepdf.com/reader/full/8048113-ono 40/86
STUDY 2
In this study gears are analysed considering that actual contact ratio is kept
greater than one at a value which is suggested to be at least 1.20 [24, Pg 838]
this reduces the region in which a single tooth pair is in contact. Considering the
further reduction due to inaccuracies in mounting a contact ratio of 1.15 is taken.
The point of contact where maximum stress occurs is determined for all eight test
gears and the variation of this H dia for gear ratio greater than one is studied.
The point in consideration is the highest point of single tooth contact. Then the
gear ratio where it is maximum will be the taken for application of force for all
other studies.
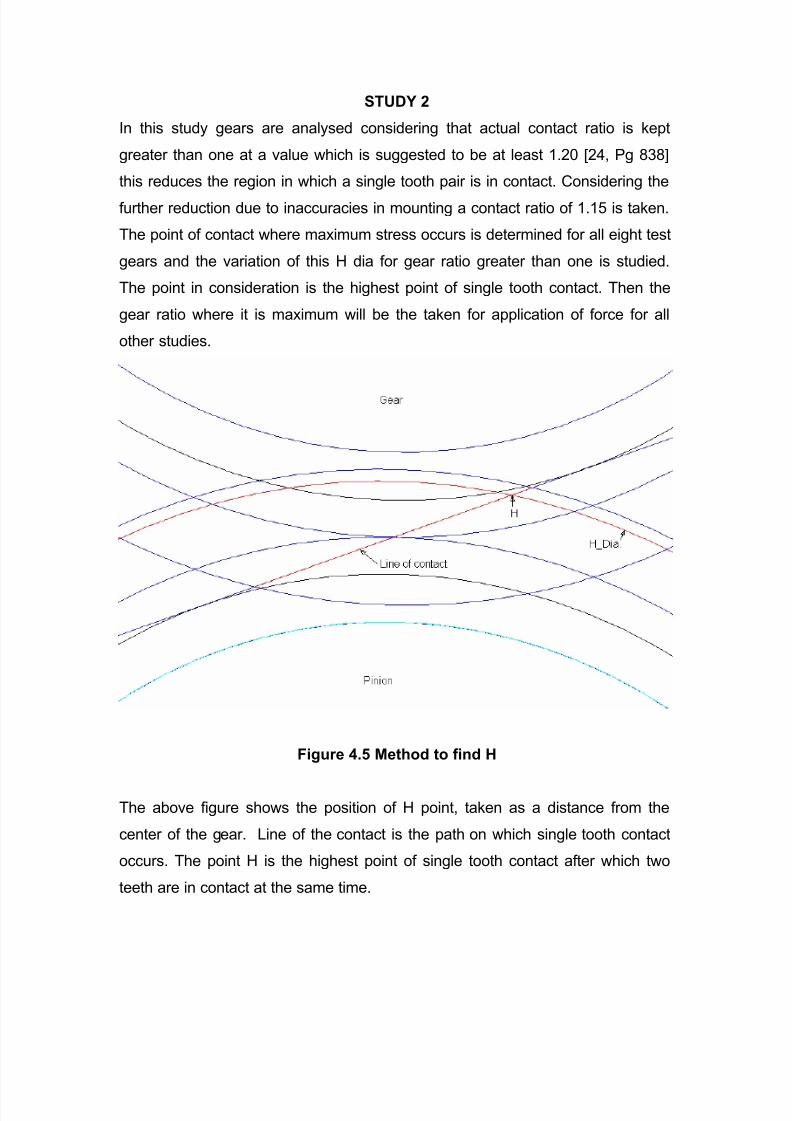
Figure 4.5 Method to find H
The above figure shows the position of H point, taken as a distance from the
center of the gear. Line of the contact is the path on which single tooth contact
occurs. The point H is the highest point of single tooth contact after which two
teeth are in contact at the same time.
8/18/2019 8048113 ono
http://slidepdf.com/reader/full/8048113-ono 41/86
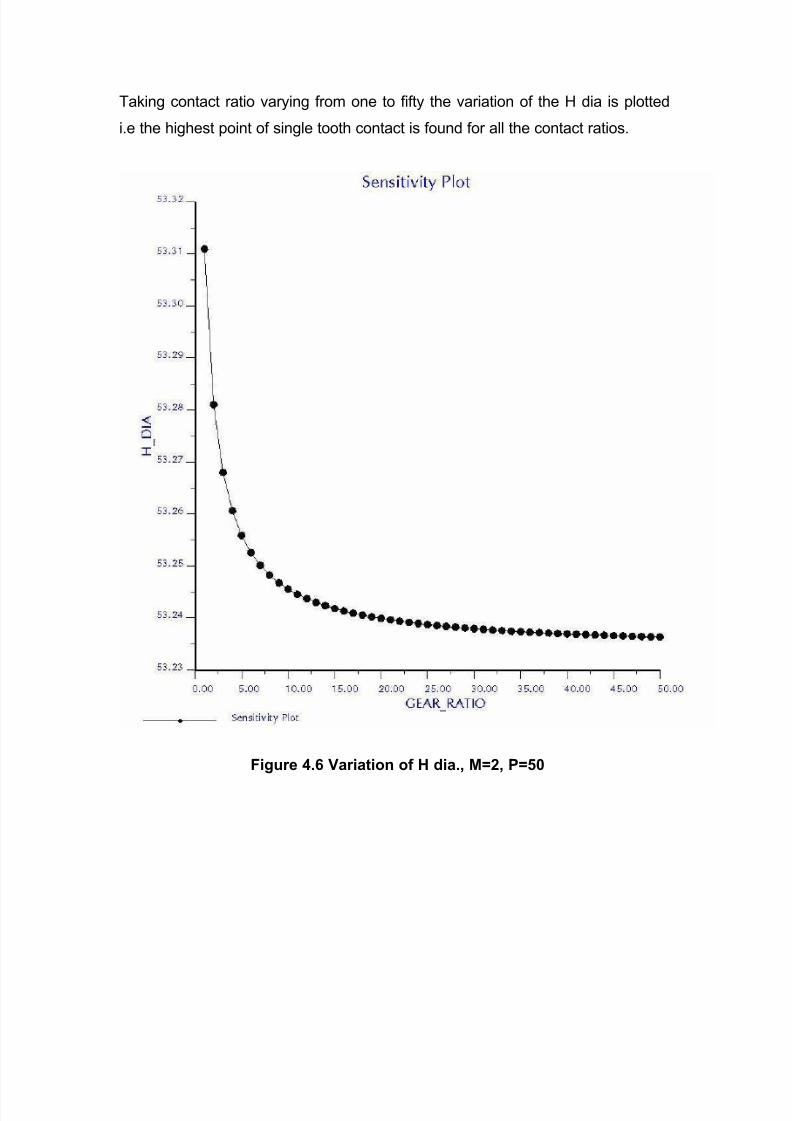
Taking contact ratio varying from one to fifty the variation of the H dia is plotted
i.e the highest point of single tooth contact is found for all the contact ratios.
Figure 4.6 Variation of H dia., M=2, P=50
8/18/2019 8048113 ono
http://slidepdf.com/reader/full/8048113-ono 42/86
8/18/2019 8048113 ono
http://slidepdf.com/reader/full/8048113-ono 43/86
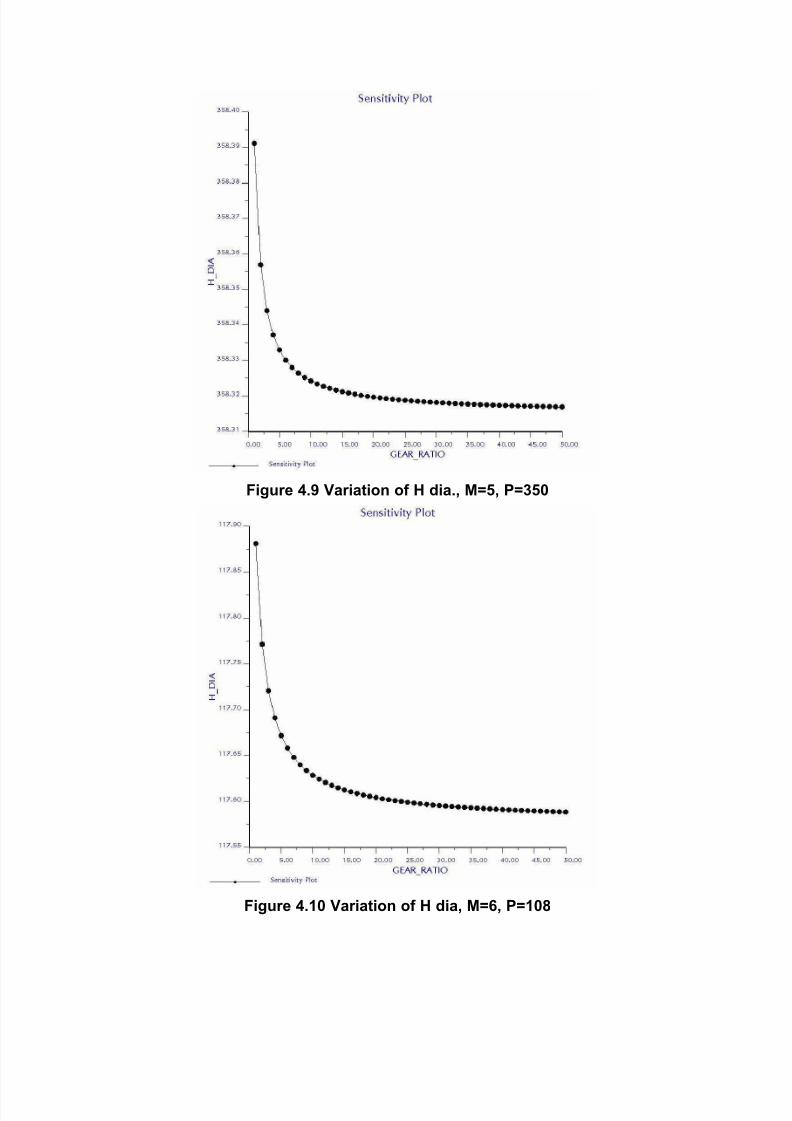
Figure 4.9 Variation of H dia., M=5, P=350
Figure 4.10 Variation of H dia, M=6, P=108
8/18/2019 8048113 ono
http://slidepdf.com/reader/full/8048113-ono 44/86
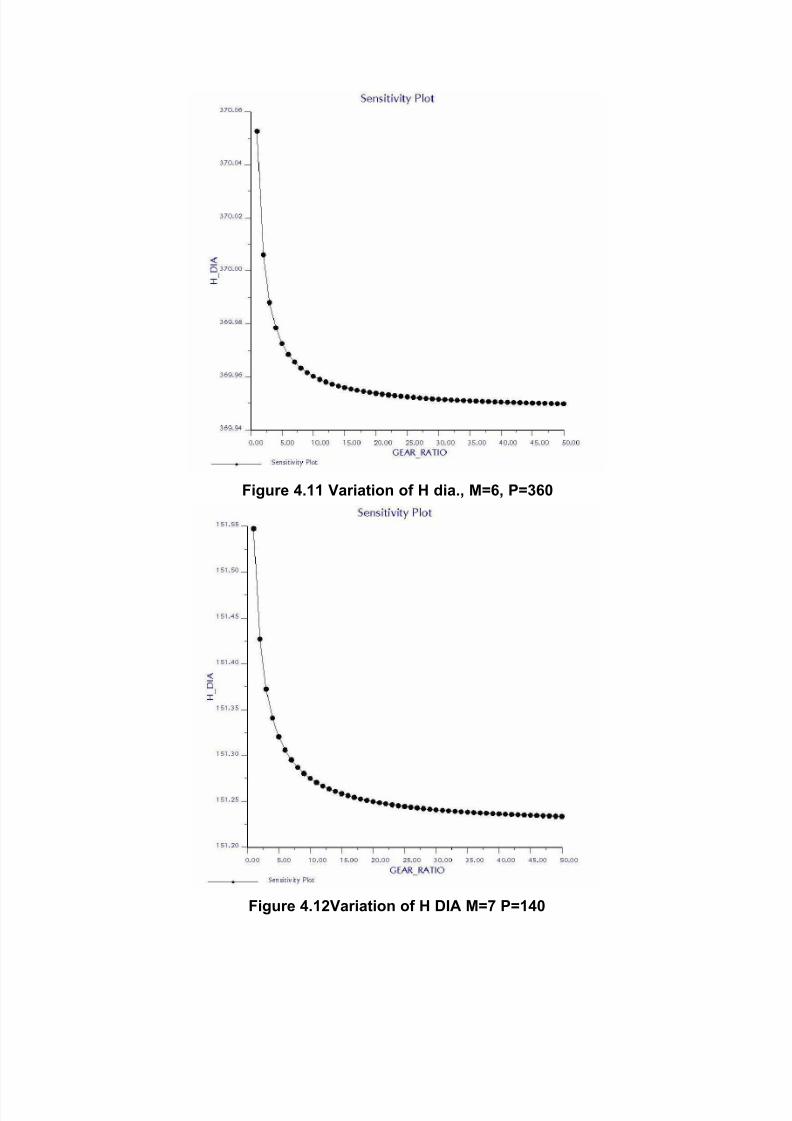
Figure 4.11 Variation of H dia., M=6, P=360
Figure 4.12Variation of H DIA M=7 P=140
8/18/2019 8048113 ono
http://slidepdf.com/reader/full/8048113-ono 45/86
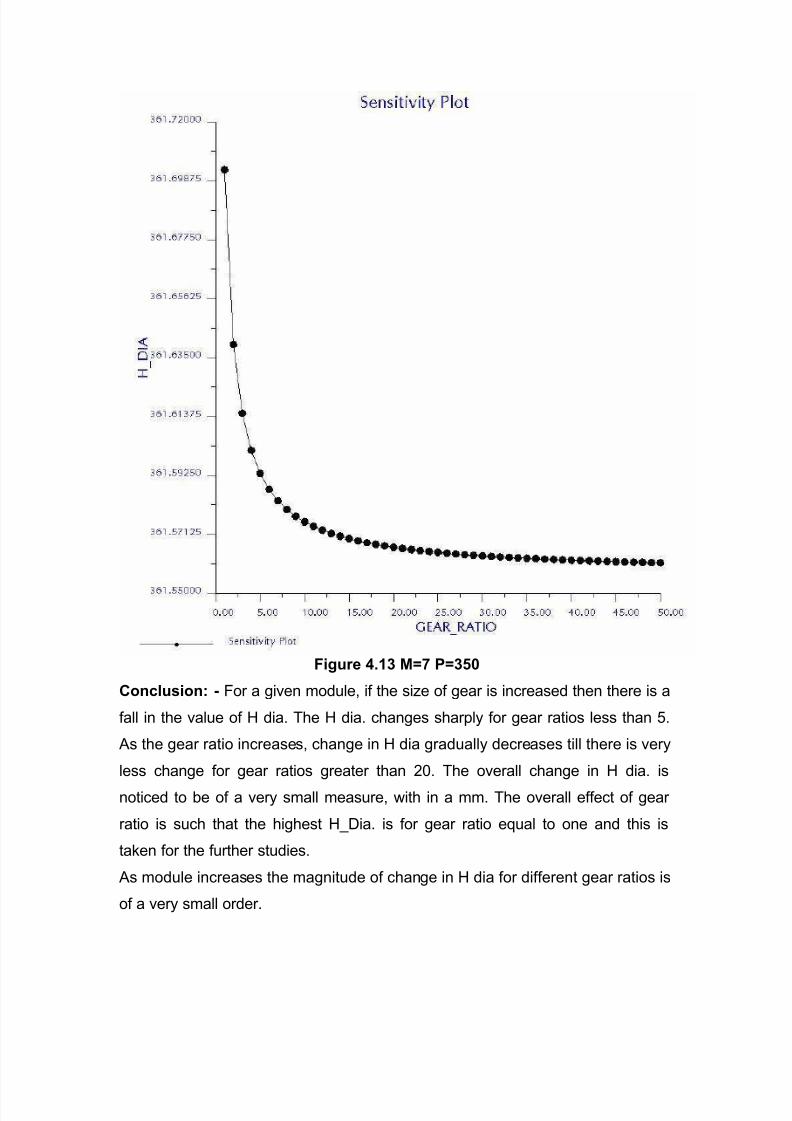
Figure 4.13 M=7 P=350
Conclusion: - For a given module, if the size of gear is increased then there is a
fall in the value of H dia. The H dia. changes sharply for gear ratios less than 5.
As the gear ratio increases, change in H dia gradually decreases till there is very
less change for gear ratios greater than 20. The overall change in H dia. is
noticed to be of a very small measure, with in a mm. The overall effect of gear
ratio is such that the highest H_Dia. is for gear ratio equal to one and this is
taken for the further studies.
As module increases the magnitude of change in H dia for different gear ratios is
of a very small order.
8/18/2019 8048113 ono
http://slidepdf.com/reader/full/8048113-ono 46/86
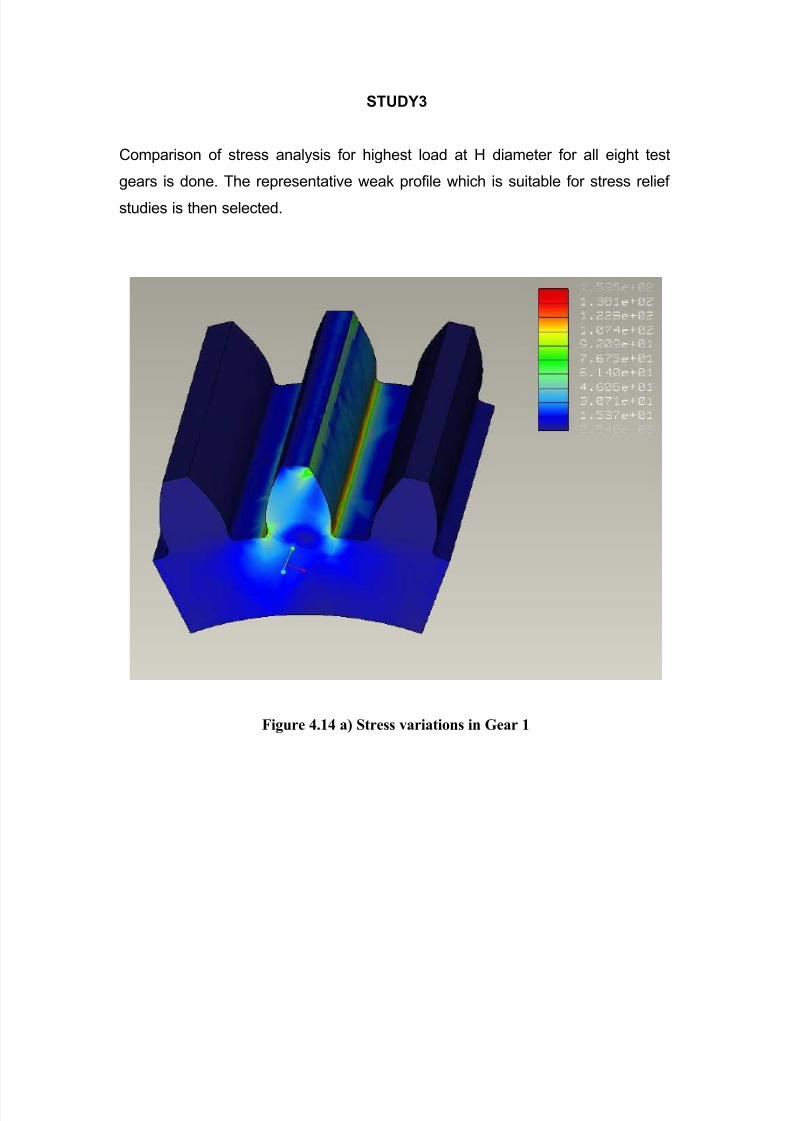
STUDY3
Comparison of stress analysis for highest load at H diameter for all eight test
gears is done. The representative weak profile which is suitable for stress relief
studies is then selected.
Figure 4.14 a) Stress variations in Gear 1
8/18/2019 8048113 ono
http://slidepdf.com/reader/full/8048113-ono 47/86
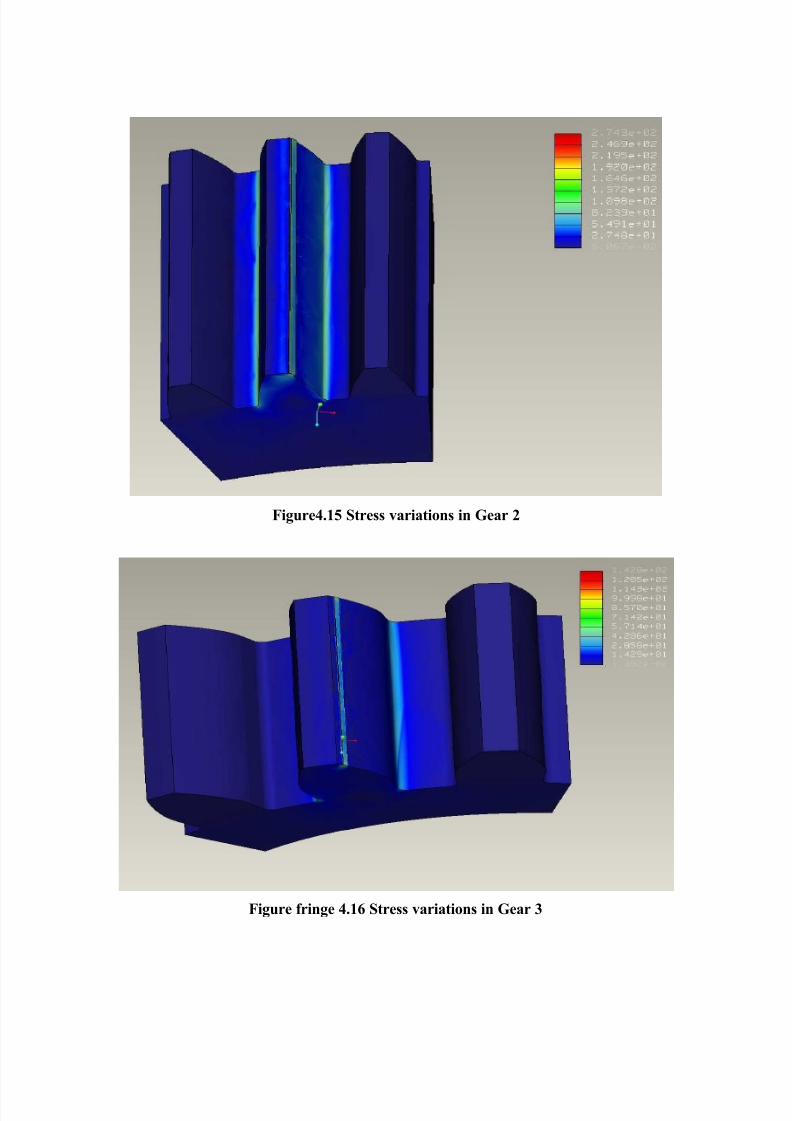
Figure4.15 Stress variations in Gear 2
Figure fringe 4.16 Stress variations in Gear 3
8/18/2019 8048113 ono
http://slidepdf.com/reader/full/8048113-ono 48/86
Figure 4.17 Stress variations in Gear 4
Figure 4.18 Stress variations in Gear 5
8/18/2019 8048113 ono
http://slidepdf.com/reader/full/8048113-ono 49/86
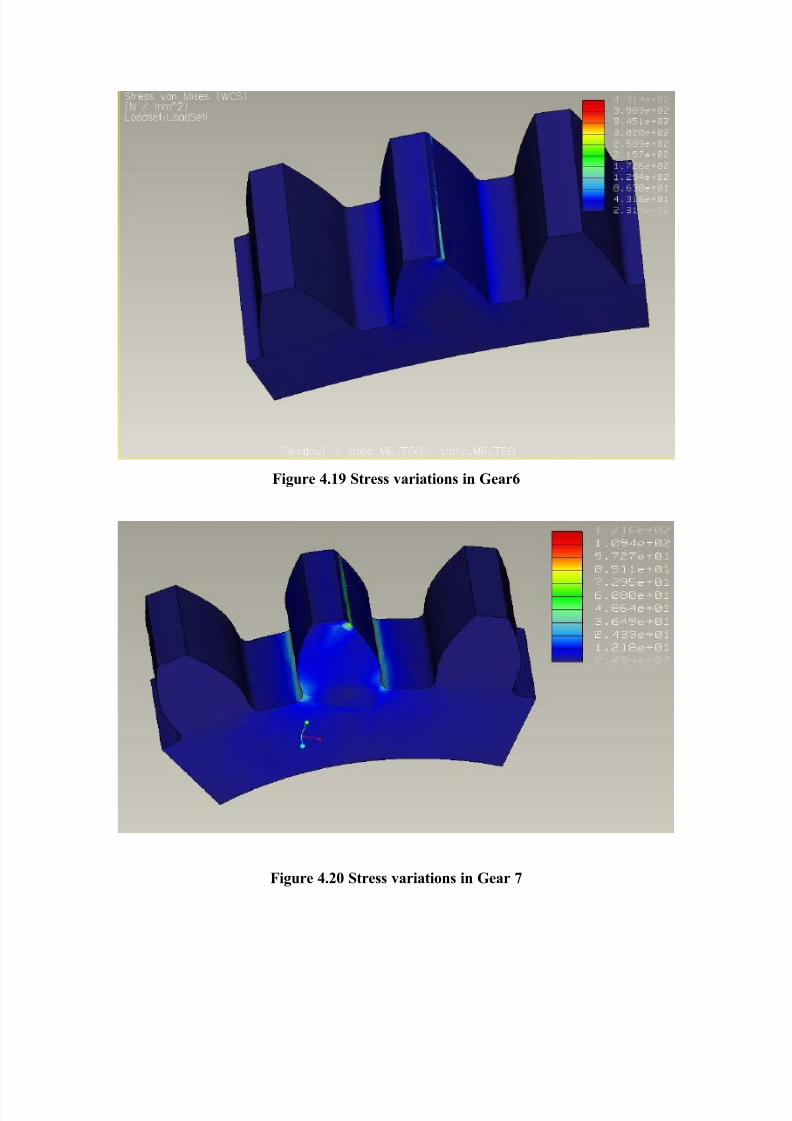
Figure 4.19 Stress variations in Gear6
Figure 4.20 Stress variations in Gear 7
8/18/2019 8048113 ono
http://slidepdf.com/reader/full/8048113-ono 50/86
Conclusion: the maximum stress at the fillets for each gear is as below:
Maximum stress
at the fillets
Maximum
deflection (mm)
Gear1 M=2 T=25 168M Pa 0.00598
Gear 2 M=2 T=50 146 M Pa 0.00552
Gear 3 M=5 T=18 135 M Pa 0.00394
Gear 4 M=5 T=70 126 M Pa 0.00461
Gear 5 M=6 T=18 146 M Pa 0.00634
Gear 6 M=6 T=60 137 M Pa 0.00466
Gear 7 M=7 T=20 127 M Pa 0.00632
Gear 8 M=7 T=50 116 M Pa 0.00464
Gear Number 1 m=2, T=25 with the maximum stress of 168 M Pa is chosen for
stress relief studies. The aim is to reduce the stress and maintain stiffness.
Fig 4.14 b Stress variation in fillets
As seen in Fig 4.14 b above the maximum stress occurs at the fillets. Of the two
fillets the trailing fillet, on the left, is more stressed. The local stress at contact is
not considered for further studies as the gear surface treatments make it
resistant to these stresses and this point of contact constantly shifts.
8/18/2019 8048113 ono
http://slidepdf.com/reader/full/8048113-ono 51/86
STUDY 4
The fillets regions in the tooth profile, which are the most stressed, are
made as the feature of focus. The selected gear is tested and the trailing fillet
which has maximum stress is chosen for stress relief in this study.
The point of application of force is at H diameter. From study 3 the spur
gear m=2,T=25 having base circle greater than dedendum circle is taken and
stress relief hole feature is/are made along the dedendum, root-fillet, flank and
involute profiles. Global sensitivity analysis is done taking the maximum stress at
the fillets as a measure and, by variation location of hole, offset from the profile,
diameter of the hole and multiple holes, these are also studied on either / both
sides of the tooth. Finally an Optimization study is run on the basis of the results
of the sensitivity analysis to find a optimized location and size of the hole(s).
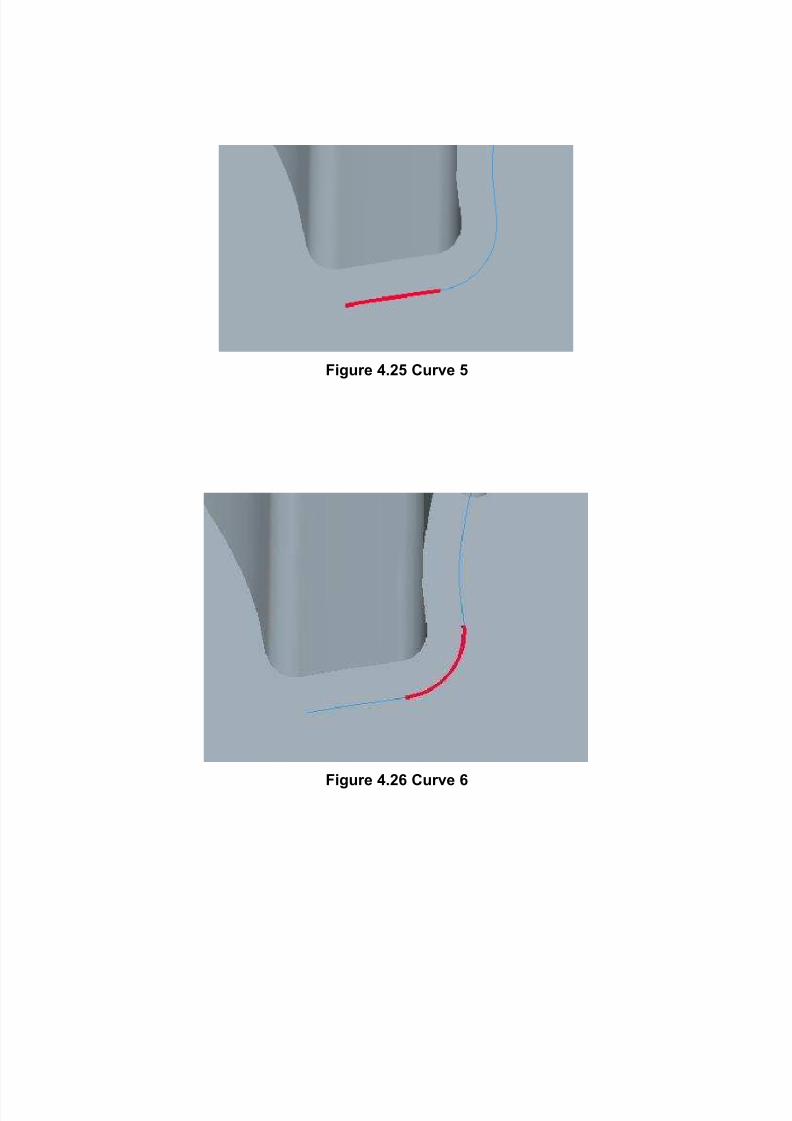
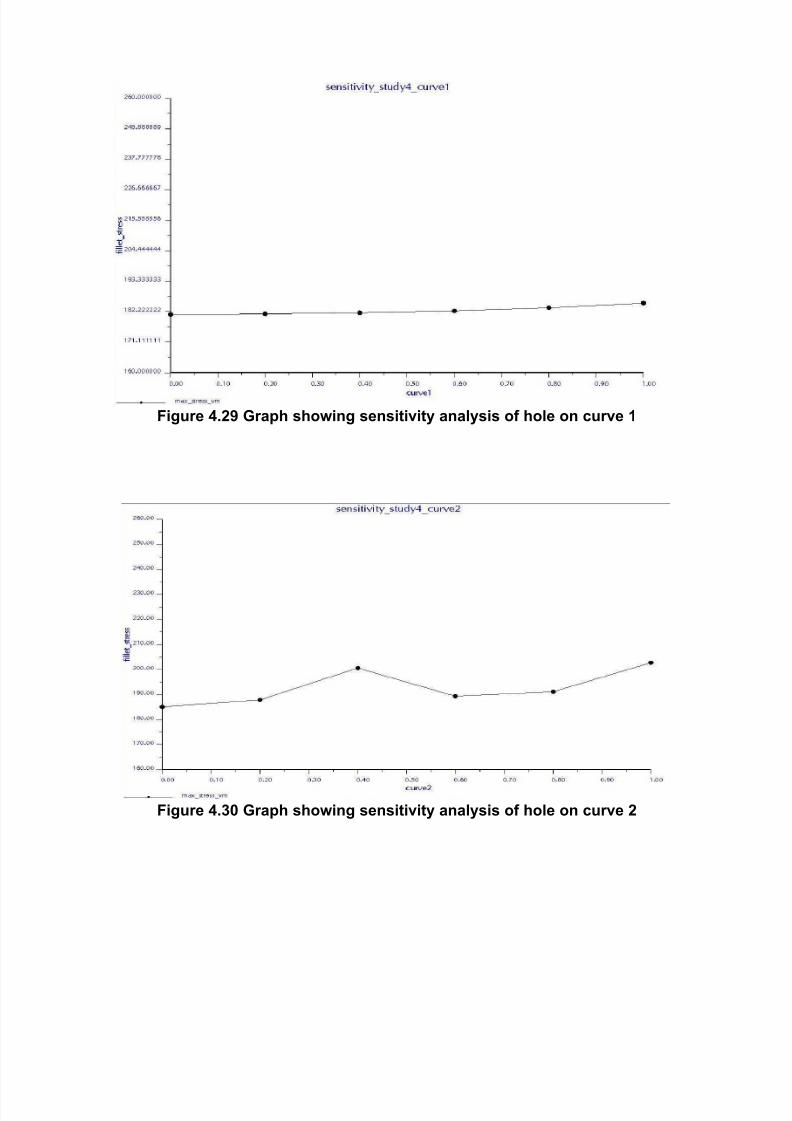
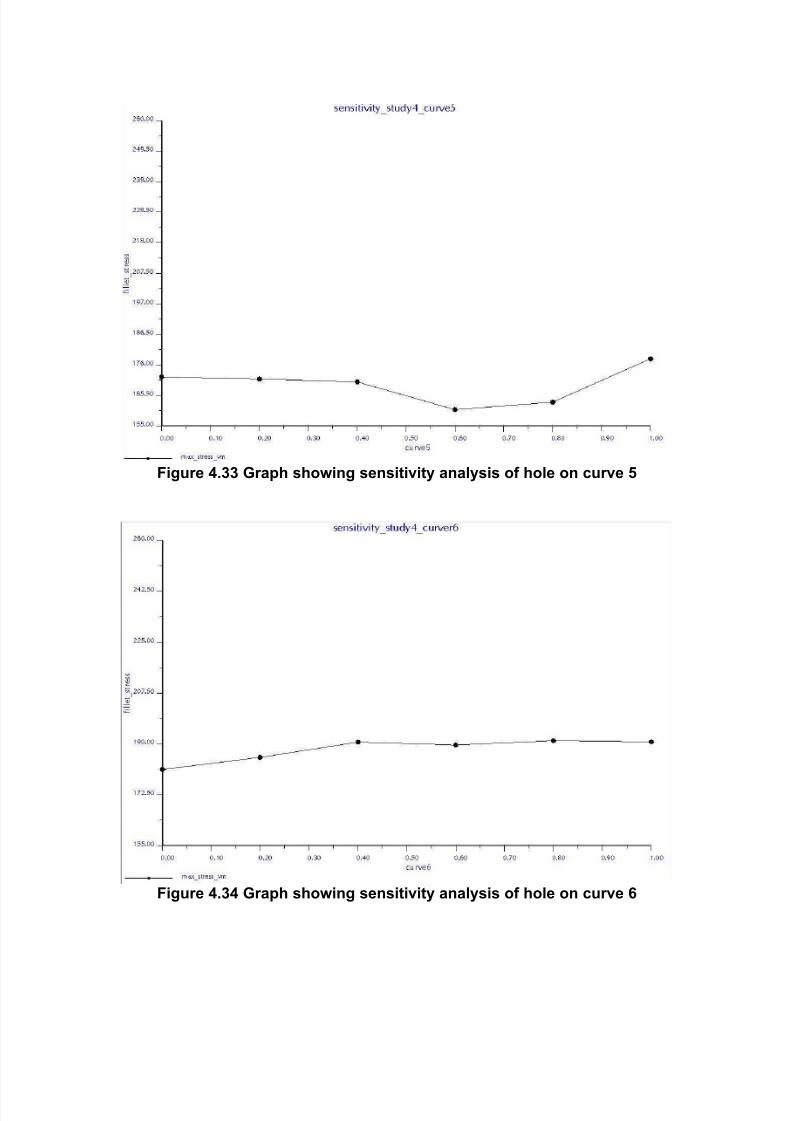
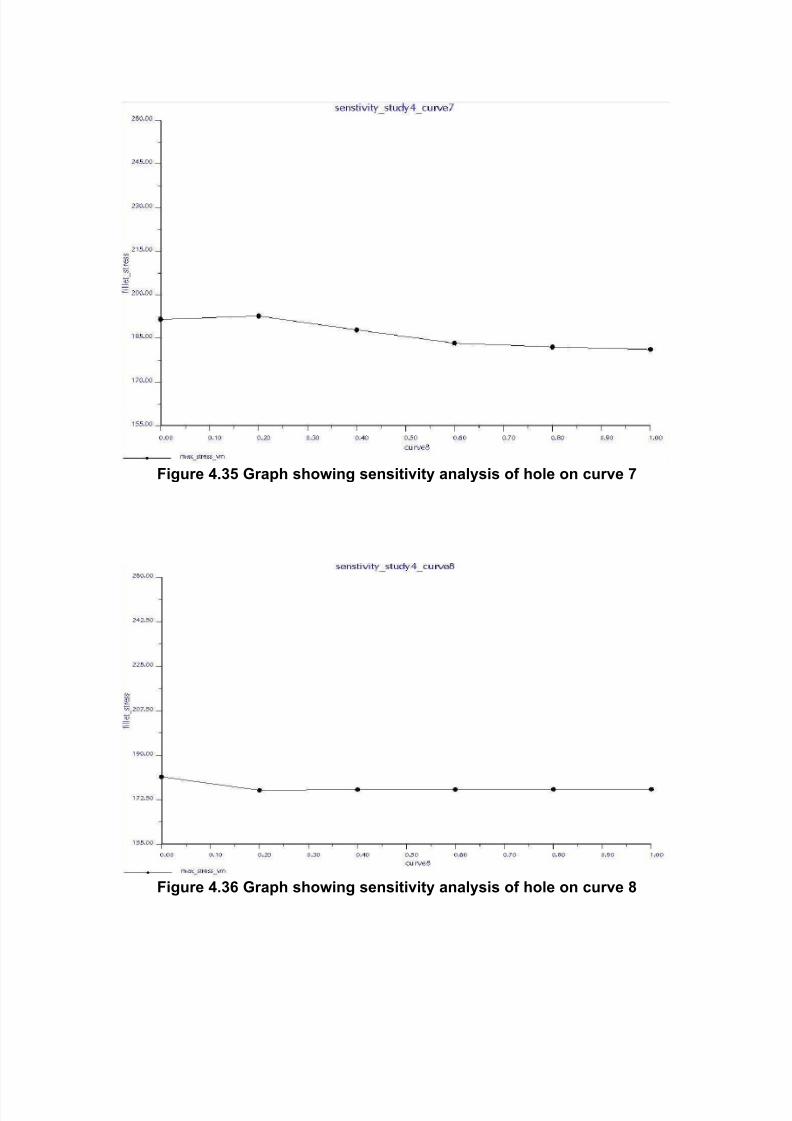
a) Varying Location
In this study stress relief hole feature is made in the root fillet region. The study is
done by varying the location of the hole along four regions, a. parallel to
dedendum, b. along fillet, c. along radial flank and d. along involute profile. The
following graphs show these locations. The diameter of the hole is 0.2 mm and it
is at an offset distance of 0.5 mm from the edge of the gear tooth. The hole is
placed parametrically with respect to the curve. In the curve 1 staring point of the
curve is on the right side and ending point is on the left side of the curve. For the
curve 2 starting point is the bottom right of the curve and ending point is top left
of the curve. In the curve 3 bottom point is the starting point and top is the ending
point. For the curve 4 the starting point is the bottom point and ending point is at
the top end of the curve. In the curve 5 left end point is the starting point and right
end point of the curve is the ending point. For the curve 6 bottom point of the
curve is the starting point and the top point is the ending point. For the curve 7
bottom point is the starting point and top the curve is the end point. In the curve 8
bottom left point is the start point and top right is the end point.
8/18/2019 8048113 ono
http://slidepdf.com/reader/full/8048113-ono 52/86
Fig 4.21 Curve 1
Fig 4.22 Curve2
8/18/2019 8048113 ono
http://slidepdf.com/reader/full/8048113-ono 53/86
Fig 4.23 Curve 3
Figure 4.24 Curve 4
8/18/2019 8048113 ono
http://slidepdf.com/reader/full/8048113-ono 54/86
Figure 4.25 Curve 5
Figure 4.26 Curve 6
8/18/2019 8048113 ono
http://slidepdf.com/reader/full/8048113-ono 55/86
Figure 4.27 Curve 7
Figure 4.28 Curve 8
8/18/2019 8048113 ono
http://slidepdf.com/reader/full/8048113-ono 56/86
8/18/2019 8048113 ono
http://slidepdf.com/reader/full/8048113-ono 57/86
Figure 4.31 Graph showing sensitivity analysis of hole on curve 3
Figure 4.32 Graph showing sensitivity analysis of hole on curve 4
8/18/2019 8048113 ono
http://slidepdf.com/reader/full/8048113-ono 58/86
Figure 4.33 Graph showing sensitivity analysis of hole on curve 5
Figure 4.34 Graph showing sensitivity analysis of hole on curve 6
8/18/2019 8048113 ono
http://slidepdf.com/reader/full/8048113-ono 59/86
Figure 4.35 Graph showing sensitivity analysis of hole on curve 7
Figure 4.36 Graph showing sensitivity analysis of hole on curve 8
8/18/2019 8048113 ono
http://slidepdf.com/reader/full/8048113-ono 60/86
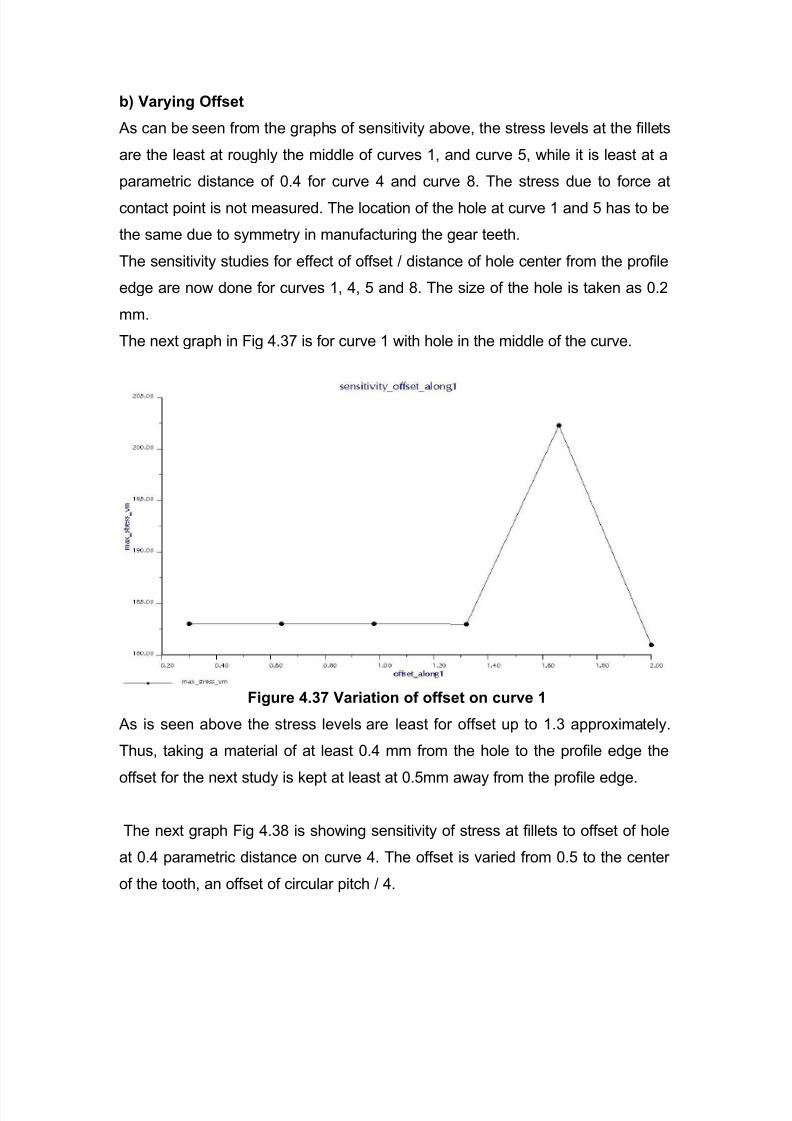
b) Varying Offset
As can be seen from the graphs of sensitivity above, the stress levels at the fillets
are the least at roughly the middle of curves 1, and curve 5, while it is least at a
parametric distance of 0.4 for curve 4 and curve 8. The stress due to force at
contact point is not measured. The location of the hole at curve 1 and 5 has to be
the same due to symmetry in manufacturing the gear teeth.
The sensitivity studies for effect of offset / distance of hole center from the profile
edge are now done for curves 1, 4, 5 and 8. The size of the hole is taken as 0.2
mm.
The next graph in Fig 4.37 is for curve 1 with hole in the middle of the curve.
Figure 4.37 Variation of offset on curve 1
As is seen above the stress levels are least for offset up to 1.3 approximately.
Thus, taking a material of at least 0.4 mm from the hole to the profile edge the
offset for the next study is kept at least at 0.5mm away from the profile edge.
The next graph Fig 4.38 is showing sensitivity of stress at fillets to offset of hole
at 0.4 parametric distance on curve 4. The offset is varied from 0.5 to the center
of the tooth, an offset of circular pitch / 4.
8/18/2019 8048113 ono
http://slidepdf.com/reader/full/8048113-ono 61/86
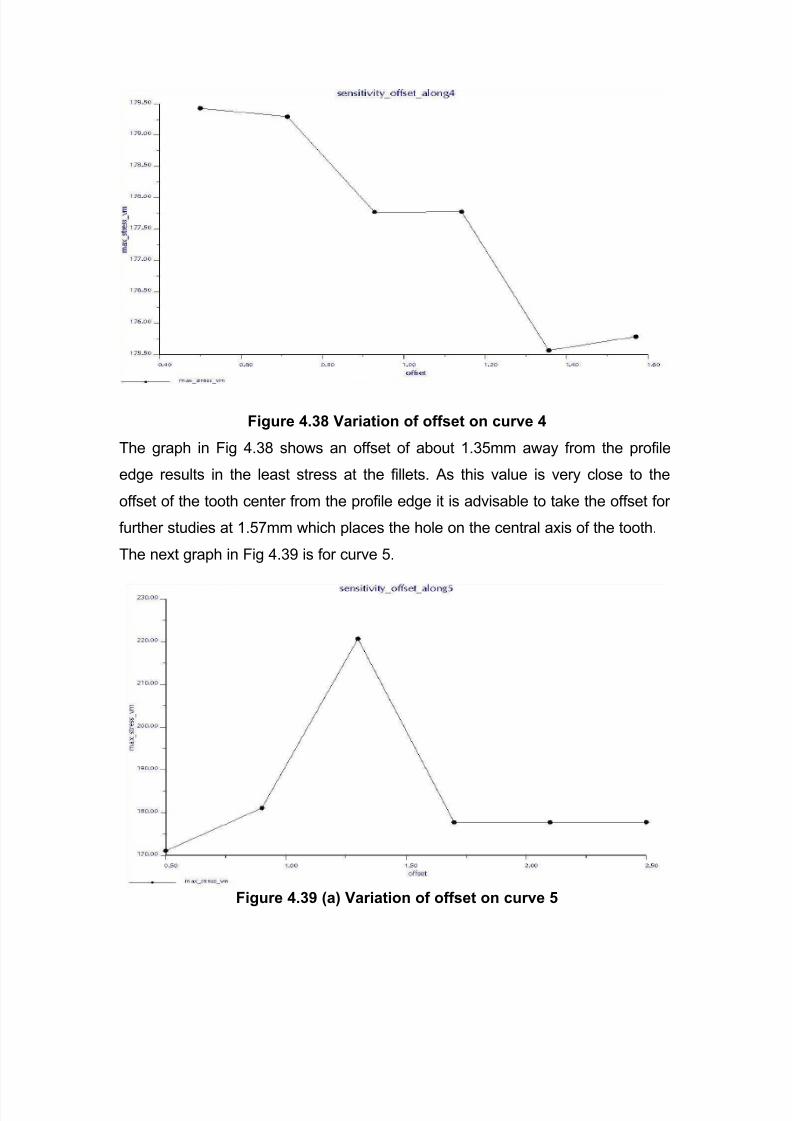
Figure 4.38 Variation of offset on curve 4
The graph in Fig 4.38 shows an offset of about 1.35mm away from the profile
edge results in the least stress at the fillets. As this value is very close to the
offset of the tooth center from the profile edge it is advisable to take the offset for
further studies at 1.57mm which places the hole on the central axis of the tooth.
The next graph in Fig 4.39 is for curve 5.
Figure 4.39 (a) Variation of offset on curve 5
8/18/2019 8048113 ono
http://slidepdf.com/reader/full/8048113-ono 62/86
The size of the hole is 0.2 mm diameter and is placed at mid point of the curve.
As there is a sudden increase in the stresses for offset increasing above 0.5mm
another study is done for offset less than 0.5mm as shown below in Fig 4.39 b.
Figure 4.39 (b) Variation of offset < 0.5mm on curve 5
As the stress is not sensitive to offset less than 0.5mm, and taking a material of
at least 0.4 mm from the hole to the profile edge the offset of hole center for the
next study is kept at least at 0.5mm away from the profile edge.
8/18/2019 8048113 ono
http://slidepdf.com/reader/full/8048113-ono 63/86
Figure 4.40 Variation of offset on curve 8
In the Fig 4.40 above for the curve 8, size of hole is taken as 0.2mm diameter
and is placed 0.4 from start of the curve. As the trend is similar to that for curve 4
from Fig 4.38 the same result and conclusion holds good.
c) Varying Size
The dia of the holes is varied, and is placed at 0.5 distance from the start of the
curve 1 & 5. The offset of the hole center is also varied so that the hole is always
leaving a material of 0.4mm from the edge of the profile (dedendum circle).
Figure 4.41 Variation of diameter on curve 1&5
8/18/2019 8048113 ono
http://slidepdf.com/reader/full/8048113-ono 64/86
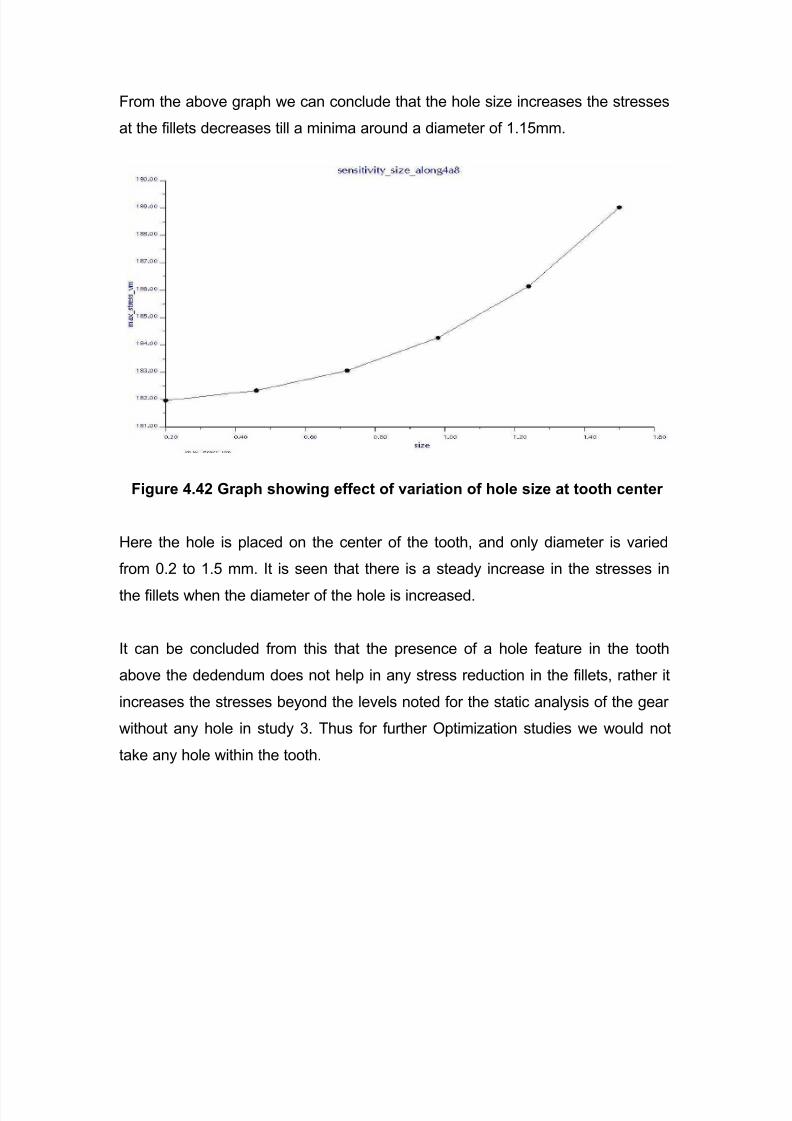
From the above graph we can conclude that the hole size increases the stresses
at the fillets decreases till a minima around a diameter of 1.15mm.
Figure 4.42 Graph showing effect of variation of hole size at tooth center
Here the hole is placed on the center of the tooth, and only diameter is varied
from 0.2 to 1.5 mm. It is seen that there is a steady increase in the stresses in
the fillets when the diameter of the hole is increased.
It can be concluded from this that the presence of a hole feature in the tooth
above the dedendum does not help in any stress reduction in the fillets, rather it
increases the stresses beyond the levels noted for the static analysis of the gear
without any hole in study 3. Thus for further Optimization studies we would not
take any hole within the tooth.
8/18/2019 8048113 ono
http://slidepdf.com/reader/full/8048113-ono 65/86
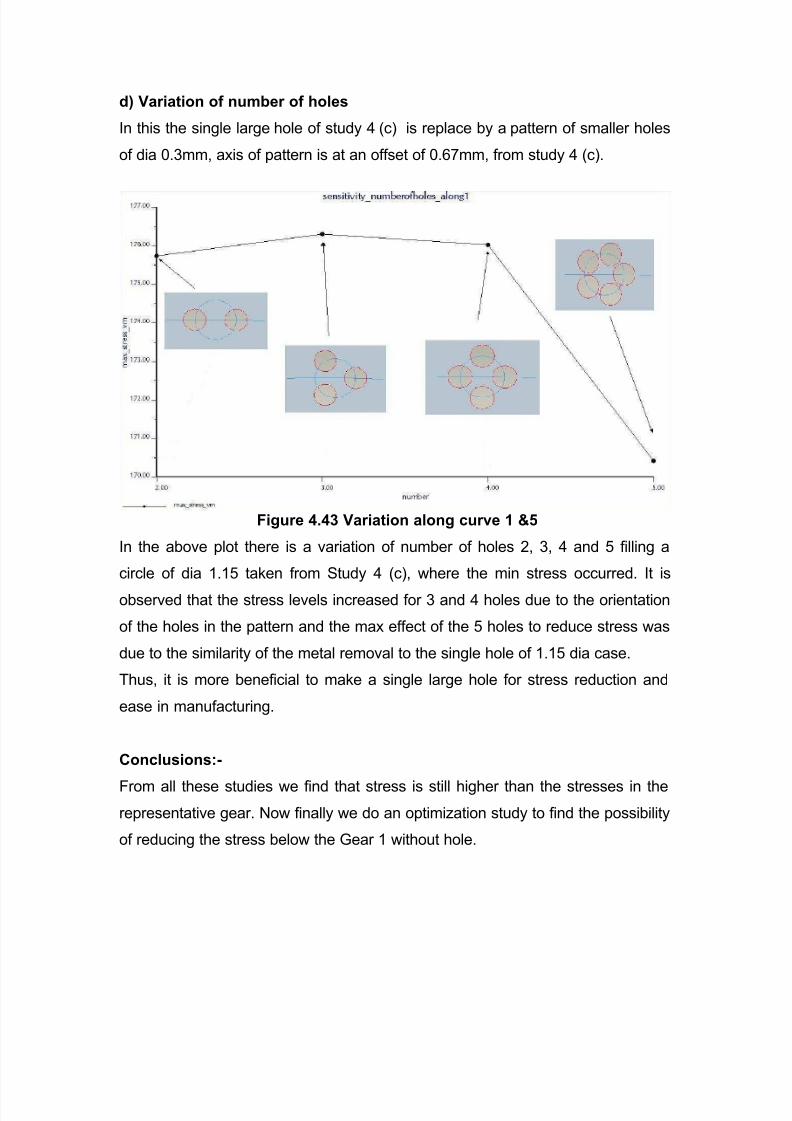
d) Variation of number of holes
In this the single large hole of study 4 (c) is replace by a pattern of smaller holes
of dia 0.3mm, axis of pattern is at an offset of 0.67mm, from study 4 (c).
Figure 4.43 Variation along curve 1 &5
In the above plot there is a variation of number of holes 2, 3, 4 and 5 filling a
circle of dia 1.15 taken from Study 4 (c), where the min stress occurred. It is
observed that the stress levels increased for 3 and 4 holes due to the orientation
of the holes in the pattern and the max effect of the 5 holes to reduce stress was
due to the similarity of the metal removal to the single hole of 1.15 dia case.
Thus, it is more beneficial to make a single large hole for stress reduction and
ease in manufacturing.
Conclusions:-
From all these studies we find that stress is still higher than the stresses in the
representative gear. Now finally we do an optimization study to find the possibility
of reducing the stress below the Gear 1 without hole.
8/18/2019 8048113 ono
http://slidepdf.com/reader/full/8048113-ono 66/86
e) Optimization study
Two equal holes are taken on curve 1 & 5, as the holes would be manufactured
at the same location relative to every tooth. The study of effect of hole placement
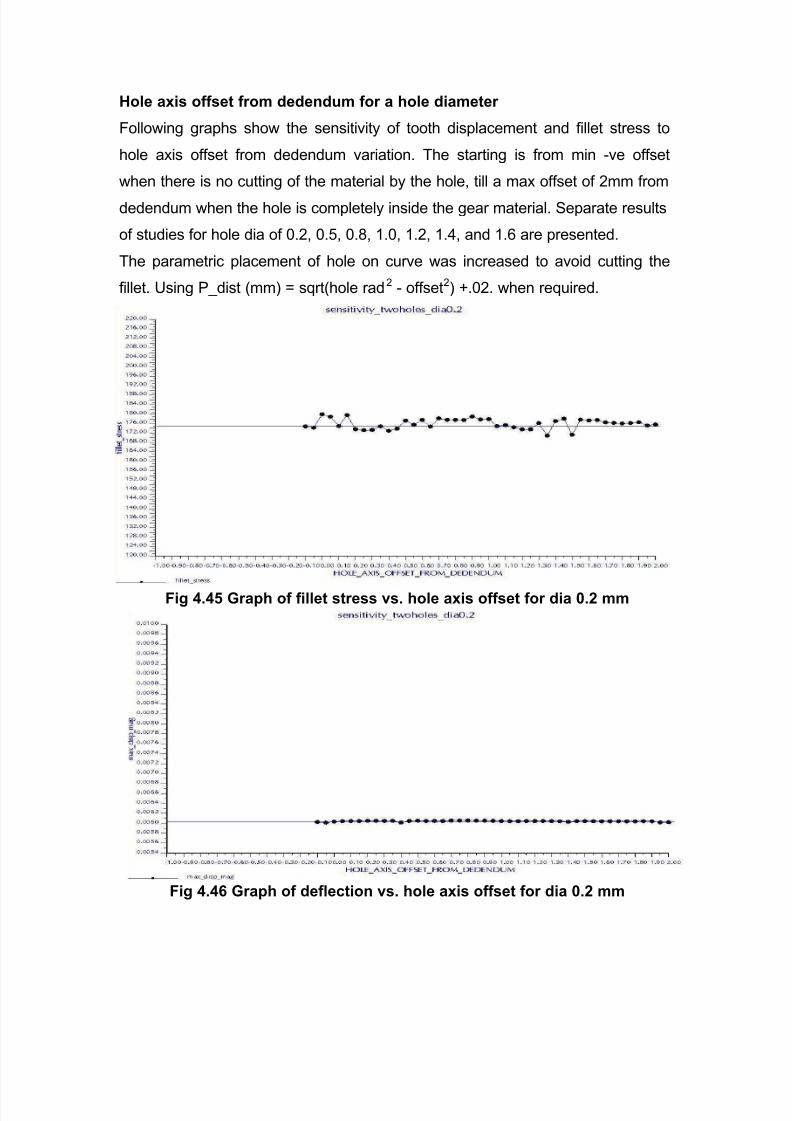
along the curve concentric to dedendum, size and hole axis offset from
dedendum for Gear 1 is done.
Parametric placement along curve 1 & 5.
A sensitivity study of the fillet stress to the parametric placement of holes on the
curves 1&5 is done. Taking the dia of hole as 1.15mm from Figure 4.41 and
keeping 0.4mm of uncut material from dedendum to the hole edge.
Figure 4.44 Fillet stress vs. parametric placement of holes on curves 1 / 5
From the above sensitivity analysis it is found that the minimum stress occurs at
around 0.355 parametric distance from the start point of curve 1 / 5. This
parametric distance is now taken for all further sensitivity analysis. From Study 3
the max von mises stress at fillets of 168 MPa and deflection of 0.00599mm are
marked in the graphs for reference.
8/18/2019 8048113 ono
http://slidepdf.com/reader/full/8048113-ono 67/86
8/18/2019 8048113 ono
http://slidepdf.com/reader/full/8048113-ono 68/86
Fig 4.47 Graph of fillet stress vs. hole axis offset for dia 0.5
Fig 4.48 Graph of deflection vs. hole axis offset for dia 0.5 mm
8/18/2019 8048113 ono
http://slidepdf.com/reader/full/8048113-ono 69/86
Fig 4.49 Graph of fillet stress vs. hole axis offset for dia 0.8 mm
Fig 4.50 Graph of deflection vs. hole axis offset for dia 0.8 mm
8/18/2019 8048113 ono
http://slidepdf.com/reader/full/8048113-ono 70/86
8/18/2019 8048113 ono
http://slidepdf.com/reader/full/8048113-ono 71/86
Fig 4.53 Graph of fillet stress vs. hole axis offset for dia 1.2 mm
Fig 4.54 Graph of deflection vs. hole axis offset for dia 1.2 mm
8/18/2019 8048113 ono
http://slidepdf.com/reader/full/8048113-ono 72/86
Fig 4.55 Graph of fillet stress vs. hole axis offset for dia 1.4 mm
Fig 4.56 Graph of deflection vs. hole axis offset for dia 1.4 mm
8/18/2019 8048113 ono
http://slidepdf.com/reader/full/8048113-ono 73/86
Fig 4.57 Graph of fillet stress vs. hole axis offset for dia 1.6 mm
Fig 4.58 Graph of deflection vs. hole axis offset for dia 1.6 mm
8/18/2019 8048113 ono
http://slidepdf.com/reader/full/8048113-ono 74/86
8/18/2019 8048113 ono
http://slidepdf.com/reader/full/8048113-ono 75/86
Fig 4.59 Graphs of fillet stress and deflection for offset = 0.1 X Hole dia
Fig 4.60 Graphs of fillet stress and deflection for offset = 0.15 X Hole dia
8/18/2019 8048113 ono
http://slidepdf.com/reader/full/8048113-ono 76/86
Fig 4.61 Graphs of fillet stress and deflection for offset = 0.2 X Hole dia
Fig 4.62 Graphs of fillet stress and deflection for offset = 0.25 X Hole dia
8/18/2019 8048113 ono
http://slidepdf.com/reader/full/8048113-ono 77/86
Fig 4.63 Graphs of fillet stress and deflection for offset = 0.3 X Hole dia
Fig 4.64 Graphs of fillet stress and deflection for offset = 0.35 X Hole dia
8/18/2019 8048113 ono
http://slidepdf.com/reader/full/8048113-ono 78/86
Fig 4.65 Graphs of fillet stress and deflection for offset = 0.4 X Hole dia
Fig 4.66 Graphs of fillet stress and deflection for offset = 0.45 X Hole dia
8/18/2019 8048113 ono
http://slidepdf.com/reader/full/8048113-ono 79/86
Fig 4.67 Graphs of fillet stress and deflection for offset = 0.5 X Hole dia
From the above graphs it is found that overall stresses can be reduced by a large
amount while deflection increased due to loss of rigidity. Large reduction in the
stress at fillets has been achieved for large holes but at a cost of rigidity and the
maximum stress point also shifts from the fillet to the Hole. From these graphs
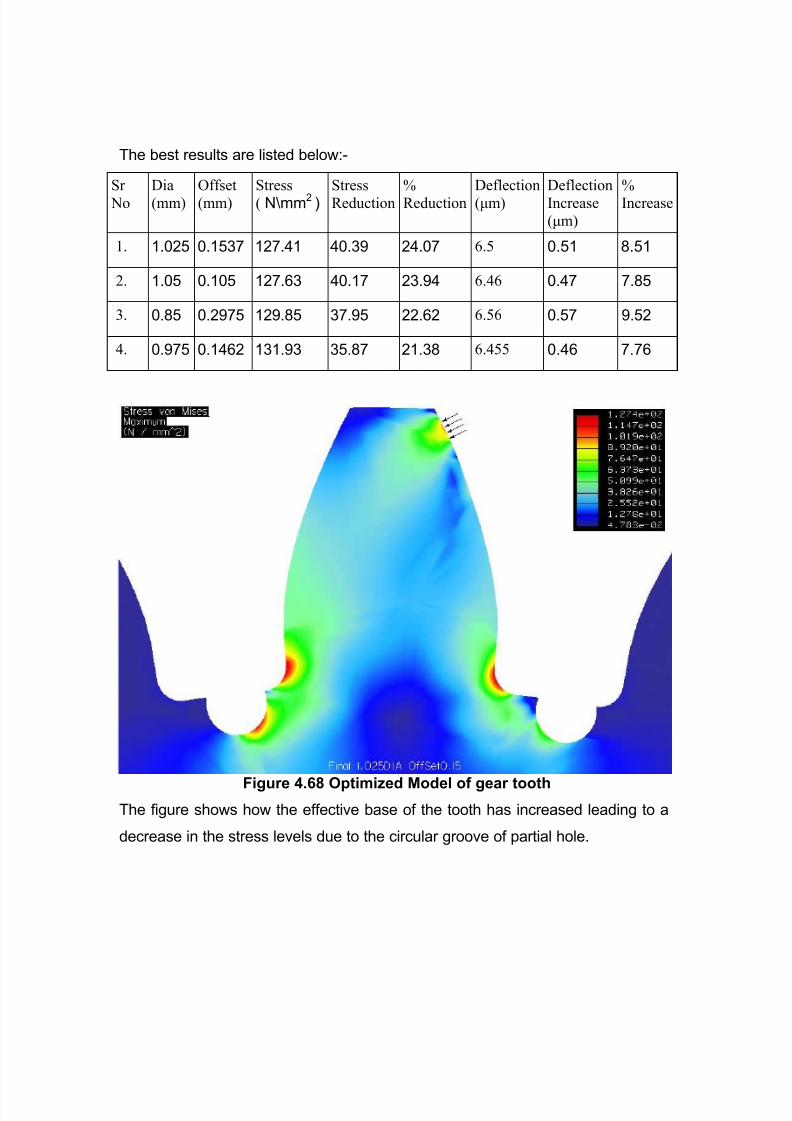
representative holes are chosen which give a stress reduction but the increase in