240
~~ ~ p9bSLW DOE/PC/93069 q j j gpGTT4 L ! ? evelopment of Precipitated Iron Fi s sch Catalysts ’ 4hik Final Technical Texas Engineering Experiment Station Project 32525-44580
| Date post: | 03-Apr-2018 |
| Category: |
Documents |
| Upload: | pacymo-dubelogy |
| View: | 212 times |
| Download: | 0 times |
7/28/2019 808495(1).pdf
http://slidepdf.com/reader/full/8084951pdf 1/240
~
p 9 b S L W
DOE/PC/93069
qjj gpGTT4
L!?evelopment of Precipitated Iron Fis sch Catalysts
’4h ik Final Technical
Texas Engineering Experiment Station Project 32525-44580

7/28/2019 808495(1).pdf
http://slidepdf.com/reader/full/8084951pdf 2/240
DOEYPCY93069
Development of Precipitated Iron Fischer-Tropsch Catalysts
Final Technical Report
Texas Engineering E xperiment Station Project 32525-44580
Prepared by: Dr. Dragomir B. Bukur
Contributors:
Dr. X. Lang
Dr. S. C h o k k a r b
Dr. Y. Ding
Dr. B. Reddy*
Dr. L. Nowicki Dr. S. Xiao
Texas A&M UniversityDepartment of Chemical EngineeringCollege Station, Texas 77843 -3122
July 22,199 9
Prepared for the Pittsburgh Energy Technology Center,
the United States Department of Energy Under Contract No. DE-AC22-94PC93069
Richard E. Tischer, Project Manager (PETC)
“US. epartment of Energy Patent Clearance not requiredprior to publication of this document”
7/28/2019 808495(1).pdf
http://slidepdf.com/reader/full/8084951pdf 3/240
Disclaimer
Th is report was prepared asan
account of work sponsored by an agency of the UnitedStates Government. Neither the United States Government nor any agency thereof, nor any
of their emp loyees, makes any warranty, express or implied, o r assumes an y legal liability or
responsibility for the accuracy, completeness, or usefulness of any information, apparatus,
product, or process disclosed, or represents that its use would not infringe privately owned
rights. Reference herein to any specific commercial product, process, or service by trade
name, trademark, manufacturer, or otherwise does not necessarily constitute or imply its
endorsemen t, recommendation, or favoring by the United States Government o r any agency
thereof. The views and opinions of authors expressed herein do not necessarily state or
* reflect those of the U nited States Government or any agency thereof.

7/28/2019 808495(1).pdf
http://slidepdf.com/reader/full/8084951pdf 4/240
Abstract
Despite the current worldwide oil glut, the United States will ultimately require large-
scale production of liquid (transportation) fuels from coal. Sluny phase Fischer-Tropsch (F-T)
technology , with its versatile product slate, may be expected to play a major role in production
of transportation fuels via indirect coal liquefaction.
Some of the F-T catalysts synthesized and tested at Texas A&M University under DOE
Contract No. DE-AC22-89x89868 were more active than any other known catalysts
developed for maximizing production of high molecular weight hydrocarbons (waxes). The
objectives of the present contract were to demonstrate repeatability of catalyst performance and
reproducibility of preparation procedures of two of these catalysts on a laboratory scale.
Improvements in the catalyst performance were attempted through the use of: (a) higher
reaction pressure and gas space velocity to maximize the reactor productivity; (b) modifications
in catalyst preph ation steps; and (c) different pretreatment procedures.
- ~
haveyield
Repeatability of catalyst performance and reproducibility of catalyst synthesis procedure
been successfu!ly demonstrated in stirredtank
sluny reactor tests. Reactor space-time-was increased up to 48% by increasing reaction pressure from 1.48 MPa to 2.17 MPa,
while maintaining the gas contact time and synthesis gas conversion at a constant value. Use
of calcination temperatures above30O0C,dditional CaO promoter,andor potassium silicate as
the source of potassium promoter, instead of potassium bicarbonate, did no t resuit in improved
catalyst performance. By using differen t catalyst activation procedures we were able to
increase substantially the catalyst activity , while maintaining low methane and gaseous
hydrocarbon selectivities. Catalyst productivity in runs SA-0946 and SA-2186 was 0.71 and
0.86 gHClg-Felh, respectively, and this represents 45-75% improvement in productivity
relative to that achieved in Rheinpreussen's demonstration plant unit (the most successful
bubble column sluny reactor performance to date), and sets new standards of performance for
"high alpha" iron catalysts.
7/28/2019 808495(1).pdf
http://slidepdf.com/reader/full/8084951pdf 5/240
..l..
TABLE OF CONTENTS
PageAbstract......................................................................................................................... ll
List of Tab les................................................................................................................. V
List of Figures................................................................................................................ vii
L Executive Summary........................................................................................... I- 1
rI. Introduction ....................................................................................................... 11-1
..
1. Objectives and Scop e of Work................................................................ 11-2
2. Engineering Modification and Training of New Personnel................... 11-6
3. References............................................................................................... 11-7
111-1 esults and Discussion...................................................................................................
I IL Testing of Previously Synthesized Catalysts...................................................... 111-1
-
Charac terization Studies........................................................... 111-1
2. Reaction Studies with Catalysts d C............................................... 111-7
Stirred Tank Slurry Re ts of Catalyst B (100 Fd
5 Cu/6 W24 SiO, )....................................................................... 111-7
StirredTank Slurry Reactor Tests of Catalyst C (100 F d
3 Cu/4 W16 SiO, )...................................................................... 111-18
3. References................................................................... ...................... 111-28
1.
2.
ducib ility of C atalyst Preparauon.............................................................1. Catalyst Characterization Studies........................................................... IV- 1
IV- 1
2. Reaction Studies ..................................................................................... IV- 18
Stirred Tan k Slurry Reactor Tes ts of Catalyst B........................ 1v-18
Stirred Tank Slurry Reactor Tests of Catalyst C........................ 1v-24
3. References.............................................................................................. 1v-34
1.2.
V. The Effect of Source of Potassium and Basic Oxide Promoter.......................... V- 1
1. Cata lyst Characterization Studies........................................................... V- 1
2. Reaction Studies..................................................................................... V- 12
\ Fixed Bed Reactor Tests of M odified Catalysts B and C.......... V- 12
Continuos Stirred Tank ReactorTestsof Modified
Catalysts B and C....................................................................... V- 19
1. Effect of CaO Promotion on Performance of Catalyst C V- 19
2. Effect of CaO Promotion and Potassium
V-25
1.2.
Source on Performance of Catalyst B............................
...111

7/28/2019 808495(1).pdf
http://slidepdf.com/reader/full/8084951pdf 6/240
3.
VI
3.
TA BLE O F C 0 N " S . cont'd
Concluding Remarks on the Effect of CaOPage
Promotion and Source of Potassium.............................. V-32References.............................................................................................. V-33
3.
Pretreatment Effect Research............................................................................. vi-1
1 Catalyst C haracterization Studies........................................................... v1-1
2. Reaction S tudies. retreatment Effect Research................................... v1-20
1 Hydrogen Reductions................................................................. v1-21
2. Effect of Reductant Type........................................................... v1-23
3. Run SA-2186 with 100F d 3 Cu/4W16 SiO,
Catalyst (Batch-4)...................................................................... v1-33
Refetences............................................................................................. v1-39
. . Calcination Effect Research.............................................................................. v11-1
1 Catalyst C haracterization Studies......................................................... v11-2
2. Reaction Studies.................................................................................... v11-9
1 Fixed Bed Reactor Tests............................................................ v11-9
2. StirredTankSlurry Reactor Tests............................................. VII-16
3. References..................................................... :...................................... VII-28
Vm. Catalyst Characterization................................................................................. vd1-1
IX Testing of Alternative Catalysts........................................................................ 1x-1
1 Catalyst Characterization Studies.......................................................... E - 2
2. Reaction Studies.................................................................................... 1x-16
x
XI.
Characterization of Product Distribution and Data Analysis.............................. X-1
Conclusions......................................................................................................... XI-1
XII Acknowledgments............................................................................................ XI[-
Appendix 1 Cata lyst Preparation Procedure...........................................................
Appendix 2. Catalyst Characterization Equipment and Rocedures.......................
Appendix 3. Fixed and Slurry Bed Reactors and Product Analysis System...........
A- 1
A-6
A- 10
iv
7/28/2019 808495(1).pdf
http://slidepdf.com/reader/full/8084951pdf 7/240

7/28/2019 808495(1).pdf
http://slidepdf.com/reader/full/8084951pdf 8/240
VI-1.2.
VI-2.1.
VI-2.2.
VI-2.3.
VII-1.1.
~ VII-1.2.
VII-2.1.
VII-2.2.
K-1.1.
Ix-1.2.
Ix-1.3.
Ix-1.4.
Ix-2.1.
LIST O F TABLES, cont'd
and Passivated Samples of Catalyst C (100 F d3 C d 4 W16 SiO,,
batch-4) and C atalyst B (100 Fd 5 C d 6 W 24 SiO,, batch-3).X-ray D iffraction and MES Results of Pretreated and Used Samples
(Catalyst C: 100Fd3 C d 4 W 16 SiO,, batch-4).
Pretreatment Conditions and T est Designations
Catalyst: 100F d3 C d 4 W16 SiO,.
Effect of Pretreatment Procedure on Catalyst Performance
in Slurry Reactor Tests.
Effect of Pre treatment Procedure on Catalyst Performance
in Slurry Reactor Tests.Effect of Calcination Conditions on he Textural Properties of
Catalysts B and C. '
Iron Phases in Catalysts B and C from Fixed Bed and Slurry
Reactor Tests.
Calcination temperatures and Tes t Designations.
Effect of Calcination Temperature on the Performance
of Catalysts B and C in Slurry Reactor tests.
Elem ental Analysis and Textural Properties of Supports and
Supported Catalysts.
TPR Results for Supported F ischer-Tropsch Catalysts.
Summary of Isothermal Reduction Experiments with Alternative
F-T Catalysts in the TG A Unit.
Iron Phases in Used Catalyst Samples by X-ray D iffraction.
Reduction and ProcessConditions in STSR Tests of
Alternative Catalysts.
Page
VI-3
VI- 14
VI-20
VI-26
VI-32
VII-3
VII-6
VII-10
VII-21
Ix-3
Ix-5
Ix-7
Ix-14
IX-16
vi
7/28/2019 808495(1).pdf
http://slidepdf.com/reader/full/8084951pdf 9/240
LISTOF FIGURES
III- .1
IXI-2.1
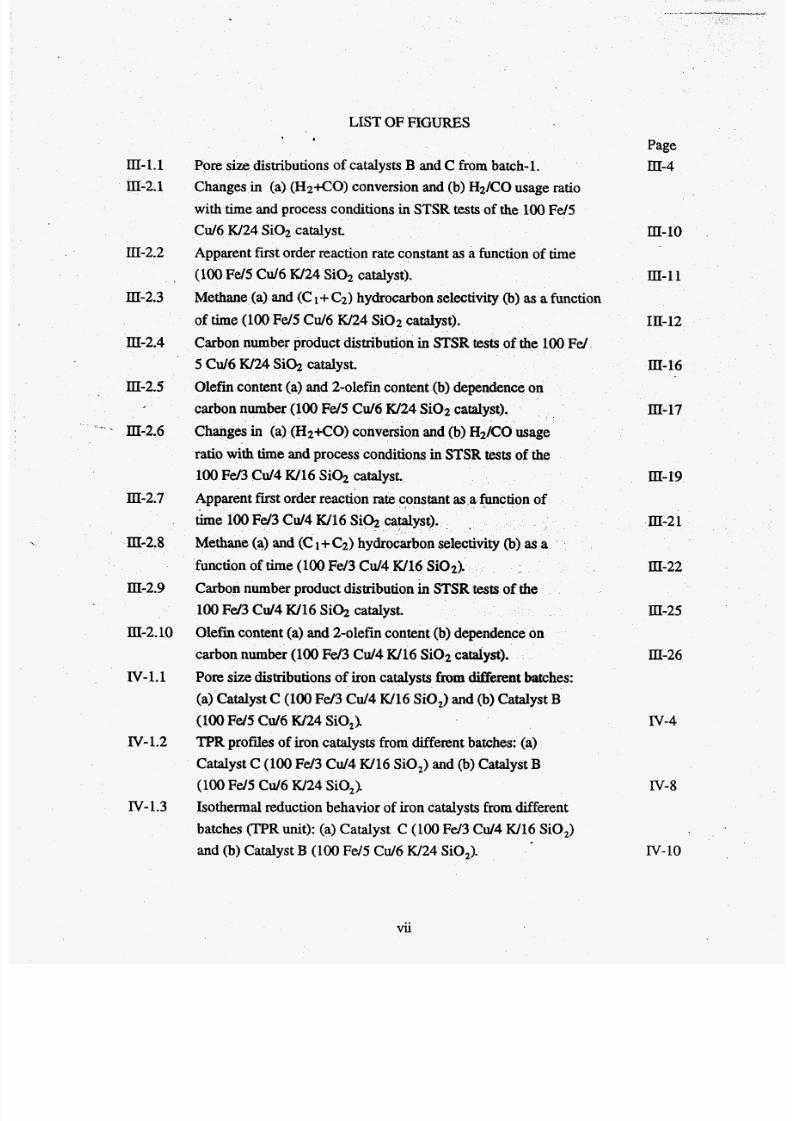
Pore size distributionsof catalysts B and C from batch-1.
Changes in (a) (H2+CO) conversion and (b) H2/CO usage ratio
with time and process conditions in STSR tests of the 100Fd5
Cu/6 W2 4 Si0 2 catalyst.
111-2.2
IV- .1
Page
m -4
m-loApparent first order reaction rate cons tant as a function of time
Methane (a) and (C I + C2) hydrocarbon selectivity (b) as a function
Carbon number product distribution in STSR tests of the 100F d
O le fii content (a) and 2-olefin content (b) dependence on
Changes in (a) (H2+CO) conversion and (b) H2K O usage
ratio with time and process conditions in STSR ests of the
Apparent first order reaction rate constant as a function of
Methane (a) and (C 1
+C2) hy on selectivity (b) as a
function of time (10 0 Fd3 C d 4 W 16 Si021
Carbon num ber product distribution in STSR ests of the
100F d 3 C d 4 W 16 Si@ catalyst.
O le fii content (a) and 2-olefin content (b) dependence on
carbon number (100 F d 3 C d 4 W16 Si02 catalyst).
Pore sizedistributions of iron catalystsfromMerent batches:
(a) Catalyst C (100 F d 3 C d 4 W 16 SiO,) and (b) C atalyst B
(100Fd5 C d 6 W 24 SiO,)
TP R profdes of iron cata lysts from different batches: (a)
Catalyst C (100F d 3 Cu/4 W16 SO,) and (b) Catalyst B
(100Fd5C d 6 W24 SiO,).
Isothermal reduction behavior of iron catalysts from different
batches (TPR unit): (a) Catalyst C (100 F d 3 Cu/4 W16 SiO,)
and (b) Catalyst B (lo0 Fe/5 Cu/6 W24 SiO,).
(100F d 5 C d 6 W24 Si02 catalyst).
of time (100 FdS Cu/6 W2 4 Si 02 catalyst).
m-11
111-2.3
III-12
III-2.4
III-2.5
III-2.6
5 C d 6 W 24 Si@ catalyst. 111-16
carbon number (100 F d 5 Cu/6 W24 Si02 catalyst). III-17
100Fe/3 C d 4 W16 Si& catalyst.
time 100F d 3 C d 4 W 16 Si@ 0. . 111-21
m-19
111-2.7
III-2.8
III-2.9
III-2.10
IV-1.2
IV-1.3
m-22
Et-25
III-26
Iv-4
IV-8
rv-10
vii
7/28/2019 808495(1).pdf
http://slidepdf.com/reader/full/8084951pdf 10/240
IV-1.4
IV-1.5a
IV-1.5b
IV-1.6
*-.~
Iv-2.1
Iv-2.2
IV-2.3
IV-2.4
IV-2.5
IV-2.6
IV-2.7
IV-2.8
v-1.1
LIST OF FIGURES, cont'd
Page
Isothermal reduction behavior of iron catalysts from different
batches (TGA unit): (a) Cata lyst C (100 Fd3 C d 4 W16 SiO,)
XRD atterns of reduced (TOS =0 h) catalysts from slurry tests with
catalyst C (100 Fd 3 C d 4 W 16 SiO,) from different batches: (A) SB-
XRD patterns of reduced VOS =0 h) catalysts from slurry tests
with catalyst B (100 Fd5 C d 6 W 24 SiO,) from different batches:
Changes in bulk iron phases with time on stream during runSB-2145 with cataly st C (100 Fd3 Cu/4 Ki16 SiO,, batch-4):
(A ) TO S =0 h; (B)TOS = 67 h; C) TOS = 145 h; (D)
Synthesis gas conversion (a) and apparent reaction rate constant
(b) as a function of time for STSR tests of cata lyst B.
Methane selectivity (a) and (C1+ C2) hydrocarbon selectivity (b) as
a function of time for STSR tests of cata lyst B.
Synthesis gas conversion as a function of time for STSR tests of
catalys t B. IV-22
Methane selectivity (a) and (C 1+ C2) hydrocarbon selectivity (b)
Synthesis gas conversion (a) and apparent reaction rate constant
Methane selectivity (a) and (C 1+ C2) hydrocarbon selectivity (b)
Synthesis gas conversion as a function of time for STSR tests
Methane selectivity (a) and (C 1+ C2) hydrocarbon selec tivity (b)
Effect of potassium source on the pore size distributions of
(a) Catalyst C (100Fd3 Cu/4 W16 SiO,) and (b) Catalyst B
and (b) Catalyst B (100 F d 5 C d 6 W 24 SiO,). IV-11
2695, batch-2; (B) SA-2715, batch-3; and (C) SB-2145, batch-4. IV-15
(A) SB-2615, batch-4; (B) SB-2585, batch-5. Iv-15
TOS =213 h and (E) TOS =401 h. Iv-17
PI-19
Iv-2 I
as a function of time for STSR tests of catalyst B. IV-23
(b) as a function of time for STSR tests of catalystC. IV-26
as a function of time or STSR tests of catalystC. IV-28
of catalyst C. IV-29
as a function of time for ST SR tests of cata lyst C. IV-30
(100 Fd 5 C d 6 W 24 SiO,). v-5
viii
7/28/2019 808495(1).pdf
http://slidepdf.com/reader/full/8084951pdf 11/240
v-1.2
V-1.3
v-2.1
v-2.2
I V-2.3
V-2.4
V-2.5
V-2.6
V-2.7
V-2.8
V-2.9
LIST OF FIGURES, ont'd
Effect of calcium addition on the pore size distributions of (a)
Catalyst C (100 F d 3 C d 4 W16 SiO,, batch-3) and (b) CatalystB (100F d 5 C d 6 W24 SiO,, batch-3).
Effect of calcium addition on TPR profiles of ca talysts B and C.
Effect of sou rce of potassium and CaO promoter on (a)
synthesis gas conversion and (b) HJCO usage ratio in fixed
bed reactor tests with cata lysts containing 16parts of S iO,
per lo0 parts of Fe.
Effect of source of potassium and CaO promoter on (a) methane
selectivity and (b) (C, -C,)hydrocarbon selectivity in fixed
bed reactor tests with ca talysts containing 16 parts of SiO, per 100
Effect of source of potassium and CaO promoter on (a) synthesis
gas conversion and (b) H,/CO usage ratio in fixed bed reactor tests
with catalysts contain ing 24 parts of SiO, per 100parts of Fe.
Effect of source
selectivity and (b) (C, - C,) hydrocarbon selectivity in fixed
bed reactor tests with catalysts containing 24.parts of SiO, per
100parts of Fe.Effect of C aO prom oter on (a) synthesis gas conversion and
(b) apparent reaction rate constant in STSR testswith catalysts
containing 16parts of SiO, per 100parts of Fe.
Effect of CaO prom oter on (a) methane selectivity and (b)
(C, - C,) hydrocarbon selectivity in STSR tests with catalysts
containing 16parts of SiO, per 100parts of Fe.
Effect of CaO promoter on (a) olefrn content and (b) 2-olefin
content as a function of carbon number for catalysts containing
16 parts of SiO, per 100parts of Fe.
Effect of source of po tassium and CaO promoter on (a)
synthesis gas conversion and (b) apparent reaction
rate constant in STSR ests with catalysts containing 24
parts of SiO, per 100parts of Fe./Effect of source of potassium and CaO promoter on (a) methane
parts of Fe. V-16
potassium and CaO promoter on (a) methane
v-22
V-23
Page
V-6
v-7
V- 14
V- 17
v-18
v-20
V-26
selectivity and (b) (C, - C,) hydrocarbon selectivity in STSR

7/28/2019 808495(1).pdf
http://slidepdf.com/reader/full/8084951pdf 12/240
LIST O F FIGURES, cont'd
tests with catalysts containing 24 parts of SiO, per 100 parts
of Fe (for the descrip tion of symbols see Figure V-2.8).
Effect of source of potassium and CaO promoter on (a) olefin
content and (b) 2-olefm content as a function of carbon number
for catalysts containing 24 parts of SiO, per 100 parts of Fe.
Effect of source of potassium on carbon number product
Effect of reduction temperature on the reduction behavior of catalyst
C (100 F d 3 Cu/4 W16 SiO,, batch-4) in hydrogen under isothermal
Effect of reduction temperature on the reduction behavior of catalyst
B (100 Fd5 Cu/6 W24 O ,, batch-3) and the Ruhrchemie catalyst
Effect of reduction temperature on the reduction behavior and weight
changes of catalyst C (100 F d 3 Cu/4 W16 SiO,, batch-4) in CO
Effect of reduction temperature on the reduction behavior and
weight changes of catalyst B (100 Fd5 C d 6 W24 SO,, batch-3)
and the Ruhrchemie catalyst in CO under isothermal conditions
V-2.10
V-2.11
distribution in STSR tests of catalyst B. V-30
VI-1.1
conditions in TGA apparatus. VI-5VI-1.2
I-* I^ in hydrogen under isothermal conditions in TGA apparatus. * VI-6
VI-1.3
under isotherm al conditions in TGA apparatus. VI-7
VI-1.4
in TGA apparatus. VI-9
VI-1.5 Com parison duction behavior and weight changes of catalyst
C (100 Fd3 C d 4 W16 SiO,, batch-4) and catalyst B (100 F d 5
Cu/6 W24 SO,, batch-3) in syngas (H,/CO =0.67) under
isothermal conditions inTG A apparatus.
Reduction behavior and weight changes of catalystsB and C in
TGA unit. Reduction conditions: catalyst B in H, at 25OOC for
4 h then switched to syngas a t 260OC; catalyst C in H, at 240OCfor 2 h then switched to syngas at 260°C for 6 h.
XRD patterns of catalyst C (100F d 3 C d 4 W16 SiO,, batch-4)
after pretreatment with hydrogen at different conditions in a
slurry reactor.
XRD patterns of catalyst C (100 F d 3 C d 4 W16 SiO,, batch-4)
after different pretreatments in a slurry reactor. J
VI-1.6
VI-1.7
VI-1.8
Page
V-27
V-29
VI- 10
VI-12
VI- 15
VI-I6
X

7/28/2019 808495(1).pdf
http://slidepdf.com/reader/full/8084951pdf 13/240
VI- .9a
VI- .9b
VI- .10a
VI- . lo b
VI-2.1
VI-2.2
VI-2.3
VI-2.4
VI-2.5
VI-2.6
VI-2.7
VI-2.8
VII-1.la
VII-l.lb
LIST OF FIGURES, ont'd
Page
Changes in bulk iron phases with time on stream in a slurry ,
Changes in bulk iron phases with time on stream in a slurry
Changes in bulk iron phases with time on stream in a slurry
Changes in bulk iron phases with time on stream in a slurry
reactor (cataly st C, run SA- 1626, reduced in syngas, at 280OC for 8 h).
Synthesis gas conversion (a) and apparent reaction rate constant (b)
as a function of time fo r STSR tes ts of ca talyst C reduced with
Methane selectivity (a) and (C I + C2) hydrocarbon selectivity (b)
as a function of time for time for STSR tests of ca talyst C reduced
Olefin conten t (a) and 2-olefin content (b) dependence on carbon
number for catalyst C reduced with hydrogen at different temperatures.
Effec t of reductan t type on (a) synthesis gas conversion and (b)
Effec t of reduc tant type on (a) methane selectivity and (b) (C1+ C2)
Effec t of reductan t type on (a) olefin content and (b) 2-olefin
Synthesis gas conversion (a) and apparent reaction rate cons tant
(b) as a function of time for STSR test of catalyst C after TAMU
pretreatment procedure.
Methane selectivity (a) and (C 1+ C2) hydrocarbon selectivity (b)
as a function of time for time for STSR tests of catalyst C after
TAMU pretreatment procedure.
Effect of ca lcination temperature on the pore size distribution of w
catalyst C (100 Fe/3 Cu/4 W16 SO,, batch-4).
Effect of calcination temperature on the pore size distribution of
catalvst B (100 F d 5 C d 6 W24 SiO,. batch-3).
reactor (catalystC, run SB-2486, No pretreatment). VI-17
reactor (catalyst C, run SB-3425, reduced in H,, at 250°C for 4 h). VI- 17
reactor (ca talyst C, run SA-0946, reduced in CO , at 280OC for 8 h). VI- 9
VI- 19
hydrogen at different temperatures. vi- 22
with hydrogen at differen t temperatures. VI-24
VI-25
apparent reaction rate constant in STSR testswith catalyst C. VI-28
hydrocarbon selectivity in STSR tests with catalystC. VI-29
content in STSR tests with catalyst C. VI-3 1
VI-34
VI-36
VII-5
VII-54
xi
7/28/2019 808495(1).pdf
http://slidepdf.com/reader/full/8084951pdf 14/240
LIST OFFIGURES, ont'd
VII-1.2
VII-2.1
' VII-2.2
VII-2.3
--YII-2.4
VII-2.5
VU-2.6
VII-2.7
VII-2.8
VII-2.9
VII-2.10
Changes in bulk iron phases w ith time on stream during run
SB - 1276 with catalyst B (100 Fd5 Cu/6 W24 SO,, batch-3)
calc ined at 700OC for 1 h and reduced a t 250°C in H, for 4 h:
(A ) TOS = 0 h; (B) TOS = 138 h; (C) TOS = 239 h; (D)
T O S = 3 1 1 h ; @ ) T O S = 3 8 4 h .
Synthesis gas conversion as a function of time for fmed bed
reactor tests of cata lyst B calcined at different temperatures.
Methane selectivity (a) and (C2-C4) hydrocarbon selectivity (b)
as a function of time for fi ie d bed reactor tests of catalyst
B calcined a t different temperatures.Synthesis gas conversion as a function of t h e for fixed bed
reactor tests of catalyst C calcined a t different temperatures.
Methane selectivity (a) and (C2- C4) hydrocarbon selectivity (b)
as a function of time for fixed bed reactor tests of catalyst
B calcined at different temperatures.
Synthesis gas conversion (a) and apparent reaction rate constant
(b) Bs a function of time for STSR tests of catalyst B calcined at
different temperatures.Methane selectivity (a) and (C I + C,) hydrocarbon selectivity (b)
as a function of time fo r STSR tests of cata lyst B calcined at
different temperatures.
Olefin content (a) and 2-olefin content (b) dependence on carbon
number for catalyst B calcined at different temperatures.
Synthesis gas conversion (a) and apparent reaction rate constant
(b) as a function of time for STSR tests of cataly st C calcined at
different temperatures.Methane selectivity (a) and (C 1+C2) hydrocarbon selectivity (b)
as a function of time fo r STSR tests of catalyst C calcined at
different temperatures.
Olefin content (a) and 2-olefin content (b) dependence on carbon/
number for catalyst C calcined at different temperatures.
-
Page
VII-8" -
VII-11
VII-13
VII-14
VII-15
VII-17
VII-19
VII-20
VII-23
VII-24
VII-26
xii
7/28/2019 808495(1).pdf
http://slidepdf.com/reader/full/8084951pdf 15/240
LIST OF FIGURES, ont'd
Ix-1.1
Ix-1.2
IX- .3
IX- .4
IX-1.5
. .
IX-1.6
Ix-1.7
Ix-1.8
Ix-2.1
Ix-2.2
IX-2.3
A l- 1
A3-
A3-2.
A3-3.
Effect of copp er addition on theTPR behavior of silica supported iron
catalysts:(a) 100Fe/5,Cu/6 W139 SiO,; and (b) 100FdlO C d 6
W134 SiO,.
Effect of copp er addition on the TPR behavior of alumina supported
iron catalysts: (a) 100 Fe/5 C d 6 W139 A Z O 3 ; nd (b) 100 FdlO
C d 6 W134 40,.
Effec t of alumina con tent and reduction temperature on the reduction
behavior of promoted Fischer-Tropsch cata lysts in hydrogen: (a) 100
Fd5 Cd4.2 W20 Al,O,; (b ) 100Fd5 Cd4.2W31.6Al,O,.
Effect of copper promotion on the degree of reduction of silica
supported iron catalysts in hydrogen at 280OC.
Effect of copper promotion on the degree of reduction of alumina
supported iron catalysts in hydrogen at 280OC.
Effect of cop per promotion on the reduction behavior of silica
supported iron catalysts in CO t 28OOC.
Effect of copp er promotion on the reduction behavior of alumina
supported iron catalysts in COat 28OOC.
Changes in bulk iron phases with time on stream during run
SA-0097 with the 100Fd5 Cd4.2 W20 Al,O, catalyst.Synthesis gas conversion (a) and H,/CO usage ratio (b) as a
function of time for STSR testsof alternative catalysts and the
baseline ca talyst C.
Apparen t reaction rate constant as a function of time for STSR
tests of a lternative catalysts and the baseline catalysts B and C.
Methane selectivity (a) and (C 1+ C2) ydrocarbon selectivity
(b) as a function of time for STSR tests of alternative catalysts
and the baseline ca talyst C.
Steps in preparation of alumina or silica supported catalysts.
Schem atic diagram of fixed bed reactor system used fo r
catalyst testing.
Schem atic of stirred tank slurry reactor system./Ana lysis of F ischer-Tropsch synthesis products with automated
data acqu isition and reduction system.
Page
Ix-4
Ix -4
Ix-8
Ex- 0
E-0
Ix-12
Ix-12
IX-15
IX-18
IX- 19
Ix-2 1
A-5
A-11
A- 13
A- 15
...X U
7/28/2019 808495(1).pdf
http://slidepdf.com/reader/full/8084951pdf 16/240
I EXECUTIVE SUMMARY
Slurry phase Fischer-Tropsch (F-T) processingis
a very promising alternative toconventional vapor phase processes, but additional improvements are needed in the catalyst
performance (higher activity, minimization of methane and low molecular weight hydrocarbon
yields, and better catalyst stab ility) in order to accelerate commercialization of this technology.
This can be achieved in several ways: (a) through development of new improved catalysts; (b)
use of novel reactor configurations; (c) use of suitable catalyst pretreatment (activation)
procedures or through combination of these methods, as demonstrated in studies at Texas
A&M University ( T A N ) sponsored by DOE (Contracts DE-AC22-85PC8011 and DE-AC22-
89PC89868). Some of the iron based catalysts synthesized and tested a t TAM U, have proven
-- to be more active than any other known iron F-T catalysts developed for maximizing
production of high molecular weight hydrocarbons (Bukur et ai., 19pQ).
The overall objectives of this contract are to: (1) demonstrate repeatability of
performance and p r e p t i o n procedure of two high activity, high alpha iron F-T catalysts
synthesized at TAMU during the DOE Contract DEAC22-89PC89868; and (2)
improvements in the catalyst performance through variations in process conditions,
pretreatment procedures and/or m odifications in preparation steps (e.g. means of introduction
of promoters and calcination conditions). The major accomplishmentsare summarized here.
. .ReDeatabw of P of Baseli ne Catalvm
The objective of this task is to verify repeatability of results obtained in stirred tank
slurry reactor (ST SR) tests of two catalysts designated B (100 Fe/5 Cd6W24 i@ containing
55.4 wt% of iron) and C (100 Fe/3 Cd4 W16 Si@ containing 59.7 wt% of iron) during the
previous DOE ContractDE-AC22-89PC89868. These two catalysts were chosen due to their
excellent performance (high syngas conversion and lo w methane and gaseous hydrocarbons
selectivities)in slurry reactor tests. The catalysts from the same preparation batch and the same/
I - 1
7/28/2019 808495(1).pdf
http://slidepdf.com/reader/full/8084951pdf 17/240
pretreatment and process conditions, were employed as in the previous slurry reactor tests of
these two catalysts.
Three tests were conducted with each of the two catalysts. In the original tests
conducted in 1991 (SB-1931 with the catalyst B, and SB-0261 with the catalyst C) n-
octacosane was used as the initial medium. In the four tests conducted during the current
contract, Ethylflo 164 oil (a hydrogenated 1-decene homopolymer liquid - C30, obtained from
Ethyl Co.) was used as the start-up fluid, due to problems encountered in three initial tests
using n-octacosane as the start-up liquid (low activity in all three tests). The effect of reactor
set-up (slurry A vs. slurry B reactor system) was investigated in two recent tests with the
catalyst C (ru ns SB-0045 and SA-0705). In general, reproducibility of results in multiple tests
of the same catalyst may be ed as quite satisfactory. The catalyst B (100 Fe15' Cu/6 W24
-* e- Si02) was more stable in the original test (SB-193 1) than in the two recent tests (SB-3354 and
SB-0663, whereas the opposite trend was observed in tests with the catalyst C (100 Fe/3 Cu/4
W16 Si02 ). Hydrocarbon product distributions and olefin selectivities in multiple tests with
the same c a h y s t were reproducible.
Performance of catalysts B and C is comparable to, or exceeds, that obtained in the two
most successful bubble column slurry reactor (BCSR ) tests conducted by Mobil (Kuo, 985)
and Rheinpreussen (Kolbel et al., 1955). In Mobil's run a - 2 5 6 - 1 3 at synthesis gas
conversion of 82%,methane and C1+C, selectivities were 2.7 and 5.6 wt%, respectively,
whereas the catalyst productivity was about 0.26 g HC/g-cat/h v e s t conditions: 257OC, 1.48
MPa, 2.3 Nl/g-Feh, H2/CO =0.73). In Rheinpreussen's demonstration plant unit the Cl+C,
selectivity was 6.8% at the synthesis gas conversion of 89%,and the catalyst productivity wa s
about 0.33 g HC/g-cat/h v e s t conditions: 268"C, 1.48 MPa, 3.1 Nl/g-Fe/h, H2/CO =0.67).
In run SB-3354 with catalyst B (TOS = 97 h) the following results were obtained at
260°C, 1.48 MPa, 3.2 Nl/g-Fe/h, H2/CO = 0.67: Methane and C1+ C, selectivities were 3 . 2
and 5.3 wt%, respectively, and the cata lyst productivity was 0.26 g HC/g-cat/h at the synthesis
gas conversion of 71.5%. The catalyst performance in the original test of the catalyst B (runt/
1-2
7/28/2019 808495(1).pdf
http://slidepdf.com/reader/full/8084951pdf 18/240
SB-1931) as even better, i. e. higher activity and lower methane and gaseous hydrocarbon
selectivities were obtained (Bukur et al., 1994).
The performance of catalyst C in run SB-0045 t the reaction pressure of 1.48h4Pa and
215 hours on stream , was very similar to that obtained in M obil's run a-256 -13 . However,
the productivity of catalyst C was improved at reaction pressure of 2.17 MPa and gas space
velocity of 3.4 NVg-Fe/h (TOS = 336 h). Methane and C1+C, electivities were 2.6 and 5.4
wt%, respectiveiy, and the catalyst productivity was 0.36 g HClg-catlh at the synthesis gas
conversion of about 80%. The latter productivity is higher than productivity's obtained in
Mobil's and Rheinpreussen 's bubble column slurry reactor tests, primarily due to the use of
higher reaction pressure and higher gas space velocity in the present study.
* - Reproduc bilitv of W v s t Prep- Procedurg
Repeatability of performance of catalysts B and C was demonstrated in multiple tests
with catalysts from different preparation batches. Three STSR tests were conducted with
catalyst B, and four tests with catalyst C. In general, catalysts from different preparation
batches had similar performance (activity and selectivity) and reproducibility of catalyst
preparation procedure is regarded as satisfactory.
Syngas conversions, methane and (21% selectivities obtained in tests with catalysts B
and C were similar to those obtained in two tests conducted in slurry bubble column reactors
(Mobil's and Rheinpreussen's tests). However, the catalyst productivity in two tests with
catalyst C (runs SA-1665 ndSB-0045), at 2.17 MPa, was even higher (0.53 or 0.60 g HC/g-
Fe/h) than that obtained in Rheinpreussen's test (0.49 g HC/g-Fe/h), whereas at the reactionpressure of 1.48 Mpa the catalyst productivity of our catalysts B and C (0.38-0.42 g HC/g-
Fe/h) was similar to that obtained in Mobil's study (0.39 g HC/g-Fe/h). Due to complete
reactor backmixing in our experiments (stirred tank reactor) it may be expected that the catalyst
productivity under the same process conditions would be even higher in a reactor with partial
fluid mixing (e.g., bubble column slurry reactor). I/
1-3
7/28/2019 808495(1).pdf
http://slidepdf.com/reader/full/8084951pdf 19/240
The Effect of Basic Oxide Prom o er and Source o Potassiutq
Four catalysts conbin ing CaO promoter with nomind compositions 100 Fe/3 Cd4 Wx
Ca/16 SiO, and 1 0 0 Fe/5 Cu/5 W XCd24 SO,, where x = 2 or 6, were synthesized and tested
in fixed bed reactors. The major findings from these tes ts are that the addition of small
amounts of CaO promoter (x = 2) results in the catalyst performance (activity and gaseous
hydrocarbon selectivity) similar to that of the baseline catalysts B and C, whereas the addition
of a larger amount of CaO (x = 6) results in markedly lower catalyst activity in comparison to
the baseline catalysts. Selectivity of the two catalysts with x = 6, is similar to that of the
corresponding baseline catalysts. On the basis of these results it was decided to evaluate two
catalysts with x = 2 in stirred tank luny reactors.
The 100 Fe15 Cd5 IU2 Ca/% SiO, catalyst was tested in run SA-2405, and its
- q -- performance was compared to that of the baseline catalyst B in run SB-1295, whereas results
from run SB-3 115 with the 100 Fe/3 Cu/4W2Cd16 SiO, catalyst were compared with results
obtained with the catalyst C in run SA-1665. General trends in tests with the CaO containing
catalysts showed some similarities, as well as differences. For example activity of the 100
Fe/5 Cd5 W2 Cd24 SiO, catalyst (run SA-2405) was nearly the same as that of the baseline
catalyst B (run SB-1295) but its stability with time (deactivation rate) was better, whereas the
100 Fe13 Cd4W 2 Cd16 SiO, catalyst (run SB-3115)was less active (about 15%) than the
baseline catalyst C (run SA-1665) and its deactivation rate was higher. At reaction pressure of
1.48 MPa, selectivity of gaseous hydrocarbons on CaO containing catalysts was higher than
that of the corresponding baseline catalysts. However, at reaction pressure of 2.17 MPa the
gaseous hydrocarbon selectivity decreased on the CaO containing cata lysts, and was nearly thesame as that of the baseline catalysts at 1.48 MPa. It appears that the selectivity of the CaO
promoted catalysts improves at higher reaction pressures, whereas the selectivity of the catalyst
C is essentially independent of reaction pressure (at a constant PlSV ratio to maintain a constant
value of the gas residence time at different pressures). The addition of CaO promoter did not
result in improved performance of the baseline catalysts, but the CaO promoted catalysts may/
1-4
7/28/2019 808495(1).pdf
http://slidepdf.com/reader/full/8084951pdf 20/240
be suitable for operation at higher reaction pressures. Fina lly, it is possible that the
performance of CaO promoted catalysts may be improved with the use of different pretreatment
procedures, but this has not been investigated in the present study.
Some d ifferences in catalyst performance were observed in fixed bed tests of catalysts
B (runs FA-1725 and FB-1715) and C (runs FA-1605 and FB-1985) prepared by different
methods. In both c ase s, the activity and methane selectivity of catalysts prepared using
potassium silicate as the source of potassium promoter were higher than those of the
corresponding baseline catalysts prepared by incipient wetness impregnation using KHCO, as
the source of potassium promoter. On the other hand, in two slurry reactor tests of catalyst B
(SB-1295 - K from KHCO,, and SA-3155 - K from K$iO,> it was found that the activity of
the catalyst prepared from &SO3 is about 15 % lower than that of the catalyst prepared by
KHCO, im pregnatio n, whereas gaseous hydrocarbon selectivities were similar after about 140
h on stream.
-*---
On the basis of these results we conclude that the baseline procedure utilizing
impregnation of Fe-Cu-SiO, precursor with the aqueous solution of KHCO, s the preferred
method of catalyst preparation. The second procedure, which avo ids the impregnation step ,
provides satisfactory results, and may be used as an alternative.
Pretreatment Effect Research
. The effect of different pretreatment procedures on the performance of catalyst C (100
Fe/3 C d 4 W 16 SiO,, batch-4) was studied in a STSR. Seven different pretreatment
procedures were employed: three with hydrogen as reductant at different temperatures (240-
280"C), CO and synthesis gas ( W C O = 0.67) pretreatments at 280°C or 8 hours, TAMU
pretreatment, and no pretreatment before testing at 1.48 m a , 26OoC,1.4-2.3 Nl/g-cat/h with
synthesis gas with H&O molar feed ratio of 0.67.J
Significant improvements in the catalyst activity were obtained through the use of
different pretreatment procedures. Our standard reduction procedure with the catalyst C
1-5
7/28/2019 808495(1).pdf
http://slidepdf.com/reader/full/8084951pdf 21/240
(hydrogen reduction at 240°C for 2 hours) resulted in the initial activ ity, expressed in terms of
the apparent reactiqn rate constant, of about 250 mmollg-Fe/MPa/h. The activity decreased
with time and at about 400 h the apparent rate constant reached the value of 220 mmol/g-
Fe/MPa/h (run SA-1665) or 140 mmoYg-Fe/MPa/h (run SB-2145). The initial activity of the
catalyst reduced with hydrogen at 250°C fo r 4 hours (run SB-3425) was about 350 mmol/g-
Fe/MPa/h, which represents a 40% increase relative to the standard reduction procedure.
However, the catalyst activity decreased with time and at about 300 h the apparent rate constant
was 250 mmol/g-Fe/MPa/h (similar to the value obtained in run SA-1665).
The CQ pretreatment (SA-0946), syngas pretreatment (SA-1626) and TAMU
' pretreatment (SA- ted in improved catalyst activity
reduction proced
pretreatments, were 300-400 mmol/g-Fe/MPa/h, corresponding to 20-60% increase in activity
relative to the standard procedure. Activity of the COand TAMU pretreated catalysts increased
with time, and a t 400 hours the values of the apparent reaction rate constants were 360 and 430
mmol/g-Fe/Mpa/h, of the improvement in the catalyst activity, while
maintaining low me
---
us hydrocarbon selectivities, the catalyst productivities in
these two tests were markedly higher than those obtained in Mobil's and Rheinpreussen's
slurry bubble column reactor tests. The catalyst productivity in Rheinpreussen test was 0.49
gHC /g-Fe/h, and those obtained in runs SA-0946 and SA-2186 were 0.71 and 0.86 gHC/g-
Felh, respectively. Th is represents 4575% improvement in catalyst productivity relative to
that achieved in Rheinpreussen 's demonstration plant unit, and sets new standards of
performance for "high alpha" iron catalysts. We believe that the performance of our catalyst B
(100 Fe/5 Cd6 K124 SiOJ can be also improved through the use of better pretreatment
procedures./
1-6

7/28/2019 808495(1).pdf
http://slidepdf.com/reader/full/8084951pdf 22/240
7/28/2019 808495(1).pdf
http://slidepdf.com/reader/full/8084951pdf 23/240
Three catalysts 100Fe/5 Ctd4.2 W2O AI,O, (run SA-OOV), 100Fe/5 Cd 6 W139 SiO,
(SB-0627) and 100 Fe/5 Ctd9 W139 Al,O, (SB-2337) were evaluated in slurry reactor tests.
The alumina containing catalyst 100 Fe/5 Cd4.2 W20 A1,03 was chosen, because of its
similarity with our baseline catalysts B and C (similar promoter, Cu and K, and binder
amounts , except that aluminum oxide was used as the binder instead of silicon oxide). The
alumina and silica supported catalysts were chosen because they are expected to have high
mechanical strength and high attrition resistance during testing in slurry reactors.
The alumina containing catalyst (SA-0097) was markedly less active and had higher
methane and gaseous hydrocarbon se lectivities han the baseline catalysts. The silica supported
catalyst (100 Fe/5 C d 6 deactivated fairly rapidly with time, and had
line catalysts B and
--.. supported catalyst (100 Fe/5 C d 6 W139 AhOJ was the least active, and deactivated rapidly
with time-on-stream. Gaseous hydrocarbon selectivities were higher than those obtained in
tests with the baseline catalysts B and C, ut were lower than those obtained in tests of the
other two alternative catalys ts. The reasons for fairly rapid loss in activity in tests with the
alumina and silica supported catalysts are not understood at the present time. In ge
performance of the three alternative catalysts was inferior in comparison to our baseline
catalysts./
1-8
7/28/2019 808495(1).pdf
http://slidepdf.com/reader/full/8084951pdf 24/240
References
Bukur, D. B., Nowicki, L. and Lang, X., "Fischer-Tropsch Synthesis in a Stirred Tank
Slurry Reactor", Chem. Eng. Sci., 4 9 , 4 6 1 5 4 2 5 (1994).
Kolbel, H., Pickerman, P. and Engelhardt, F., 1955, New developments in hydrocarbon
synthesis. Roc . Fourth World Petroleum Congress, Section W/C, p. 227-247. Carlo
Colombo Publishers, Rome.
Kuo, J. C. W., 1985, Two stage process for conversion of synthesis gas to high quality
transportation fuels. Final report prepared fo r DOE Contract No. DE-AC22-
83PC600019, obil Research and Development Cop. , Paulsboro, NJ.J
1-9
7/28/2019 808495(1).pdf
http://slidepdf.com/reader/full/8084951pdf 25/240
I1 INTRODUCTION
Several technologies are currently available or are under development for conversion of
coal-derived synthesis gas to liquid transportation fuels or fuel precursors . Technologies that
have been commercially proven include fixed and fluidized bed Fischer-Tropsch synthesis,
methanol synthesis (fixed bed and slurry phase), and Mobil's methanol to gasoline (MTG)
process. Of these technologies, Fischer-Tropsch (F-T) hydrocarbon synthesis produces the
widest slate of products and has been in operation fo r the longest period. F-T hydrocarbon
synthesis was first developed and practiced in Germany during the 1930's and 1940's using
cobalt catalysts. Subseqaently , the pr@ess was commercialized on a large scale
South Africa. The Sasol process i tubular fixed bed and circulating
operation and uses promoted iron cataiysts(Dry,98 1).
I
Of the various indirect liquefaction technologies, Fischer-Tropsch synthesis offers
many advantages. While hydrocarbon production is generally non selective and is governed by
the so-called Schulz-Flory distribution, the Fischer-Tropsch process has the ability to produce
a range of gaseous and liquid hydrocarbon products that can be easily upgraded via
conventional refining opera tions. The fluidized bed reactors at Saso l, for example, maximize
gasoline yields while the fixed bed process produces predominantly diesel fuel and
hydrocarbon waxes.
In the late 194O's, sluny phase Fischer-Tropsch technology was developed in
Germany (Kolbel and Ralek, 1980). Slurry processing provides the ability to more readily
remove the heat of reaction, minimizing temperature rise across the reactor and eliminating
localized hot spots. As a result of the improved temperature control, yield losses to methane
are reduced and catalyst deactivation due to coking is decreased. Th is, in turn, allows much
higher conversions per pass, minimizing synthesis gas recycle, and offers the potential to
operate with CO-rich synthesis gas feeds without the need for prior water-gas shift. Due to the
simpler reactor design, capital investment in a slurry phase F-T reactor is expected to be
II- 1
7/28/2019 808495(1).pdf
http://slidepdf.com/reader/full/8084951pdf 26/240
/’substantially smaller than in conventional fixed or fluidized-bed systems. In May 1993 the
commercial Slurry Bed Reactor (5 m in diameter, 22 m high) was commissioned by Sasol, as
replacement for its tubular fixed bed reactors (Jager and Espinoza, 1995).
11-1 Objectives and Scope of Work
The slurry phase F-T processing is a very promising alternative to conventional vapor
phase processes , but additional improvements are needed in the catalyst performance (higher
activity , minimization of methane and low molecular weight hydrocarbon yields, and better
catalyst stability). This can be achieved in several ways: (a ) through development of new
e of novel reactor configurations; (c) use of suitable catalyst
cedures or through combinationof these hods, sdemonstrated -
’in s tudies a t Texas A M University ( T A W sponsored by DOE (Contracts DE-AC22-
85PC8011 and DE-AC22-89PC89868). Some of the iron based catalysts synthesized and
tested at TA MU, have proven to be more active than any other known iron F-T catalysts
imizing production of high molecular weight hydrocarbons (Bukur et a1.
The overall objectives of this contract are to: (1) demonstrate repeatability of
performance and preparation procedure of two high activity, high alpha iron Fischer-Tropsch
catalysts synthesized at TAMU uring the DOE Contract DE-AC22-89x89868; and (2) seek
potential improvements in the catalyst performance through variations in process cond itions,
pretreatment procedures andor modifications in preparation steps (e.g. means of introduction
of promoters and calcination conditions). In order to achieve these objectives the work isdivided into a number of tasks,which are described below together with the time schedule fo r
their execution.J ’
11-2
7/28/2019 808495(1).pdf
http://slidepdf.com/reader/full/8084951pdf 27/240
Task 1. Pro-iectWork Plan (April 1-April 30 ,1994)
The objectives of this task are: (1) Prepare in detail all activities which shall be
performed for the successful completion of the work for the entire duration of the contract; and
(2) Provide a project work chart showing the key personneVgroups planned for each task, and
the percentage of their time to be devoted to individual tasks.
. .Task 2. Enpineering. Mod fication and Training of New Personnel (April 1-September 30,
1994)
The objective of this task is to perform the engineering design, procurement of new
equipm ent, installation of the instrum ents and au
boratory reactors.
Task 3 . Testinp of Pre viouslv Svnthes zed Cata ysts (October 1,1994 - March 31,1995)I
The purpose of this task is to verify reproducibility of results obtained previously at
T A M with catalysts designated B (100 Fe/5 Cd6 W24 Si%) and C (100 Fe/3 Cu/4 W16
Si02). The catalysts from the same preparation batch shall be used, and the same pretreatment
and process cond itions shall be employed as in the previous slurry reactor tests of these two
catalysts.
. . .Task 4. Reoroducibilitv of w v s t PRD- ' (October I , 1994 - September 30,1995 )
The objective of this task is to demonstrate reproducibility of catalyst preparation
,procedure on a laboratory scale. Catalysts B and C will be synthesized following procedures
developed at T A W . Catalysts with satisfactory physicochemical properties will be initially
tested in a fixed bed reactor for screening purposes (5 day tests). Following this the tw o
catalysts will be tested in a stirred tank s h y eactor (STSR) using standard pretreatment and
process conditions. The activ ity, selectiv ity, deactivation behavior of these new c a u lyst
batches will be compared to that of the catalysts from the original (existing) batches. J
11-3
7/28/2019 808495(1).pdf
http://slidepdf.com/reader/full/8084951pdf 28/240
Task 5. The Effect of Source of Potassium and Basic Oxide Promoter (October 1, 1994 -
December 3 1,1 995)
The objective of this task is to determine effects of two different sources of potassium
and addition of another promoter on the catalyst performance. Catalysts B and C will be
synthesized using potassium silicate solution as the source of potassium promoter, and
performance of these catalysts will be compared with that of catalysts synthesized using our
standard procedure using potassium bicarbonate as the source of potassium promoter).
promotion on performance of catalysts B
promotion per catalyst) shall be investigated. Synthesized catalysts will be tested first in a
e satisfactory results
TSR.
* - - _
Task 6. Pretreatment W ec t Resea rch (October 1 ,19 95 - November 30,19% )
The effect of four different pretreatment procedures, in addition to the baseline
procedure,on the performance of catalyst B (or C) will be studied in a STSR. In addition to
STSR tests, the pretreatm ent effects will be studied by therrnogravimetric analysis (TGA) , and
' temperature programmed reduction (TPR). Iron phases in the catalyst will be determined by
X-ray powder diffraction (XRPD).
Ta sk 7. Calc nation Effect Research (October 1,1995- July 3 1.19%)
The effect of calcination temperature (300-50O0C)n the catalyst physical properties
and performance durin g F-T synthesis shall be studied in a fixed bed reactor and a STSR. In
addition to the baseline calcination temperature of 30O0C, the calcination temperatures of 400
and 500°C will be employed in a fixed bed reactor with flowing air. Also, the effect of rapid
heating (flash calcination) on performance of catalysts B and C shall be investigatedJ'
11-4

7/28/2019 808495(1).pdf
http://slidepdf.com/reader/full/8084951pdf 29/240
(December 1,1994 - July 3 1,1997)ask 8. Catalvst Charactenzahon.
The goal of this'task is to: (a) provide basic characterization of all catalyst prepared
(atomic absorption analysis, su rface area, X-ray diffraction);(b )
determinebulk
iron phasesafter the pretreatment and during Fischer-Tropsch synthesis in slurry reactors by XRD and
Mossbauer spectroscopy (at University of Kentucky); and (c) study reduction behavior of iron
F-T catalysts by isothermal and temperature programmed reduction (TPR). These s tudies may
lead to activity-structure relationships, and better understanding of the factors which influence
catalyst activity, selectivity and longevity.
Task 9. Testing of AlternativeCatalYsts for Slurry Reacton (January 1 - June 30,1997)
Although catalysts B and C have desirable activity and selectivity cham
may not have a sufficient mechanical strength and attrition resistance properties required for
utilization in commercial bubble column slurry reactors. We propose to evaluate the
performance of up to three alternative catalysts containing either silica and/or alumina as a
binderlsupport in the STSR tests. Mechanical strength and attrition resistance of these catalysts
wiil be determined in collaboration with other DOE contractors.
. . . . .Task 10. C aractenzabon of Product Distnbutlon and Data Analvsis (June 1 - August 31,
1997)
The objective of this task is to perform detailed gas chromatographic analysis of
selected liquid and wax products collected during the STSR tests (Tasks 3-7 and 9), and
provide information on the effects of time on stream (catalyst aging), process conditions,
pretreatment conditions andor catalyst promoters on product distribution.
A brief description of activities conducted under Task 2. Engineering, Modification and
Training of New Personnel is provided in the section 11-3, whereas results from Tasks 3 - 10
are described in Chapters 111-X of this report.,,\
11-5
7/28/2019 808495(1).pdf
http://slidepdf.com/reader/full/8084951pdf 30/240
11-3 Engineering Modification and Training of New Personnel
During the course of work on this task we have obtained quotes for major equipment
and prepared bid specifications fo r the fo llowing items: Thermal, Gravimetric/ DifferentialThermal Analyzer (TGAAYI'A Apparatus); Temperature Programmed Pulse Chemisorption
Unit equipped with thermal conductivity detector for temperature-programmed reduction
studies, Carbon Monoxide/ Flammable Gas DetectorM onitor System; Gas cylinder cabinet for
storage of toxic and flammable gases and Macintosh computer (Mac Quadra 660 AV 8 MB
RAM, 230 MB hard disk) and a Laser printer (Hewlett Packard, 4 ML).
After reviewing the bids the following equipment was purchased: Thermal Gravimetric4
r vGA/DTA Apparatus) - TA Instruments, Carbon Monoxide/
nitor - MSA, ulse ch programmed
reductioddesorption (TPRII'PD) apparatus (Micromentics Inc.; TPWTPD Pulse Chemisorb
2705). All instruments were insthed and calibrated with appropriate standards. A gas
cylinder cabinet (with CO and H2 cylinders, or syngas mixture) was connected to a fume hood
vent in our Catalyst Characterization Laboratory (Room 35B of Zachry Engineering Center).
' -
During the first six months of the contract tests of the existing gas chromatographs for
gas, liquid and hydrocarbon wax product analysis, were completed using the calibration
standards. A Carle gas chromatograph, used for analysis of gaseous hydrocarbons, synthesis
gas and carbon dioxide, was moved to a laboratory in which our reactors are located (Room
326B). Also, tubing and valves connecting the GC and the two slurry reactors were installed,
which will enable us to use it as an on-line gas chromatographic system. Tw o slun y reactor
systems were pressure tested, and mass flow meters were calibrated for future tests. Dr.
Xiaosu Lang trained new personnel in the usage of existing computer software for data
reduction and ana lysis , gas chrom atographs and fixed bed and slurry reactor systems.
'7
11-6
7/28/2019 808495(1).pdf
http://slidepdf.com/reader/full/8084951pdf 31/240
11-4 References
Bukur, D. 9..Nowicki, L. and Lang, X., "Fischer-Tropsch Synthesis in a Stirred ~ a n k
Slurry Reactor", Chern. Eng. Sci.. 49,4615425 (1994).
Dry, M. E., 1981, 'The Fischer-Tropsch synthesis" in Caalysi~ Science and Technology;
Volume 1, pp. 160-255. Springer - Verlag, New York.
Jager, B . and Espinoza, R. ,Catalysis Today, 23, 17-28 (1995).
Kolbel, H. and Ralek, M., 198 0, 'The Fischer-Tropsch synthesis in the liquid phase" Cdd.
Rev . - Sci. Eng. 21, 225-274.
7/28/2019 808495(1).pdf
http://slidepdf.com/reader/full/8084951pdf 32/240
RESULTS AND DISCUSSION
I11 Testing of Previously Synthesized Catalysts
The objective of t h i s task is to verify repeatability of results obtained in stirred tank
slurry reactor (STSR) tests of two catalysts designated B (100 Fe/5 Cu/6 W24 Si02
containing 55.4 wt% of iron) and C (100 Fe/3 Cu/4 W1 6 S i0 2 containing 59.7 wt% of iron)
during the previous DOE Con tract DE-AC22-89PC89868. The se two catalysts were chosen
due to good performance (high syngas conversion and low methane and gaseous
hydrocarbons selectivities). n slurry reactor tests. The catalysts from the sam e preparation
batch and the same pretreatmen t and process conditions, were employed as in the previous
slurry reactor tests of these two catalysts.
III-1 Catalyst CharacterizationStudies
Catalysts B an d C (both from the first preparation batch) synthesized in our
labora tory, and commercial precipitated iron catalyst (LP 33181) synthesized by Ruhrchemie
AG (Oberhausen-Holten,Germany) w ere characterized after calcination in air a t 300°C for 5
h by elemental chemical alysis, BET surface area (SA), total pore volume (PV) and pore
size distribution (PSD).Ruhrchemie catalyst was used initially in fixed bed reactors at Sasolin South Africa, and it resents an useful reference catalyst.
Bulk iron phases in catalysts B and C after the Fischer-Tropsch syn thesis in a slurry
reactor, were determined by X-ray d iffraction (XRD) analysis a n d o r by M ossbauer effect
spectroscopy (MES). Th e MiSssbauer spectra were ob tained and analyzed at the University
of K entucky (The Consortium for Fossil Fuel Liquefaction Science). A description of the
catalyst synth esis procedure is given in Appendix 1, whereas the catalyst characterization
equipment and experimental procedures employed are described in Appendix 2.
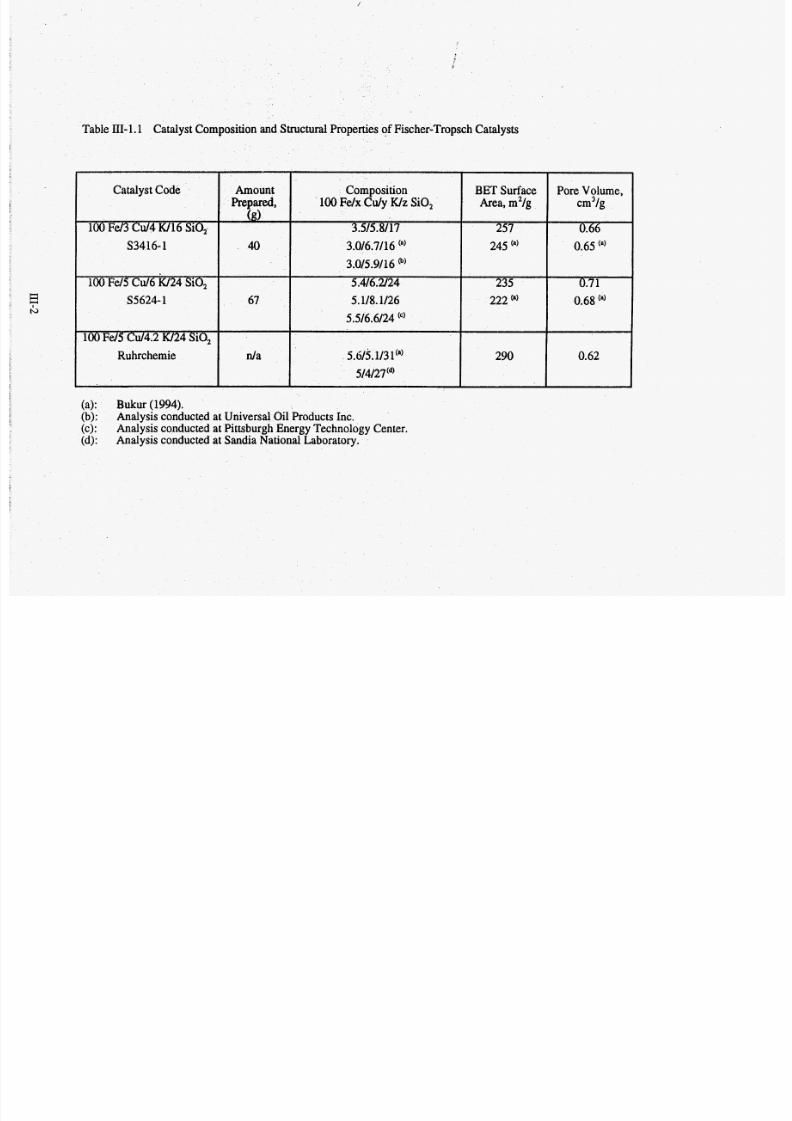
Catalyst Composition and Phvsical Charactenzatlon.
The catalyst composition and textural properties of catalysts calcined at 300°C re
summarized in Tab le 111-1.1. Th e catalyst compositions were calculated based on the
111-1
7/28/2019 808495(1).pdf
http://slidepdf.com/reader/full/8084951pdf 33/240
Table ITI-1.1 Catalyst Composition and Structural Propertiesof Fischer-Tropsch Catalysts
Catalyst Code
100 Fd3 Cul4 W1 6 Si0,-
S3416-1
100Fe/5 C d 6 k 2 4 SiO,
S5624-1
100Fd5 Cd4.2 W24 SiO,
Ruhrchemie
AmountPrepared,
0
40
67
n/a
Composition100Fd x C d y Wz iO,
3.5/5.8/17
3.0/6.7/ 16 (a)
3.0/5.9/16 @)
5.4/6.2/24
5.1/8.1/26
5.5/6.6/24
5.6/5.1/31(a)
5/4/27 (d)
(a): Bukur (1994).(b):(c):(d):
Analysis conducted at Universal Oil Produ cts Inc.Analysis conducted at Pittsburgh Energy Technology C enter.Analysis conducted at Sand ia National Laboratory.
BET SurfaceArea, m2/g
257
245 (a)
235
222 (a)
290
Pore Volume,cm3/g
0.66
0.65 (a)
0. 7 1
0.68
0.62
7/28/2019 808495(1).pdf
http://slidepdf.com/reader/full/8084951pdf 34/240
elemental analysis by atomic absorption spectroscopy (AAS). The results of elemental
analysis of all three catalysts show that numerical values for iron, copper and silica are fairly
cons istent with the corresponding nominal (intended) values, whereas the potassium contents
are slightly higher than the nominal values. The BET surface areas were between 222 and
290 m2/g, whereas the pore volume varied from 0.62 cm3 /g (Ruhrchemie LP 33/8 1) to 0.7 1
cm3/g (catalyst B). Multiple measurements of the same property with the same catalyst
indicate good reproducibility of results. Ruhrchem ie cata lyst has similar composition as our
catalyst B, and its surface area is abou t 20% higher than that of the catalyst B.
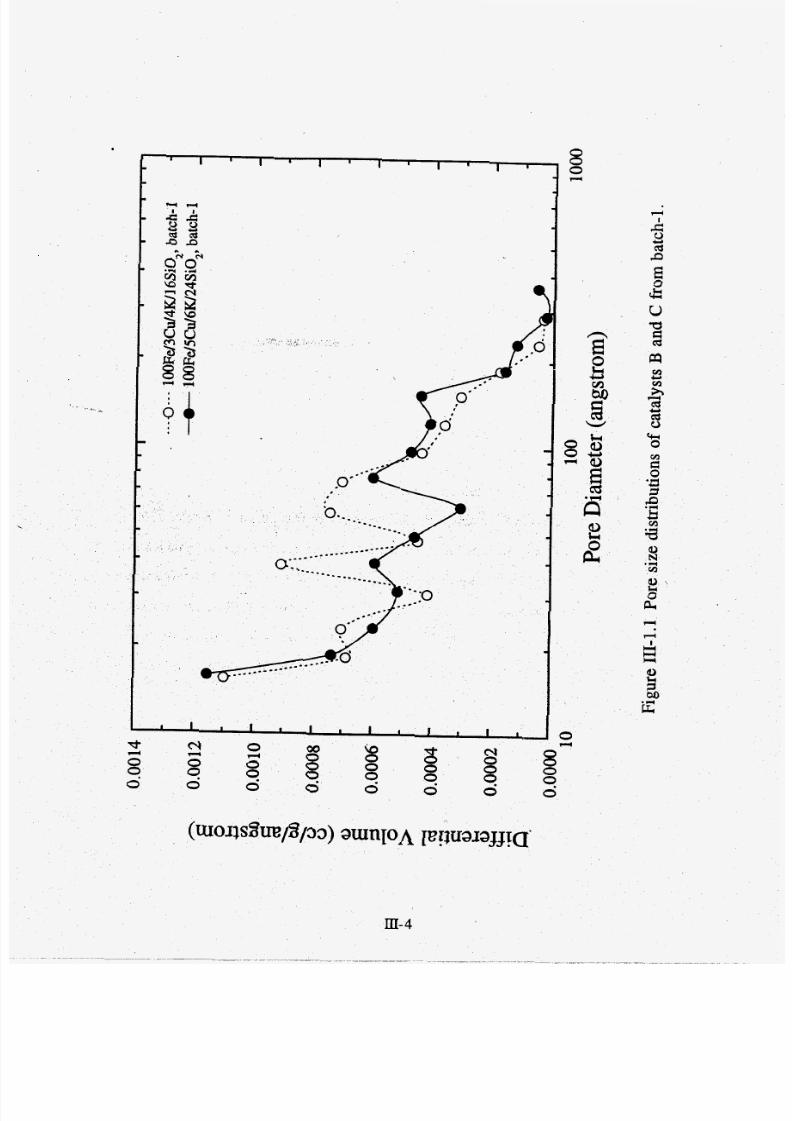
Figure III- .1 show s the differential pore volumes of ca talysts B and C as a function
of pore diameter. The data show that the pore volume contribution from larger pores (>lo
nm) is very small.
Iron phases in calcined and used catalvsts €3 and 6
XRD patterns of calcined catalysts B and C did not exhibit crystallinity, i. e. they are
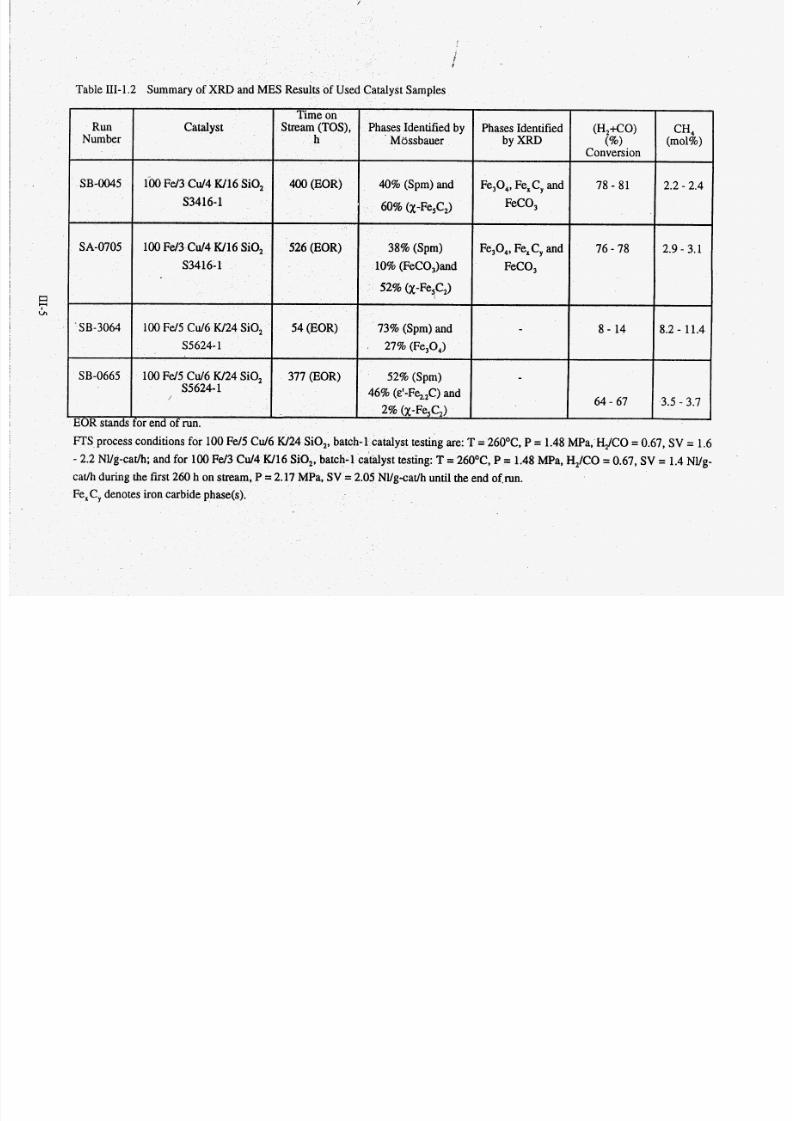
ous o r the crystallites are too sm all (less than 5 nm) to be detected by XRD.
s present in cata lysts samples withdrawn from the slu reactor at the end of
several tests a re summarized in Table ID[-1.2. Mossbauer spectroscopy analysis indicates the
presence of a significant fraction (38-73%) of iron phase(s) exhibiting superparamagnetic
behavior at a room temperature. R h d i g et al. (1966) have found that the critical diameter of
iron oxide particles for superparamagnetic relaxation at room temperature is about 13.5 nm.
In runs S B - y 5 and SA-0075 agnetite (Fe,O,) was identified by XRD nalysis , but not by
MES analysis. It is likely that at least a portion of superparamagnetic phase is magnetite.
Fe,C, designates either a single iron carbide phase (e'- or x - carbide) or a mixture of these
two carbides. The precise identification of these two types of carbides by XRD analysis is
difficult when the s ignal intensities are low, and other compounds with overlapping peaks are
present, such as magnetite and wax. In this report X-carbide (Fe,C,) refers to the so-called
III-3
7/28/2019 808495(1).pdf
http://slidepdf.com/reader/full/8084951pdf 35/240
II I I I
I II I
I I
I I I I m I m II I I I I
d.+
80
e400
+
0
0
0
0
+
9 3"0
80
0
80
09
E!0
09
m-4
80H
0
0-90
cncnhcece0
-rcc0
7/28/2019 808495(1).pdf
http://slidepdf.com/reader/full/8084951pdf 36/240
Ru nNumber
SB-0045
SA-0705
' SB-3064
SB-0665
EOR stands
CH4(mol%)
Time onCataly st Stream (TOS ), Phases Identified by Phases Identified (H,+CO)
h Mossbauer by XRD (94Conversion
i00F d3 C d4 W16 S iO , 400 (EOR) 40% (Spm) and Fe,0 4, FexC , and 78 - 81
S3416-1 60% (x-Fe,C,) FeCO,
100 Fd 3 C d 4 W16 SiO, 526 (EOR) 38% (Spm) Fe,0 4, FexC , and 76 - 78
S3416-1 10% FeC0,)and FeCO,
52% (x-Fe,C,)i
100 Fd 5 C d 6 W 24 SiO, 54 (EOR) 73% (Spm ) and - 8 - 14
S5624-1 . 27% (Fe30 4)
100Fd 5 C d 6 W24 SiO, 377 (EOR) 52% (Spm) -46% (E'-F%,C) and5624-1
64 - 67~~ 2% (x-Fe,C,)
for end of run.
2.2 - 2.4
2.9 - 3.1
8.2 - 11.4
.3.5 3.7
FTS process conditions for 100 Fe/5 C d 6 W24 SiO,, batch-
- 2.2 NVg-cat/h; and for 100Fd3 C d 4 W16 SO ,, batch-1 c
cadh during the first 260 h on stre
Fe, Cydenotes iron carbide phase
talyst testing are: T = 26OoC,P = 1.48 MPa, HJCO = 0.67, SV = 1.6
st testing: T= 26OoC,P = 1.48 MPa, H,/CO = 0.67, SV = 1.4 NYg-
P = 2.17 MPa, SV = 2.05 NVg-cadh until the end of,run.

7/28/2019 808495(1).pdf
http://slidepdf.com/reader/full/8084951pdf 37/240
Hagg carbide and its XRD pattern reported by Hoffer et al. (1949). &'-ca rbide Fe&) has a
, pseudo-hexag onal structure and its XRD pattern was first reported by Barton and Gale
(1964). The identification of iron phases by Mossbauer spectroscopy was made by utilizingpublished values of the hy per fiie parameters (the isomer shift, th e quadruple splitting, and
the magnetic hyperfine field) of the Mossbauer spectra.
The following observations are made from results shown in Table III-1.2:
( 1 ) Syngas conversion was low (8-14%) in run SB-3064; magnetite and
superparam agne tic phase (probably iron oxide) were identified at the end of the test. A
possible reason fo r low activity in this test is the presence of im purities (catalyst poisons) in
the initial slurry medium. These im purities may have prevented the formation of active iron
. phases during the reduction and F-T eaction. In all other tests the cata lyst was active and the
iron carbide phases were iden tified by Mossbauer and XRD analysis.
(2) Catalyst B (24 parts of SiO, per 100 parts of Fe) contained &'-carbide (SB-0665),
catalyst C (16 parts of S per 100 parts of Fe)
amples at the end of the tests. It is not clear
oxide loadings, or due to the use of different
nt tests. Namely, in runs SB-0045 nd SA-0705 with catalyst C,
-48 MPa and 2.17 MPa, whereas in run SB-0665, the catalyst
process conditio
the catalyst was
B was tested at 1.48 MPa,
(3 ) Methane selectivities were lower in tests where X-carbide was the dominant iron
phase (catalyst C), in comp arison to the test SB-0665 with catalyst B were &'-carbide was
present. J
7/28/2019 808495(1).pdf
http://slidepdf.com/reader/full/8084951pdf 38/240
ItI-2 Reaction Studieswith Catalysts B and C
Octacosane (n-Cz8 paraffin) was used as a start-up slurry medium in the first three
tests with catalyst B (runs SB-2764, SB-3064 and SA-0025), bu t all of them were
unsuccessfu l (low catalyst activity). In the origina l test of catalyst B (SB-193 1) purified n-
octacosane was used as the start-up fluid, and high synthesis gas conversion was obtained.
Before loading to the reactor, the n-octacosane (99 % purity, The Humphrey
Chemical Company, North Haven, CT)was extracted with tetrahydrofuran (THF) to remove
bromotetradecane, since bromine is known o be the catalyst poison. Sam ples of fresh n-
octacosane (before purification with THF), nd from the slurry reactor (after the purification)
were sent for trace bromine analysis to two different Laboratories. According to analysis
done at Galbraith Laboratories, Inc. (Knoxville, TN) the as received n-octacosane had 530
ppm bromine, and the purified one less than 10 ppm bromine. The VHG Labs Inc.
(Manchester,NH), using TOX (total organic halogen) method , detected even higher level of
.7 wt-% total halogen (as bromine) in the fresh n-octacosane, and
--
purified sample. Both results show that the am
r, i t can not Se ruled
effec t on the catalyst activity. Th e trace
of sulfur was also detected by Galbraith Laboratories in used octacosane samples. Therefore,
of impurities in n-octacosane had resulted in catalys t poisoning
cessful tests with the catalyst B. After these three unsuccessful tests, we
dium, and we began using the
ated I-decene homopolymer liquid - C30, btained from Ethyl
Co.). EthylfIo 164oiliwas used in all subsequent slurry reactor tests throughout this contract.
III-2.1
tacosane as the st
Stirred Tank Slurry ReactorTestsof Catalyst B (100 Fd5 C d 6 W24 iO,)
Tw o successful tests of catalyst B designated SB-3354 and SB-0665 were performed
in a slurry reactor B. The catalyst was reduced with H2 at 250"C, 0.8 MPa (100 psig), 4000
m-7
7/28/2019 808495(1).pdf
http://slidepdf.com/reader/full/8084951pdf 39/240
cm3/min for 4 h. The sam e reduction conditions were employed in the original test of this
catalyst (SB-1931). n all three tests the process conditions were: 260°C, 1.48 MPa, gas
space velocity (SV) of 1.2-2.2NUg-cat/g using synthesis gas with molar feed ratio H2KO =
0.67-0.69. n each test,7-10 of atalyst with particle size less than 53 pm (270mesh) was
suspended in the start-up liquid to form a 2.4-3.6wt% slurry.
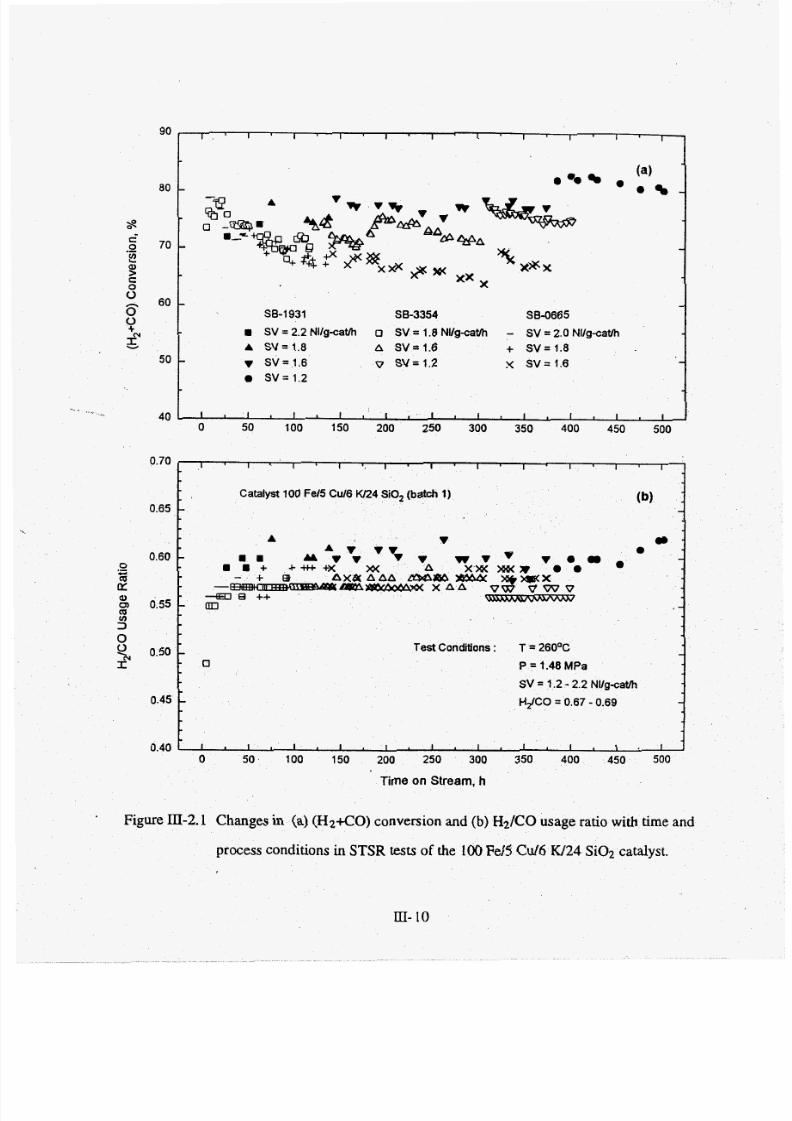
Cha nges in synthesis gas, (Hz+CO), conversion and (Hz/CO) usage ratio with time-
on-smam (TOS) are shown in Figure III-2.1. In the original run SB- 93 (with n-octacosane
as the start-up liquid), ( H 2K O ) conversion was stablewith time (Figure IIt-2.la). However,
in the two recent runs SB-3354 nd SB-0665 with Ethylflo 164 oil as the initial slurry
medium) the catalyst deactivated during the fust 150h of esting. Initial conversions in all
three ests were similar (H2+CO conversion was between 72 and 78%), but the initial space
velocities w ere different in these tests (2.2W g-cat/h in run SB-1931, .0 NYg-cat/h in run
1.8 NYg-cat/h in run SB-3354). Compariso
ocity (at 1.8 and 1.6 Nl/g-cat/h) re
SB-1931 the highest conversions) and the
conversions).
conversion value
tre in run SB-0665 (the lowest
Comparison of catalyst activity in termsof syngas conversion is not meaningful when
an apparent reaction rate constant
tivity. In this study the apparent
reaction rate constant was calculated assuming that the rate of (H 2KO) disappearance has a
first-order dependence on hydrogen partial pressure :
s are not the same. In
for comparison of
lOoo.SV*XHZ+ , ,k = (mmol (H2x0)onvertedg-Fe/NMPa)
22.4 * PHzwFC
m-
7/28/2019 808495(1).pdf
http://slidepdf.com/reader/full/8084951pdf 40/240
where: SV = gas space velocity (NVg-cadh); X H 2 + , is syngas conversion; PH,= partial
pressure of hydrogen (MPa); wp c= mass raction of iron in the catalyst (-).
The apparent rate constant as a function of time-on-stream for three runs with catalyst
B is shown in Figure III-2.2. As can be seen from this figure, initial activities in all three
tests were about the same, k = 340-350 mmoVg-Fe/h/MPa. In run SB-1931, the apparent rate
constant gradually decreased from 350 to 300 mmoVg-Fe/h/MPa over a 400 hour period.
However, in run SB-3354, the rate constant decreased from 340 to 250 mmoVg-Fe/h/MPa
during the f i s t 150 h of testing. It was stable at this value during the next 150 hours of
testing at SV = 1.6 W g- ca th ; and then decreased further to 200 mmoVg-Fe/h/MPa during
testing at SV = 1.2 NVg-cat/h. In run SB-0665, the initialvalue of the apparent rate constant
was 350 mmoYg-Fe#MPa at 20 h, but the rate constant decreased from 350 to 250 mmoYg-
I ' n F M P a n 120 hours, and than stabilized at 22 0 mmoYg-Fem/MPa between 180 and 370 h
of testing.
Water gas shift (WGS)activity of the c
partial pressure quotient Kp = P ~ * P z n / p c o *
(H2/Co) sage ratio (m),
nt CO conversion to carbon
higher values of K p or CO;?2 selectivity).
selectivity imply higher WG
fairly stable at 0.56-0.58 (se
SB-1931 was usually above 0.60, and increased to 0.62 at about 500 h on stream, i. e. the
catalyst'sWGS ctivity was low er than n runs SB-3354 and SB-0665.
H y d r o c a r b w w t y - J . . .
test. The w age ratio in
. .
Methane and C 1+ C2 hydrocarbons (methane + ethane + ethylene) selectivities are
shown in Figure III-2.3. Low selectivities of methane and C +C2 hydrocarbons obtained in
run SB-1931 were also observed in runs SB-3354 and SB-0665. For example, selectivities to
methane and C1 + CZ hydrocarbons during run SB-3354, were similar to those obtained in
run SB-1931(2.5-3 mol% and 5-6 mol%, respectively); whereas the corresponding values in
7/28/2019 808495(1).pdf
http://slidepdf.com/reader/full/8084951pdf 41/240
90
80
s$ 70!
' 0 -
0
+
z
.-Q)>c
8
50
1 ~ 1 ' 1 ' ~ ~ ~ * ~ ~I
% 4, (a)
- -3 A
-
-SB-0665
8 SV = 2.2 Nllgca th 0 SV = 1.8 Nllgca th - SV = 2.0 Nllgca th
A SV = 1.8 A S V = 1.6 + S V = 1.8
v S V= 1.6 v SV = 1.2 x S V = 1.60 S V = 1.2
SB-1931 38-3354
- -
~ 4.
0.65
process conditions in STSR tests of the 100 Fe/5 Cu/6 W24 Si02 catalyst.
l ' l * l ' l . I . I . I a I
(b)atalyst 100 Fe/5 Cul6 w24 SiO, (batch 1)
- -
m- 0
0.60.-C
2
3
I"
Q)
Qcn 0.55
0
0, 0.50
0.45
0.40
'I m -A 'I V'I. w ' I v ' I o - . 0
- 8 . a 'I'I'IA x x = w 0 -. . + ++t++x >o<
A X B ( A A A LtSQBb w414( q w x+ Bf--am X A A V W V W V
*e ++ -an -
Test Conditions : T = 26OOC1 -P = 1.48 MPa0
SV = 1.2 - 2.2 Nllgca th
- HdCO = 0.67 - 0.69 -
l , l , l . l , l n l , I , I 1 . 1 . 1 ,

7/28/2019 808495(1).pdf
http://slidepdf.com/reader/full/8084951pdf 42/240
I I
00v)
0v)d
0
0d
0v)(3
00(3
0mN
00N
0
v)r
0
$!
0m
0
00r
C
v)>mCI
2 ’
mCDCD
cn
4m
a a 0
cL
I
I :

7/28/2019 808495(1).pdf
http://slidepdf.com/reader/full/8084951pdf 43/240
Z.1 = A S
9'1 = A S X Z'L = A S V 9'1 = A S A
8'C = A S + 9'C = A S A 8'1 = A S V
W d / l N 0'2= AS - We36/IN 8'1 = AS We*E/IN Z'Z = AS 0
s990-as - - SEC-as - - - lE6C-BS-i - 1

7/28/2019 808495(1).pdf
http://slidepdf.com/reader/full/8084951pdf 44/240
run SB-0665 were slightly higher (e. g. 2.5-3.6 mol% and 5-7 mol%, respectively). Gaseous
hydrocarbon selectivities (C2 C4) (Table m-2.1) varied between 10 and 12.5 wt% in runs
SB-1931 and SB-3354, but w ere higher in run SB-0665 (12-15 wt%).
In run SB-1931, hydrocarbon product distribution shifted gradually toward lower
molecu lar weight products with time (see Table III-2.1). For exam ple, methane selectivity
increased from 2.5 wt% (4 2 h) to 3.7 wt% (496 h), while C2 - C4 selectivity increased from
11 to 14.6 wt% (between 98 and 208 hours on stream), whereas C 19+ selectivity decreased
from 58 to 49 wt% (also between 98 and 20 8 h). In runs SB-3354 and SB-0665,
hydrocarbon produc t distribution during the first 100 h on stream.was very similar to that
obtained in run SB-1931 (Table KII-2.1), but after about 100 h on stream the product
distribution in these two tests did not change significantly with time. Some differences in
hydrocarbon product distributions were obse rved in these three
range hydrocarbons (Cs C11) selectivity in run SB-1931
whereas in run SB-0665 it varied between 16.3 and
- . -
16.9 and 19.2 wt
1
tained in tests wi , re shown in Figure
le frac tion vs. carbonII-2.4 in the form of
number). Data for individual mass balances at SV = 1.
chosen €or comparison (The effect of time-on-stream and proces
number distribution gligible in all three tests). Positive deviations from ASF
distribution are noted threetests in Clo - C22 carbon number range. We are not certain
whether this is due to the intrinsic catalytic selectivity, or due to experimental errors (e.g. loss
of products an d o r errors in analysis). The sam e behavior was obtained in several other mass
balances in each of these three tests. Experimental data in Figure m-2.4 were fitted with a
three parameter model of Huff and Satterfield (1984):
Schulz - Flov (ASF) plots
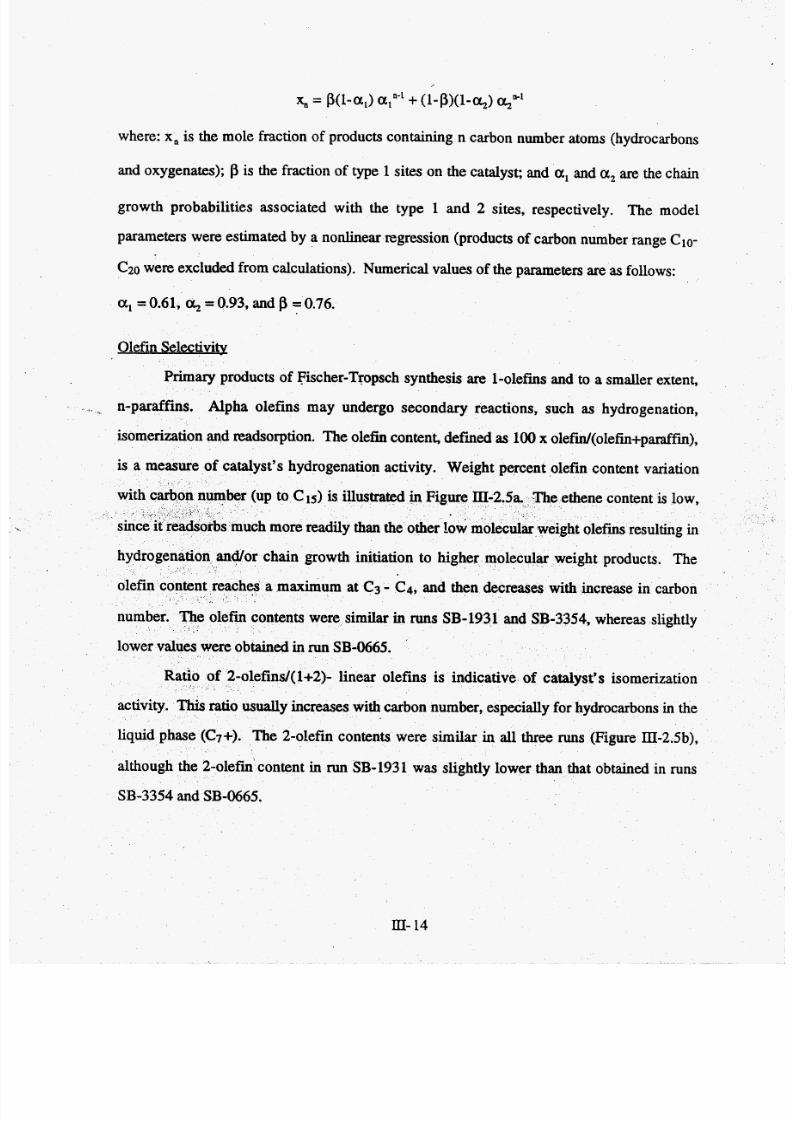
7/28/2019 808495(1).pdf
http://slidepdf.com/reader/full/8084951pdf 45/240
where: xu is the mole fraction of products containing n carbon number atoms (hydrocarbons
and oxygenates); p is the fraction of type 1 sites on the catalyst; and a, and a, re the chain
growth probabilities associated with the type 1 and 2 sites, respectively. The model
parameters were estimated by a nonlinear regression (products of carbon number range Clo-
C20were excluded from calculations). Numerical values of the parameters are as follows:
a, 0.61, a2=0.93, and p =0.76.
Olefin Selectivity
Primary products of Fischer-Tropsch synthesis are 1-olefms and to a smaller extent,
, . n-paraffins. Alpha olefins may undergo seco ndary reactions, such as hydrogenation,
isomerization and readsorption. The olefin content, d e f i e d as 100x olefin/(olefin+paraffin),
is a measure of cataly st's hydrogenation activity. Weight percent olefin content variation
ethene content is low,
ht ole fins resulting in
weight products. The
maximum at C3 C4, and then decreases with increase in carbon
ntents were similar in runs SB-1931 and SB -3354, whereas slightly
p to C15) is illustrated
ch m ore readily than the
n growth initiation to higher mole
in SB-0665.
f 2-olefins/( 1+2)- linear olefins is indicative of catalyst's isomerization
activity. "his ratio usually increases with carbon number, especially for hydrocarbons in the
7+). The 2-olefin contents were similar in all three runs (Figure m-2.5b),olefm'content in run SB-1931 was slightly lower than that obtained in runs
SB-3354 and SB-0665.
III- 14
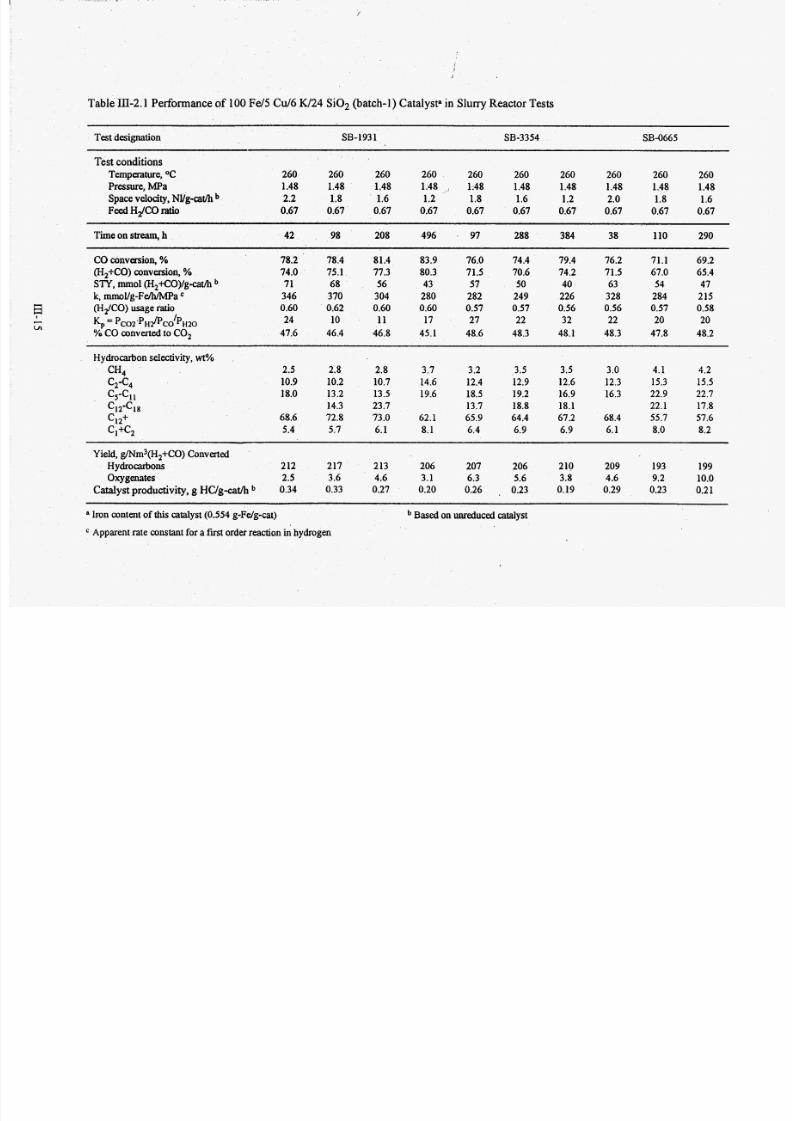
7/28/2019 808495(1).pdf
http://slidepdf.com/reader/full/8084951pdf 46/240
..... ./
Table Ill-2.1 Performance of 100Fe/5 C d 6 W24 S i0 2 (batch-1) Catalyst" in Slun y Reactor Tests
SB-0665est designation SB-1931 SB-3354
Test conditionsTempexature, OC 260 260 260 260 260 260 260 260 260 260
Pressure, MPa 1.48 1.48 1.48 1.48 , 1148 1.48 1.48 1.48 1.48 1.48
Space velocity, NVg-oth 2.2 1.8 1.6 1.2 1.8 1.6 1.2 2.0 1.8 1.6
FeedHdCO ratio 0.67 0.67 0.67 0.67 0.67 0.67 0.67 0.67 0.67 0.67
Time on stream, h
~~ ~~
42 98 208 496 . 97 288 384 38 110 290
CO conversion, % 78.2 78.4 81.4 83.9 76.0 74.4 79.4 76.2 71.1 69.2
(H2+C0) conversion, % 74.0 75.1 77.3 80.3 71.5 70.6 74.2 71.5 67.0 65.4
k,mmoUg-Fem/MPa 346 370 304 280 282 249 226 328 284 215
(HdCO)usage ratio 0.60 0.62 0.60 0.60 0.57 0.57 0.56 0.56 0.57 0.58
% CO converted toCO, 47.6 46.4 46.8 45.1 48.6 48.3 48.1 48.3 47.8 48.2
STY, m o l H,+CO)/g-caa/h 71 68 56 43 57 50 40 63 54 47
'$ = pc,,~~Hz/pco'p"zo 24 10 11 17 27 22 32 22 20 20
H y d ro d o n selectivity,wt%
2.5 2.8 2.8 3.7 3.2 3.5 3.5 3.0 4.1 4.2
10.9 10.2 10.7 14.6 12.4 12.9 12.6 12.3 15.3 15.5c2-c4cs-cll 18.0 13.2 13.5 19.6 18.5 19.2 16.9 16.3 22.9 22.7
12-18 14.3 23.7 13.7 18.8 18.1 22.1 17.8
c12+ 68.6 72.8 73.O 62.1 65.9 64.4 67.2 68.4 55.7 57.6
C&2 5.4 5.7 6.1 8.1 6.4 6.9 6.9 6.1 8.0 8.2
CH4
Yield, gMm3(H2+CO)Converted
Hydrocarbons 2 12 217 213 206 207 206 210 209 193 199
Oxygenates 2.5 3.6 4.6 3.1 6.3 5.6 3.8 4.6 9.2 10.0
Catalystproductivity, g HC/g-cat/h 0.34 0.33 0.27 0.20 0.26 , 0.23 0.19 0.29 0.23 0.2 1
~
a Iron contentof this catalyst (0.554 g-Fdg-cat) Based on unreduced catalyst
Apparent rate constant for a fmt order reactionin hydrogen

7/28/2019 808495(1).pdf
http://slidepdf.com/reader/full/8084951pdf 47/240
El- 6
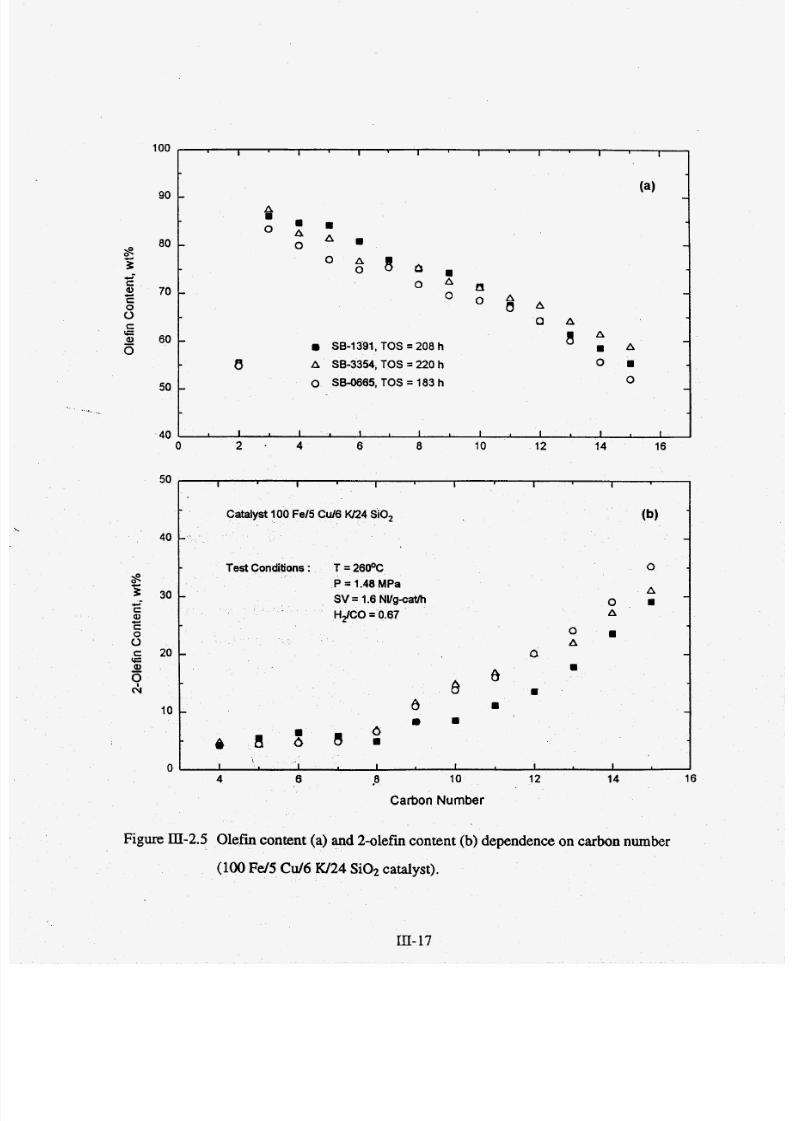
7/28/2019 808495(1).pdf
http://slidepdf.com/reader/full/8084951pdf 48/240
c-CQ)
Cc
s
100
90
80
70
60
50
40
.I I I 1 I I I I
(4- -
m mf t
A mO A
- 0 -
0 A 8 a mo A a
O O A- -
O A
O A
a~ -SB-1391, TO S = 208 h 8 A
-
8 A SB-3354, TO S = 220 hO m
0 SB-0665, TOS = 183 h 0- -
i I I I I I I I
50
40
30
20
10
0.
Figure ID-2.5 Olefii content (a) and %-olefin ontent (b) dependence on carbon number
(100 Fd5 C d 6 W24 i0 2 catalyst).
I I I I I I
Catalyst 100 Fel5 CUB wL4 SiO, (b)
- -
Test Conditions: T = 250% 0
A
SV = 1.6 NVg-caVh 0 8
P = 1.40 MP a-
HdCO = 0.67 A
0 .
a
A
- a -
88 a
8 m
a- -
~ a i SI
I I I I I I
III-17
7/28/2019 808495(1).pdf
http://slidepdf.com/reader/full/8084951pdf 49/240
III-2.2 StirredTank Slurry Reactor Tests of Catalyst C (100 Fd3Cd4W16 Si0,)-
Two new slurry phase tests were conducted with catalyst C from batch 1. These two
runs were carried o ut in two different reactor systems, run SA-07 05 was made in the slurry
reactor A and run SB-0045 in the slurry reactor B. Th e reduction conditions employed in
the original test of this catalyst (SB-0261) and in run SA-0705 were the same (H2 at 240'C,
0.8 MPa (100 psig), 7500 cc/min for 2 h). In the test SB-0045 he redu ction was carried out
at a higher temperature (25O"C, instead of 240'C), whereas the rem aining con ditions were the
same. In all three tests the catalyst was tested at: 260'C, 1.48 MTa, 1.4-2.0 NYg-ca th using
synthesis gas w ith molar feed ratio H;?/CO= 0.67-0.69. About 7-2 0 g of catalyst of particle
size less than 53 pm (270 mesh) was suspended in the start-up fluid to form a 2.3-7 wt%
slurry.
. . . .vst A cQ vU and S w
Changes in (Hz+CO) conversion and'H;?/CO usage ratio with time are shown in
Figure III-2.6. During the first 100 hours of testing a t the base line conditions: 260°C, 1.48
MPa, and 1.4 M/g-cat/h, the syngas conversions were similar n all three tests. After 100h,
the syngas conversion started to decline in run SB-0261, and reached 76% at 150 h on
stream. Between 160 and 240 h on stream the catalyst was tested at 263°C (results not
shown), and upon returning to the baseline conditions the co nversion was about 67%. After
that, the catalyst became stable and the conversion did not change with time. On the other
hand, in runsSB-0045 and SA-0705 the catalyst was quite stab le up to 250 h, and the syngas
conversion was abou t 81%. After that, in both tests, the reaction pressure and gas space
velocity were increased proportionally to 2.17 MPa and 2.05 NYg-cath, respectively, in
order to maintain the constant gas residence time. In both cases, the co nversion decreased
slightly to abo ut 79% , and in run SA-0705 the syngas conve rsion decreased from 79 to 75 %
m- 8
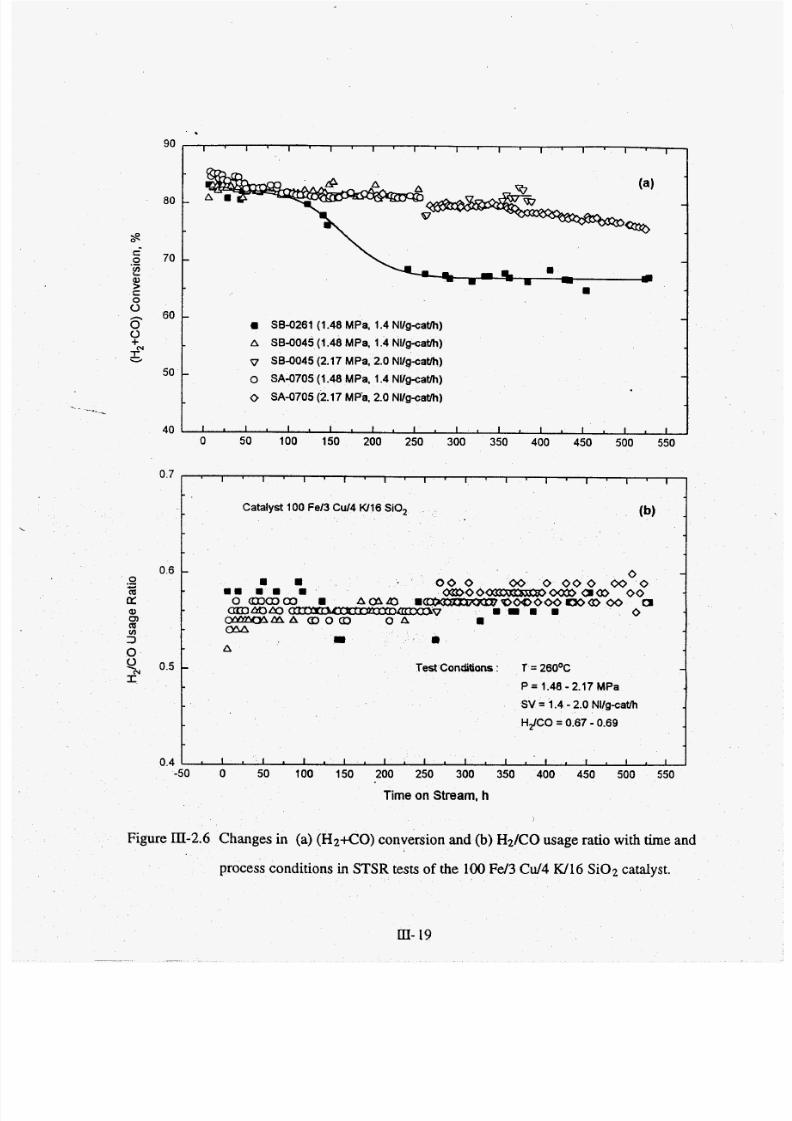
7/28/2019 808495(1).pdf
http://slidepdf.com/reader/full/8084951pdf 50/240
.-* .,.. .
80 -
s.- 70 -2 a>c
6 0 -8
+,3
0
50 -
SB-0261 (1.48 MPa, 1.4 Nllgcath)
A SB-0045 (1.48 M Pa, 1.4 Nl/gcat/h)
v S8-0045 (2.17 MPa, 2.0 Nllgcat h)
o SA-0705 (1.48 MPa. 1.4 Nllg-cath)
0 SA-0705 (2.17 MPa, 2.0 N llgcat h)
(b )atalyst 100 Fel3 Cul4 W16 SiO,
A
Test Conditions : T = 26OOC
P = 1.48 - 2.17 MPa
SV = 1.4 - 2.0 Nllg-cath
H$CO = 0.67 - 0.69
0.4-50 0 50 100 150 200 250 300 350 400 450 500 550
Time on Stream, h
Figure III-2.6 Changes in (a) (H2+CO) conversion and (b) H 2 K O usage ratio with time and
process conditions in STSR tests of the 100 F d 3 C d 4 W16 Si0 2 catalyst.
m- 9
7/28/2019 808495(1).pdf
http://slidepdf.com/reader/full/8084951pdf 51/240
during the next 260 h of testing at higher reaction pressure. Thz eactor space-time-yield
(STY) ncreased by about 40% during testing at 2.17 MPa and 2.05 NVg-cat/h (Table III-
2.2).
Good reproducibility of catalyst activity is also reflected in Figure III-2.7,n which
the apparent reaction rate constant in all three tests varied between 250-270 mmoYg-
Fe/h/MPa during the initial 100 h on stream. Con stant activity and low deactivation rate
were observed during the next 150 hours of testing in runs SB-0045 and SA-0705. In the
original test (SB-0261), the catalyst began to deactivate after about 100 h on stream.
However, it became stable again at about 250 hours (k = 170 mmoVg-Fe/h/MPa).
In the two recent tests (SB-0045 and SA-0705) of catalyst C, the reaction pressure
and space velocity were increased to 2.17 MPa and 2.05 NVg-cat/h, respectively, at about
250 hours. The apparent rate constant in run SB-0045 emained alm ost constant (about 255
rnmoYg-Fe/h/MPa), whereas in run SA-0705 it decreased from 256 to 240mmoVg-Fe/h/MPa
at 525 hours on stream.
Water gas shift activity in all three tests was high and very reproduc ible (Figure m-
2.6bj. The usage ratio was between 0.55 and 0.57 in all thre tests.
n Se l eaw t y & arbon Nmber D. . . .
Methane and gaseous hydrocarbon selectivities obtained in runs SB-0261 nd SB-
0045 were similar (Figure III-2.8 and Table m-2.2), whereas slightly higher selectivities of
low m olecular weight hydrocarbons were obtained in ren SA-0705. For examp le, methane
selectivity varied between 2 and 3 mol% in the latter test,whereas in the two tests conducted
in the reactor B it was between 1.9 and 2.4 mol%. Also, C2 - C4 selec tivity was between 9.3
- 11.3 wt% (T-able III-2.2) in tests conducted in the slurry B system, whereas it was 12.5-14
wt% in the test SA-0705.
Hydrocarbon product distributions for C,+ products in all three tests were similar
(Table III-2.2). For example, the fraction of gasoline range hydrocarbons (C5 - C11)was
generally between 11-14 wt%. Numerical values for diesel range hydrocarbons (C 2 - C 8)
m- 0

7/28/2019 808495(1).pdf
http://slidepdf.com/reader/full/8084951pdf 52/240
350
300
25 0
20 0
15 0
100
50
0 .
SB-0261
A 58-0045
0 SA-0705
1I I I I I I I I I I 1 I 1 I I I I I I I I I
Catalyst 100 Fe/3 Cu/4 W16 SiO,- -
- -
- -
- -
- -
- -
I I I I I I I I I I I I I I I I I * I I I
0 50 100 150 200 250 300 350 400 450 500 550
Test Conditions : T = 26OOC
P = 1.48 MPa
SV = 2.3 - 3.4 NUg-Fe/h
HdCO = 0.67 - 0.69
Time on Stream, h
Figure III-2.7 Apparent first order reaction rate constant u function of time (100Fe/3 C d 4 1V16 Si 02 calalysi).

7/28/2019 808495(1).pdf
http://slidepdf.com/reader/full/8084951pdf 53/240
4l ' l ' i ' l ' l ~ ~1 , 1 , 1 ,
Catalyst 100 Fe/3 Cu14 W16 SiO,
I ' I
Sa-0045 A 1.48 MPa, 1.4 Nllgcatih v 2.17 MP a, 2.0 Nllg-cath
SA4705 o 1.48 MPa, 1.4 Nllgcatlh 0 2.17 MPa, 2.0 Nllg-cath
1 SB-0261 1.48 MPa, 1.4 Nllgcatih
3 -
2 -
1 -
3
Test Conditions : T = 26OOC
P = 1.48 - 2.17 MPa-
rn
SV = 1.4 - 2.0 NV-
H;JCO = 0.67 - 0.69
-
-
o ~ l ' l l l l l , l , l . l . l . l , l . , , ~ ,
t '
Figure III-2.8 Methane (a) and (C 1+C2) hydrocarbon selectivity (b) as a function of time
(100 Fd3 Cu/4 W16 Si02).
m- 2
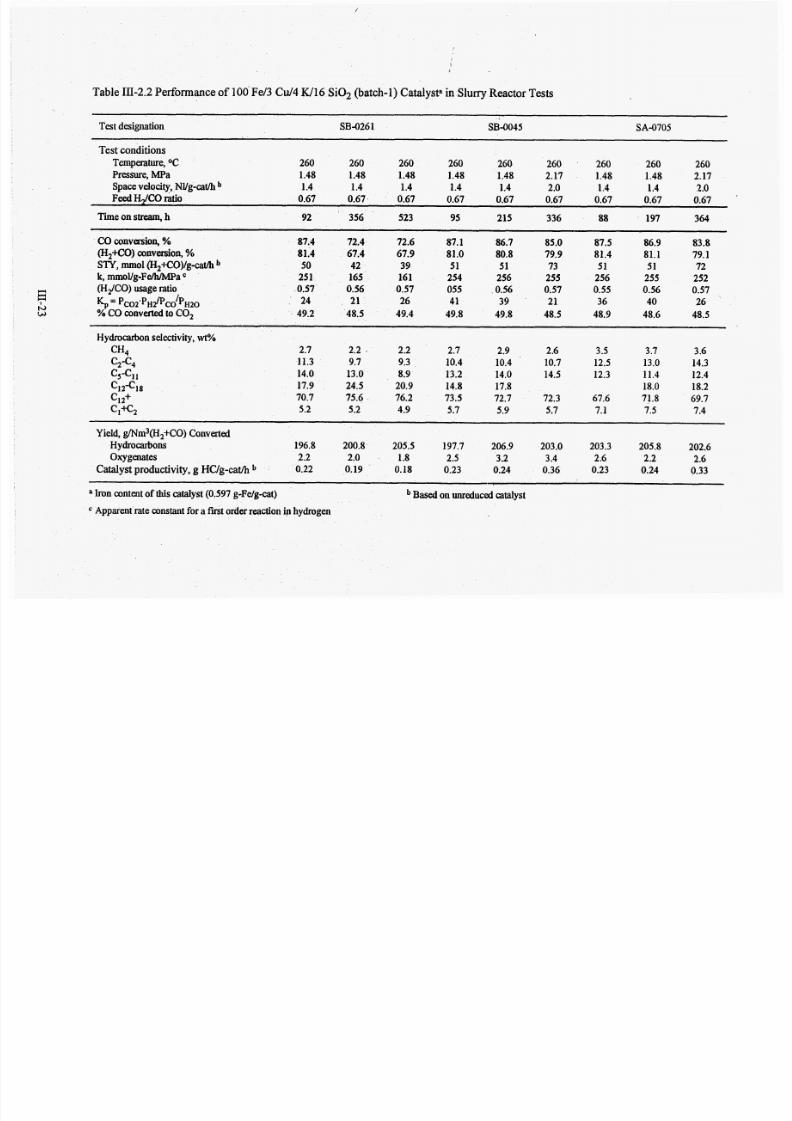
7/28/2019 808495(1).pdf
http://slidepdf.com/reader/full/8084951pdf 54/240
Table III-2.2 Performance of 100Fe/3 C d 4 W16 Si02 (batch-1) Catalyst" in Slurry Reactor Tests
Test designation SB-0261 SB-0045 SA4705
Test conditions
Temperature, OC 260 260 260 260 260 260 260 260 260
Pressure, MPa 1.48 1.48 1.48 1.48 1.48 2.17 1.48 1.48 2.17
FeedHdCO ratio 0.67 0.67 0.67 0.67 0.67 0.67 0.67 0.67 0.67
Space velocity,NUg-cath
1.4 1.4 1.4 1.4 1.4 2 o
1.4 1.42 .O
Time on stream, h 92 356 523 95 215 336 88 197 364
CO onversion, % 87.4 72.4 72.6 87.1 86.7 85.0 87.5 86.9 83.8
(H2+C0)conversion, % 81.4 67.4 67.9 81.0 80.8 79.9 81.4 81.1 79.1
STY,m o l H,+CO)/g-catm b 50 42 39 51 51 73 51 51 72
k,mmol/g-Fe/NMpa 25 1 165 161 254 256 255 256 255 252
&KO) usage ratio 0.57 0.56 0.57 055 0.56 0.57 0.55 0.56 0.57
Kp = p co2~p *? / p co~~H 2o 24 21 26 41 39 21 36 40 26
% CO converted to CO, 49.2 48.5 49.4 49.8 49.8 48.5 48.9 48.6 48.5
Hydrocarbon selectivity,wt??
CH4
c;-c4cs-c,1
c12+
Cl+C2
c12-c18
2.7 2.2 ' 2.2
11.3 9.7 9.3
14.0 13.0 8.9
17.9 24.5 20.970.7 75.6 76.2
5.2 5.2 4.9
2.7 2.9 2.6 3.5 3.7 3.6
10.4 10.4 10.7 12.5 13.0 14.3
13.2 14.0 14.5 12.3 11.4 12.4
14.8 17.8 18.0 18.273.5 72.7 72.3 67.6 71.8 69.7
5.7 5.9 5.7 7.1 7.5 7.4
Yield, g/Nm3(H2+CO)Converted
Hydroca~bons 196.8 200.8 205.5 197.7 206.9 203.0 203.3 205.8 202.6
Oxygenates 2.2 2.0 1.8 2.5 3.2 3.4 2.6 2.2 2.6
Catalystproductivity, g HC/g-cath 0.22 0.19 0.18 0.23 0.24 0.36 0.23 0.24 0.33
a Iron content of th is catalyst (0.597 g-Fe/g-cat)
Apparent rate constant for a first order reaction ighydrogen
Based on unreduced catalyst
7/28/2019 808495(1).pdf
http://slidepdf.com/reader/full/8084951pdf 55/240
and C 19+ products were no t as reproducible as those for the gasoline range hydrocarbons, but
for m ajority of mass balances the corresponding selectivities were about 18 wt% and 51-55
wt%, respectively.
Typ ical carbon number distribution obtained in run SB-0045 is shown in Figure III-
2.9. Positive deviations from ASF distribution are noted in Clo - C20 carbon number range.
The same type of irregularity was observed in tests with catalyst B (Figure HI-2.4).
Experimental data were fitted with a three parameter model, and the model prediction is
shown as a solid line. The estimated values of parameters are as follows: a, 0.59; a,=
0.95 , nd p =0.75.
Total olefin and 2-olefin contents as a function of carbon number are shown in Figure
III-2.10. Total olefin co ntents (Figure III-2.1Oa) we re sim ilar in all three runs and small
deviations in resultsmay be attributed to experimental errors. Also, 2-olefin contents (Figure
III-2. lob) were similar n all three runs up to C 1 2 , but s ignifican tly higher 2-olefin contents of
CI3+hydrocarbons were obtained in runSB-026 1 than n the other two tests.
Concue Tests with Catalysts Be.
Three tests were conducted with each of the two catalysts. In the original tests
conducted in 1991 (SB-1931 with the catalyst B, and SB-0261 with the catalyst C) n-
octacosane was used as th e initialmedium. In the four tests conducted during the current
contract, Ethylflo 164oil was used as the start-up fluid , due to problems encountered in three
initial tests using n-octacosane as the start-up liquid (low activity in all three tests). The
effect of reactor set-up (slurry A vs. slurry B reactor system) was investigated in two recent
tests with the catalys t C (runs SB-0045 and SA-0705). In general, reproducibility of results
in multiple tests of the same catalyst may be regarded as quite satisfactory. The catalyst B
(100 F d 5 C d 6 W24 Si0 2) was more stable in the o riginal test (SB-1931) than in the two
recent tests (SB-3354 and SB-0665), whereas the opposite trend was observed in tests with
/
III-24

7/28/2019 808495(1).pdf
http://slidepdf.com/reader/full/8084951pdf 56/240
ITI- 5
8
2
ij 2
d
ru0
Yd
k
nE
Z3
c0
VI
VIE:
E:0
a
.d
.r(0
a
'E:
a
u
.r(
cn
r- )Ya
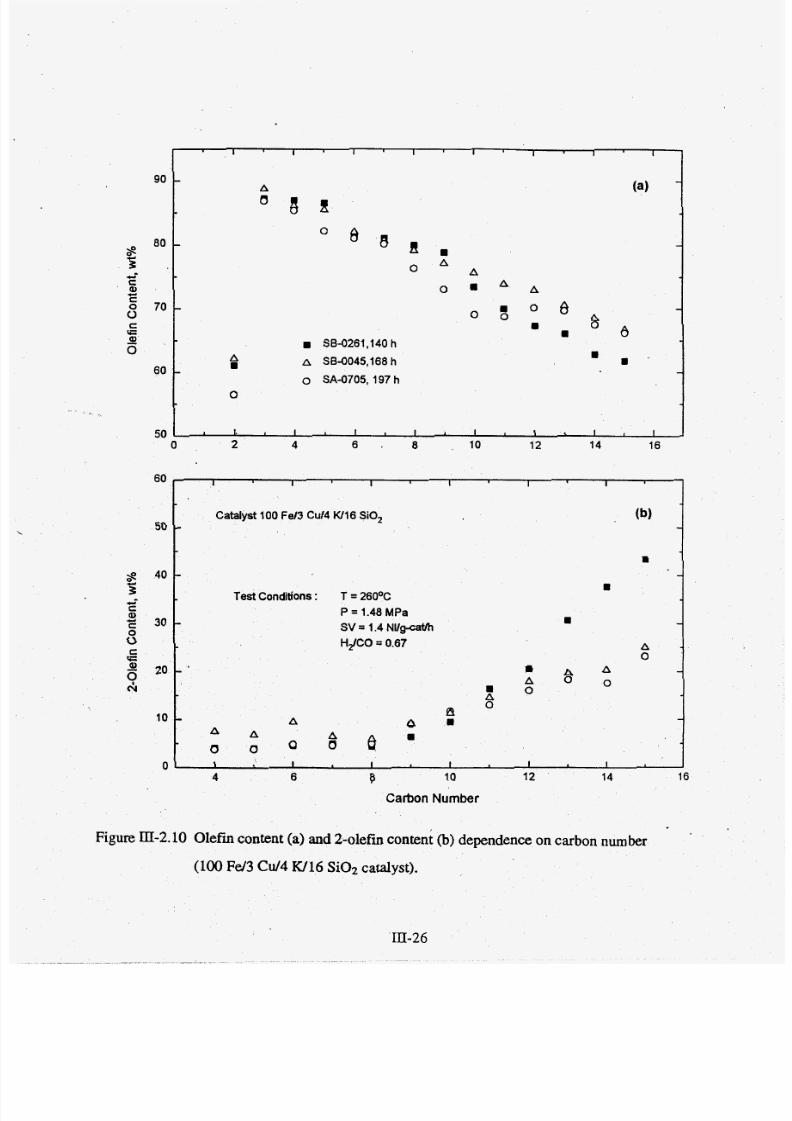
7/28/2019 808495(1).pdf
http://slidepdf.com/reader/full/8084951pdf 57/240
90
80
70
60
50
rn SB-0261,140 h
A SB-0045,168h
0 SA-0705, 197 h
A8
0
I I I I I I 1 I
-A (a) -O B a
0 , 8- O 8 -
A
O m A A
A
0 8
* 8
..
- -o x
8
- -
1 I I I I I I I
60 ,I I I I I I
50
40
3
00
w-cQ)
E 30
eGa2
(v
20
10
-
-
-
- .
-
Catalyst I 0 0 Fe13 Cu14 W16 SiO,
Test Conditions : T = 26OOC
P = 1.48 MPa
SV = 1.4 NUg-cat/h
HdCO = 0.67
A A
0 0
A
0
8A0
0 1 I I I I I I I4 6 8 10 12 14 16
Carbon Number
Figure DI-2.10 Olefin content (a) and 2-olefin content (b) dependence on carbon number
(100 F d3 Cu/4 W16 Si02 catalyst).
ED[-26
7/28/2019 808495(1).pdf
http://slidepdf.com/reader/full/8084951pdf 58/240
the catalyst C (100 Fe/3 C d 4 W16 Si92). Hydrocarbon product distributions and olefin
selectivities in multiple tests with the same catalyst were also reproducible.
Performance of catalysts B and C is comparable to, or exceeds, that obtained in the
two most successful bubble column slurry reactor (BCSR) tests conducted by Mobil (Kuo,
1985) and Rheinpreussen (Kolbel et al., 1955). In Mobil’s run CT-256-13 at synthesis gas
conversion of 82%, methane and C1 + C, se lect ivities were 2.7 and 5.6 wt%, respectively ,
whereas the catalyst productivity was about 0.26 g HC/g-cath (Test conditions: 257OC, 1.48
MPa, 2.3 NVg-Feh, H2/CO = 0.73). In Rheinpreussen’s dem onstration plant unit the C1 + C,
selectivity was 6.8% at the synthesis gas conversion of 89%, and the catalyst productivity
was about 0.33 g HC/g-cadh (Test conditions: 268OC, 1.48 MPa, 3.1 Wg-Fe/h, H2/CO =
0.67).k
In run SB-3354 with catalyst B (TOS = 97 h) the following results were obtained at
26OoC, 1.48 MPa, 3.2 NVg-Feh, H2/CO = 0.67: Methane and C.1+C, electivities were 3.2
and 5.3 wt%, respectively, and the catalyst productivity was 0.26 g HC/g-cat/h at th e
synthesis gas conversion of 71.5%. The catalyst performance in the original test of the
catalyst B (run SB-1931) was even better (see Table III-2. l) , i. e. higher activity and lower
methane and gaseous hydrocarbon selectivities were obtained.
ance of catalyst C in run SB-0045 is illustrated in Table LTI-2.1. For
exam ple, at the reaction pressure of 1.48 MPa and 215 hours on stream, its performance was
very similar to that obtained in Mobil’s run CT-256-13. However, the performance of
catalyst C was better at reaction pressure of 2.17 M Pa and gas space velocity of 3.4 NYg-Feh
(TOS = 336 h). Methane and C + C, selectivities were 2.6 and 5.4 wt%, respectively, and
the catalyst productivity was 0.36 g H a g -c a th at the synthesis gas conversion of about 80%.

7/28/2019 808495(1).pdf
http://slidepdf.com/reader/full/8084951pdf 59/240
III-3 References
Barton, G. H. and Gale, B. The Structure of a Pseudo-Hexagonal Iron Carbide. Acta Cryst.,
1964917, 160-1462.
Bukur, D. B., 1994,Development of improved iron Fischer-Tropsch catalysts. Final report
prepared for DOE Con tract No. D E-AC 22-89PC 89868, Texas A& M Research
Foundation, College Station, Texas.
Hofer, L. J. E., Cohn, E. M. and Peebles, W. C. The Modifications of the Carbide, Fe2C;
The ir Properties and Identification. J. Am. Che. SOC.,1949,71, 189-195.
Huff, G. A.; Jr. and Sa tterfield , C. N. Evidence for Two Chain Growth Probabilities on Iron
Catalyst in the Fischer-Tropsch Synthesis. J. Catal., 1984,85,370-379
Kolbel, H., Ackerman, P. and Engelhardt, F., 1955, New developments in hydrocarbon
synthesis. Proc. Fourth World Petroleum Congress, Section IVK, pp. 227-247. Carlo
Colombo Publishers, Rome.
Kundig, W., Bommel, H., Constabaris, G. and Lindquist, R.H., Some Properties of
Supported Small a-E k2O3 Particles Determined with Mossbauer Effect", Phys. Rev.,
1966,142,327-342-
Kuo, J. C. W., 1985, Tw o stage process fo r conversion of synthesis gas to high qualitytransportation fuels. Final report prepared for DOE Contract No. DE-AC22-
83PC600019, Mobil Research and Development Corp., Paulsboro, NJ.
III- 8
7/28/2019 808495(1).pdf
http://slidepdf.com/reader/full/8084951pdf 60/240
IV Reproducibility of Catalyst Preparation
The objective of this task is to verify reproducibility of catalys t synthe sis procedure
on a laboratory scale. Four new batches of catalyst with nominal comp osition 100Fe/5 C d 6
W24 Si0 2 (catalyst B; S5624) and three new batches of cata lyst with nominal composition
100 Fe/3 C d 4 W16 Si02 (catalyst C ; S3416) were synthesized, characterized by d ifferent
techniques (Section IV- l), and some of them were tested in slurry reactors (Section IV-2).
JY-1 Catalyst CharacterizationStudies
Several batches (90 to 405 g) of catalysts B and C were synthesized using the
procedure developed in our labo ratory (Appendix 1). Different batches of the catalyst with
the same nominal composition are designated with the seria l number (catalyst code) followed
by an Arabic numeral designating the specific batch (e.g., S3416-2 refers to batch-2 of
catalyst with nominal compo sition 100 Fe/3 C d 4 W16 SiO,). Synthesized catalysts were
characterized by atomic absorption spectroscopy (AAS), BET surface area (SA), pore
volume (PV), pore size distribution (PSD) measurements, temperature-programmed
reduction (TPR) and isothermal reduction.
Catalvst Composition and Textural Properties
(
The catalyst composition was determined by AAS using a Varian Spectra AA-30
spectrophotom eter. Detailed description of experimental equipm ent and procedures is
provided in Appendix 2. Results of elemental analysis are shown in Table IV-1.1, and major
findings are summarizedbelow:
(1) For catalyst Cyboth the copper and the silica contents agree well among different
batches, how ever, potassium content of batch-:! (3.6 parts by weight (pbw) of K per 100 pbw
of Fe), batch-3 (3.5 pbw of K per 100pbw of Fe) and batch-4 (3.6 pbw of K per 100pbw of
Fe) catalysts is signif icantly lower than that of batch-1 (5.8 - 6.7 pbw of K per 100 pb w of
Fe). The ac tual potassium conte nt of the catalysts synthesized during the current contract
(batches 2 to 4) is closer to the nominal one, than that of batch-1 (synthesized during the
IV- 1
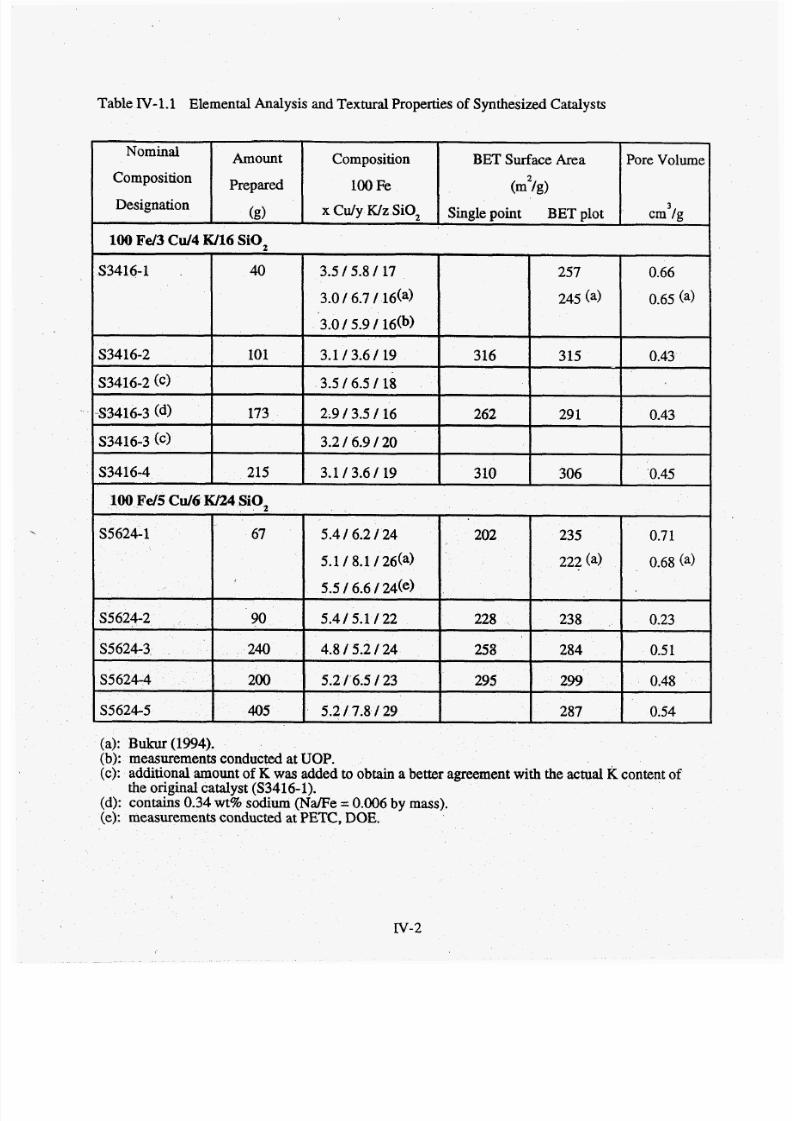
7/28/2019 808495(1).pdf
http://slidepdf.com/reader/full/8084951pdf 61/240
TableJY- .1 Elemental Analysis and Textural Properties of Synthesized Catalysts
Composition
100Fe
Amountominal
Composition
BET Surface Area Pore Volume
(m2/g>
(€9 Single point BET plotesignation
100 FeJ3 Cd4W16 iO ,
3
cm I g
S3416-1
S3416-2
S3416-2 (C)
S3416-3 (d)
S3416-3 (C)
S3416-4
L
40 3.5 15.8 I 7 257 0.66
3.0 I .7 / 16(a) 245 (a) 0.65 (a)
3.0 I 5.9 I 16(b)
101 3.1 I 3.6 I9 316 3 15 0.43
3.5 16.5 I 8
173 2.9 I 3.5 I 6 262 291 0.43
3.2 / 6.9 120
215 3.1 I .6I 9 310 306 0.45
(a): Bukur (1994).
(b): measurements conducted at UOP.
S5624-1
S5624-2
S5624-3
S5624-4
S5624-5
(cj:
67 5.4 I 6.2 I 24 202 235
5.1 18.1 l26( a) 222 (a)5.5 16.6 124(e)
90 5.4 I 5.1 I 22 228 238
240 4.8 15.2 I 4 258 284
200 5.2 I .5 12 3 295 299
405 5.2 17.8 129 287
0.7 1
0.68 (a)
0.23
0.5 1
0.48
0.54
additional amount of K was added to obtain a better agreement with the actua l K content ofthe o riginal catalyst (S3416-1).contains 0.34 wt% sodium ( N a F e =0.006 by mass).measurements conducted at PETC ,DOE.
I v - 2
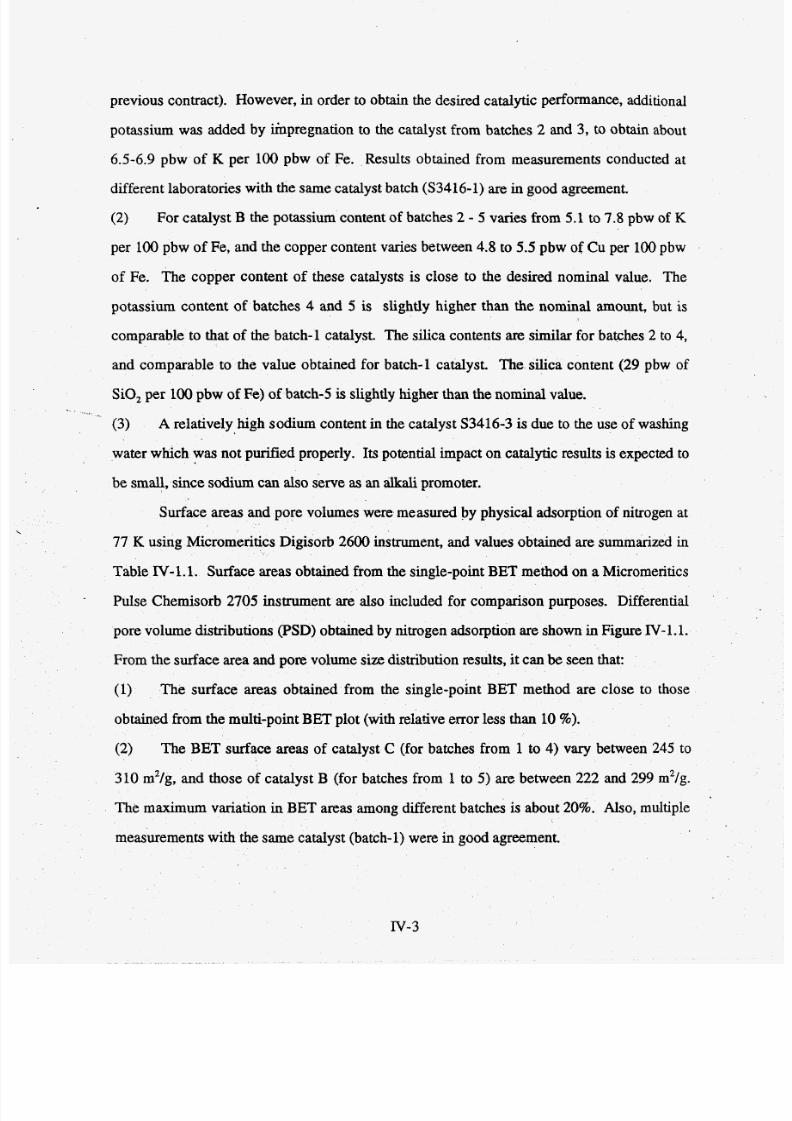
7/28/2019 808495(1).pdf
http://slidepdf.com/reader/full/8084951pdf 62/240
prev ious contract). However, in ord er to obtain the desired cataly tic performance, additional
potassium was ad ded by impregn ation to the catalyst from batches 2 and 3, to obtain about
6.5-6.9 pbw of K per 100 pbw of Fe. Results obtained from m easurements conducted at
different laboratories with the same catalyst batch (S3416-1) are in good agreement.
(2) For catalyst B the potassium content of batches 2 - 5 varies from 5.1 to 7.8 pbw of K
per 100 pbw of Feyand the cop per content varies between 4.8 to 5.5 pbw of Cu per 100pbw
of Fe. The copper content of these catalysts is close to the desired nominal value. The
potassium content of batches 4 and 5 is slightly higher than the nominal amount, but is
comparable to that of the batch-1 catalyst. The silica contents are similar for batches 2 to 4,
and comp arable to the v alue obtained for batch-1 catalyst. Th e silica content (29 pbw ofSiO, per 100 pbw of Fe) of batch-5 is slightly higher than the nom inal value.
(3 ) A relatively high sodium content in the catalyst S3416-3 is due to the use of washing
water which was no t purified properly. Its potential impact on catalytic results is expected to
be small, since sodium can also serve as an alkali promoter.
Surface areas and pore volumes were mea sured by ph ysical adsorption of nitrogen at
77 K using Microm eritics Digisorb 2600 instrument, and values obtained are summarized in
TableN-1.1. Surface areas obtained from the single-point BET method on a Micromeritics
Pulse Chemisorb 2705 instrument are also included for comparison purposes. Differential
pore volume distributions (PSD) obtained by nitrogen adsorption are shown in Figure IV-1.1.
From the surfa ce area and pore volume sizedistribution results, it can be seen that:
(1)
obtained from the multi-point BET plo t (with relatlive error less than 10 %).
(2)
The surface areas obtained from the single-point BET method are close to those
The BET surfa ce areas of catalyst C (for batches from 1 to 4) vary between 245 to
310 m2/g, and those of catalyst B (for batches from 1 to 5) are between 222 and 299 m2/g.
The maximum variation in BET areas among different batches is about 20%. Also, multiple
measurements w ith the sam e catalyst (batch-1) were in good agreement.
Iv-3
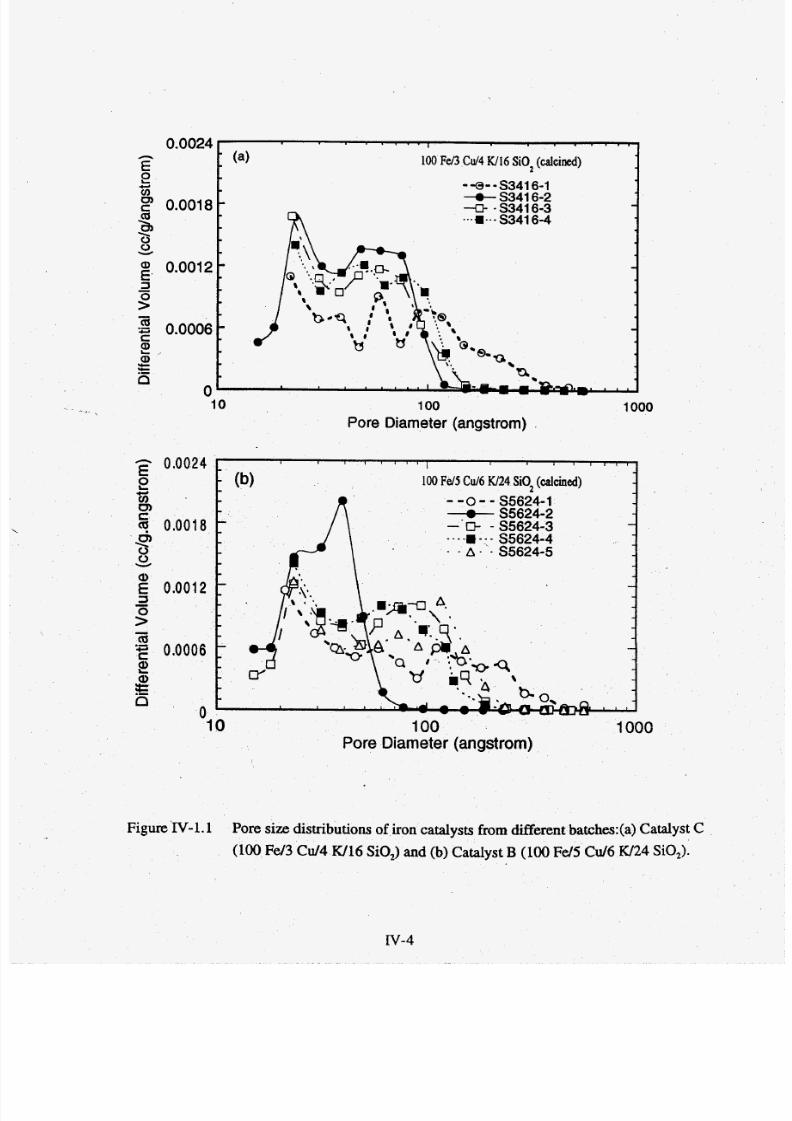
7/28/2019 808495(1).pdf
http://slidepdf.com/reader/full/8084951pdf 63/240
0.0024 i
: (a) 100 Fen Cd4 W16 SiOz(calcined)
--@--S3416-1-O- S3416-2
0.0018 -I7- - S3416-3. . -W-. - S3416-4
- -
10 100 1000
Pore Diameter (angstrom)
- 0.0024E2
3 0.0018
ccnm
0)\
8E 0.0012
>o
W
3--a
aa
’= 0.0006
E0
L.
010 100 1000
Pore Diameter (angstrom)
Figure IV-1.1 Pore size distributionsof iron catalysts from different batches:(a) Catalystc(100 Fe/3 Cd 4 W16 SO,) and (b) Catalyst B (100 F 4 5 C d 6 EU24Sio,).
rv-4

7/28/2019 808495(1).pdf
http://slidepdf.com/reader/full/8084951pdf 64/240
(3 ) Pore volumes for allnew batches (2 - 5) are lower than those o f catalysts synthesized
during the previous contract (batch-1 in both series), even though the surface areas are
similar as indicated.
(4) Pore diam eters (Figure IV- .1) of syn thesized catalys ts are between 2 and 20 nm. For
the catalyst B series, the pore size distributions of catalysts from batches 1 and 5 are similar,
and both hav e two major pore diameters. One is a mesopore with the pore diameter of 2.5
nm, and the other is a macropore with the pore diameter of about 10nm. However, the pore
size distribution of batch-2 c atalyst is quite different, and it exh ibits a very narrow pore size
distribution with dom inant pore diameters between 2.5 and 4 nm. For the catalyst C series,
a l l four batches show similar pore s ize distributions and have two dominant pore diameters.
The mesopores are about 2.5 nm in diameter, and the macropores have dominant pore
diameters between 4 and 10 nm.
(5)
investigated, but they are beyond the d etectable limit of the technique employed.
Reduction Behavior of Cat&&
. * I
Micropores with pore diameters less than 1.5 nm may exist in the catalysts
Reduction behavior of synthesized catalysts was studied in both temperature-
programmed mode (TPR method) and isothermal mode of operation. In the latter mode of
operation, the temperature was ramped from a room temperature to a desired reduction
temperature at a rate of 5OUmin either in helium (TGA unit) or in a mixture of hydrogen and
nitrogen (TPR nit), and then held constant.
-ed r n w t i o n
Temperature-programmed reduction (TPR) studies were performed using a 5% y
95% N, mixture as a reductant. In a typical TPR experiment about 20 mg of catalyst was
packed in a quartz reactor and purged with helium to remove the moisture from the catalyst
Iv-5
sample. Then the catalyst samp le was heated in a flow of 5%H2/95%N2 flow rate = 40
mumin) from room temperature to 800-900°C at a rate of 20OUmin. The degree of reduction

7/28/2019 808495(1).pdf
http://slidepdf.com/reader/full/8084951pdf 65/240
values are calculated from measured hydrogen consumption, and calibration data with
standard CuO sample.
Peak positions (temperature values corresponding to maxima in hydrogen
consum ption) and degree of reduction values from TPR experimen ts with catalysts C and B
from different batches are summarized in Table N-1 .2. Figures IV-1.2(a) and IV-1.2(b)
show the TPR profiles of catalyst C (batch-2 to batch-4) and B (batch-2 to batch-5),
respectively. From Figure N- 1.2 it is clear that the reduction of iron oxide proceeds in two
steps nam ely, the reduction of Fe,O, to F q 0 4 fust step) and Fe,O, to Fe (second step). For
catalyst C samples the first stage reduction peaks are located (Figure IV- 1.2a) between 302 to
326OC and the second stage reduction peaks are located between 53 0 and 585OC. The degreeof reduction fo r the first stage is abo ut2 3 - 2696, and tota l degree of reduction is between 79
and 96% (Table N-1.2).' .
Similarly, catalyst B also has two peaks, one at 300 - 315OC and the second one at
570 - 58OoC(Figure IV-1.2b). The degree of reduction for the first stage reduction is about
23 - 27% and the total degree of reduction varies between 88 and 98%. It is interesting to
note that for both catalysts, B and C, he degree of reduction values for the first stage of
reduction (23-2796) are considerably higher. than the theoretical value corresponding to the
reduction of F e 2 0 3 o Fe,04 (i. e. 12.5%) indicating that part of iron Fe2'is reduced to
metallic iron at lower temperatures(300-326OC).
Similarity of peak positions and degree of reduction values of catalysts from different
batches is indicative of good reproducibility of catalyst preparation, which was confirmed in
stirred tank slurry reactor t q t s of these catalysts (Section IV-2).
IV-
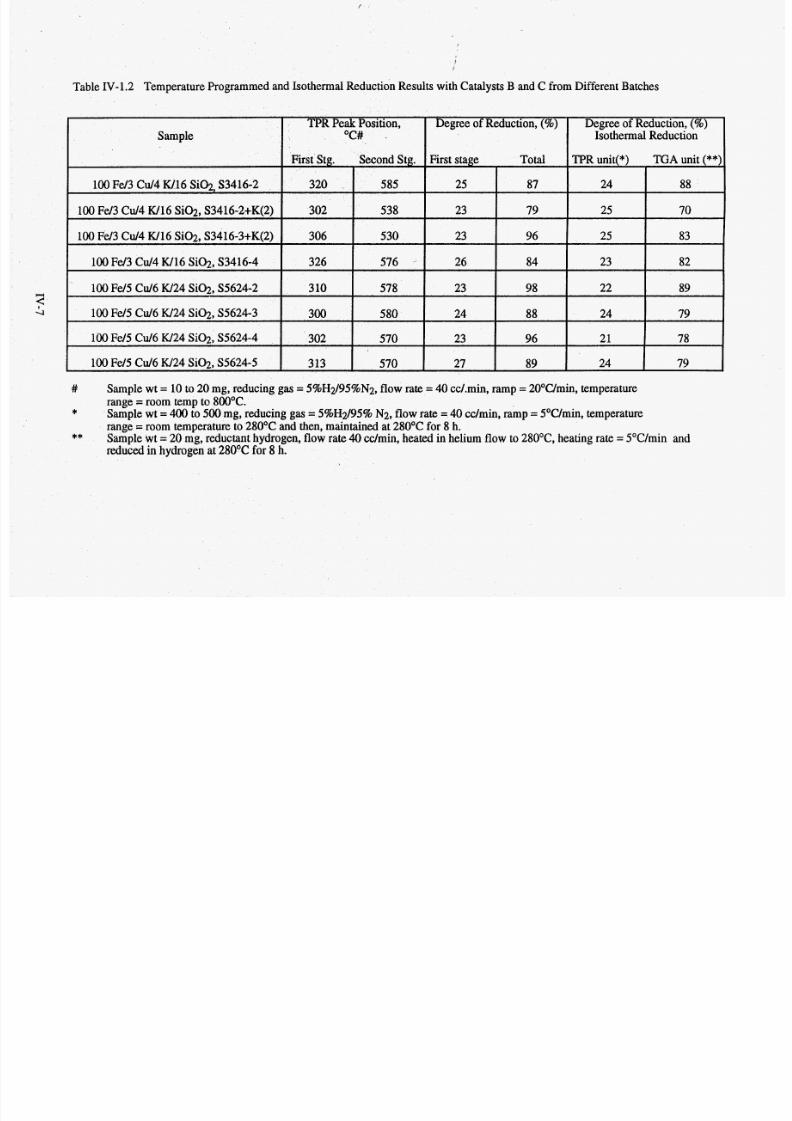
7/28/2019 808495(1).pdf
http://slidepdf.com/reader/full/8084951pdf 66/240
/
Sample
Table IV-1.2 Temp erature Programmed and Isotherm al Reduc tion Results with Catalysts B and C from Different Batches
TPR Peak Position, Degree of Reduction , (%) Degree of Reduction, (%)OC# - Isothermal Reduction
First Stg. Second Stg. First stage Total TPR unit(*) TGA unit (**)
100 F d 3 Cu/4 W16 Si@, S3416-2 320 585 25 87 24 88
100 F d3 C d 4 W16 Si@, S3416-2+K(2) 302 538 23 79 25 70
100 Fd 3 C d 4 W16 Si@, S3416-3+K(2) 306 530 23 96 25 83
100 F d 3 Cu/4 W 16 Si02 , S3416-4 326 576 26 84 23 82
100 Fd5 Cu/6 W24 Si@, S5624-2 3 10 578 23 98 22 89
100 Fd 5 Cu/6 W24 Si@, S5624-3 300 580 24 88 24 79
100Fd 5 C d 6 W24 Si02, S5624-4 302 570 23 96 21 78
100 Fd5 Cu/6 W24 Si@, S5624-5 313 570 27 89 24 79
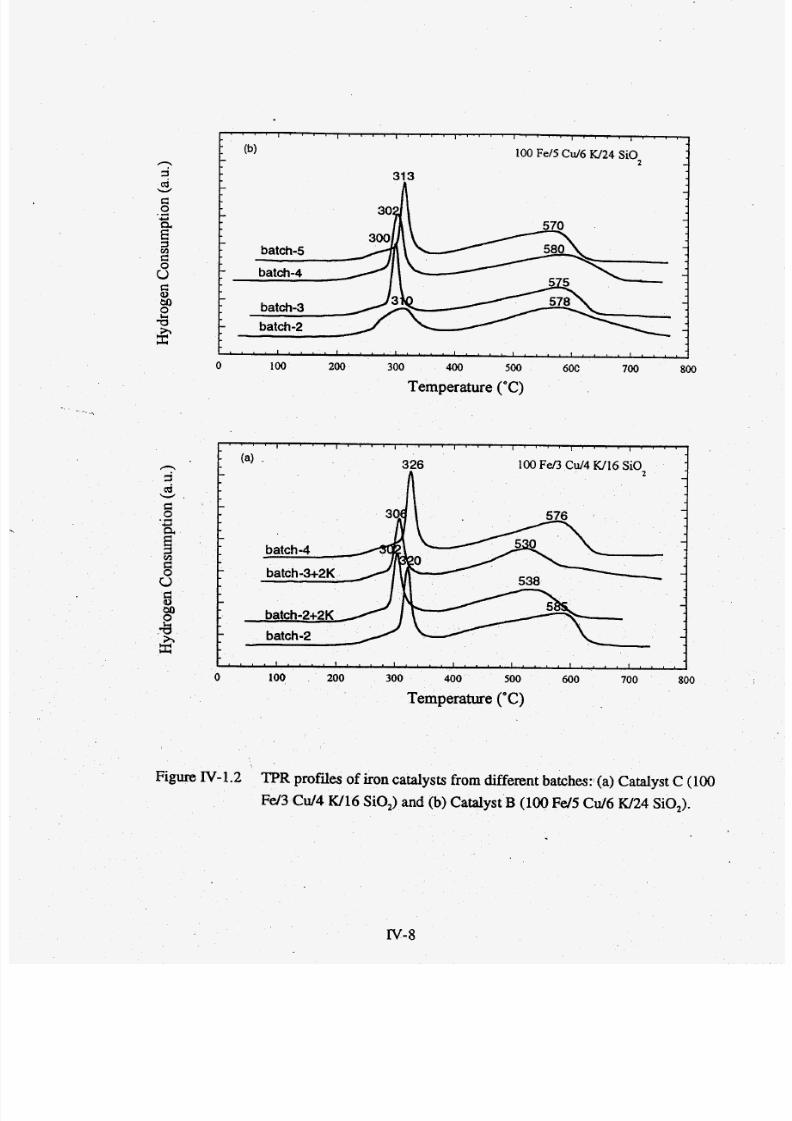
7/28/2019 808495(1).pdf
http://slidepdf.com/reader/full/8084951pdf 67/240
326 100 Fe/3 Cu/4 W16 Si02
batch4
batch-2+2K
batch-2
0 100 200 300 400 500 600 700 800
Temperature ('C)
Figure IV-1.2 TPR profiles of iron catalysts from different batches: (a) Catalyst C (100
Fd3 Cu/4 W16 SiO,) and (b) Catalyst B (100 Fe/5 Cu/6 W24 SO,).
rv-
7/28/2019 808495(1).pdf
http://slidepdf.com/reader/full/8084951pdf 68/240
Isothermal Reduction Behavior
In isothermal reductions conducted in the TPR unit, the temperature was ramped at a
constant rate of SoC/min to a final temperature of 280°C in a flow of 5%H2/95%N, mixture.
Then the catalyst sample was maintained at this temperature for 8 h in a flow of 5% H,/95%
N, (40 mumin). The degree of reduction as a function of time was calculated from measured
hydrogen consumption, and calibration with standard CuO sample.
In isothermal reductions conducted in the TG A unit, the catalyst sam ple was purged
with helium (40 mumin) and the temperature was ramped at a rate of S°C/min from room
temperature to 280°C. Then the helium flow wa s switched to hydrogen (99.995% purity) and
the temperature w as maintained at 280°C for a total period of 8 h. Th e degree of reductionwas calculated from experimental weight loss vs. time data, and th e theoretical weight loss
based on the known composition and mass of a sample.
Figures IV- 1.3a and IV-1.3b show the isothermal reduction behavior (in TPR unit) of
catalyst C an d catalyst B in diluted hydrogen as a function of reduction time. The final
degree of reduction values (i.e. at the end of eight hour reduction period) are between 21 and
25% for all catalysts. These values are similar to those obtained for the first stage of
reduction in the TPR mode of reduction.
Final degreesof reduction in pure hydrogen (TGA unit) for catalysts B and C were
significantly higher than those obtained in 5%hydrogen stream. For example, for catalyst C
the final degree of reduction in pure hydrogen varied between 70% (S3416-2+K (2) batch)
and 82-85% for all other batches (Figure IV-1.4a), whereas for catalys t B the final degree of
reduction in pure hydrogen was 89% (S5624-2 batch), and about 80% fo r th e other three
batches (Figure JY-1.4b).
The above results are consistent with the ones obtained during the temperature
programmed reduction (Table IV-1.2), and they indicate that there are no significant
differences in th e reduction behavior among catalysts from d ifferent batches.
rv-
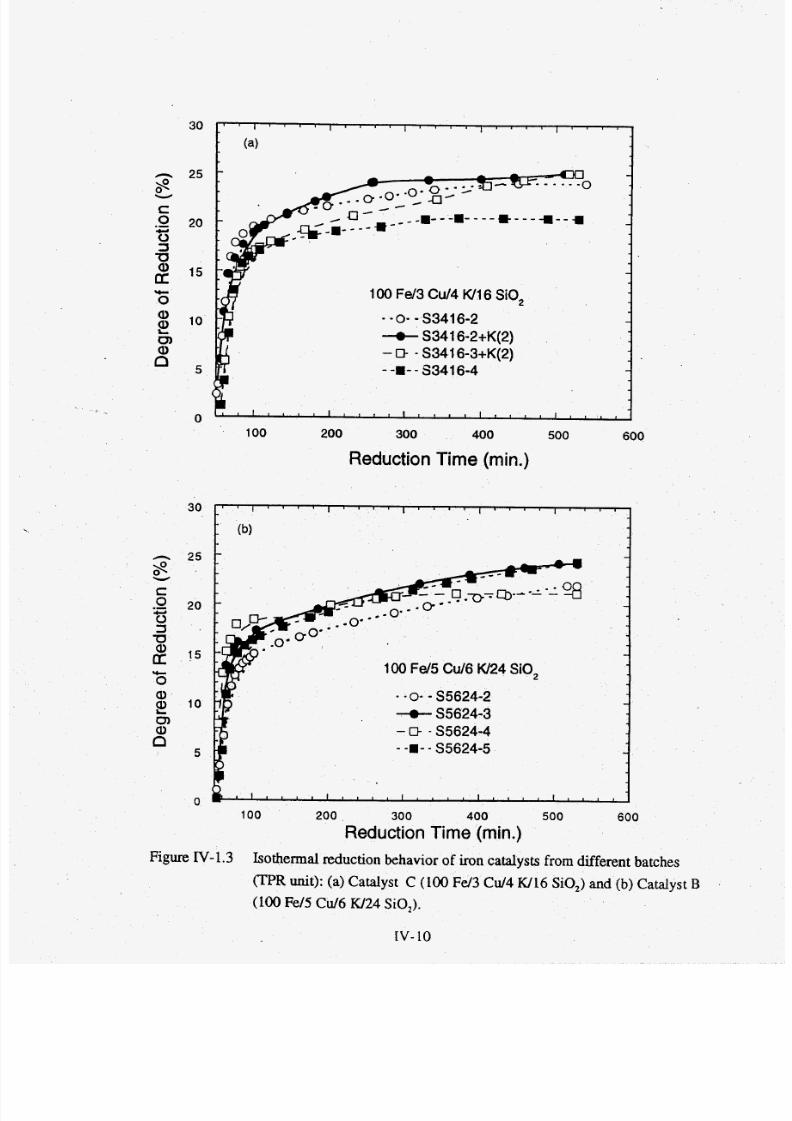
7/28/2019 808495(1).pdf
http://slidepdf.com/reader/full/8084951pdf 69/240
y.
0
a,
0)
a,
E
n
30
2 5
2 0
15
10
5
0
100 Fd3 C U I ~16 SiO,
--O--S3416-2
+ 3416-2+K(2)
-D - S3416-3+K(2)
- -a- 8341 6-4s00 200 300 400 500 600
Reduction Time (min.)
30
n 25
8
.G 20
W
c
03a2 15
*0
w
100 Fd5 Cd6 W24 SiO,
- -0- - 35624-2
+ 5624-3
-D - 35624-4
- -a- S5624-5
102Q)
50"
0l , , , , l , , , , I , , , , I , , , , l , , , , -
100 200 300 400 500 600
Reduction Time (min.)
Figure IV-1.3 Isothermal reduction behavior of iron catalysts from different batches
(TPR unit): (a) Catalyst C (100 F d 3 C d 4 W16 SO,) nd (b ) Catalyst B
(100 Fe/5 Cu/6 W24 SiO,).
tv-10
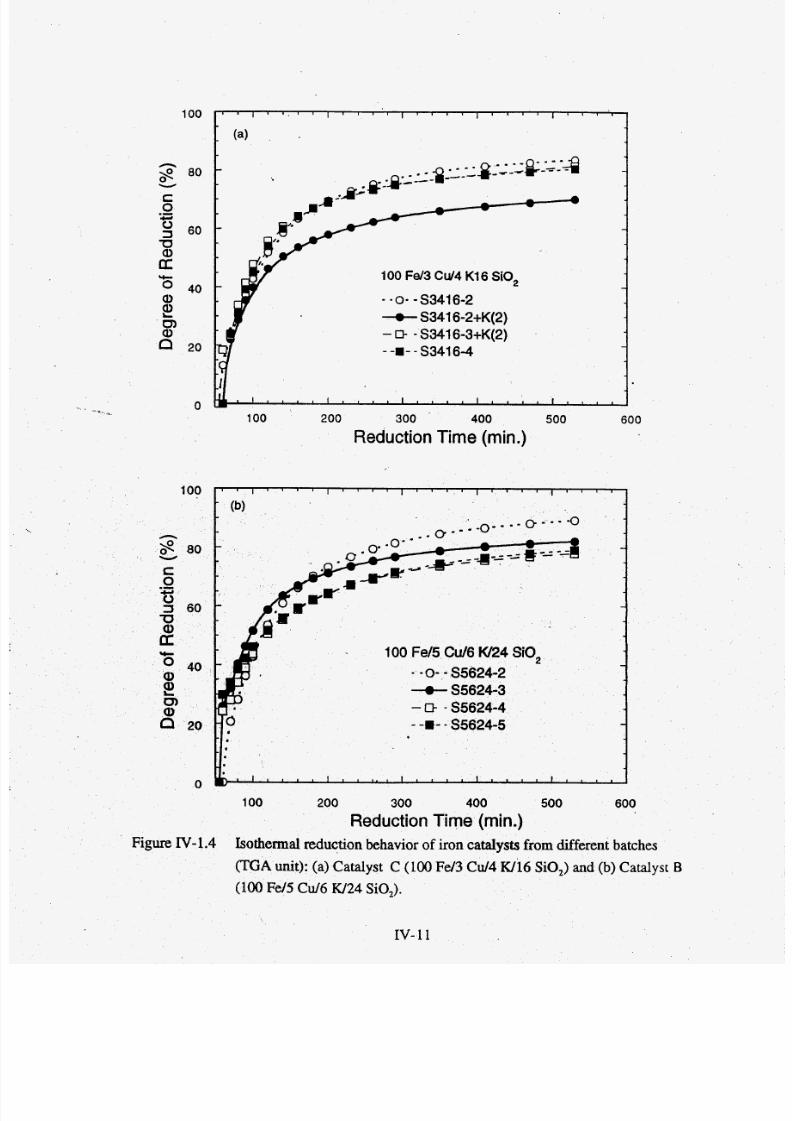
7/28/2019 808495(1).pdf
http://slidepdf.com/reader/full/8084951pdf 70/240
100 I ' " ' I " " I " " I " " I " ' '
(a )
. .p - - -&-1--a--- ---- - - -
L 0w
w
-
100 Fe/3 Cu14 K16 SiO,-
- - Os - S3416-2
+ 3416-2+K(2)
-D - S3416-3+K(2)
--a- S3416-4-
.I
~ ~ ~ " " " " " " " " " ' ~ " "
100 Fe/5 C d 6 W24 SiO,
- -0 - S5624-2
-t- 5624-3
-0- 55624-4
--.-S5624-5
100 200 300 400 500 600
Reduction Time (min.)Figure IV- .4 Isothermal reduction behavior of iron catalysts from different batches
(TGA unit): (a) Catalyst C (100 F d 3 Cd4W16 SiO,) and (b) Catalyst B
(100 Fe/5 C d 6 W24 SiO,).
IV- 11
7/28/2019 808495(1).pdf
http://slidepdf.com/reader/full/8084951pdf 71/240
m R
XRD an d MES results of pretreated and used catalyst samples are summarized in
Tables IV-1.3 and IV-1.4. In general there is a good agreement between XRD and MES
results with regard to identity of iron phases in a given sample. Occasional discrepancies in
the phase identification aredue to the following factors. A significant fraction of iron has not
been positively identified by Mossbauer spectroscopy, i. e. it is in the form of small
crystallites (less than about 13 nm) which exhibit superparamagnetic behavior at room
temperature (Spm phase in Tables IV-1.3 and N-1.4). On the other hand, XRD an identify
phases with crystallites larger than about 4 nm and thus some phases are identified by XRD
(e.g. magnetite or metallic iron)? but not by MES analysis. Another source of discrepancy, is
the difficulty in discriminating between E' - and x - carbide with XRD analysis, so that
occasionally an iron carbide may be identified as €-carbide (Fe,C) by XR D analys is,
whereas MES analysis identifies this phase as a x-carbide (Fe&).
Figure IV- .5(a) shows XRD patterns of reduced (in H, t 240OC for 2 h and TOS =
0 h) catalyst C from batches 2 to 4. Both magnetite (Fe,O,) and a-Fe were identified by
XRD in reduced catalysts from preparation batches 2 and 3. Th e MES results (Table IV-1.3)
for these two samples indicate the presence of a-Fe(5-12%), as well as magnetite (7%) fo r
batch-3 catalyst only (SA-2175), and 81% to 95% superparamagnetic (Spm) phase. The
catalyst from batch-4 was primarily in the form of magnetite (Figure IV-1-Sa and Table IV-
1.3). From these results it appears that the catalyst C is not reduced completely and that only
a small fraction of iron is in the form of either magnetite or metallic iron.
Figure W - lS (b ) shows XRD patterns of reduced (in 4 at 25OOC for 4 h and TOS = 0
h) catalyst B from batches 4 and 5. The results indicate that the samples contain poorly
crysta lline magnetite (Fe,O,) and a-Fe suggesting that the particles are too small or less
crystalline. How ever, MES results of these samples show that the reduced
lv- 2
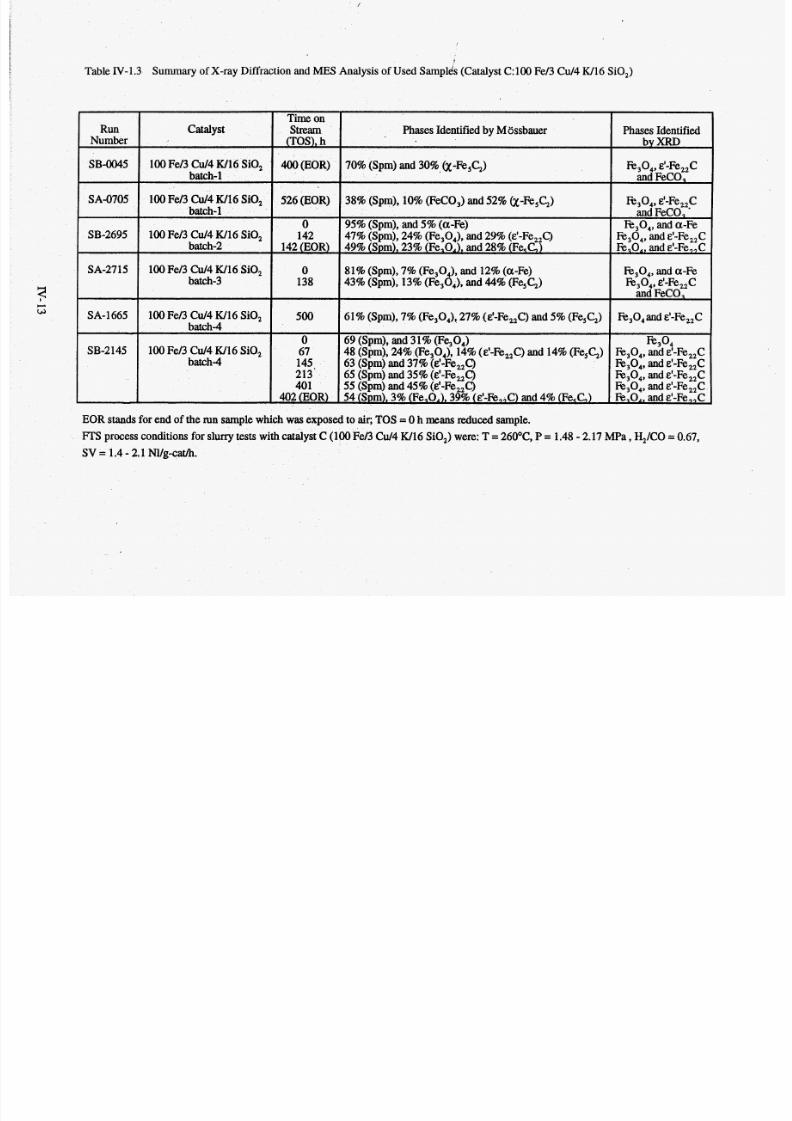
7/28/2019 808495(1).pdf
http://slidepdf.com/reader/full/8084951pdf 72/240
'
Table IV-1.3 Summary of X-ray Diffraction andMES Analysis of Used Samples (Catalyst C:lOO Fe/3 C d 4 W16 SiO,)
RUn catalystNumber
SB-0045 100Fe/3 Cu/4 W16 Si0,batch-1
100 Fe/3 Cu/4 W16 SiO,
100Fe/3 C d 4 W16 SiO,batch-2
100Fe/3 Cu/4 W16 SiO,batch-3
SA4705batch-1
SB-2695
SA-2715
SA-1665 100Fe/3 Cd 4 W16 SiO,batch4
100 Fe/3 C d 4 W16 SiO,batch4
SB-2145
Time onStream Phases Identified by Mossbauer Phases Identified
(TOS), h by XRD
400 EOR) 70% (Spm) and 30% &-Fe,CJ Fk304,'-Fe,Cand FeCO,
526 (EOR) %@4, E'-Fe,Cand FeCO,
0 95% (Spm), and 5% (a-Fe) Fk304, nd a-Fe142 R,04, nd E'-Fe,,C
142 (EOR) Fe,O,, and E'-Fe,,C
0 Fk,04,nd a-Fe138 43% (Spm), 13% (Fe,O,), and44% (Fe,q) Fb304, -Fe,C
and FeCO,
500 61% (Spm), 7% (Fe,O,), 27% (e'-Fe2,C) and 5%(Fe,CJ Fk304and E'-Fe,C
67 48 (Spm), 24% (Fe,O,), 14% (&'-Fe,C) and 14% (Fe ,G) e@,,nd E'-Fe,C145. 63 (Spm) and 37% (d-Fe,C) )ie@,, and &'-Fe,C213 65 (Spm) and 35% (&'-Fe,c) F k 3 0 4 , and e'-Fe,C
401 55 (Spm) and 45% (E'-Fe,C) Fk304,nd &'-Fe,C
38% (Spm), 10% FeCO,) and 52% &-Fe,CJ
47% (Spm), 24% (Fe,04),and 29% (&'-Fe2,C)49% (Sprn), 23% (Fe,O,), and 28% (F e,C )
81% (Spm), 7% (Fe ,04), and 12% (a-Fe)
0 69 (Spm), and 31% (F%O,) E 3 0 4
402 (EOR) 54 (Som), 3% (Fe,O,), 39% (E'-R,,C) and 4% (Fe ,C) FeaO,. and E'-Fe,,C
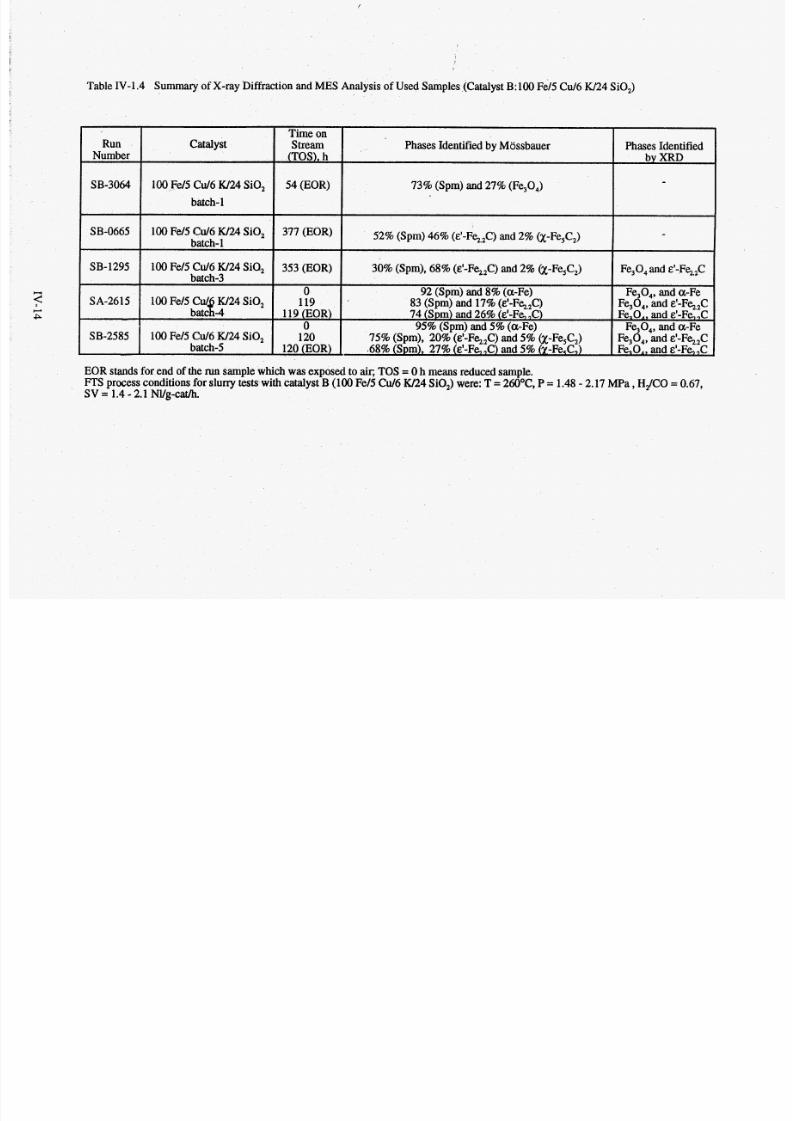
7/28/2019 808495(1).pdf
http://slidepdf.com/reader/full/8084951pdf 73/240
Table IV-1.4 Summary of X-ray D iffraction and MES Analysis of Used Samples (Catalyst B: 100 Fe/5Cu/6 W24 SiO,)
RunNumber
SB-3064
SB-0665
SB-1295
SA-2615
SB-2585
Time oncatalyst Stream
(TOS), h by XRD
54 (EOR)
Phases Identified by Mossbauer Phases Identified
100 Fe/5 Cu/6W24 iO,73% (Spm) and 27% (Fe 304)
-
batch-1
100 Fe/5 C d 6 W24 iO,
100 Fe/5 Cu/6 W24 SiQ, Fe3 04 nd &'-F%.,C
Fe304, nd a-Fe100 Fe/5 Cu/ W24 SiO, 119 83 (Spm) and 17% (&'-F%.,C) Fe 304, nd &'-F%,C
Fe,O,, and E'-Fe,,C0 95% (Spm) and 5% (a-Fe) Fe3 04 , nd a-F e
Fe 30 4, nd c'-F%,C00 Fe/5 Cu/6 W24 SiO,batch-5 120 (EOR) .68% (Sprn), 27% (&'-Fe,C) and 5%&-Fe,C,) Fe,O,, and &'-Fe,,C
377 (EOR) 52% (Spm) 46% (&'-F%,C) and 2% (x-Fe,C,)
30% (Spm), 68% (c'-F%,C) and 2% &-Fe,C,)
92 (Spm) and 8 % (a-Fe)
74 (Spm) and 26% (&'-Fe, C)
75% (Spm), 20% (&'-F%,C) and 5% &-Fe5C,)
-batch-1
353 (EOR)
0
119 (EOR)
120
batch3
batcR-4
EOR stands for end of the run sample which was exposed to air; TOS =0 h means reduced sample.
FTS process conditions for slurry tests with catalyst B (100 Fe/5 C d 6 K/24 SiOJ were: T = 26OoC,P = 1.48 - 2.17 MPa ,HJCO = 0.67,SV = 1.4 - 2.1 NVg-cat/h.
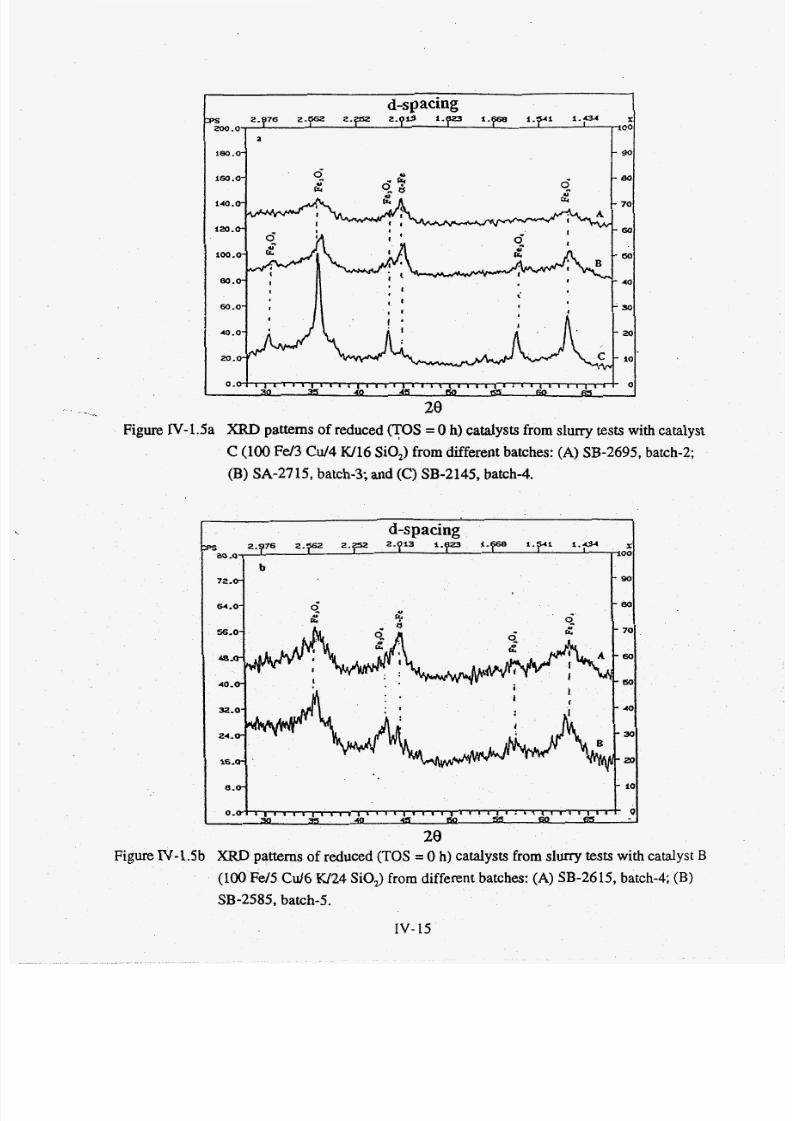
7/28/2019 808495(1).pdf
http://slidepdf.com/reader/full/8084951pdf 74/240
Figure IV- 1.
d-spacing3ps 2.776 2.F . p 2 . p l 3 i . f I 2 3 1q6a 1.y' 1.y x
160.o- e -eo
200 0- 100
160.0- -90
a
u
k e
d-spacingI
00
90
80
70
60
50
40
30
20
0.0- - io
O . O . I ( I , ~ , ( , , , , ( r , , , ( r , ~ , , ~ , , , l , ~ , , l , I , , I , , , 030 35 40 45 w ss 60 65
catalyst
C (100 Fd 3 C d 4 W16 SiO,) from d ifferent batches: (A ) SB-2695, batch-2;
(B) SA-2715 , batch-3; and (C) SB-2145, batch-4.
Figure IV-1.5b XRD patterns of reduced (TOS = 0 h) catalysts from slurry tests with catalyst B
(100 Fe/5 Cu/6 W24 SiO,) from differen t batches: (A ) SB-2615, batch-4; (B)
SB-2585, batch-5.
IV- 15
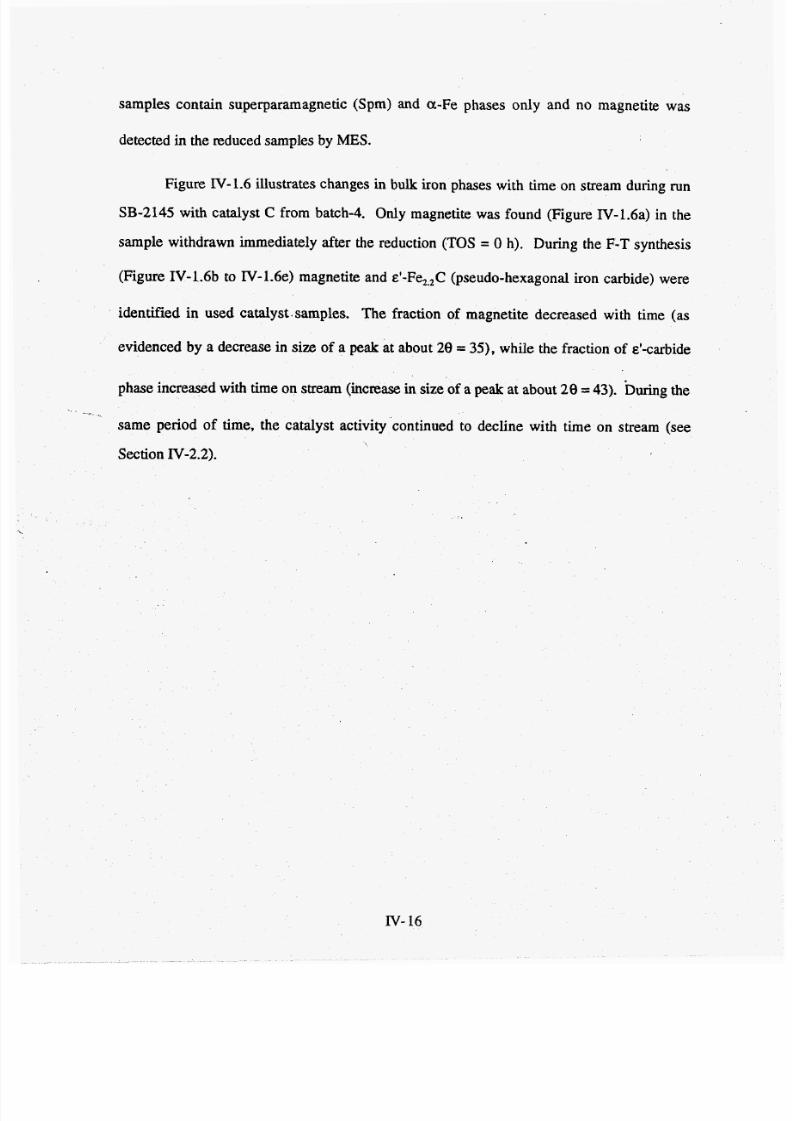
7/28/2019 808495(1).pdf
http://slidepdf.com/reader/full/8084951pdf 75/240
samples contain superparamagnetic (Spm) and a-Fe phases only and no magnetite was
detected in the reduced sam ples by MES.
Figure IV-1.6 illustrates changes in bulk iron phases with time on stream during run
SB-2145 with catalyst C from batch-4. Only magnetite was found (Figure IV-1.6a) in the
sample withdrawn immediately after the reduction (TOS = 0 h). During the F-T synthesis
(Figure IV-1.6b to IV-1.6e) magnetite and e'-Fe,,C (pseudo-hexagonal iron carbide) w ere
identified in used catalyst.samples. The fraction of magnetite decreased with time (as
evidenced by a decrease in size of a peak at about 28 = 3 3 , while the fraction of &'-carbide
phase increased w ith time on stream (increase in size of a peak at about 28 =43). During the
same period of time, the catalyst activity continued to decline with time on stream (see
Section IV-2.2).
IV- 6

7/28/2019 808495(1).pdf
http://slidepdf.com/reader/full/8084951pdf 76/240
PS400.0
x'100
90
' 80
70
360.0
320.0
2 8 0 , O '
240, O a
200.0'
160.0-
120 O L
80 I O L
40.01
0.0'
d-spacing2.876 2.762 2.f!52 2 , 13 1.fl23 1.768 1.y41 1.434
+ QJ
6(
0(
4c
3c
20
10
Y
Figure IV- .6 Changes in bulk iron phases with time on stream during run SB-2145 with catalyst C (100 Fe/3 Cd4 W16 SiO,,
batch-4): (A ) TOS=0 h; (B ) TOS = 67 h; (C) TOS = 145 h; (D) TOS = 213 h and (E)TOS = 401 h.
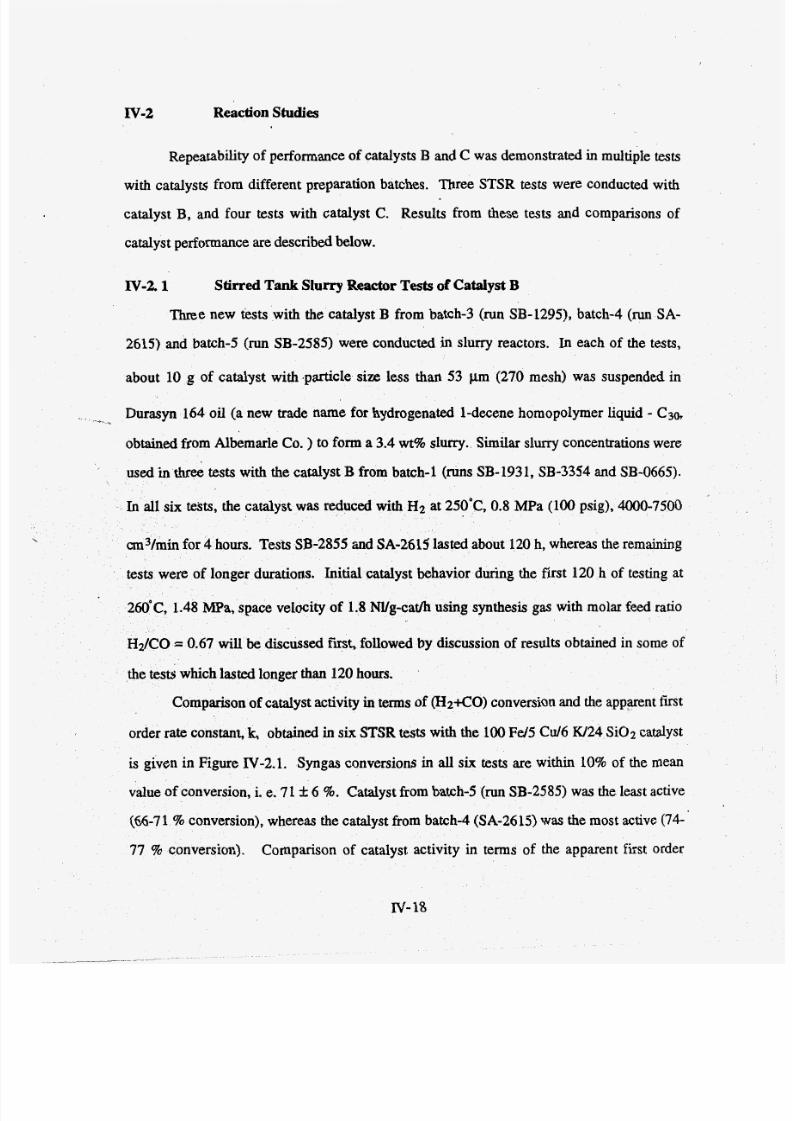
7/28/2019 808495(1).pdf
http://slidepdf.com/reader/full/8084951pdf 77/240
IV-2 Reaction Studies
Repeatability of performan ce of catalysts B and C was demonstrated in multiple tests
with catalysts from different preparation batches. Three STSR tests were conducted with
catalyst B, and four tests with catalyst C. Res ults from these tests and comparisons of
catalyst performance are described below.
N-2.1 Stirred Tank Slurry Reactor Tests of CatalystB
Three new tests with the catalyst B from batch-3 (run SB-1295), batch-4 (run SA -
2615) and batch-5 (run SB-2585) were conducted in slurry reactors. In each of the tests,
about 10 g of catalyst with .particle size less than 53 pm (270 mesh) was suspended in
Durasyn 164 oil (a new trade name fo r hydrogenated 1-d ecene homo polymer liquid - (230,
obtained from Albemarle Co. ) to form a 3.4 wt% slurry. Similar slun y concentrations were
used in three ests with the catalyst B from batch-1 (runs SB-1931, SB-3354 and SB-0665).
In all si x t e h t s , the catalyst was ed with H2 at 250'C, 0.8 MPa (100 psig), 4000-7500
in fo r 4 hours. Tests SB-2855 and SA-2615 lasted about 120 h, whereas the remaining
tests were of longer durations. Initial catalyst behavior during the first 120 h of testing at
260°C, 1.48 MPa, spac e velocity of 1.8 M lg-cat/h using synthesis gas with molar feed ratio
H2K.O = 0.67 willbe discussed first, followed by discussion of results obtained in some of
the testswhich lasted longer than 120 hours.
Comparison of catalyst activity in terms of (H2+CO)conversion and the a p p p n t fmt
order rate constant,k, obtained in sixSTSR testswith the 100 F 4 5 C d 6 W2 4 S i0 2 catalyst
is given in Figure IV-2.1. Syngas conversions in all six tests are w ithin 10%of the mean
value of conversion, i. e. 71 -1: 6 %. Catalyst from batch-5 (runSB-2585) was the least active
(66-7 1 % conversion), whereas the catalyst from ba tc h4 (SA-2615) was he most active (74-
77 % conversion). Comparison of catalyst activity in terms of the apparent first order
Iv- 8
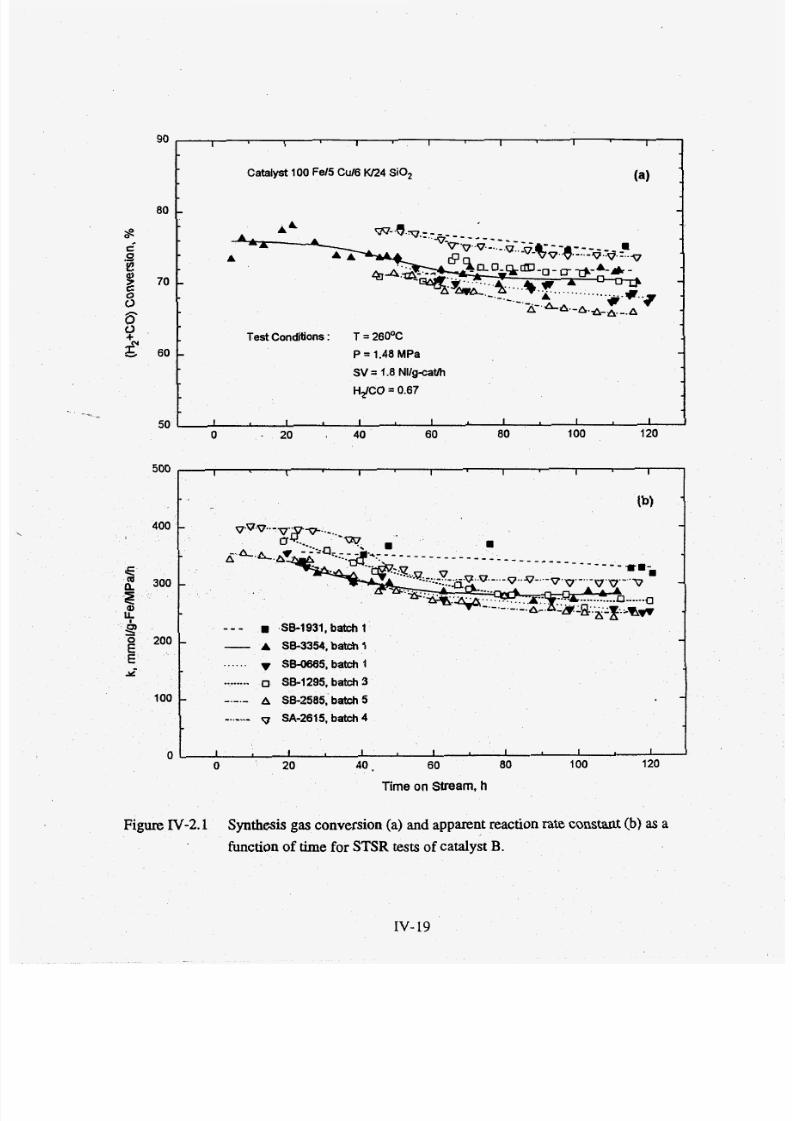
7/28/2019 808495(1).pdf
http://slidepdf.com/reader/full/8084951pdf 78/240
90
80
8e
9 70
0
2
sa+N
c
0
60
50
I I 1 I 1 I I
catalyst 100 Fel5 CuI6 w24 SiO, (a )
- -
- -
Test Conditions : T = 260°C
- P = 1.48 MPa
SV = 1.8 Nllg-cath
HdCO = 0.67
-
I I I I I I I
0 . 20
Figure N-2.1 Synthesisgas conversion (a) and apparent reaction rate constant (b) as a
function of time for STSR tests of catalyst B.
500
400
' 00
s9
z 200
Ex-
100
0 .
IV - 19
.I I I I I I I
(b)
- -
- - - - - - - _ _ _ _ _- - - - - - - _ _- -
- - - rn S E l 9 3 1 , b a t c h l- SE3354,batchl -...... SEO685,batchl
._._-... SB-1295, batch 3
-
- -.-.- A SB-2585,batch5 --..-.._ v SA-2615, batch4
I I I I I I I
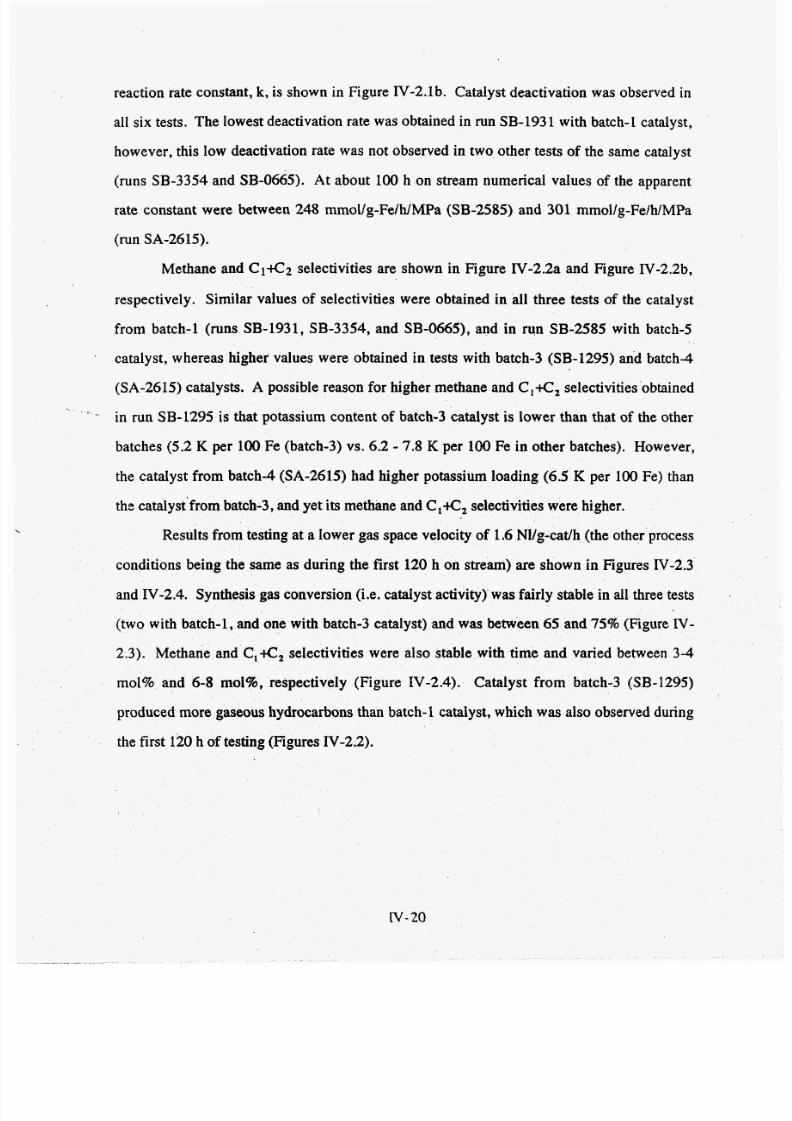
7/28/2019 808495(1).pdf
http://slidepdf.com/reader/full/8084951pdf 79/240
reaction rate constant, k, s shown in Figure IV-2.lb. Catalyst deactivation was observed in
all six tests. Th e lowest deactivation rate was obtained in run SB-1931 with batch-1 catalyst,
however, this low deactivation rate was not observed in two other tests of the same catalyst
(runs SB-3354 and SB-0665). At about 100 h on stream numerical values of the apparentrate constant were between 248 mmol/g-Fe/NMPa (SB-2585) and 301 mmollg-FelhlMPa
(run SA-2615).
Methane and C1+C2 selectivities are shown in Figure IV-2.2a and Figure IV-2.2b,
respectively. Similar values of selectivities were obtained in all th ree tests of the catalyst
from batch-1 (runs SB-1931, SB-3354, and SB-0665), and in run SB-2585 with batch-5
catalyst, whereas higher values were obtained in tests with batch-3 (SB-1295) and b at ch 4
(SA-26 15) catalysts. A possible reason for higher methane and C,+C,electivities obtained
in run SB-1295 is that potassium content of batch-3 catalyst is lower than that of the other
'
batches (5.2 K per 100 Fe (batch-3) vs. 6.2 - 7.8 K per 100 Fe in other batches). However,
the catalyst from b at ch 4 (SA-2615) had higher potassium loading (6.5 K per 100 Fe) than
the catalyst'from batch-3, and yet its methane and C,&, selectivities were higher.
Results from testing at a lower gas space velocity of 1.6 Nl/g-cat/h (the other process
conditions being the same as during the first 12 0 h on stream) are show n in Figures IV-2.3
and IV-2.4. Syn thesis gas conversion (Le. catalyst activity ) was fairly stable in all three tests
(two with batch-1, and o ne with batch-3 catalyst) and was between 65 and 75% (Figure IV-
2.3). Methane and C,+C, electivities were also stable with time and varied between 3-4
mol% and 6-8 mol%, respectively (Figure IV-2.4). Catalyst fro m batch-3 (SB-1295)
produced more gaseous hydrocarbons than batch-1 catalyst, which was also observed during
the first 12 0 h of testing (Figures IV-2.2).
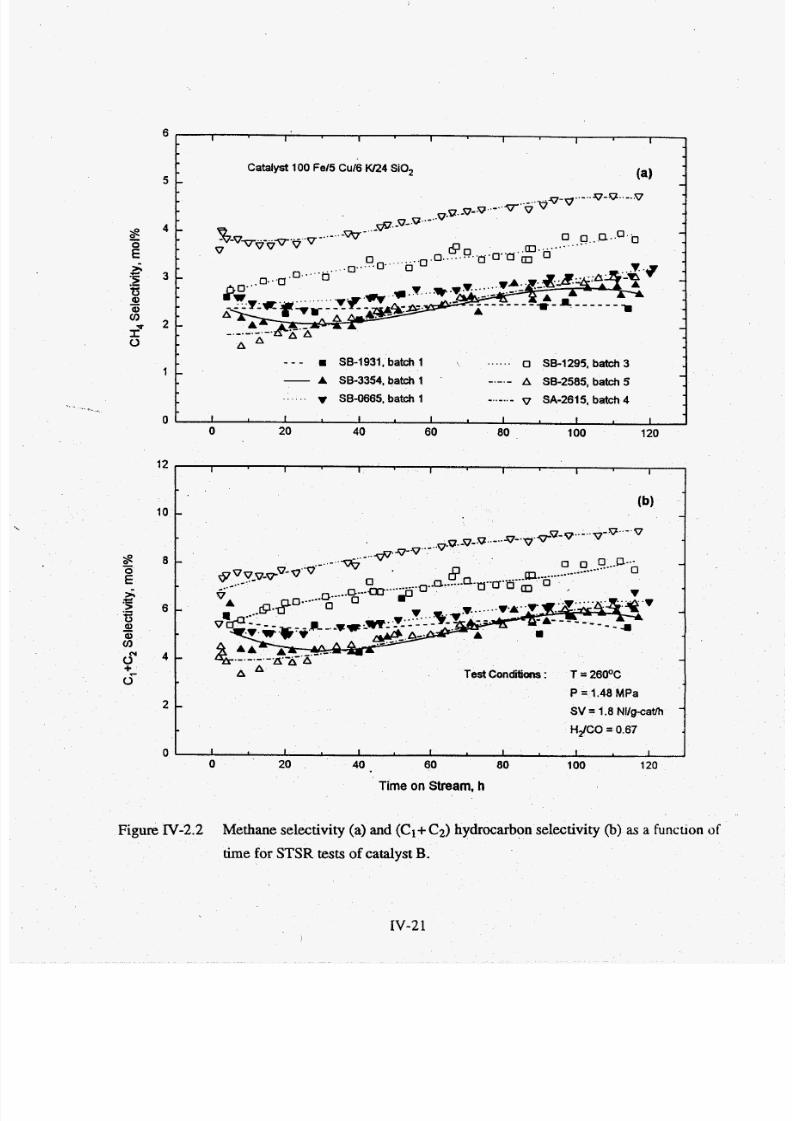
7/28/2019 808495(1).pdf
http://slidepdf.com/reader/full/8084951pdf 80/240
5 . -
I I I I I I I
(a)atalyst 100 Fe/5 Cu16 w24 SiO,
-
L
I SB-1931. batch 1 ...... (3 SB-1295, batch 3- -
--._._ A SB-2585, batch 51 - - 88-3354. batch 1
. . v S8-0665, batch 1 -..-.._v SA-2615, bat& 4a .
0 1 I I I I I I
Figure IV-2.2 Methane selectivity (a) and (C1+ 2)hydrocarbon selectivity (b) as a funcuon of
time For STSR tests of catalyst B.
10
IV-2 1
I I I I I I I 1
(b)- -
12
-
-
-Test Conditions : T = 2 6 0 0 ~
P = 1.48 MPa
s V = 1.8 Nllg-cath -HdCO= 0.67
100
2 -
0 I I I I I I I
12020 40 60 80
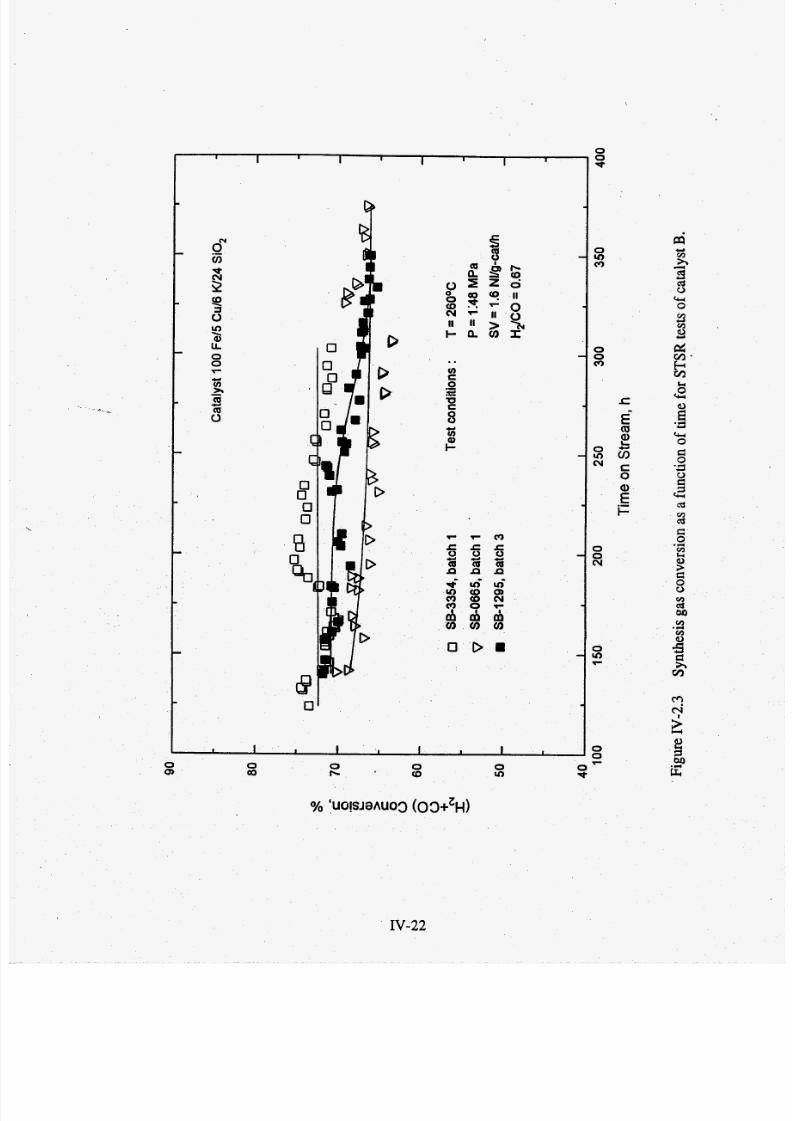
7/28/2019 808495(1).pdf
http://slidepdf.com/reader/full/8084951pdf 81/240
I I II I I I I I
0
0r
F
c
0000
0
'lbI
II
I-
..
0
s3$ 6
0 0Q, QJ
0b
0u)
0In
0
0*
0
v)
(v
0v)r
IV-22
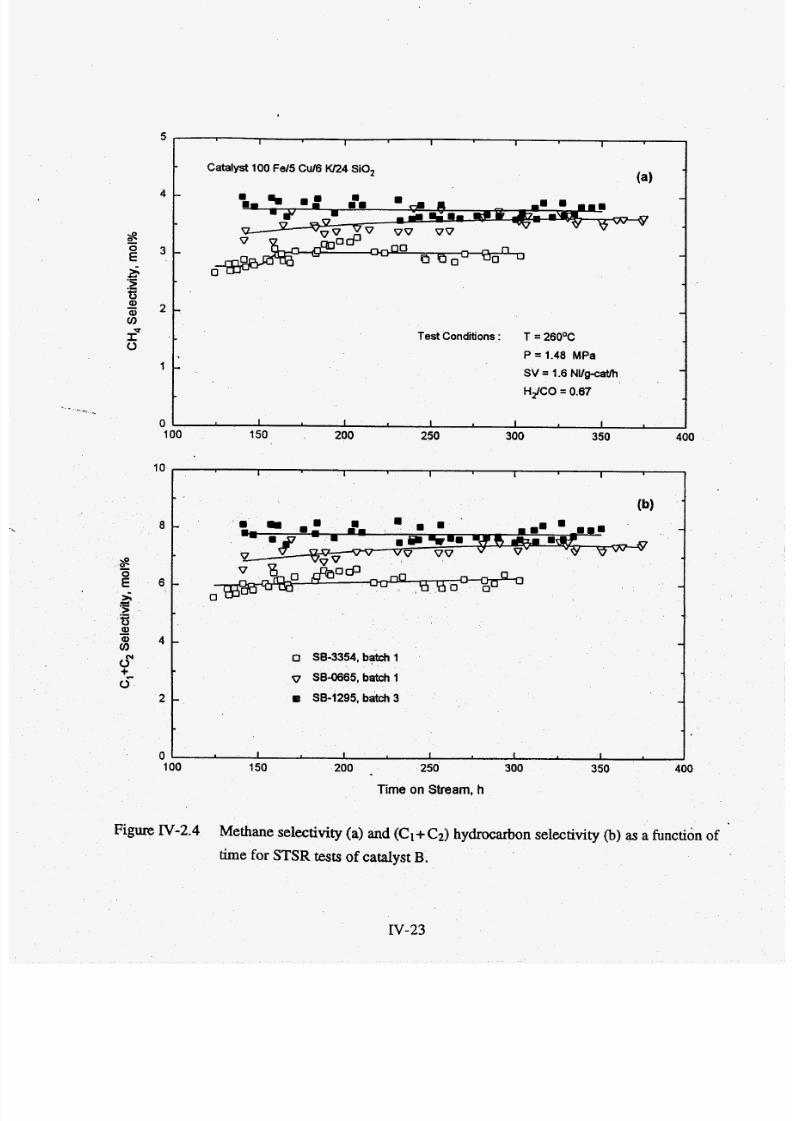
7/28/2019 808495(1).pdf
http://slidepdf.com/reader/full/8084951pdf 82/240
5 .
4 -
3 -
2 -
1 -
0
Test Conditions: T = 26OOC
P = 1.48 MPa
SV = 1.6 NW&
HdCO = 0.67
I I I I I
(a)
Catalyst 100 Fe/5 Cu16 K124 SiO,
-
-
-
-
I I 1 I I
10
8 -
6 -
4 -
2 -
0 '
O SB-3354, b+h 1
v SB4665,batchl
B SB-1295, batch 3
-I I I I I
(b)
' 8 . ' -
vn . u n
U Y I o a" -0
-
-
I I I I I
Figure N-2.4 Methane selectivity (a) and (C1+ 2)hydrocarbon selectivity (b) as a function of
time for STSR tests of catalyst B.
IV-23

7/28/2019 808495(1).pdf
http://slidepdf.com/reader/full/8084951pdf 83/240
.
. . .Hvdrocarbon Product nrstnbutlon
Lumped hydrocarbon distribution, activity parameters and product yields during the
first 120 hours of testing of catalyst B from four preparation batches are shown in Table IV-
2.1. In runs SB-3354 (batch-1 catalyst) and SB-2585 (batch-5 catalyst) methane and gaseous
hydrocarbon (C,C,) selectivities were lower than in other tests. Gaso line fraction (C5C,,
hydrocarbons) was about 22% of total hydrocarbons, and diesel fraction (C,,-C
hydrocarbons) varied from 14 to 22%.
Olefin selectivities in tests with catalysts from batches 3-5 were similar to those
obtained in tests with batch-1 catalyst (runs SB-1931, SB-3354 and SB-0065). Total olefin
content and 2-olefin content dependence on carbon number for three tests with batch-]catalyst were shown previously in Figure m-2.5.
Iv-2.2 StirredTank Slurry Reactor Testsof CatalystC
About 10 g (runs SB-2695, SA-2715 and SA-1665) or 30 g (in run SB-2145) of
catalyst C together with Durasyn 164 oil was loaded to a slurry reactor, so that the slurry
concentration was about 3.4 wt% in tests SB-2695 (batch-2 catalyst), SA-2715 (batch-3
catalyst) and SA-1665 (batch-4 catalyst) and about 9.7 wt% in run SB-2145 (batch-4
catalyst). Similar slurry concentrations (2.3-7 wt%) were used in three tests with the catalyst
C fr6m batch-1 (runs SB-0261, SB-0045 and SA-0075). Pretreatment conditions (H2 at
240"C, 0.8 MPa, 7500 cm3/min for 2 h) were the same in all tests. Results obtained during
the first 120 h of testing at 260'C, 1.48 MPa, 1.4 NYg-cat/h using synthesis gas with molar
feed ratio H2/CO = 0.67 are discussed first, follow ed by discussion of results obtained in
some of the tests which lasted longer than 120 hours.
Catalyst activity was similar in all seven tests. For example, syngas conversions
(Figure IV-2.5a) were between 78 and 84 % (i.e., 81f %), whereas values of the apparent
reaction rate constan t (Figure N- 2.5 b) were between 225 and 290 mrnoVg-Fe/h/MPa (mean
value of abou t 250 rnmoYg-Fe/NMPa).
IV- 4
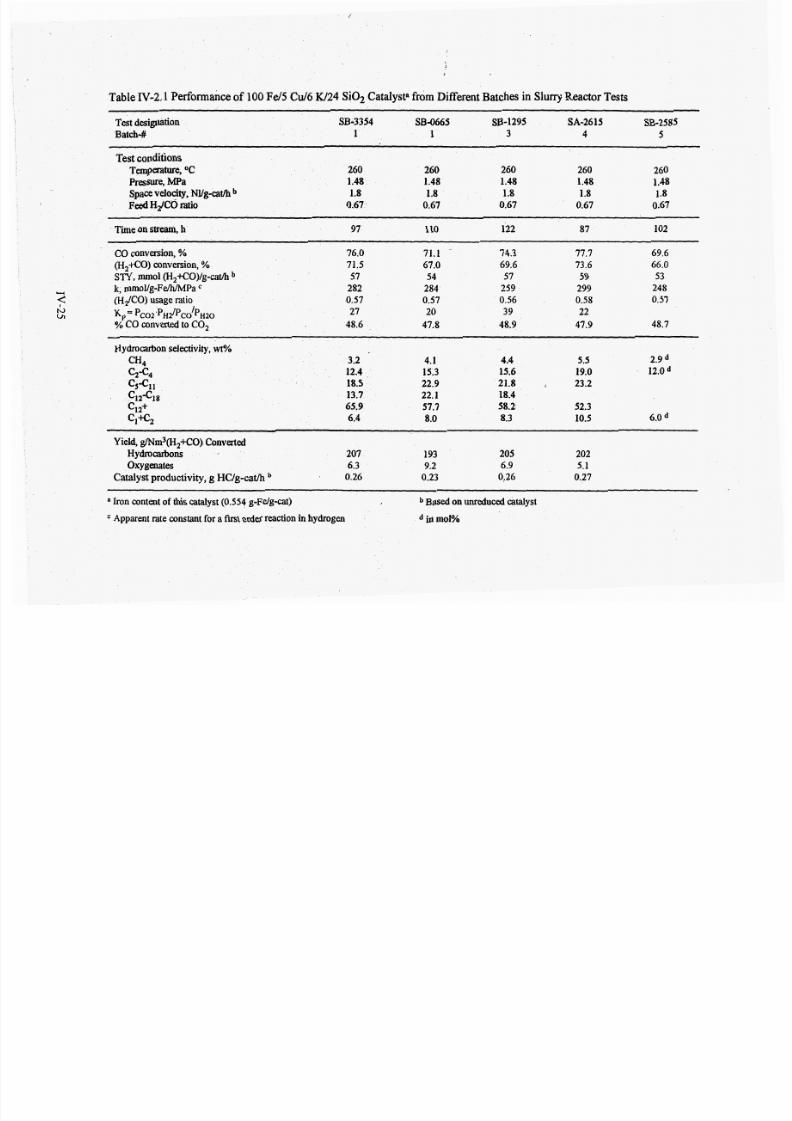
7/28/2019 808495(1).pdf
http://slidepdf.com/reader/full/8084951pdf 84/240
Table IV-2.1 Performance of 100Fe/5 C d 6 W24 i 02 CatalystafromDifferent Batches in Slurry Reactor Tests
Test designation SB-3354 SB-0665 SB-1295 SA-2615 SB-2585
Batch4 1 1 3 4 5
Test conditionsTemperature, OC 260 260 260 260 260
Presswe, MPa 1.48 1.48 1.48 1.48 1.48
Spacevelocity, NYg-cath b 1.8 1.8 1.8 1.8 1.8FeedHgCO mtio 0.67 0.67 0.67 0.67 0.67
Time on stream, h 97 110 122 87 102
CO conversion, % 76.0 71.1 I 74.3 77.7 69.6
(H,+CO) conversion, % 71.5 67.0 69.6 73.6 66.0
H k,mmoYg-Fefl/MPa 282 284 259 299 248
<: (HiCO) sage ratio 0.57 0.57 0.56 0.58 0.57
% CO converted o CO , 48.6 47.8 48.9 47.9 48.7
Hydrocarbon selectivity,wt%
STY,m o l H,+cO)/g-cat/h b 57 54 57 59 53
h)I K, = pc02~pHz/pc0’pH2* 27 20 39 22
CH4 3.2 4.1 4.4 5.5 2.912.4 15.3 15.6 19.0 12.0 d
1 18.5 22.9 21.8 I 23.2c12-c18 13.7 22.1 18.4
c12+ 65.9 57.7 58.2 52.3
c1*2 6.4 8.0 8.3 10.5 6.0
Yield, g/Nrn3(~,+CO) Converted
H y d r o d o n s 207 193 205 202oxygenates 6.3 9.2 6.9 5.1
Catalyst productivity, g HCJg-cath 0.26 0.23 0:26 0.27
a Iron contentof t h i s catalyst (0.554 g-Fdg-cat) Based on unreduced catalyst
Apparent rate constant for a first order reaction in hydrogen d inmol%
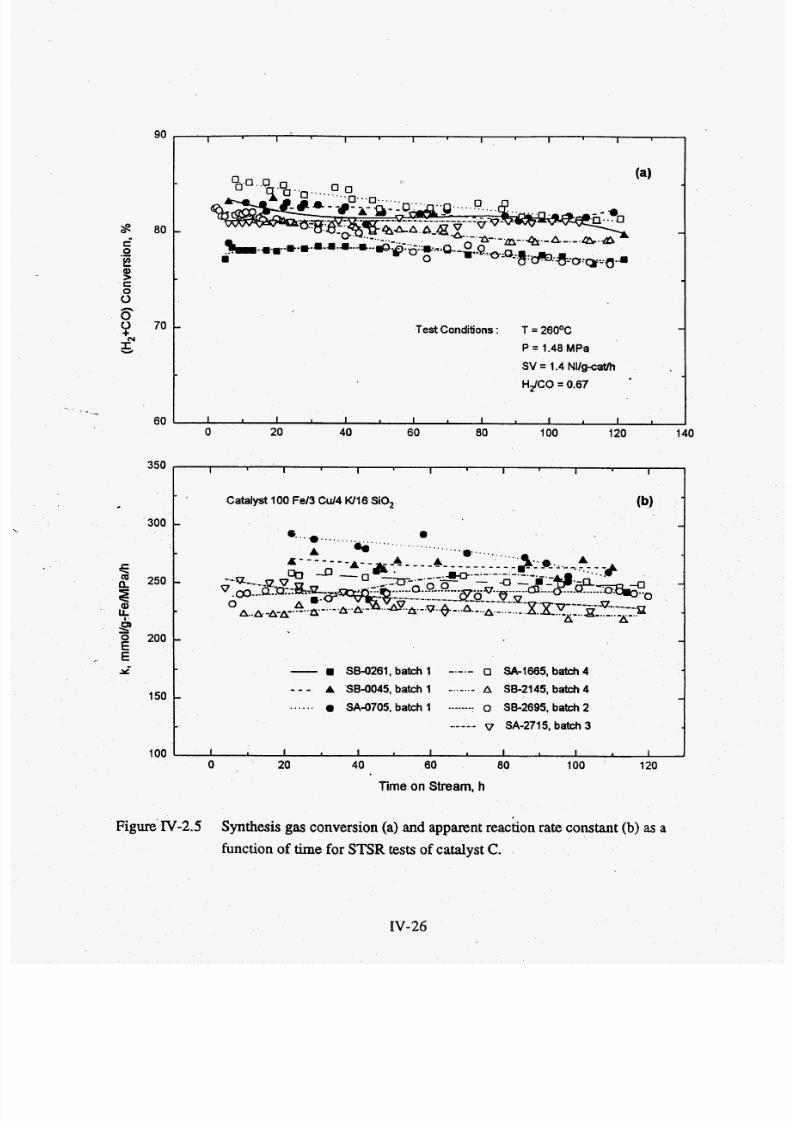
7/28/2019 808495(1).pdf
http://slidepdf.com/reader/full/8084951pdf 85/240
90I I I I I I I
300
250
200
150
70t-
-
-
-
Test Conditions: T = 26OOC
P = 1.48 MPa
SV = 1.4 Nllg-caUhH2CO = 0.67
. <
60 I I I I I I I I0 20 40 60 80 100 120 140
350I I I I I I I
100 I I I I I I I I0 20 40 60 80 100 120
Time on Stream, h
Figure'IV-2.5 Synthesis gas conversion (a) and apparent reaction rate constant (b) as a
function of time for STSR tests of catalyst C.
fBF4 9 E
, EJ
Catalyst 100 Fe13Cd 4 W16 SiO, (b) 1 =... -
A
1 - SB-0261, batch 1 -.-.- O SA-I665,batch4
- _ - A SB-0045,batch 1 A SB-2145, batdl 4
...... 0 SA-0705, batch 1 ------.- SB-2695.batch2
-.-- _.- v SA-2715, batch 3
IV-26
7/28/2019 808495(1).pdf
http://slidepdf.com/reader/full/8084951pdf 86/240
Methane (Figure IV-2.6a) and C ,+C, selectivities (Figure IV-2.6b) were also similar
in all seven tests. At about 100h on stream , the mean value of m ethane selectiv ity from all
seven tests is 2.6 %, whereas the minimum value is 2.1 % (SA-2715) and maximum 3.1 %
(runs SB-2145 and SA-0705). Also, the mean value of C,+C, selectivity at about 100 h on
stream is 5.7 %, whereas the minimum and the m aximum are: 4.8 % (SA-2715) and 6.5 %
(SA-07 05), respectively. Lower methane and gaseous hydrocarbon selectivities obtained in
tests with catalysts from batches 1-3, in comparison to the catalyst from batch-4, are
cons istent with h igher potassium loading of these catalysts.
High syngas conversions and low gaseous hydrocarbon selectivities were
obtained after 1 20 h on stream in tests which lasted 400-520 hours (Figures IV-2.7 and IV-
2.8). Cataly st from batch-4 (runs SB-2145 and SA-1665) eactivated more rapidly than the
* - * catalyst from batch-1 (runs SB-0045 and SA -0075). Methane selectivity was between 2.5
and 3.5 mol% in all four tests, and C,+C , selectivity varied between 5.5 and 7 mol% (Figure
IV-2.8).
. . .Hvdrocarbon Product Distnbub oq
Lum ped hydrocarbon distribution, activity parameters and product yields during the
f i s t 1 20 hours of testing of catalyst C from fo ur preparation batches are shown in Table IV-
2.2. Methane and gaseous hydrocarbon (C,-C,) selectiv ities were low in a l l seven tests, and
the fraction of liquid plus wax hydrocarbo ns (C,+ hydrocarbons) was greater than 85% of
total hydrocarbons produced. Gasoline fraction (C,-C,, hydrocarbons) was about 10-18% of
total hydrocarbons, and d iesel fraction (Clz-C18 ydrocarbons) varied from 15 to 18%. The
amou nt of wax produced was significant in all tests, and yields of oxygenates were small.
Olefin selectivities in tests with catalysts from batches 2-4 were similar to those
obtained in tests with batch-1 catalyst (runs SB-0261, SB-0045 and SA-0705). Total olefin
content and 2-olefin content dependence on carbon number for three tests with batch-1
catalyst were shown previously in Figure III-2.10.
IV-27

7/28/2019 808495(1).pdf
http://slidepdf.com/reader/full/8084951pdf 87/240
4I I I I I I I
3 -
g
:.- 2 -
-.-
8 I
1 -
t
a SA-1665, batch4B-0261, batch 1 -.-.-
A SB-0045, batch 1 -..-..- A SE2145,batch4
-- - -
Catalyst 100 Fe13 Cul4 W16 SiO,
I 1 I 1 I I I
L J
. 0 SA-0705, batch 1 .------- S52695,batch2
_ _ _ _ - SA-2715, batch 3 t v1 I I I I I I I
0 20 40 60 80 100 120 140
Test Conditions: T = 260%
P = 1.48 MPa
8 HdCO = 0.67
sv= 1.4Nugcatlh
&" . " * 7"""" "" .#"
Time on Stream, h
Figure IV-2.6 Methane selectivity (a) and (Cl+ ,) hydrocarbon selectivity (b) as a function of
time for STSR tests of catalyst C .
IV-28

7/28/2019 808495(1).pdf
http://slidepdf.com/reader/full/8084951pdf 88/240
90
80
0v).-E .8
Y1-
C
s 0
Y
50
40
I I I I I I I I I I 1 I I I I1 1
Catalyst 100 Fe/3 Cu/4 K/16 SiO,
SB-0045, batch 1
A 1.48 MP a, 1.4 NVg-cam SA-1665, batch 4
v 2.17 MPa, 2.0 NVg-cam X 1.48 MPa , 1.4 NVg-cam
SA-0705, batch 1 + 2.17 M Pa, 2.0 NUg-cam
m 1.48 MPa, 1.4 NVg-cam
+ 2.17 MPa, 2.0 NI/g-cat/h 0 1.48 MPa , 1.4 Nl/g-cam
SB-2145, batch 4
I I I I 1 I 1 I I I I I I I 1 I I
100 15 0 200 250 300 350 400 450 500 550
Time on Stream, h
Figure IV-2.7 Synthesis gas conversion as a function of time for STSR tests of catalyst C.

7/28/2019 808495(1).pdf
http://slidepdf.com/reader/full/8084951pdf 89/240
4 I I I I I I I I I
3 -
8
d'5 2
8
2
-.-
r1 -
0
-
- -
Catalyst 100 Fel3 CU14 W16 SiO, Test Conditions: T = 26OOC
P = 1.48 - 2.17 MPa . -SV = 1.4 - 2.0 NW~at lh
HdCO = 0.67
I I I I I I 1 I
I I ' 0 1 I I 1 I
S8-0045, batch 1
A 1.48 MPa,l.4 Nllg-cath
v 2.17 MPa, 2.0 NWg-caVh
SA-0705, batch 1,
1.48 MPa, 1.4 NIlg-cath
2.14 MP a, 2.0 Nllgcatlh
SA-1665, batch 4
x 1.48 MPa , 1.4 NU
+ 217 MPa, 2.0 Nllpcatlh
SB-2145, batch 4
o I 48 MPa, 1.4 NU
2 1 I I I I I I I I
I100 150 200 250 300 350 400 450 500 550
' Time on Stream, h
Figure IV-2.8 Methane selectivity (a) and (C,+Cz) hydrocarbon se lectivity (b) as a function of
time for STSR tests of catalystC.
IV- 30

7/28/2019 808495(1).pdf
http://slidepdf.com/reader/full/8084951pdf 90/240
Tw?
Table IV-2.2 Performance of 100F d 3 C d 4 W16 Si02 Catalyst“from Differen t Batches in Slurry Reactor Tests
SA-1665 SB-2145est designation SB-0261 SB-0045 SA-0705 SB-2695 SA-2715
Batch# . 1 1 1 2 3 4 4
Test conditionsTemperature,OC 260 260 260 260 260 260 260
Pressure, MPa 1.48 1.48 1.48 1.48 1.48 1.48 1.48
spacevelocity,Nug-catm 1.4 1.4 1.4 1.4 1.4 1.4 1.4FeedHdCO ratio 0.67 0.67 0.67 0.67 0.67 0.67 0.67
Time on stream, h 92 95 88 98 88 112 40
CO conversion, % 87.4 87.1 87.5 83.3 87.2 84,l 82.2
77.6 81.6 79.0 77.2
50 49 48
(H,+CO) conversion, % 81.4 81.0 81.4
STY, mmol (~,+Co)/g-cat/h 50 51 51 49
k,mmoVg-Fe/NMPa 251 254 256 218 240 248 22 2(HiCO) usage ratio 0.57 0.55 0.55 0.55 0.55 0.57 0.56
$ pC02’pH 2/ pC0~pH 20% CO converted to CO, 49.2 49.8 48.9 49.1 48.5 48.9 48.4
24 41 36 38 33 37
~~
Hydrocarbonselectivity,wto/o2.7 2.7 3.5 2.2 d 2.4 3.2 3.1
11.3 10.4 12.5 10.8 9.3 12.3 11.9
14.0 13.2 12.3 10.1 12.0 17.717.9 14.870.7 73.5 67.6 78.2 72.6 . 67.3
5.2 5.7 7.1 5.1 5.2 6.5 6.2
CH4
q - C 4
CSCll
c12+
Cl%
c12-C18
Yield, gMm3(H2+C0)ConvertHydrocarbons 197 98 203 201 204 198
Oxygenates 2.2 2.5 2.6 2.5 2.4 3.9
Catalyst productivity, g HC/g-cat/h 0.22 0.23 0.23 0.22 0.22 0.21
* Iron amtent of this catalyst (0.597 g-Fdg-cat) Based on unreduced catalyst
Appilruil mc consml for a first order reaction in hydrogen in mol%
7/28/2019 808495(1).pdf
http://slidepdf.com/reader/full/8084951pdf 91/240
Con cludiw Remarks on Tests o Cat&ws B a d C from Diffe ent Batches
In general, catalysts from different preparation batches had similar performance
(activity and selectivity) and reproducibility of catalyst preparation p rocedure is regarded as
satisfactory.Table IV-2.3 summarizes performance of catalysts B and C, and precipitated iron
catalysts (Fe-Cu-K) used in Mobil’s slurry bubble column reactor and Rheinpreussen’s
demonstration plant unit. The latter two studies are regarded as the most successful
exam ples of the slurry reactor performance. Process conditions in alltests were similar, with
the exception of the use of higher reaction pressure (2.17MPa) during later periods of two
tests with catalyst C.
In Mobil’s runCT-256-13 t synthesis gas conversion of 82%, methane and C1+C2
-_ selectivities w ere 2.7 nd 5.6 wt%, respectively, whereas the catalyst productivity was0.39
HC/g-Fe/h.n Rheinpreu ssen’s demonstration plant unit the C l+Czselectivity was 6.8% at
synthesis gas con version of 89%,and the ca talyst productivity was0.49 HC/g-Feh.
.
Syngas conversions, methane and C1+C2 electivities obtained in tests with catalysts
B and C were similar to those obtained in two tests conducted in slurry bubble column
reactors. How ever, the ca talyst ,productivity in two tests with catalyst C, at 2.17 MPa, was
even higher (0.53 r 0.60 g Hug-Fe/h) than that obtained in Rheinpreussen ’s test (0.49
-Fek), whereas at the reaction pressure of 1.48MPa the ca talyst productivity of our
sts B an d C (0.38-0.42Hag -Felh) was similar o that obtained in Mobil‘s study (0.39
g-Fe/h). Due to complete reactor backm ixing in our experiments (stirred tank reactor)
be expected that the catalyst produc tivity lmder the sam e process conditions would be
gherin
a reactor with partial fluid mixing (e.g.’ bubble colum n slurry reactor).
IV-32

7/28/2019 808495(1).pdf
http://slidepdf.com/reader/full/8084951pdf 92/240
,
Table IV-2.3 Catalyst Performance in Slurry Reactor Tests
Catalyst designationRun D
C (batch-1) c (batch-4) Mobila Rheinpreussena(batch-1) B (batch-3)
CT-256-13 K6lbel et al.Kuo (1985) (1955)
SB-3354 SB-1295 SB-0045 SA -1665
Test conditions
Temperature, OCPressure, MPa
Spacevelocity, NVg-Feh
Feed HdCO ratio
Time on stream, h
(H2+C0) conversion,%(HdCO) usageratio
Hydrocarbon electivites,wt%
CH4
cs-c,c12+
Cl%
c2-c4
Yields
Nm3/kg-Fe/h
g HC/Nm3(H2+C)
g q+mm3(H2+c)g Hug-Feh
3.5
12.9
19.2
64.4
6.9
.
2601.48
3.2
0.67
288
74
0.57
2601.48
2.9
0.67
243
70.4
0.56
4.5
16.3
22.9
56.2
8.9
2.0 2.0
206 199
192 181
0.42 0.40
260 .2601.48 2.17
2.3 3.4
0.67 0.67
215 336
80.8 79.9
0.56 0.57
2.9 2.6
10.4 10.7
14.0 14.5
72.8 72.3
5.9 5.7
1.9 2.7
207 203
195 191
0.40 0.60
2601.48
2.3
0.67
220
78.5
0.56
3.2
12.2
12.8
71.9
6.6
1.8
205
191
0.38
2602.17
3.4
0.67
361
75.8
0.58
3 O
13.7
12.7
70.5
6.8
2.6
205
191
0.53
2571.48
2.3
0.73
475
82
0.59
2.7
11.1
18.1
68.1
5.6
1.9
206
195
0.39
2681.20
3.1
0.67
89
0.63
3.2b
31.3
53.6
11.9
6.8
2.8
178
166
0.49
a Slurry bubble column reactor est.
CH, +C,H,

7/28/2019 808495(1).pdf
http://slidepdf.com/reader/full/8084951pdf 93/240
Iv-3 References
Bdcur, D. B., 1994, Development of improved iron Fischer-Tropsch catalys ts, Final report
prepared for DOE Contract No. DE-AC22-89PC89868, Texas A& M Research
Foundation, C ollege Station, Texas.
Huff, G. A.; Jr. and Satterfield, C. N. Evidence for Two Chain Growth Probabilities on Iron
Catalyst in the Fischer-Tropsch Synthesis. J. Catal., 1984,85,370-379
Kolbel, H., Ackerm an, P. and Engelhardt, F., 1955, New developm ents in hydrocarbon
synthesis. Proc. Fourth World Petroleum Congress, Section IVK, pp. 227-247. Carlo
Colom bo Publishers, Rome.
Kuo, J. C. VI., 1985, Two stage process for conversion of synthesis gas to high qualitytransportation fuels. Final report prepared for DOE Contract No. DE-AC22-
83PC 600019, Mobil Research and Development Corp., P aulsboro, NJ.
Iv- 4
7/28/2019 808495(1).pdf
http://slidepdf.com/reader/full/8084951pdf 94/240
V The Effect of Source of Potassium and Basic Oxide Promoter
Th e objective of this task is to determine effects of two different sources of potassium
and addition of another promoter on performance of catalysts B an d C. In o ur standard
catalyst preparation procedure silicon oxide is introduced by addition of a dilute potassium
silicate (K 2Si03 )solution to the irodc opp er precipitate. This procedure introduces potassium
in the excess of the desired amount. Potassium is completely removed by washing of the
_ _
precipitate. Addition of the desired amount of potassium promoter is accomplished via
"incipient wetness" method, using KHCOBdissolved in water. An obvious alternative to the
above procedure is to utilize potassium from K2Si03 as the source of potassium, i.e.
discontinue with washing when the residual amount of potassium equals the desired amount
' - of promoter. Catalysts B an d C were synthesized using potassium silicate as the source of
the potassium promoter, and performance of these catalysts was compared with those
synthesized using our usual procedure (Section IV-2).I
In many of the older German preparation procedures basic oxides such as: MnO,
MgO and CaO were used as promoters (Anderson, 1956). In particular, calcium oxide was
used as a standard promoter in Ruhrchemie catalysts, and Kolbel stated that C aO increases
catalyst activity and possibly causes the increase in molecular weight of the product
(Anderson, 1956; p.133). The effect of Ca O promotion on the performance of catalysts B
and C (two levels of promotion per catalyst) was investigated in this task. Synthesized
catalysts w ere characterized (Section IV-I) nd tested first in a fmed bed reactor, and the two
most promising catalyst formulations were tested in the STSR (Section IV-2).
V-1 Catalyst CharacterizationStudies
Six new catalysts (four containing CaO as a promoter, and two using potassium
silicate solution as the source of potassium promoter) were synthesized. Th e synthesized
catalyst were characterized by atomic absorption spectroscopy (AAS), BET surface area
v- 1
7/28/2019 808495(1).pdf
http://slidepdf.com/reader/full/8084951pdf 95/240
J(SA) and pore size distribution (PSD) measurements, and reduction behavior under
temperature programmed and isothermal conditions.
E
The CaO containing catalysts were prepared by impregnation of Fe-Cu-SiO,
precursor from batch-3. Fo r catalyst C series (100 Fe/3 C d 4 Wx C d1 6 SiO,) the copper
(2.9-3.2 pbw of Cu per 100pbw of Fe), and calcium (2.2 and 6.3 pbw of Ca per 100 pbw of
Fe) contents are close to the nominal amounts (Table V-1.1). Their potassium (4.6-4.8 pbw
of K per 100 pbw of Fe) and silica (17-22 pbw of SiO, per 100 pbw of Fe) contents are
slightly higher than the nominal compositions. Similarly, fo r catalyst B series (100 Fe/5
Cu/6 Wx C d 2 4 SiO,) the copper, potassium and calcium contents are close to the nominal
values but the silica content is higher’ than the co rresponding nominal am ount (24 pbw of
SiO, per 100pbw of Fe).
Catalysts C (S3416-4-K) and B (S5624-5-K) were prepared from Fe-Cu-SiO,
precursors from batch-4 and batch-5, respectively, using potassium silicate as the source of
both potassium an d silicon oxide promoters. The excess potassium w as removed by washing
of the Fe-Cu-SiO, precursors (Appendix 1). Both potassium and silicon oxide contents of
these tw o cata lysts were higher than the Corresponding nominal amounts.
BE T Surface Area and Pore V o h m
I
Surface areas obtained from single-point method are similar to those obtained from
the BET plot (multiple point) method (Table V-1.1). Cata lysts containing 6 pbw of Ca per
100 pbw of Fe (S3416-34 Ca and S 56 24 -3 4 Ca) have surface areas of 73-105 m2/gl an d
those containing 2 pbw of Ca per 100pbw of Fe (S3416-3+2 Ca and S5624-3+2 Ca) have
surface areas between 190 and 221 m2/g, whereas the surface area of the corresponding
catalysts without CaO is about 290 m2/g. The pore volume of the catalysts with 6 parts of Ca
per 100 parts of Fe is 0.26-0.30 cm’/g, whereas the baseline cata lysts B and C have pore
volumes between 0.43 and 0.51 cm3/g. These results show that the addition of calcium
v-2
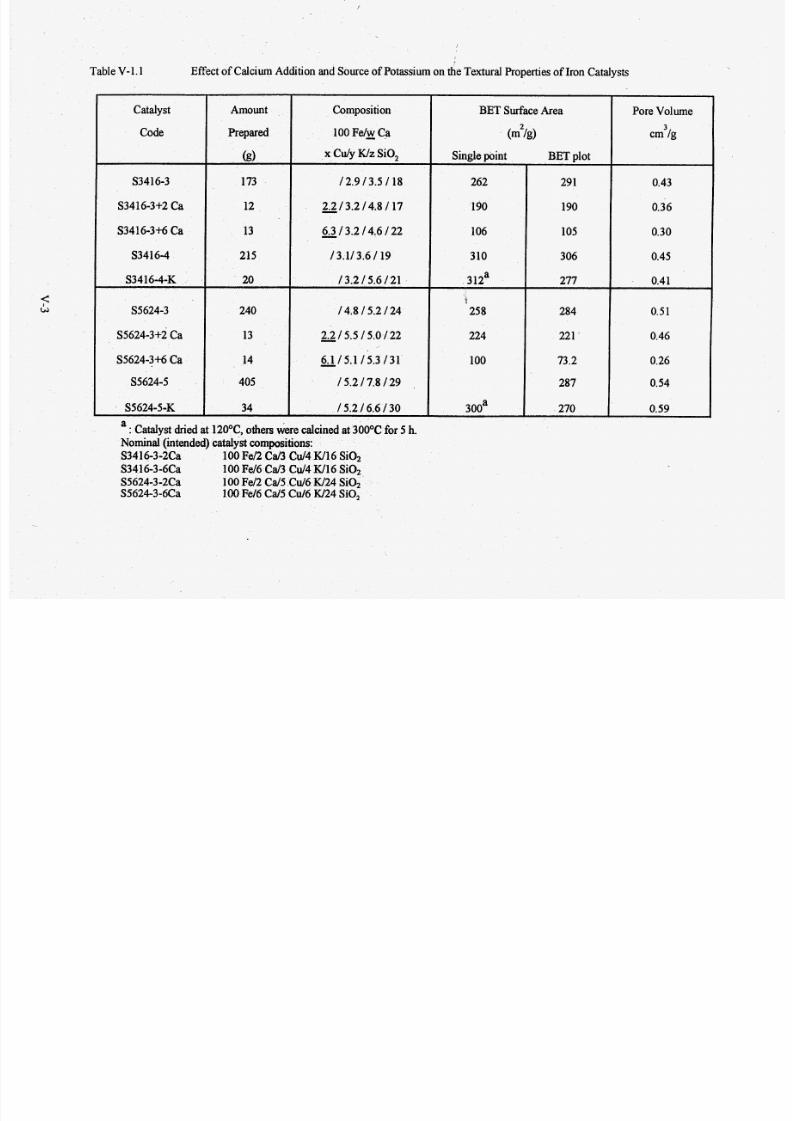
7/28/2019 808495(1).pdf
http://slidepdf.com/reader/full/8084951pdf 96/240
Table V- 1.1 Effect of Calcium Addition and Source of Potassium on the Textural Properties of Iron Catalysts
Catalyst
Code
S3416-3
S3416-3+2 Ca
S3416-36 Ca
S3416-4
S3416-4-K
S5624-3
S5624-3+2 Ca
S5624- 36 Ca
S5624-5
S5624-5-K
Amount
Prepared
(g)
173
12
13
215
20
240
13
14
405
34
Composition
100 FelE Ca
x C dy WzSiO,
12.9 13.5 118
-.2 13.2 14.8 I 17
-.3 13.2 14.6 122
13.113.6 I 19
13.2 15.6 21
14.8 15.2 124
-.2 1 5 . 5 15.0 122
-.1 15.1 15.3 131
I 5.2 17.8 129
15.2 16.6 I 30
: Catalyst dried at 12OoC, others were calcined at 300°C for 5 h.Nominal (intended) catalyst compositions:S3416-3-2CaS3416-3-6CaS5624-3-2CaS5624-3-6Ca
100 Fel2 C d3 Cd4 W16 Si02100 Fel6 C d3 Cd 4 W16 Si02100 Fd 2 Cd 5 Cu/6 W24 SiO,100 Fe/6 Cd5 C d6 W24 SiO,
BET Surface Area
(mZ1g)
Single pbint
262
190
106
310
312a
25 8
224
100
300a
BET plot
291
190
105
306
277
284
221 '
73.2
287
270
Pore Volume
ern lg
0.43
0.36
0.30
0.45
0.41
0.51
0.46
0.26
0.54
0.59

7/28/2019 808495(1).pdf
http://slidepdf.com/reader/full/8084951pdf 97/240
decreases the surface area and pore volume of the baseline catalysts and that this effect is
more pronounced at a higher level of CaO promotion.
Catalysts C (S3416-4-K) and B (S5624-5-K)repared from Fe-Cu-SiO, precursors
from batch-4 and batch-5, respectively, using potassium silicate as the source of both
potassium and silicon oxide promoters, have similar surface areas and pore volumes as the
baseline catalysts C and B prepared by impregnation of Fe-Cu-SiO, precursors with
potassium bicarbonate.
Figures V-l.l(a) and V-l .l(b) show the effect of potassium sou rce on the pore size
distribution (PSD) f catalyst C (batch-4) and catalyst B (batch-5). Pore size distributions of
the catalysts originating from the sam e Fe-Cu-SiO, precursor are similar.
Figure V-1.2 shows the effect of calcium addition on the pore size distribution of
catalysts C an d B. It is found that the addition of calcium oxide promo ter results in a shift
towards larger pores. These results again suggest that the calcium o xide plays significant
role in controlling the catalyst structure and texture.
Reduction B e h a v h
The effect of calcium addition on the reduction behavior of catalyst C (batch-3) is
show n in Figure V-1.3(a). Th e catalyst has two dominant peaks at about 306 and 530°C
cone spondin g to the reduction of Fe,O, to Fe,04 (first stage) and Fe,04 o Fe (second stage),
respectively. With the addition of CaO, both reduction peaks shifted to higher temperatures.
The first reduction peak is located a t about 321OC and the second peak is located at 609°C or
the catalyst with 6 bw of Ca per 100 pbw of Fe. These results indicate that the addition of
calcium retards th e onset of iron reduction for both stages of the reduction, and causes th e
broadening of both reduction peaks.
v-4
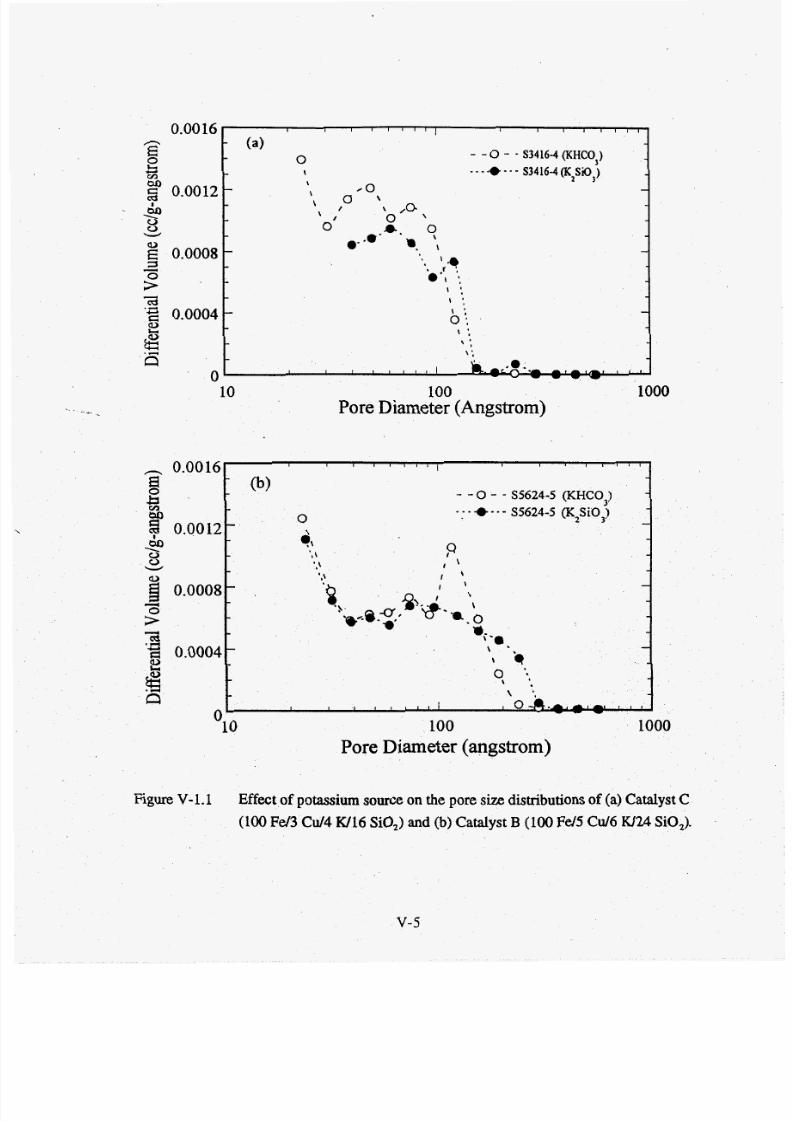
7/28/2019 808495(1).pdf
http://slidepdf.com/reader/full/8084951pdf 98/240
ha0
Figure V-1.1 Effect of potassium source on he pore size distributionsof (a) Catalyst C
(100Fd3 C d 4 W16 SiO,) and (b) Catalyst B (100 Fd5 C d 6 W24 SO,).
v-5
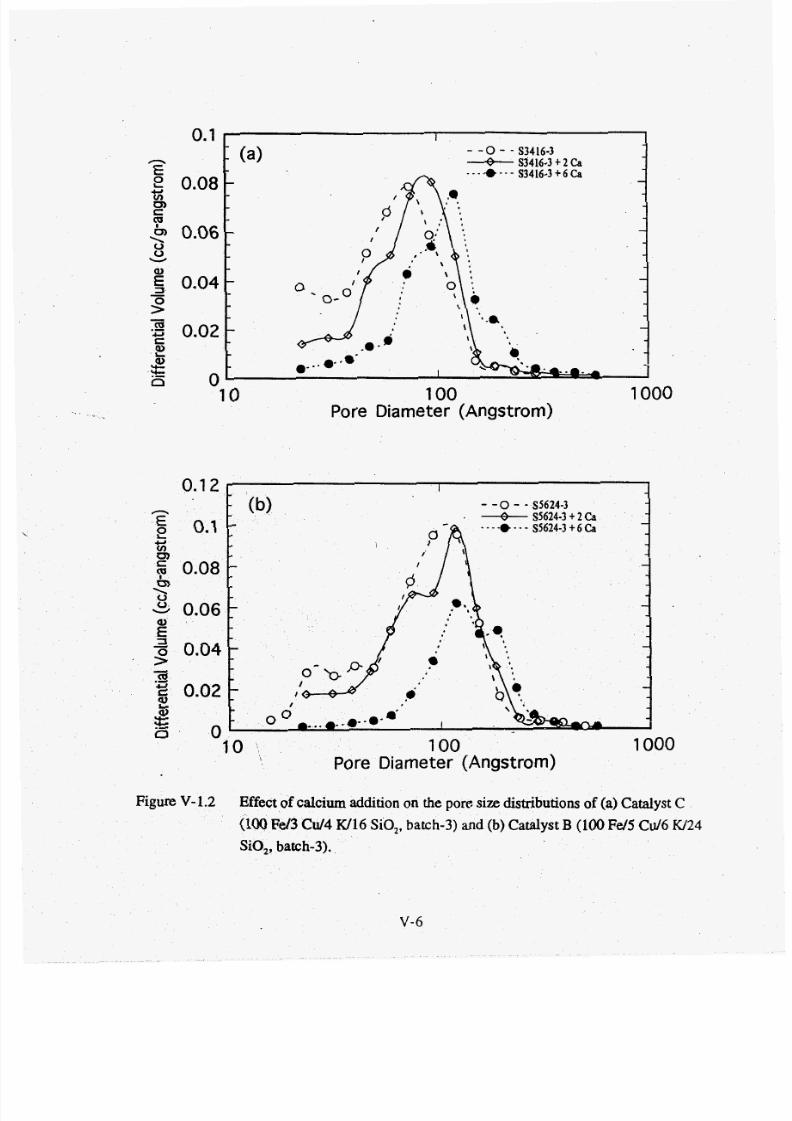
7/28/2019 808495(1).pdf
http://slidepdf.com/reader/full/8084951pdf 99/240
0.1 I I_9_ S3416-3 f 2 Ca
10 100 1000Pore Diameter (Angstrom)
Figure V-1.2 Effect of calcium addition on the pore size distributions of (a) Catalyst C
(100 Fd3Cu/4 W16 SiO,, batch-3) and (b) Catalyst8 100Fd5 C d 6 W24
SO,, batch-3).
V-6
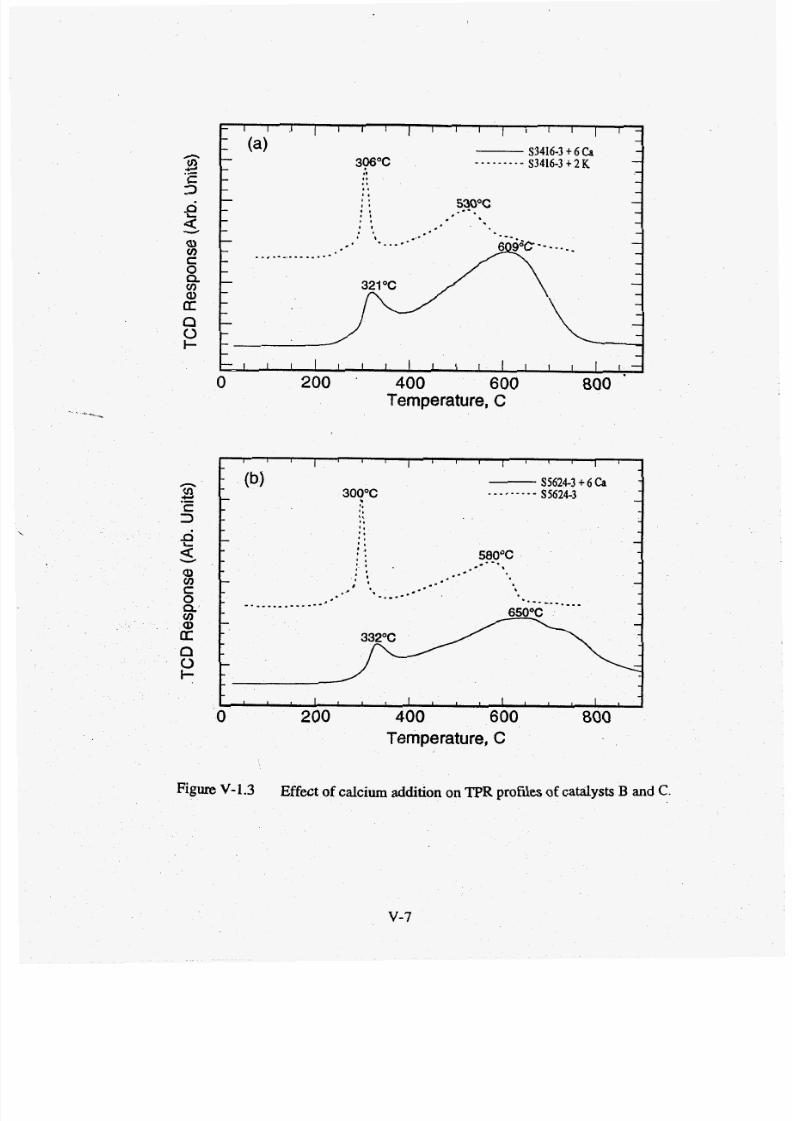
7/28/2019 808495(1).pdf
http://slidepdf.com/reader/full/8084951pdf 100/240
321"C \
n0I- u
I I I I 1 1 I 1 1 1 1 1 I
0 200 ' 400 600 800Temperature, C
t t 1 4 , , , 1 , , , 1 , 4 , 1 , i
0 200 400 600 800
Temperature, C
Figure v-1.3 Effect of calcium additionon TPR profiles of catalystsB and C.
v-7
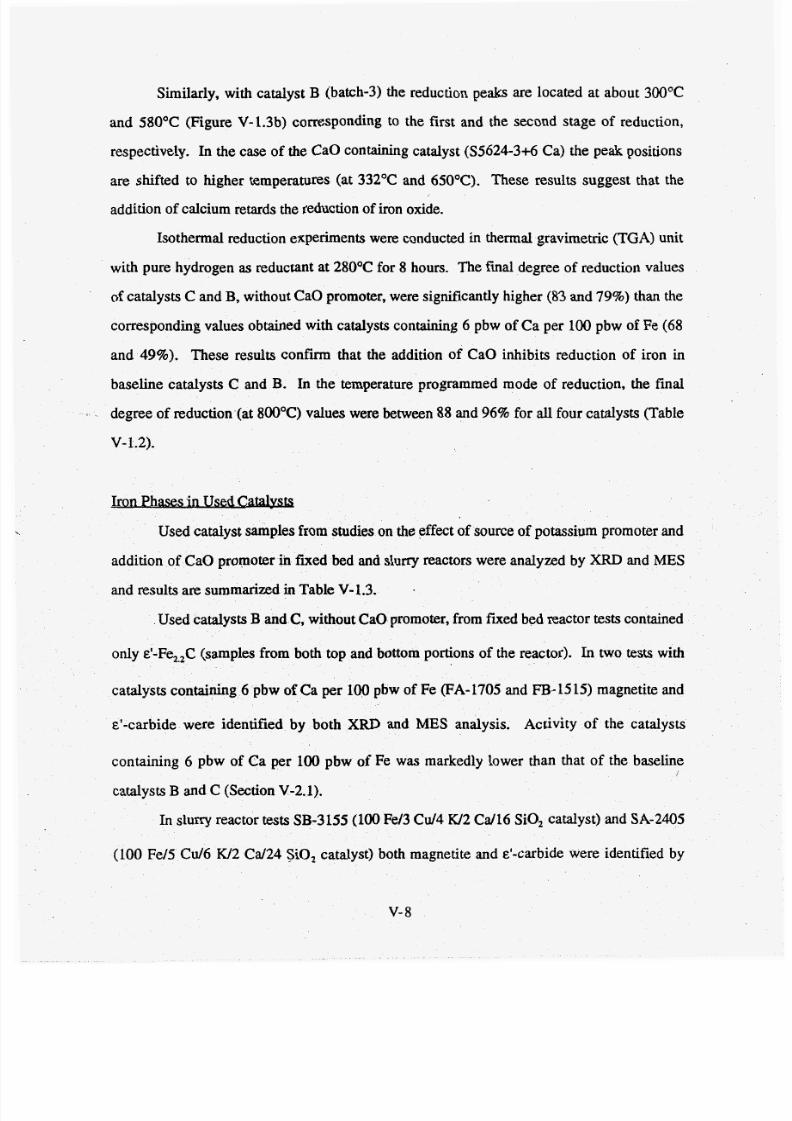
7/28/2019 808495(1).pdf
http://slidepdf.com/reader/full/8084951pdf 101/240
Similarly, with catalys t B (batch-3) the reduction peaks are located at about 300°C
and 580°C (Figure V-1.3b) corresponding to the first and the second stage of reduction,
respectively. In the case of the CaO containing catalyst (S5624-3+6 Ca) th e peak positions
are shifted to higher temperatures (at 332°C and 650°C). The se results suggest that theaddition of calcium retards th e reduction of iron oxide.
Isothermal reduction experiments were conducted in thermal gravim etric (TGA ) unit
with pure hydrogen as reductant at 280°C fo r 8 hours. The final degree of reduction values
of catalys ts C and B, without CaO promoter, were significantly higher (83 and 79% ) than the
corresponding values obtained with catalysts containing 6 pbw of Ca per 100 pbw of Fe (68
and 49% ). These results confirm that the addition of CaO inhib its reduction of iron in
baseline catalysts C and B. In the temperature programmed mode of reduction, the final
deg ree of reduction (at 800°C) values were between 88 and 96% for all four catalysts (Table
v-1.2).
Iron Phases in Used C e
Used catalyst samples from studies on the effect of sou rce of potassium promoter and
addition of CaO promoter in fmed bed and slurry reactors were analyzed by X RD and MES
and results are summ arized in Table V-1.3.
Used catalysts B and C, ithout CaO promoter, from fixed bed reactor tests contained
only &'-Fe,,C (samples from both top and bottom portions of the reactor). In two tests with
catalysts containing 6 pbw of Ca per 100pbw of Fe (FA-1705 and FB-1515) magnetite and
&'-car bide were identified by both XRD and MES analysis. Activity of th e catalysts
containing 6 pbw of Ca per 100 pbw of Fe wa s markedly lower than that of the baseline
catalystsB and C (Section V-2.1).
I
In slurry reactor tests SB-3155 (100Fe/3 C d 4 K/2 Cd 16 SiO, catalyst) and SA-2405
(100 Fe/5 C d 6 W2 C d 24 SiO, catalyst) both m agnetite and & '-carbidewere identified by
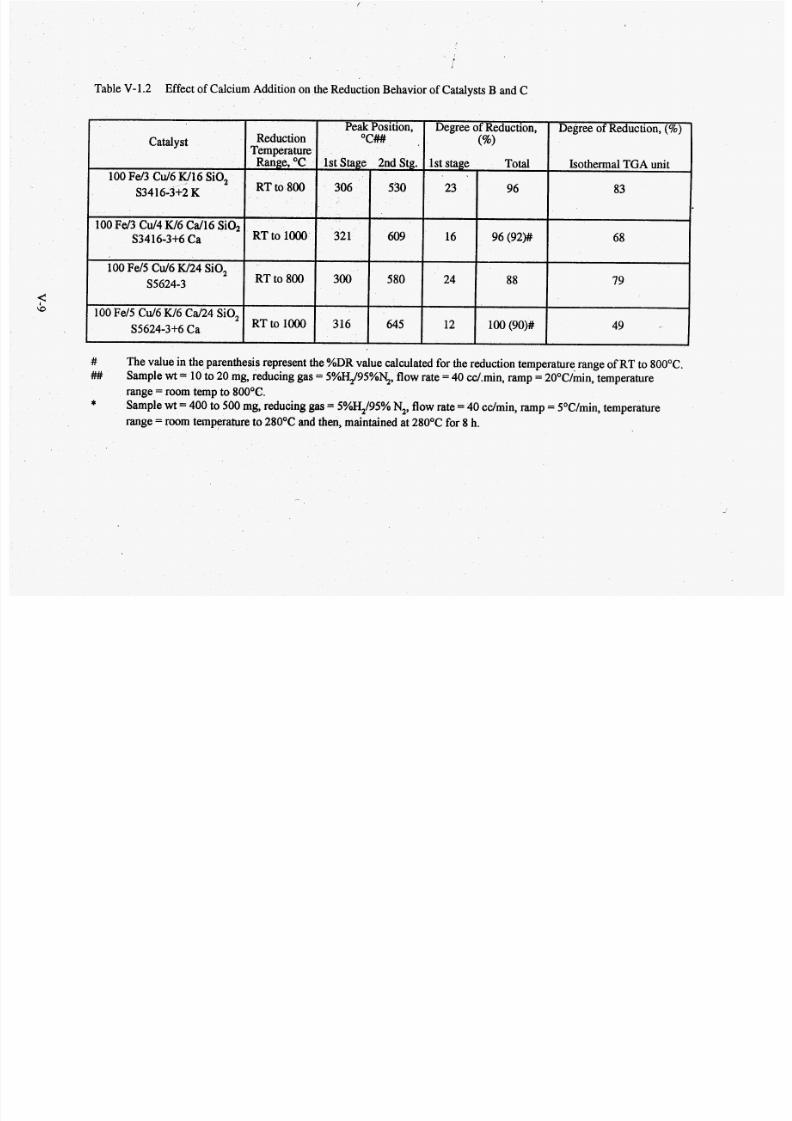
7/28/2019 808495(1).pdf
http://slidepdf.com/reader/full/8084951pdf 102/240
Table V-1.2 Effect of Calcium Addition on the Reduction Behavior of Catalysts B and C
Catalyst
100 Fe/3 C d6 W16 SO,
S34 16-3+2K
100 F d 3 C d 4 W6 C d l 6 Si02S3416-3+6 Ca
100 Fe/5 C d 6 W24 SiO,
S5624-3
100 Fe/5 C d 6 K/6 Ca/24 SiO,
S5624-3+6 Ca
PeakPosition, Degree of Reduction, Degree of Reduction, (%)Reduction O C # # (W
TemperatureRange, O C 1st Stage 2nd Stg. 1st stage Total Isothermal TGA unit
RT to 800 306 530 23 96 83
RTto lO00 321 609 16 96 (92)## 68
RT to 80 0 300 580 24 88 79
RTtolOOO 316 645 12 100 (go)# 49
##
##
*
The value in the par enthesis represent the % DR value calculated for the reduction temperature range of RT to 8OOOC.Sample wt = 10 to 20 mg, reducing gas = 5%H,J95%3, flow rate = 40 cc/.min, ramp = 20°C/&n, temperature
range = room temp to 8OOOC.
Sample wt = 400 to 500mg, reducing gas = 5 Y q / 9 5 % N,, flow rate = 40 cc/min, ramp = S°C/min, temperatur e
range = room tempera ture to 28OOC and then, m aintained at 28OOC f or 8 h.
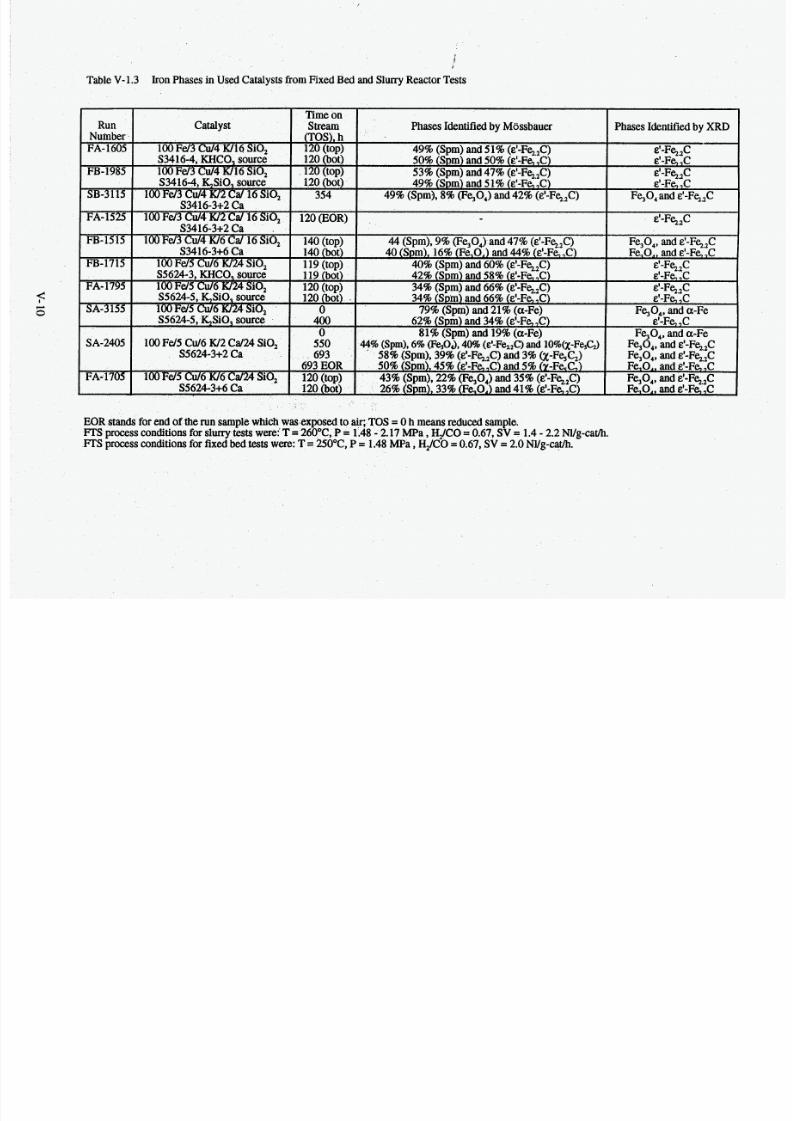
7/28/2019 808495(1).pdf
http://slidepdf.com/reader/full/8084951pdf 103/240
Time on
Number (TOS),Run catalyst Stream Phases Identifiedby Mossbauer Phases Identified by XRD
FA- 1605 100 Fd 3 W 4 K/16 SiO, 120 (top) 49% (Spm) and 5 1% (&'-F%,C) EI-FG~CS3416-4, KHCO, source 120 (bot) 50% (Spm) and 50%(&'-Fe,C) &'-Fe,C
FB-1985 100 Fe/3 Cu/4 W16 SiO, 120 (top) 53% (Spm) and 47% (&'-Fe&) EI-FG~CS3416-4, &SiO, source 1.20 (bot) 49% (Spm) and 5 1% (E'-Fe, C) &'-Fe,C
' SB-3115 100Fd3W4W2 Ca/ 16 SiO, 354 49% (Spm), 8% (J?%O,) and 42% (&'-Fe&) Fe,O, and e'-Fq,CS3416-3+2 Ca
S3416-3+2 CaFA-1525 100 Fd 3W4 W2 a/ 16Si0, 12O(EOR) . - &'-F%,C
7/28/2019 808495(1).pdf
http://slidepdf.com/reader/full/8084951pdf 104/240
XRD,whereas MES analysis of samples from run SA-2405 at 693 h reveals the presence of
&'-carbide(39%), small amount of x-Fe,C, (3%), and significant amount of an iron phase
exhibiting superparamagnetic behavior (58% Spm). At least a portion of the latter phase is
magnetite (small crystallites less than abou t 10 nm in diameter). Bulk iron composition of
the sample which was exposed to air (EOR) n run SA-2405 is very similar to that of the
sample withdrawn from the reactor at 693 hours without exposure to air.
7/28/2019 808495(1).pdf
http://slidepdf.com/reader/full/8084951pdf 105/240
v-2 Reaction Studies
Eight fixed bed reactor tests were conducted; two with baseline catalysts B and C ;
two with catalysts B and C prepared using potassium silicate as the source of potassium
prom oter, and four with catalysts containing CaO promoter. On the basis of results fromfixed bed reactor tests, three catalysts were selected for testing in slurry reactors. Two of
these tests were made with catalysts containing C aO promoter (runs SA -2405 an d SB-3 115)
and one w ith the catalyst B prepared using potassium silicate as the source of potassium
promo ter (SA-3155). Nominal catalyst compositions, test and catalyst codes, as well as the
general purpose of each of these tests are given in Table V-2.1.
v-2.1 Fixed Bed ReactorTestsof Modified Catalysts B and C
Four of the synthesized catalysts containing CaO promoter, and two' catalysts
prepared using potassium silicate as the source of potassium promoter were tested in a fixed
bed reactor to determine their activity and selectivity during Fischer-Tropsch synthesis.
About 3 g of the catalyst (30 to 6 0 mesh particle size) diluted 1:7 (reactor B) or 1:9 (reactor
A) by vo lume with glass beads (the same size as the catalyst) wa s used in fixed bed reactor
tests. Prior to F-T synthesis the catalysts were reduced in-situ with hydrogen at atmospheric
pressure, 7500 cm3/m in and either 24OOC for 2 h (catalysts containing 16 parts of SiO, per
100 parts of Fe on a m ass basis), or 25OoC for 4 h (catalysts containing 24 parts of S i q per
100 parts of Fe on a mass basis). After the conditioning period of about 24 h, during which
the reaction temperature was gradually increased from 210 to 25OoC, all catalysts were tested
at : 25OoC, 1.48 MPa (200 psig), 2 NYg-cat/h using syngas with €4, toCO molar feed ratio of
about 0.67. Test duration was 120 - 140h including the conditioning period.
Performance of catalysts having 16 parts by weight (pbw) of SiO, per 100pbw of Feand con taining either CaO promoter (runs FA-1525 and FB-1515), o r being prepared using
K,SiO, as the source of potassium (FB-1895) is compared with that of the baseline catalyst
(catalyst C from batch 4; run FA- 1605) in Figures V-2.1 and V-2.2. The syngas conversions
v- 12
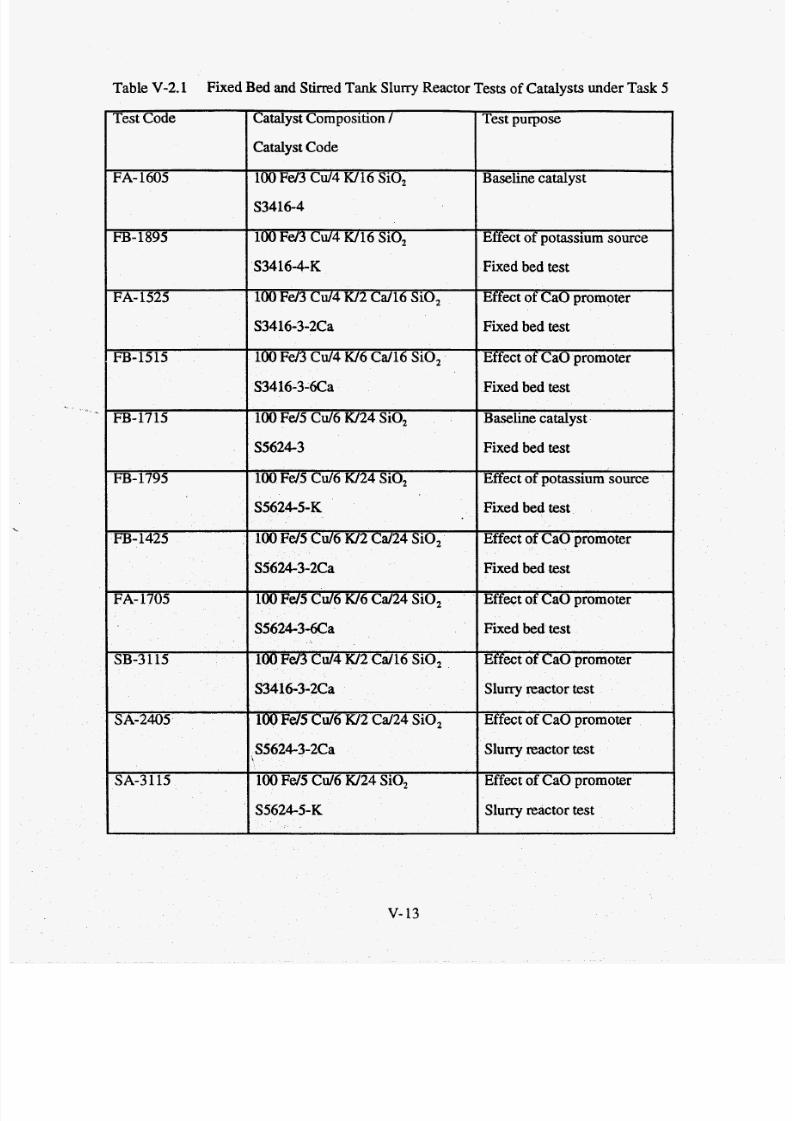
7/28/2019 808495(1).pdf
http://slidepdf.com/reader/full/8084951pdf 106/240
Table V-2.1 Fixed Bed and Stirred Tank S luny Reactor Tests of Catalysts under Task 5
S5624-3-6Ca
100 Fd3 C d 4 W 2 C d 16 SiO,
S3416-3-2Ca
100Fd5 C d 6 W 2 C d 2 4 SiO,
S5624-3-2Ca
100 Fd5 C d 6 W24 SiO,
S5624-5-K
Test Code
Fixed bed test
Effect of CaO promoter
Slurry reactor test
Effect of CaO promoter
Slurry reactor test
Effect of CaO promoter
Slurry reactor test
FA- 1605
FB- 895
FA- 1525
FB-1515
FB-1715
FB- 795
FB-1425
FA- 1705
SB-3 115
SA-2405
SA-3115
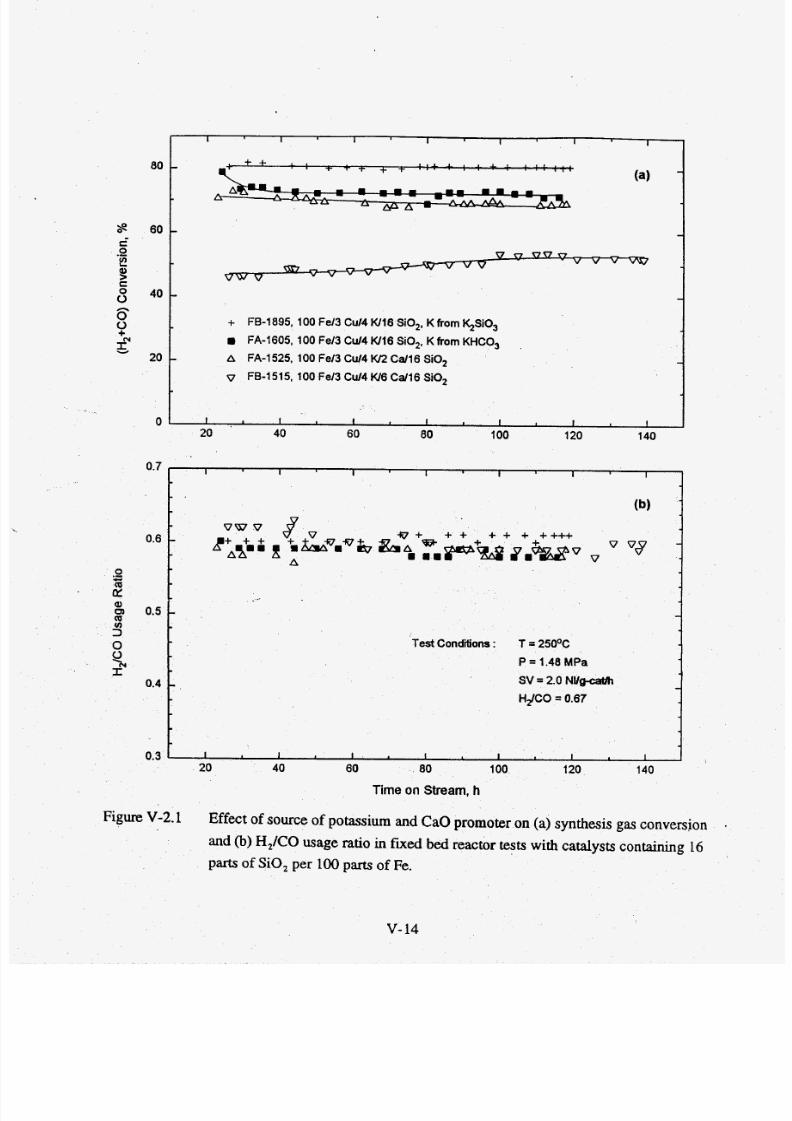
7/28/2019 808495(1).pdf
http://slidepdf.com/reader/full/8084951pdf 107/240
0.-2
0.7
0.6
0.5
0.4
0.3
00'E(r
I I I I I I I
(b )
v$
-
A
- -
- -
I I I I I I I
II I I I I I I
I80
60
v w vm
+ FB-1895, 100 Fe13 Cu14 W16 SO,, K fram &SiO,
FA-1605,100 Fe13 CU14 W16 SiO,, K from KHCO,
v FB-1515, 100 Fe13 Cu14 K/6 C d16 SiO,
- A FA-1 525, 100 Fe13 Cu14 w2 Cd16 SiO,
Test Conditions : T = 25OOC
P = 1.48 MPa
SV = 2.0 NVg-catlh
H2/CO = 0.67
Figure V-2.1 Effect of source of potassium and CaO promoter on (a) synthesis gas conversion
and (b) H,/CO usage ratio in futed bed reactor tests with catalysts containing 16
parts of SO, er 100parts of Fe.
V- 4
7/28/2019 808495(1).pdf
http://slidepdf.com/reader/full/8084951pdf 108/240
decreased w ith increase in CaO promotion. Th e activity of the catalyst with lower amount of
Ca O promoter (run FA-1525 with the 100 F d 3 Cu/4 W2 C d 1 6 SiO, catalyst) was similar to
that of the baseline catalyst (run FA-1605), whereas the activity (syngas conversion) of the
catalyst containing 6 pbw of Ca per 100 pbw of Fe (FB-1515) was markedly lower (FigureV-2.la). This may be due to significantly lower surface area of the latter catalyst in
comparison to the other catalysts (Table V-1.1). Th e syngas conversion in run FB-1895
(Ca talyst C prepared using K,SiO, as the source of potassium) was about 80 %. By
comparison, the baseline catalyst C synthesized using KHCO, as the source of potassium
(FA-1605) was less active (syngas conversion of about 72 %). Usage ratios in all four tests
were sim ilar (about 0.6), indicating similar water-gas-shift activities (Figure V-2.1 b).
Methane (Figure V-2.2a) and gaseous (C, - C,) hydrocarbon selectivities (Figure V-
' "'- 2.2b) were slightly higher on the CaO promoted catalysts, than on the baseline catalyst.
Methane selectivity in'run FB-1895 was between 6 and 7 mol%, and gaseous (C, - C,)
hydrocarbo n selectivity was between 20 and 22 mol%. Th e baseline catalyst C had lower
methan e selectivity (5.1 - 5.9 mol%), and its (C, - C,) hydrocarbon selectivity (21 - 24 mol%)
wa s slightly h igher than that obtained in run FB-1895.
Perform ance of catalysts having 24 pbw of SiO, per 100pbw of Fe and containing
either CaO promoter (runs FB-1425 and FA-1705), or being prepared using K2Si0, as the
source of potassium (FA-1795) is compared with that of the baseline catalyst (catalyst B
from batch 3; run FB-1715) in Figures V-2.3 and V-2.4. As in the case of tests with catalysts
containing 16 parts by weight (pbw) of SiO, per 100 pbw of Fe, the syngas conversions
decreased w ith increase in CaO promotion. Th e activity of the catalyst with lower amount of
CaO promoter (run FB-1425 with the 100 Fd5 C d 5 K/2 C d 2 4 SiO, catalyst), and of the
catalyst B prepared using & S O , as the source of potassium (FA-1795) was similar to that of
the baseline catalyst B from batch 3 (FB-1715), whereas the activity (syngas conversion) of
the 100Fd5 C d 6 W 6 C d 2 4 SiO, catalyst (run FA-1705) was markedly lower (Fig. V-2.3a).
Th is may be du e to significantly lower surface area of the latter catalyst in comparison to the
V- 15
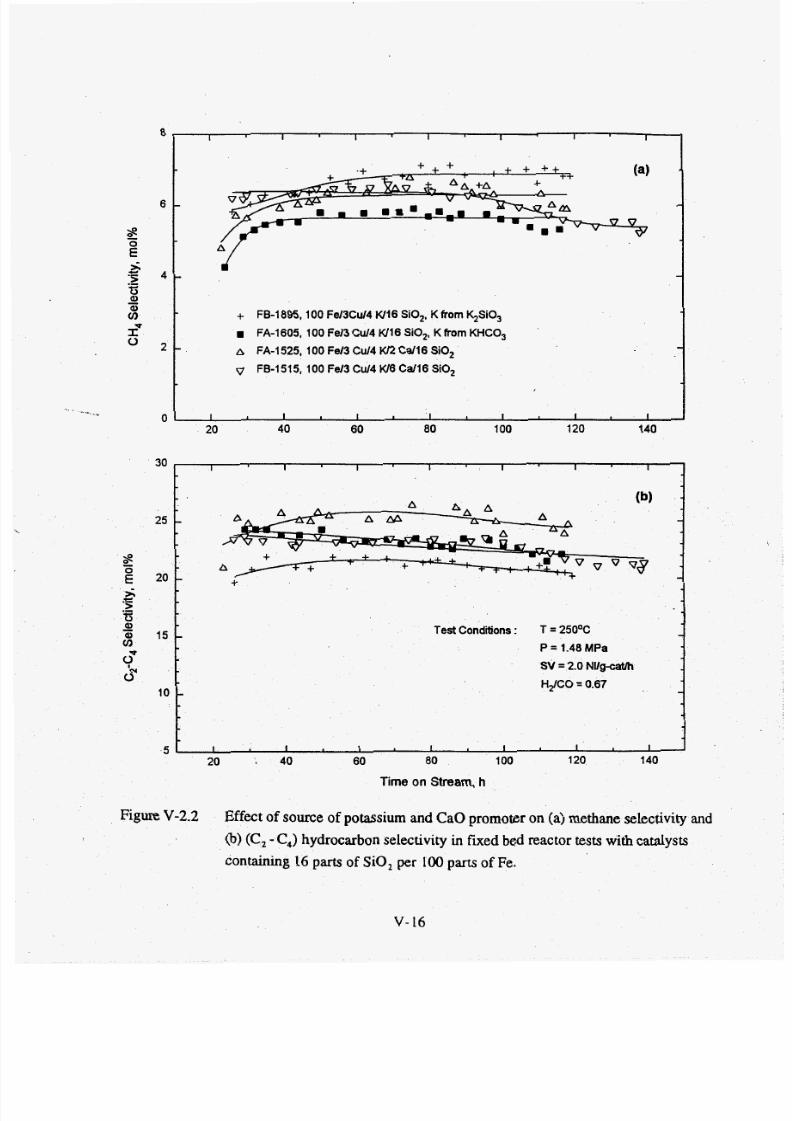
7/28/2019 808495(1).pdf
http://slidepdf.com/reader/full/8084951pdf 109/240
8I 1 I I I I I
0--,
I I I I 1 I I 1
4 -
2 -
'-
30
25
s
s.e>tjP)
0 15to
-g 20
.--
S0"
10
5
+ FB-1895,100 Fd3Cu14 W16 SiO,, K from &SiO,
a FA-I 605,100 Fd 3 Cu/4 W16 SiO,, K from KHCO,
A FA-1 525, 100 F e n Cu14 K/2 Cd16 SO,
v FB-15 15,100 Fd 3 Cu14 W6 Ca ll6 SiO,
I I 1 I I I I
- -
1 -
Test Conditions : T = 25OOC- -P = 1.48 MPa
SV = 2.0 NU
H$CO = 0.67- -
I I I I I I I
Figure V-2.2 Effect of source of potassium and CaO promoter on (a) methane selectivity and
(b) (C, - C hydrocarbon selectivity in fixed bed reactor tests with catalysts
containing 16 parts of SiO, p e r 100 parts of Fe.
V- 16

7/28/2019 808495(1).pdf
http://slidepdf.com/reader/full/8084951pdf 110/240
8o t
0.7
.s 0.6
Q)0Q
d
382 0.5
0.4
I.+_._
-. .
I I I I I I
- -V (b)
V VV
V - v
: : : :
V n Vv v- . I ,
v d
A P A A A A- 8 A A A d . A 8 8 A d A A1 a, I m m
-rn
r n
+ FA-1795,100 Fd5 CU16 I624 SiO,, K from &SiO,
8 FE1715,lOO F d5 C d 6 Kl24 SiO,, K from KHCO,
P F&l425,100 Fd5 CU B l2CaQ4 SiO,
v FA-1705,100 Fd5 C d6 Uf6 CaQ4 SiO,
- -
I I I I I I
20 40 60 80 100 120
Test Conditions : T = 25OOC
P = 1.48 MPa
SV = 2.0 NU-
HdCO = 0.67
-
I I I I 1 I
20 40 60 80 100 120
V- 17

7/28/2019 808495(1).pdf
http://slidepdf.com/reader/full/8084951pdf 111/240
8I I I I I 1
6 -
4 -
2 -
30
25
20
15
10
5
+ FA-1795,100 Fe15 CUI6 w24 SO,, K from $SiO,
rn FB-1715,100 e15 Cd6 w24 SiO,, Kfrom KHCO,
A FB-1425,100Fd5 Cd6 w2 C&4 SiO,
v FA-1 705,100 Fe15 Cd6 W6 C-4 SiO,
I 1 1 I I I
(b)
- -
- -
+
- Test Conditions: T = 250% -P = 1.48 MPa
SV = 2.0 NVg-caVh
- HdCO = 0.67 -
I I I I I I
0 1 I I I I I I I20 40 60 80 100 120
Figure V-2.4 Effect of source of potassium and CaO-promoteron (a) methane selectivity and
(b) (C, - C,) hydrocarbon selectivity in fixed bed reactor tests with catalysts
containing 24 parts of SiO, per 100parts of Fe.
V- 18
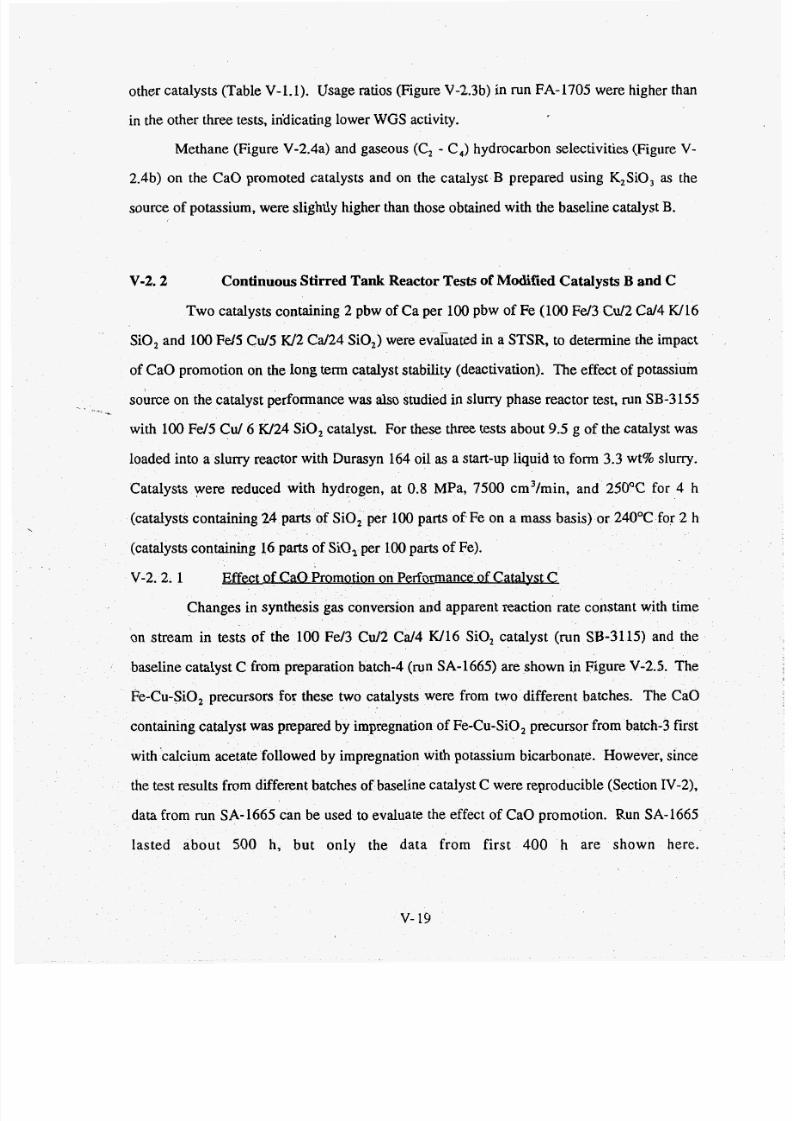
7/28/2019 808495(1).pdf
http://slidepdf.com/reader/full/8084951pdf 112/240
other catalysts (Table V- 1.1). Usage ratios (Figure V-2.3b) in run FA- 1705 were higher than
in the other three tests, indicating lower WGS ctivity.
Methane (Figure V-2.4a) and gaseous (C, - C,) hydrocarbon selectivities (Figure V-
2.4b) on the CaO promoted catalysts and on the catalyst B prepared using K,SiO, as the
source of potassium, were slightly higher than those obtained with the baseline catalyst B.
v-2.2 Continuous Stirred Tank Reactor Tests of Modified Catalysts B and C
Tw o catalysts containing 2 pbw of Ca per 100pbw of Fe (100 Fd3 Cu/2 C d 4 W16
SiO, and 100 Fd5 Cu/S W 2 Cd 24 SiO,) were evahated in a STSR, to determine the impact
of CaO promotion on the long term catalyst stability (deactivation). Th e effect of potassium
source on the catalyst performance w as also studied in slurry phase reactor test, run SB-3155
with 100Fd5 C d 6 W24 SiO, catalyst. For these three tests about 9.5 g of the catalyst was
loaded into a slurry reactor with Durasyn 164 oil as a start-up liquid to form 3.3 wt% slurry.
Catalysts were reduced with hydrogen, at 0.8 MPa, 7500 cm 3/m in, and 250°C for 4 h
(catalysts containing 24 parts of SiO, per 100 parts of .Fe on a mass basis) or 240°C for 2 h
(catalysts containing 16 parts of SiO, per 100parts of Fe).
v-2. 2. 1
R
Effect of CaO Promotion on Performance of Catalyst C
Ch anges in synthesis gas conversion and apparent reaction rate constant with time
on stream in tests of the 100 Fe/3 C d 2 C d 4 W16 SiO, catalyst (run SB-3115) and the
baseline catalyst C from preparation batch-4 (run SA-1665) are shown in Figure V-2.5. Th e
Fe-Cu-SiO, precursors for these two catalysts were from two different batches. The CaO
containing catalyst was prepared by impregnation of Fe-Cu-SiO, precursor from batch-3 first
with calcium acetate followed by impregnation with potassium bicarbonate. However, since
th e test results from different batches of baseline catalyst C were reproducible (Section IV-2),
data from run SA -1665 can be used to evaluate the effect of CaO promotion. Run SA-1665
lasted about 500 h, but only the data from first 400 h are shown here.
v- 19

7/28/2019 808495(1).pdf
http://slidepdf.com/reader/full/8084951pdf 113/240
90
80
70
60
50
40
1 1 I I I I I I
(a)
-
-
-
- SA-1665, 100 Fel3 Cu14 KI16 SiO, SB-3115,100 F e n Cul4 lU2 Cd16 SiO,
v P = 1.48 MPa, SV= 1.4NVgcat/h A P = 1.48MPa. S V = 1.4 NWg-cath
rn p = 2.17 MPa, SV = 2.0 Nwgcat/h* 0 P = 2.17 MPa, SV = 2.0 NWg-caVh
I I 1 I I I I I
Figure V-2.5 Effect of CaO promoter on (a) synthesis gas conversion and (b) apparent
reaction rate constant in STSR tests with catalysts containing 16 parts of SiO,
per 100 parts of Fe.
400
300
dFE
9
EEJ
q 200
0
100
0
v-20
I I I I I I I I I
Test Conditions : T = 26OOC (b). P = 1.48 - 2.17 MPa
HdCO = 0.67
- SV = 2.5 - 3.6 Nllg-Feh -
a '&&-A 4 l
-
SA-1865, 100 Fe13 Cu14 W l6 SiO,
A SB-3115,100 Fd3CU14 W2Cdl6 Si02- -
I I I I 1 I I I I

7/28/2019 808495(1).pdf
http://slidepdf.com/reader/full/8084951pdf 114/240
Figure V-2.5 shows that the CaO containing catalyst tested in run SB-3115 had
lower activity , i.e. low er syngas conversion and the apparen t reaction rate constant, than the
catalyst C in run SA-1665. The CaO containing catalyst started to deactivate around 220 h
on stream , whereas the catalyst C in run SA-1665 was fairly stable during 400 h of testing.
Also, the CaO con taining catalyst had h igher methane (Figure V-2.6a) and C,€,
(Figure V-2.6b) hydrocarbon selec tivities during testing at 1.48 MPa. After the pressure was
increased to 2.17 MPa (wh ile proportionally increasing the gas space veloc ity to 2.0 NVg-
cat/h) in run SB-3115,the methane and gaseous hydrocarbons selec tivities started to decrease
(170 - 220 h), and then remained stable (220 - 350 h). The hydrocarbon selectivity of the
'
Ca O containing catalyst depends on the reaction pressure (at cot sta nt P/SV ratio), whereas
gaseous hydrocarbon selectivity was independent of pressure in run SA- 1665 with catalyst C.
Olefin and 2-olefin selectivities for runs SA- 1665 and SB-3 115 are shown in Figure.
V-2.7. The addition of CaO promoter resulted in a decrease of the total olefin content and in
increase of the 2-olefin content, at the reaction pressure of 1.48 MPa. After the pressure was
increased from 1.48 MPa to 2.17 MPa in run SB-3115, the total olefin con tent increased and
2-olefin content decreased, and olefin selectivities became sim ilar to those obtained in run
SA-1665 with the baseline catalyst C.
eters and product yields obtained in
runs SA- 1665 and SB-3115are shown in Table V-2.2. The CaO promoted catalyst produced
more lower molecular products than the baseline catalyst C. For exam ple at the re
pressure of 1.48 MPa the gasoline fraction (C ,C ,,hydrocarbons) in run SB-3115 was about
38% of total hydrocarbons, whereas in ru n SA- 1665 it was 12% only. Upon increasing the
reaction pressure to 2.17 MPa in run SB-3115 the fractions of gaseous hydrocarbons and
gasoline fraction (C,C I I hydrocarbons) decreased, and the fraction of higher molecular
weight hydrocarbons (C 12+) increased.
v-21
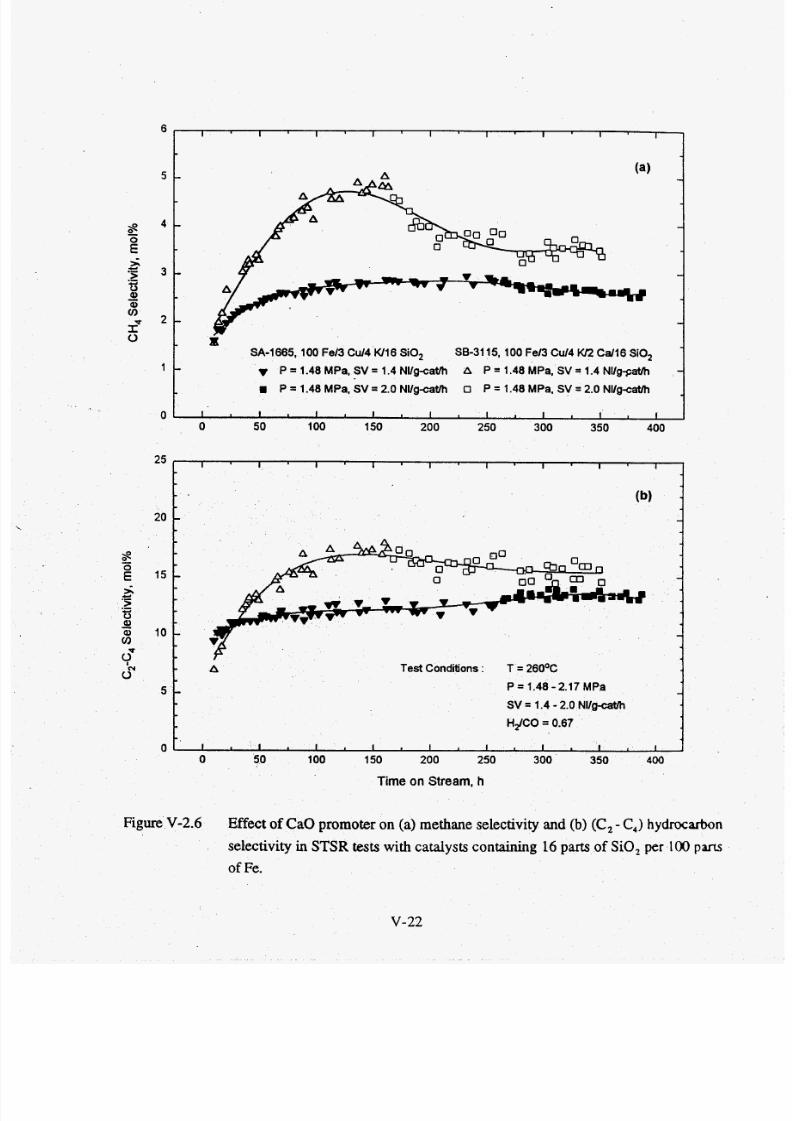
7/28/2019 808495(1).pdf
http://slidepdf.com/reader/full/8084951pdf 115/240
6I I I I I I I I I
5 -
4 -
Es;c.-> 3 -5
I"
Q)-2 -
0
1 -
0
-
-
-
-
SA-1665,100 Fe/3 Cu14 K116 SiO, SE-3115,100 Fel3 Cu14 w;! Cd16 SiO,
A P = 1.48 MPa, SV = 1.4 Nllg-gaVh
0 P = 1.48 MPa, SV = 2.0 NllgcaVhP = 1.48 MPa, SV = 1.4 Nllg-caVh
a P = 1.48 MPa, SV = 2.0 NWg-caVh
I I 1 I I I I I I
25
20
-E 15
-
s
s;c.->-
Q) 10(I)
0
5 -
0
Figure V-2.6 Effect of CaO promoter on (a) methane selectivity and (b) (C, - C,) hydrocarbon
selectivity in STSR tests with catalysts containing 16 parrs of SiO, p e r 100 parrs
of Fe.
I I I I I I I I I
(b)
- -
- -
- -
A Test Conditions : T = 26OOC
P = 1.48 -2.17 MPa -SV = 1.4 - 2.0 NllgcaVh
HdCO = 0.67
I I I I I I I I I
v-22
7/28/2019 808495(1).pdf
http://slidepdf.com/reader/full/8084951pdf 116/240
..1 ,,.. .
I 1 I I I I I I
V
CIv v
(a)-O X V V
O = o V
-
V0 8 V-
V-
V. 8
0 . 8
0
- 0 V -O m V
0
-v SA-1665, 112 h, 1.48 MPa , 1.4 Nllg-caVh
o SB-3115, 121 h, 1.48 MPa ,l.4 N llg-cath
- 8 SB-3115,288 h, 2.17 MPa , 2.2 Nl/gca t/h
-
0
-
I I I I I I I I
90
80
7053+-c
c3 60
8ccQ, 505
40
30
50
40
c 20ccQ)
h(P
10
0
a
0
I I I I I I I 1
Run SA-1665, Catalyst 100 Fel3 Cu/4 W16 SiO,
Run SB-3115, Catalyst 100 Fe/3 Cu/4 KL? Cal l6 SiO,
0
0
V
V 8
8
0
0
V8
0 0 U
i?0
8
0
E
I I I I I I I
14 6 8 10 12 14 16
Carbon Number
Figure V-2.7 Effect of CaO promoter on (a) olefin content and (b) 2-olefin content as a
function of carbon number for catalysts containing 16 parts of SiO, per 100
parts of Fe.
V-23
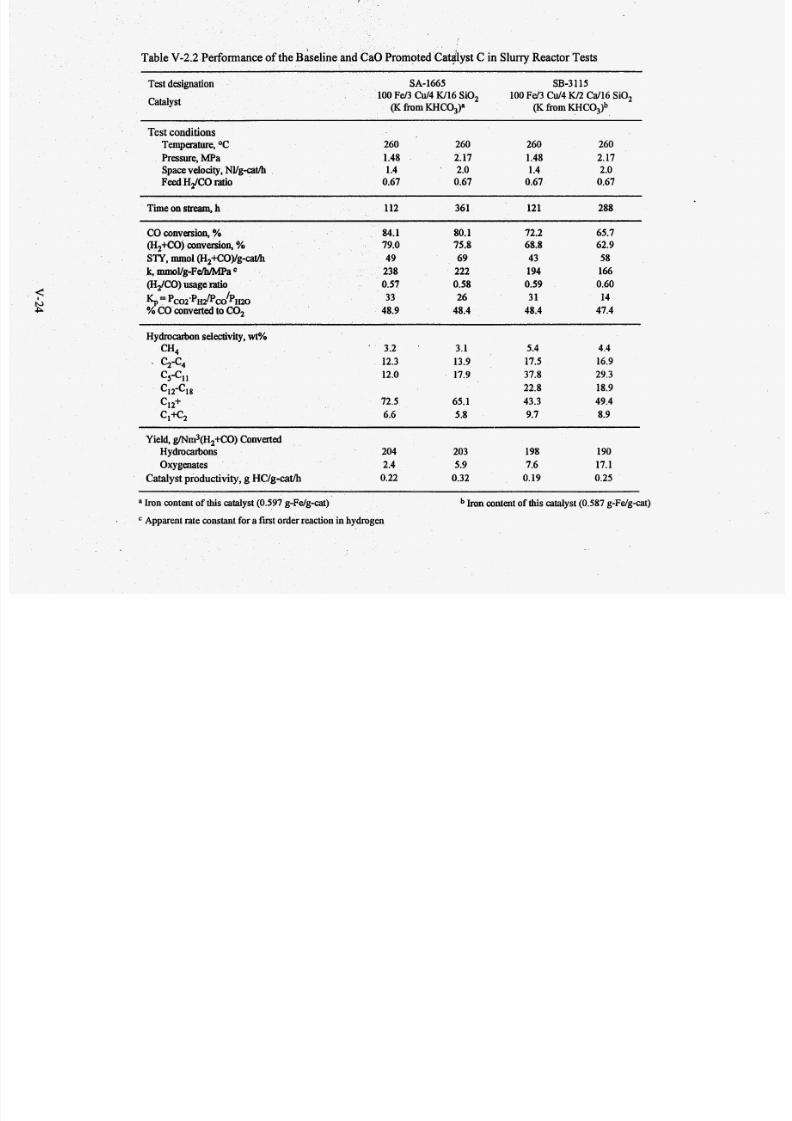
7/28/2019 808495(1).pdf
http://slidepdf.com/reader/full/8084951pdf 117/240
Table V-2.2 Performance of the B ine and CaO Promoted Catdlyst C in Slurry Reactor Tests
Test designation SA-1665 SB-3115
100Fd3 Cu/4 W16 SiO,
(KfromKHC03)"
100Fd3 Cd 4 IU2 Cd16SO,(KfromKHC03)b
atalyst
Test conditionsTemperature, OC 260 260 260 260
Pressure,MPa 1.48 2.17 1.48 2.17
FeedHiCO ratio 0.67 0.67 0.67 0.67
Spacevelocity,NYg-cath 1.4 2.0 1.4 2.0
Time on stream, h 112 361 121 288
COconversion,% 84.1 80.1 72.2 65.7
(H2+C0)onversion,% 79.0 75.8 68.8 62.9
STY, m o l H2+c0)/g-cat/h 49 69 43 58
k,mmoVg-Fem/Mpa 238 222 1 94 166
(HdCO)usageratio 0.57 0.58 0.59 0.60
Kp =Pc02%2IP,/PH20 33 26 31 14
% CO converted to CO, 48.9 48.4 48.4 47.4
Hydroahon selectivity,wt?hCH4 ' 3.2 ' 3.1 5.4 4.4
. C2-G 12.3 13.9 17.5 16.9
CYCll 12.0 17.9 37.8 29.3
c12-c1 8 22.8 18.9
Cl+c, 6.6 5.8 9.7 8.9
c12+ 72.5 65.1 43.3 49.4
Yield, gMm3(H2+CO) Convexted
Hydrocarbons 204 203 198 190
Oxygenates 2.4 5.9 7.6 17.1
Catalystproductivity, g HC/g-cat/h 0.22 0.32 0.19 0.25
a Iron content of this catalyst (0.597 g-Fdg-cat) Iron content of this catalyst (0.587 g-Fdg-cat)
Apparent rate constant for a first order reaction inhydrogen

7/28/2019 808495(1).pdf
http://slidepdf.com/reader/full/8084951pdf 118/240
Carbon number distribution at 121 h on stream in run SB-3115was fitted with a three
parameter model of Huff and Satterfield, and the estimated values of parameters were as
follows: a, 0.71; a,=0.90 ,and p =0.90.
. .,....
v-2.2.2 Effect of CaO Promotion and Potassium Source on Performance of C a t a l m
Activity compa risons between the baseline catalyst B from batch-3 (SB- 1 2 9 3 ,
modified catalyst B containing CaO promoter (precursor from batch-3; run SA-2405) and
catalyst B prepared using potassium silicate as the source of potassium promoter (precursor
from batch-5; run SA-3155) are made in Figure V-2.8a (in terms of syngas conversions) and
Figure V-2.8b (in terms of the apparent reaction rate constant). During the first 120 h on
srream, the catalyst B was slightly more active than the CaO containing catalyst (higherapparent rate constant), whereas after that the latter catalyst had higher activity. This is
primarily due to the fact that the CaO containing catalyst (SA-2405) maintained its activity
better than the catalyst B (SB-1295). The CaO containing catalyst deactivated slowly during
testing a t 2.17 MPa (240-400 hours on stream). The catalyst B prepared using K,SiO, as
potassium source was less active than the baseline catalyst B. The syngas conversions and
apparent reaction rate constant in run SA-3155 were lower than those obtained in run SB-
1295, whereas the H,/CO usage ratio was higher indicating lower WGS eaction activity
(Table V-2.3).
' During testing at 1.48 MPa (200 psig) the baseline catalyst B had either similar
(first 30-40 h on stream) or low er methane (Figu re V-2.9a), and C,€ (Figure V-2.9b)
hydrocarbon selec tivities than the CaO containing catalyst. However, when the pressure was
increased to 2.17 MPa (at 237 h on stream) in run SA-2405, methane and gaseous
hydrocarbon selectivities started to decrease and a t 300 h were similar to those obtained in
test S B-1295 (here the system pressure is still 1.48 MPa). Th e data show that hydrocarbon
selectivities of the CaO containing catalyst are dependent upon the reaction pressure, and this
was also observed in run SB-3115 with the 100 Fe/3 C d 2 Cd4 W16 SiO, catalyst. During
the first 100 h on stream, methane and gaseous hydrocarbon selectivities in run SA-3155 (K
V- 25
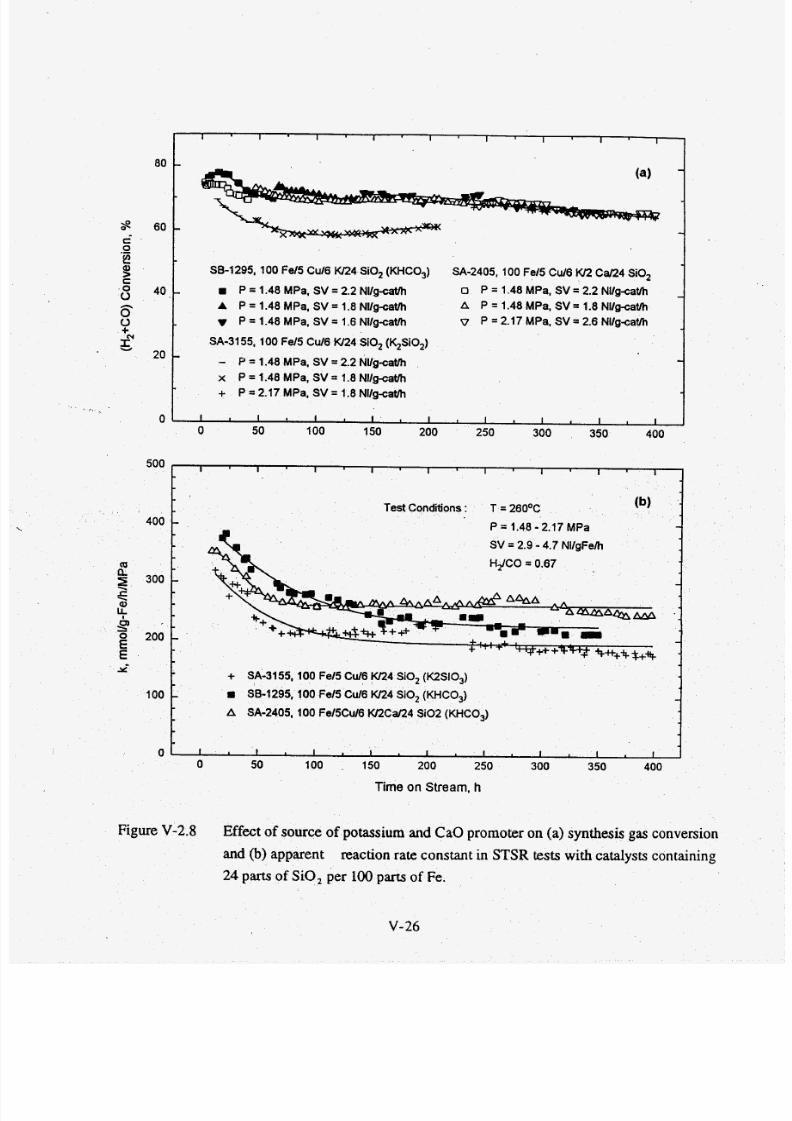
7/28/2019 808495(1).pdf
http://slidepdf.com/reader/full/8084951pdf 119/240
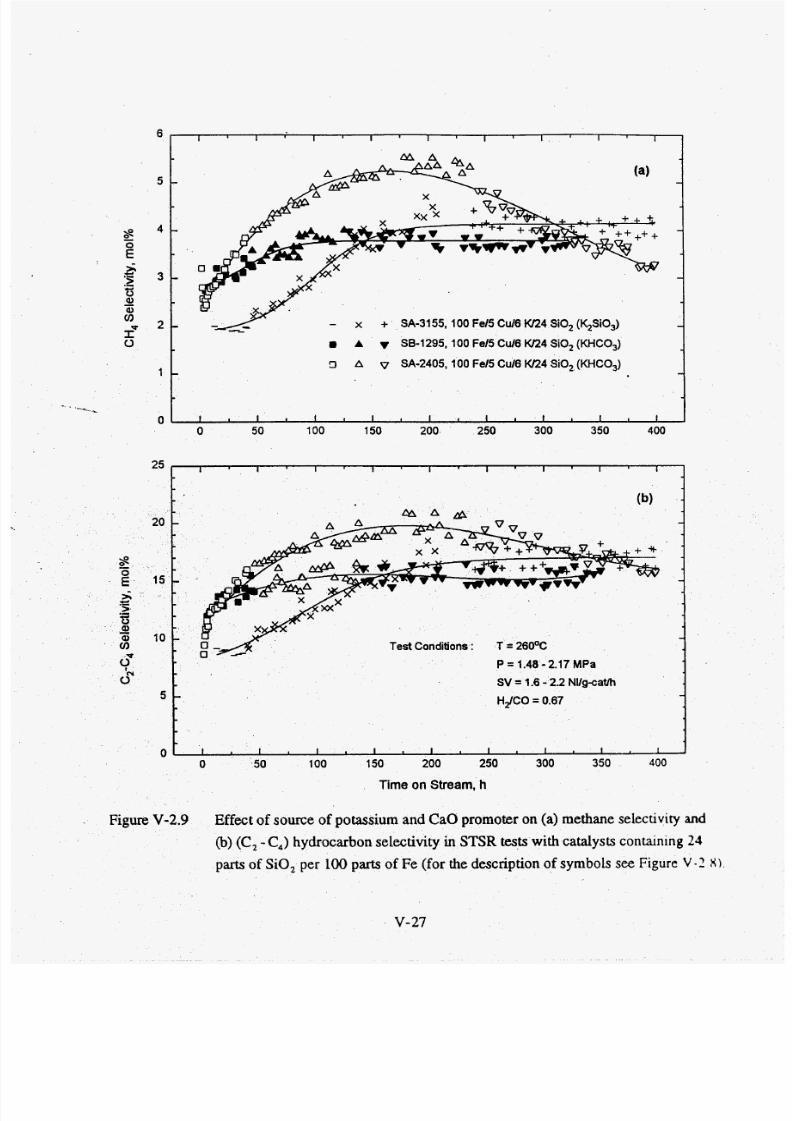
7/28/2019 808495(1).pdf
http://slidepdf.com/reader/full/8084951pdf 120/240
6I I I I I I I I I
5 -
4 -
3 -
2 -
L0
1
-Q ..
- x + SA-3155,100 Fe/5 Cu16 w24 SiO, (K$iO,)
A v SB-1295,100 Fe15 Cu16 w24 SiO, (KHCO,)
D A v SA-2405,100 Fe/5 CUB w24 SiO, (KHCO,)
25 I I I II I I I I 1
0 I I I I I I I I I
0 50 100 150 200 250 300 350 400
Time on Stream, h
Figure V-2.9 Effect of source of potassium and CaO promoter on (a) methane selectivity and
(b) (C, - C,) hydrocarbon selectivity in STSR tests with catalysts containing 24
parts of SiO, per 100 parts of Fe (for the description of symbols see Figure V - 2 X )
7/28/2019 808495(1).pdf
http://slidepdf.com/reader/full/8084951pdf 121/240
from K,SiO,) were significantly lower than in run SB-12 95, but these differences in
selectivity diminished with time and gaseous hydrocarbon selectivities in the two tests were
similar after 140 h (Figu re V-2.9). Gaseous hydrocarbon selectivities in run SA-3155 were
not affected by reaction pressure (i.e. they were nearly the same during operation at 1.48MPa and 2.17 M Pa).
Olefin and 2-olefin selectivities obtained in runs SB-1295, SA-2405 and SA-3155
are shown in Figure V-2.10. As can be seen from this Figure, the addition of C aO promoter
resulted in a decrease of the total olefin content and in an increase of the 2-olefin content
during operation at reaction pressure of 1.48 MPa. Th e total olef inan d 2-olefin contents in
run SA-2405 during operation at 2.17 MPa were very similar to those in run SB-1295 at 1.48
MPa. Th e sam e type of behavior was also observed in run SB-3 115 with the 100 Fd3 C d 2
C d 4 W16 SiO, catalyst. Olefin selectivities in run SA-3 155with catalyst B (K from &SO,)
were essentially the s am e as those obtained in run SB-1295 with th e baseline catalyst B (K
from KHCO,).
Hvdrocarbon and Carbon Number Product Distributions
A typical carbon number d SB-1295 and SA-3155 with
catalyst B is shown in Figure N-2 .11. Positive dev ASF distribution are noted in
run SB-1295 for C - C,, carbon number range, but w ere virtually ab sent in run SA -3155.
Experimental data from both tests were fitted with a three parameter model of Huff and
Satterfield, and the estimated values of parameters were as follows: a, 0.68; a,=0.91; and
p =0.74.
Lumped hydrocarbon distribution, activity parameters and product yields obtained
in runs SB-1295, SA-24 05 and SA-3155 are show n in Table V-2.3. Th e catalyst activity,
productivity, and hydrocarbon selectivities in run SA-2405 w ith the 100Fd5 Cu/5 W 2 C d 2 4
SiO, catalyst at 2.17 MPa (300 psig) were very good. The highest oxygenates yield w as
obtained in run SA-3 155 (8-9 g/Nm3(H,+CO) converted).
v-28
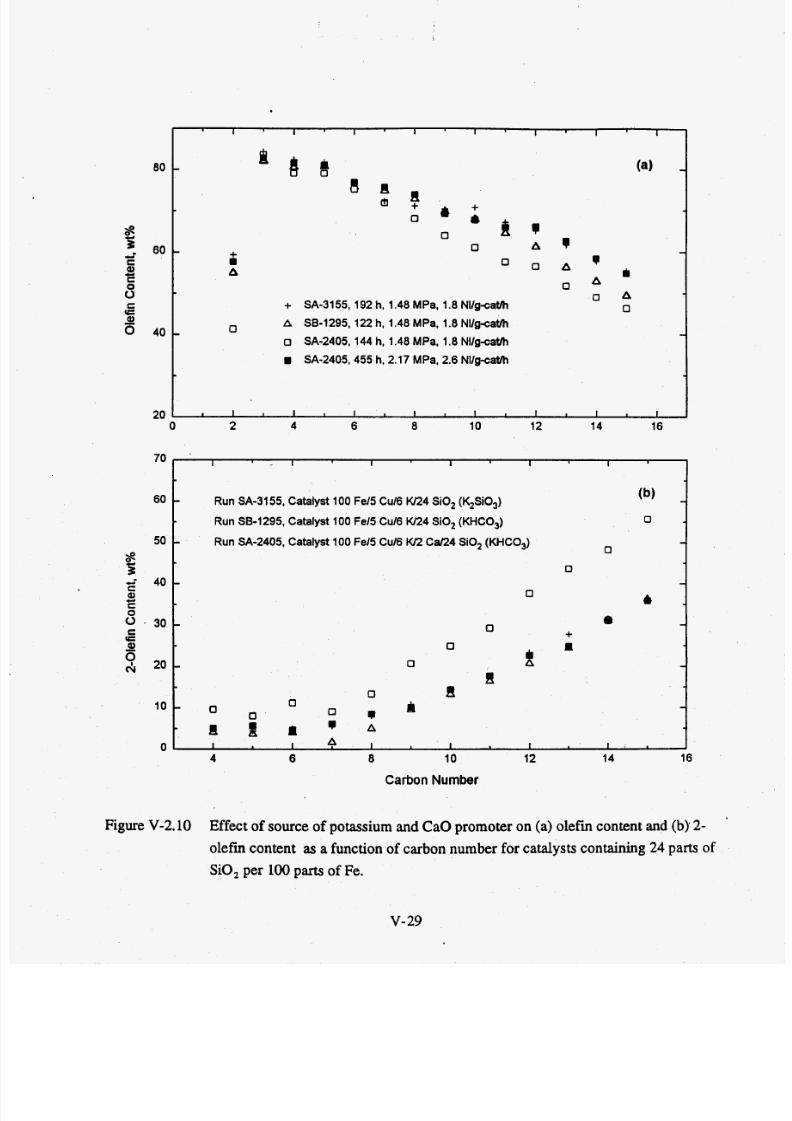
7/28/2019 808495(1).pdf
http://slidepdf.com/reader/full/8084951pdf 122/240
80
&?' 0 -
w3
w-c
E
8Esa3
6 4 0 -
20
I I I I I 1
I I I I I I I I
- 9 8 (a) -
U nb f !
0 & ; b y0 A I -
vI
0 6
' O AA
o A
+ SA-3155, 192 h, 1.48 MPa, 1.8 Nllg ca th 0
A SB-1295, 122 h, 1.48 MPa, 1.8 Nllg-caVh
o SA-2405, 144 h, 1.48 MPa, 1.8 Nllg-catlh
I SA-2405,455 h, 2.17 M Pa, 2.6 Nllg-caVh
0 -
I I I I I I t I ..
Run SA-3155, Catalyst 100 Fe15 Cu16 tV24 SiO, (K,SiO,)
Run SB-1295, Catalyst 100 Fe15Cu16 w24 SiO, (KHCO,)
Run SA-2405, Catalyst 100 Fe15 Cu16 K/2 (2-4 SiO, (KHCO,)0
50
6o
i40
30
20
10
0
0
- -4
-
a
+M
0
I0
- 0 A -8
0 III
R i l l AI I A I I I I
0 -0 O I
-
Figure V-2.10 Effect of source of potassium and CaOpromoter on (a) ole fii content and (b) 2-
olefin content as a function of carbon number for catalysts containing 24 parts of
S O , per 100 parts of Fe.
'
V- 29
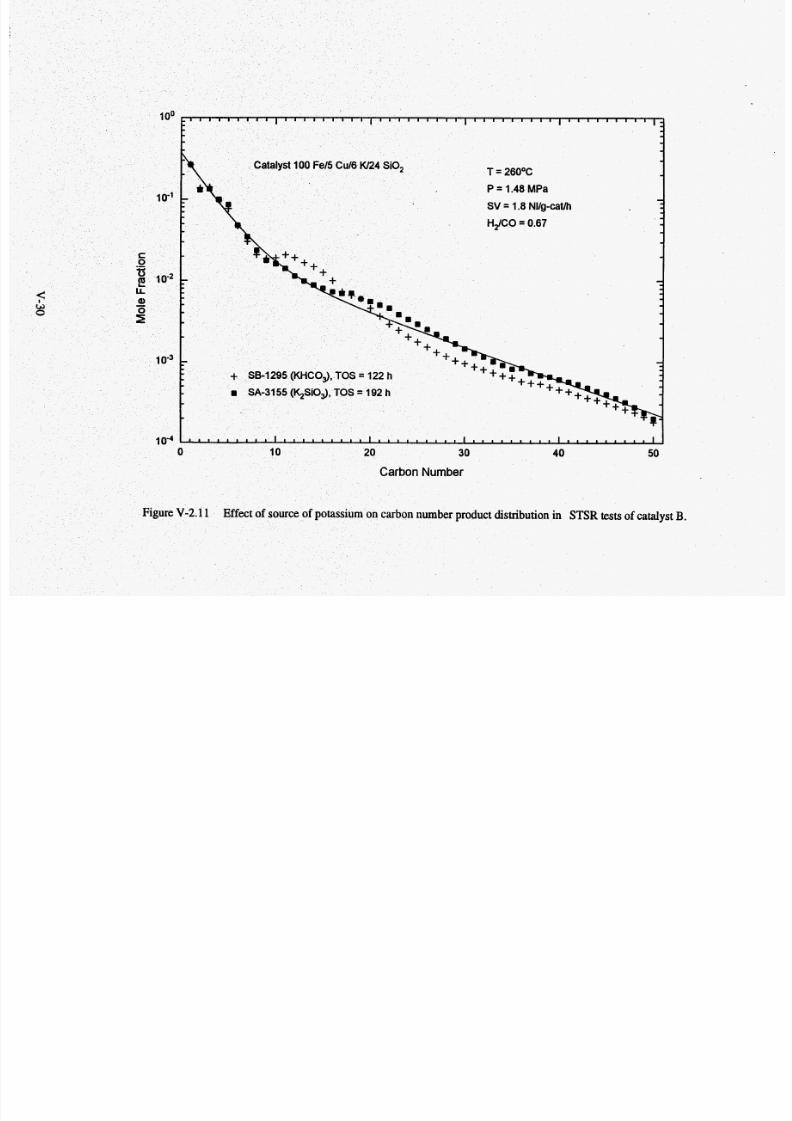
7/28/2019 808495(1).pdf
http://slidepdf.com/reader/full/8084951pdf 123/240
B.
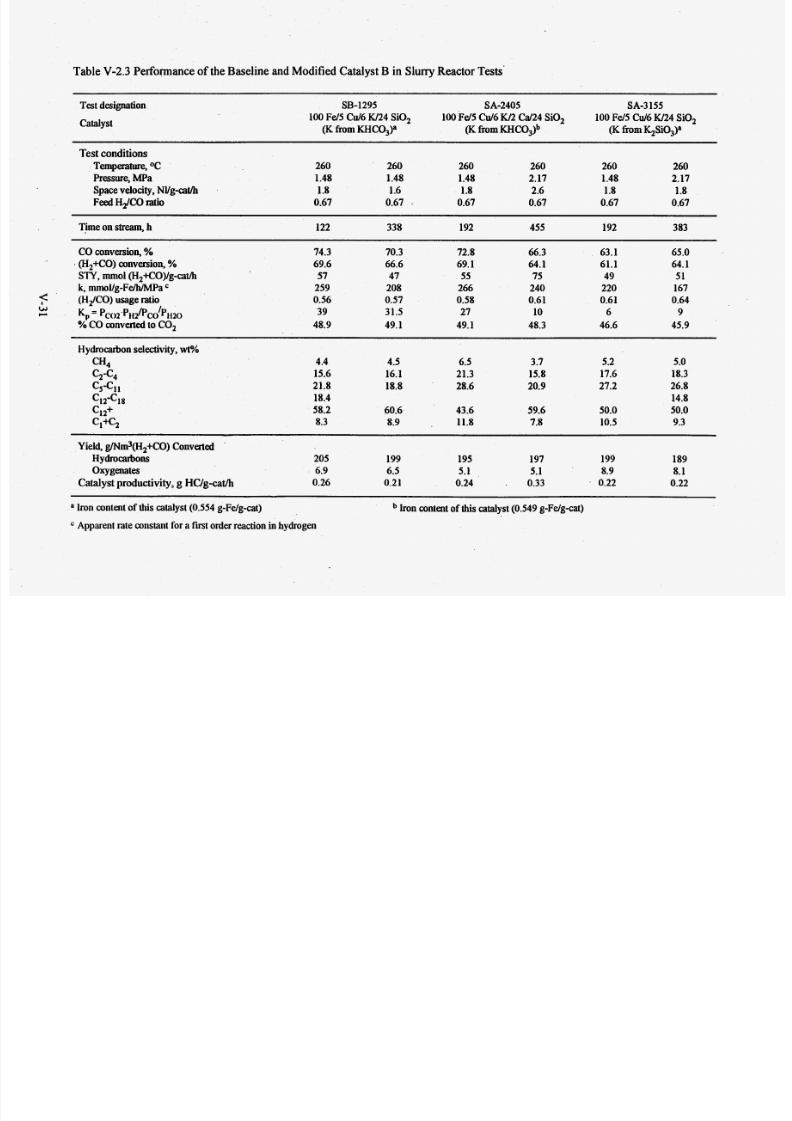
7/28/2019 808495(1).pdf
http://slidepdf.com/reader/full/8084951pdf 124/240
Table V-2.3 Performance of the Baseline and Modified Catalyst B in Slurry Reactor Tests
Test designation
catalyst
SB-1295 SA-2405 SA-3 155
100Fd 5 Cd 6 W24 SiO, 100Fd5 Cu/6K/2 W24 SiO,(K from KHC03)a (K from KHC03)b (K fromK$i03)a
100Fd5 Cd6 W24 SiO,
Test conditionsTemperature, OC
Pressure, MPa
Space velocity, NVg-cathFeedHdCO mtio
260
1.48
1.80.67
260 260
1.48 1.48
1.6 1.80.67 . 0.67
260
2.17
2.60.67
260
1.48
1.80.67
260
2.17
1.80.67
Time on stream, h
~~ ~
122 338 192 455 192 383
CO conversion, %(H,+CO) conversion,%
k,mmoUg-Fe/NMPa
(HiCO) usage ratio
% CO convemd IO C 0 2
STY,mmol (H,+CO)/g-cat/h
K, = P C 0 2 ~ ~ , i ~ C 0 ~ P ~ * 2 0
74.3 70.3 72.8 66.3 63.1 65.0
69.6 66.6 69.1 64.1 61.1 64.1
57 47 55 75 49 51
259 208 266 240 220 167
0.56 0.57 0.58 0.61 0.61 0.64
39 31.5 27 10 6 9
48.9 49.1 49.1 48.3 46.6 45.9
Hy dr od on selectivity,wt%
CH4
c2-c4
c5-c11
12-18
c12+
Cl+C2
4.4
15.6
21.818.4
58.2
8.3
4.5
16.1
18.8
60.6
8.9
6.5
21.3
28.6
43.6
11.8
3.7
15.8
20.9
59.6
7.8
5.2
17.6
27.2
50.0
10.5
5.0
18.3
26.814.8
50.0
9.3
Yield, g/Nm3(H2+CO)ConvertedHydro&ons
oxygenates
Catalystproductivity, g HC/g-cat/h
205
6.9
0.26
199
6.5
0.21
195
5.1
0.24
197
5.1
0.33
199
8.9
0.22
189
8.1
0.22
a Iron content of this catalyst (0.554 g-Fe/g-cat)
Apparent rate constant for a fmt order reaction inhydrogen
Iron content of this catalyst (0.549 g-Fe/g-cat)

7/28/2019 808495(1).pdf
http://slidepdf.com/reader/full/8084951pdf 125/240
t of CaO Promotion and Source of Po-
Four catalysts contsiining CaO promoter with nominal comp ositions 100 Fe/3 Cu/4
WxC d1 6 SiO, and 100Fe/5 C d 5 Wx C d2 4 SiO,, where x = 2 or 6, were synthesized and
tested in fixed bed reactors. The major findings from these tests are that the addition of small
amounts of CaO promoter (x = 2) results in the catalyst performance (activity and gaseous
hydrocarbon selectivity) similar to that of the baseline catalysts B and C, whereas the
addition of a larger amount of CaO (x = 6) results in markedly lower catalyst activity in
com parison to the baseline catalysts. Selectivity of the two catalysts with x =E 6, is similar to
that of the corresponding baseline catalysts. On the basis of these results it was decided to
evaluate &o catalysts with x =2 in stirred tank slurry reactors.The 100 Fe/5 C d 5 W2 Cd24 SiO, ca was tested in run SA-2405, nd its
st B in run SB-1295, whereas results
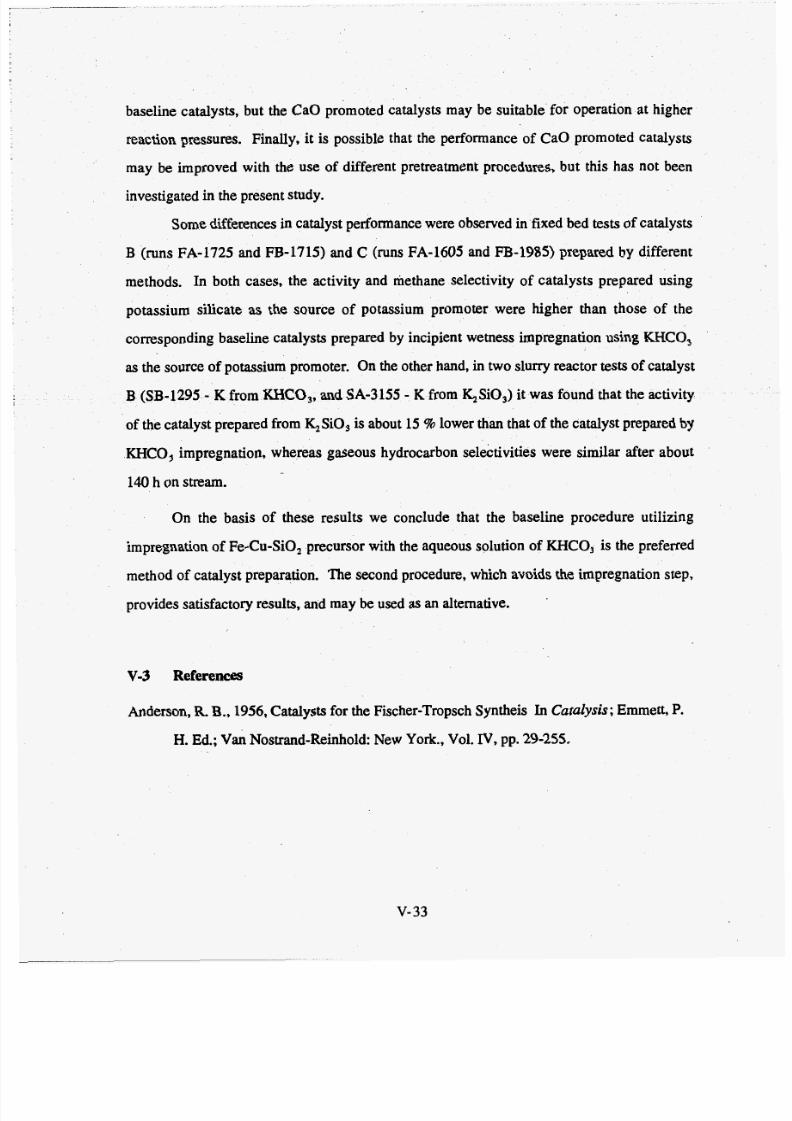
7/28/2019 808495(1).pdf
http://slidepdf.com/reader/full/8084951pdf 126/240
baseline catalysts, but the CaO promoted catalysts may be suitable for operation at higher
reaction pressures. Finally, it is possible that the performance of C aO prom oted catalysts
may be improved with the use of different pretreatment procedures, but this has not been
investigated in the present study.
Some differences in catalyst performance were observed in fixed bed tests of catalysts
B (runs FA-1725 and FB-1715) and C (runs FA-1605 and FB-1985) repared by different
methods. In both cases, the activity and methane selectivity of catalysts prepared using
potassium silicate as the source of potassium promoter were higher than those of the
corresponding baseline catalysts prepared by incipient wetness impregnation using KHCO,
as the source of potassium promoter. On the other hand, in two slurry reactor tests of catalyst
B (SB-1295 - K from KHCO,, and SA-3155 - K from &SO,) it was found that the activity
of the catalyst prepared from & S O , is about 15% lower than that of the catalyst prepared by
KHCO, impregnation, whereas gaseous hydrocarbon selectivities were similar after about
140h on stream.
On the basis of these results we conclude that the baseline procedure utilizing
impregnation of Fe-Cu-SiO, precursor with the aqueous solution of KHCO, is the preferred
method of catalyst preparation. The second procedure, which avoids the impregnation step,
provides satisfactory results, and may be used as an alternative.
V-3 References
Anderson, R B.,1956,Catalysts for the Fischer-Tropsch Syntheis In Catalysis; Emmett, P.
H. Ed.; Van Nostrand-Reinhold: New York., Vol. IV, pp. 29-255.
v-33

7/28/2019 808495(1).pdf
http://slidepdf.com/reader/full/8084951pdf 127/240
V I Pretreatment Effect Research
Studies atPETC
(Pennline et al., 1987; Zarochak and McDonald, 1986, 1987) and inour laboratory with several precipitated iron catalysts (Bukur et al., 1989; 1995a-d; 1996) have
shown that pretreatment procedure may have a marked effect on subsequent catalyst
performance during Fisher-Tropsch synthesis in fwed bed and slurry bed reactors.
Pretreatment conditions (nature of reductant, temperature, duration and gas flow rate) can be
used to alter catalyst activity, hydrocarbon products selectivities and/or to provide a long term
stability. Th e know ledg cacq uired during these studies was utilized to select the baseline
pretreatment conditions in the STSR tests of catalysts B and C. However, the pretreatment
conditions chosen w ere urther improvements in the catalyst
performance could be potentially achieved through the use of a better pretreatment procedure.
The effect of different pretreatment procedures on the performance of catalyst C (100
F d 3 C d 4 W 16 SO,, batch-4) was studied in a STSR, and results from these tests are
described in Section VI-2. In addition to STSR tests, the reduction behavior of catalysts B
(100 Fd5 C d 6 W24 O, , batch-3) and C was studied by thermogravimetric analysis (TGA).
Iron phases in the pretreated catalysts and catalysts withdrawn from slurry reactor tests were
determined by XRD and Mossbauer effect spectroscopy (Section VI- 1)
V I- 1 Catalyst Characterization Studies
In order to simulate the actual pretreatment conditions followed in Fischer-Tropsch
synthesis, isothermal reductionlor pretreatment experiments were conducted with catalysts B,
C and Ruhrchemie (100 Fd5 Cd4.2 W25 SiO,). After each isothermal pretreatment the
catalysts were passivated (see Appendix 2) and characterized by XRD, and in some cases their
surface areas were determined by single point BET measurements (Micmmeritics Pulse
Chemisorb 2705 unit). Iron phases in pretreated and used catalysts from slurry reactor tests
were determined by XRD and M ossbauer effect spectroscopy (MES).
VI- 1
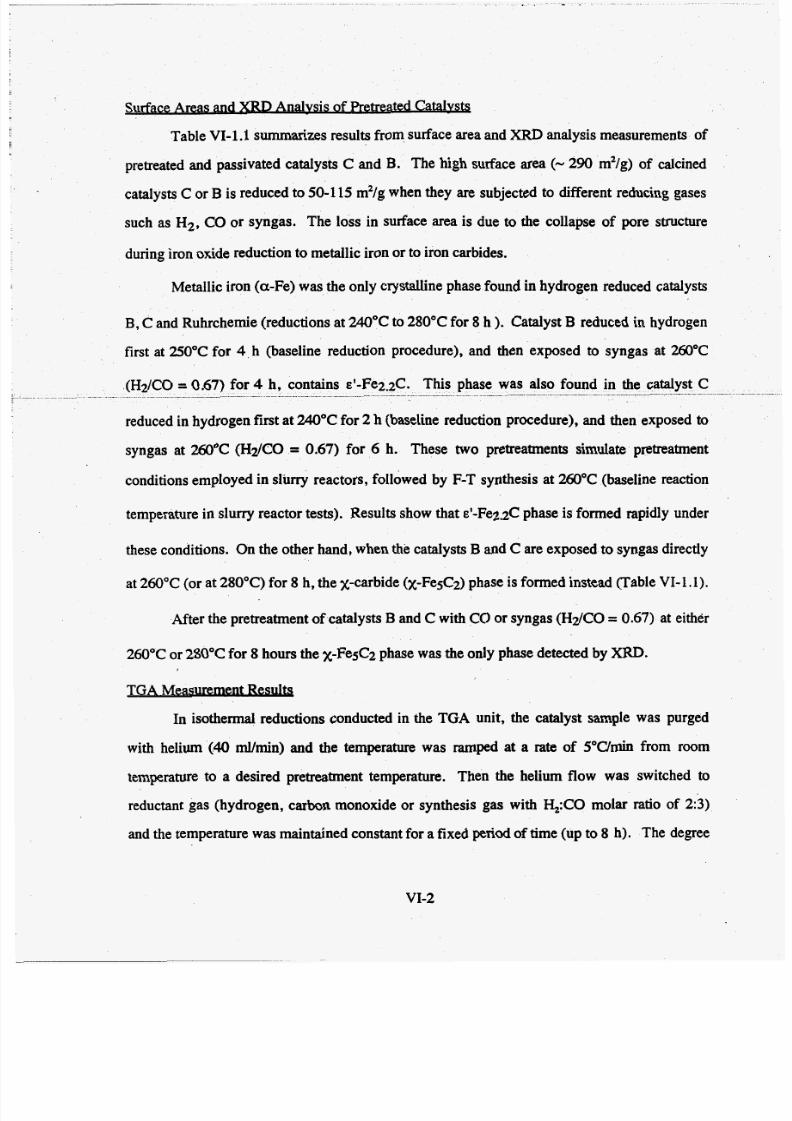
7/28/2019 808495(1).pdf
http://slidepdf.com/reader/full/8084951pdf 128/240
Surface Areas and XRD m v s i s of Pretreated Catalvs&
Table VI-1.1 summ arizes results from surface area and XRD nalysis measurements of
pretreated and passivated catalysts C and B. The high surface area (- 290 m2/g) of calcined
catalysts C or B is reduced to 50-1 15 m2/g when they are subjected to different reducing gases
such as H2, CO or syngas. The loss in surface area is due to the co llapse of pore structure
during iron oxide reduction to m etallic iron or to iron carbides.
Metallic iron (a -Fe) was the only crystalline phase found in hydrogen reduced catalysts
B, and Ruhrchemie (reductions at 240°C to 280°C for 8 h ). Catalyst B reduced in hydrogen
first at 250°C for 4 h (baseline reduction procedure), and then exposed to syngas at 260°C
(H2/CO = 0.67) or 4 h, contains ~'-Fe2.2C. This phase-
reduced in hydrogen first at 240°C fo r 2 h (baseline reduction procedure), and then exposed to
syngas at 260°C (H2/CO = 0.67) or 6 h. These two pretreatments simulate pretreatment
conditions employed in slurry reactors, followed by F-T synthesis at 260°C (baseline reaction
temperature in slurry reacto r tests). Results show that ~'-Fe2.2 C hase is formed rapidly under
these conditions. On the other hand, when the catalysts B and C are exposed to syngas directly
at 260°C (or at 280°C) for 8 h, the X-carbide (x-FegC2) phase is formed instead (Table VI-1.1).
After the pretreatment of catalysts B and C with CO or syngas (HdCO = 0.67) at eithkr
260°C or 280°C for 8 hours the x-FegC2 phase was the only phase detected by XRD.
T T .
In isothermal reductions conducted in the TGA unit, the catalyst sample was purged
with helium (40ml/min) and the temperatwe was ramped at a rate of 5"C/mh from room
temperature to a desired pretreatment temperature. Then the helium flow was switched to
reductant gas (hydrogen , carbon monoxide or synthesis gas with &:CO molar ratio of 2:3)
and the temperature was maintained constant for a fixed period of time (up to 8 h). The degree
VI-2
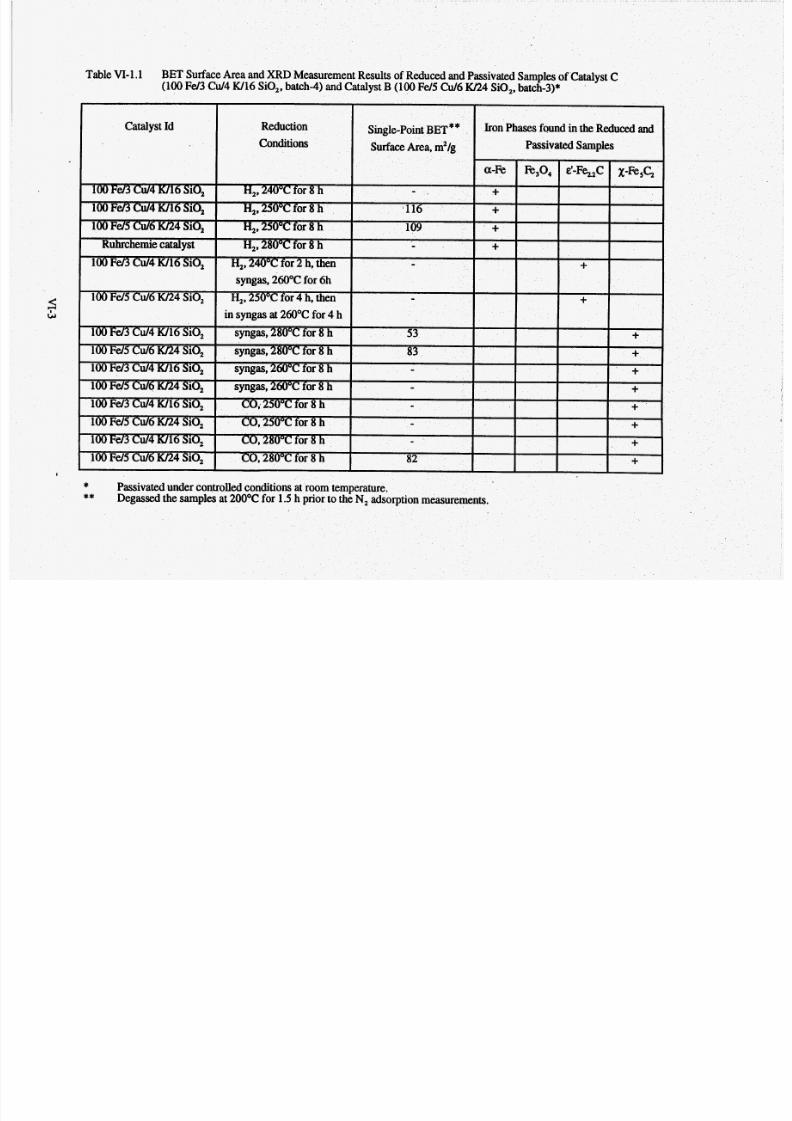
7/28/2019 808495(1).pdf
http://slidepdf.com/reader/full/8084951pdf 129/240
Table VI- 1.1 BET Surface Area and XRD M easurement Results of Reduced and PassivatedSamples of Catalyst C(100 Fd3 Cu/4 W16 SO ,, batch-4) and Catalyst B (100Fd5 Cu/6 IU24 SiO,, batch-3)*
Catalyst Id
L;c
100 Fd 5 Cu/6 U2
Reduction
Conditions
H,* 240"C or 8 hH2, 250"C for 8 h
H2,250"C for 8 h
HP 280°C for 8 h
5 9 40"C f or 2 h, then
syngas, 260°C for 6h
H,, 50°C for 4 h, then
in syngas at 260°C for 4 h
syngas, 280°C for 8 h
syngas, 280°C for 8 h
w ga s , 260°C for 8 h
syngas, 260°C for 8 hCO,250°C for 8 h
CO, 250°C for 8 h
CO, 280°C for 8 h
CO, 280°C for 8 h
II
***
Passivated under controlled conditions at room temperature.Degassed the samples at 200°C fo r 1.5 h prior to the N, adsorption m easurements.

7/28/2019 808495(1).pdf
http://slidepdf.com/reader/full/8084951pdf 130/240
of reduction was calculated from experimental weight loss vs. time data, and the theoretical
weight loss based on the known composition and mass of a sample.
Figure VI-1.1 shows the effect of reduction temperature (240 to 2 8 0 O C ) on the
reduction behavior of catalyst C in the TGA unit in pure hydrogen under isothermal conditions.
The degree of reduction of catalyst C at 240 and 250°C in hydrogen increased gradually with
time and after 8 hours was about 60%. During reduction at 280°C the degree of reduction
increased rapidly during the firs t 10 0 minutes of hydrogen exposure and then leveled off with
further exposure to hydrogen. The degree of reduction was about 65% after the first 100
minutes of reduction period; and about 80% at the end of reduction period (after 450 minutes
in hydrogen). These results show that the reduction of iron catalysts increases with the
increase of reduction temperature. Even though these results indicate that the reduction is not
complete, the XRD nalysis of passivated samples revealed only the presence of metallic iron.
Figure VI-1.2 shows the effect of reduction temperature (250 and 280°C) on the
reduction behavior of catalyst B (100 Fe/5 Cd6 W24 iO,, batch-3) in hydrogen. As expected
the final degree of reduction is higher a t higher reduction temperature (80% at 280°C vs. 60%
at 250°C). From Figures VI-1.1 and VI-1.2 it appears that the reduction behavior of catalystsC and B is similar at both reduction temperatures of 250°C and 280°C. However, the reduction
behavior of the Ruhrchemie catalyst at 280°C is similar to that of catalyst B or C reduced at
250°C. Apparently, he catalysts B and C (synthesized in our laboratory) are easier to reduce
than the Ruhrchemie catalyst.
Figure VI-1.3 illustrates the effect of temperature (250 and 280°C) on the weight
changes of catalyst C during CO retreatment. Note that the catalyst had lost about 3 4 % of
initial sample weight during the heating in helium (from room temperature to a reduction
temperature) due to removal of adsorbed moisture. The weight loss is rapid during the first
100 minutes of exposure to CO. The resulting weight loss may be due to three different
reactions occurring simultaneously on the catalyst surfacelor in the bulk. The possible
reactions are reduction of iron oxide to metallic iron or magnetite, carbon deposition (v ia
V I 4
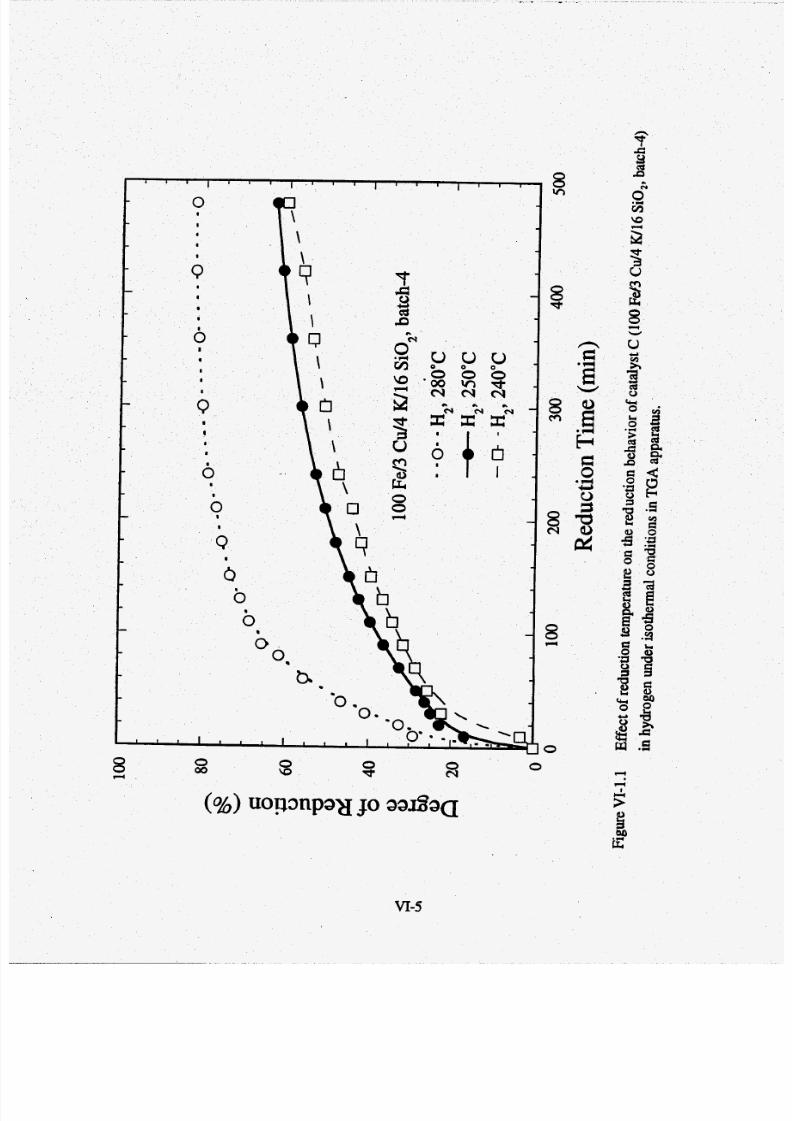
7/28/2019 808495(1).pdf
http://slidepdf.com/reader/full/8084951pdf 131/240
VI-5
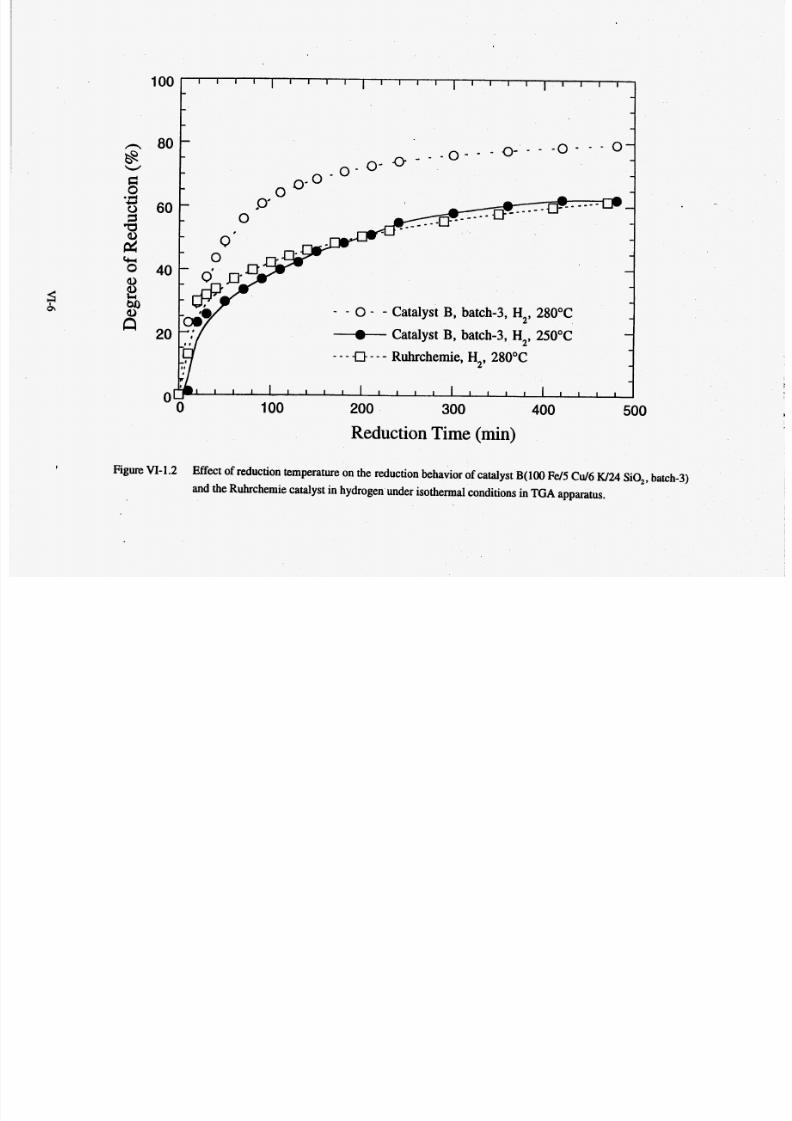
7/28/2019 808495(1).pdf
http://slidepdf.com/reader/full/8084951pdf 132/240
I
100 1 1 1 1 ~ 1 1 1 1 ( 1 ~ ~ ~I I I I I 1 I I
- -- -- -
Figure VI-1.2 Effect of reduction temperature on the reduction behaviorof catalyst B(100 FdS C d 6 W24 iO,, batch-3)
and the Ruhrchemie catalyst in hydrogen under isothermal conditions inTGA pparatus.
f i 80 - 0- - - - 0 - - 0 --Is -W - -
-_ _ - - - -S - - V
--
--
-- - 0 - - Catalyst B, batch-3, H2, 280°C
+ atalyst B, batch-3, H2,5OOC
Ruhrchemie, H2, 280°C--c)---
-----
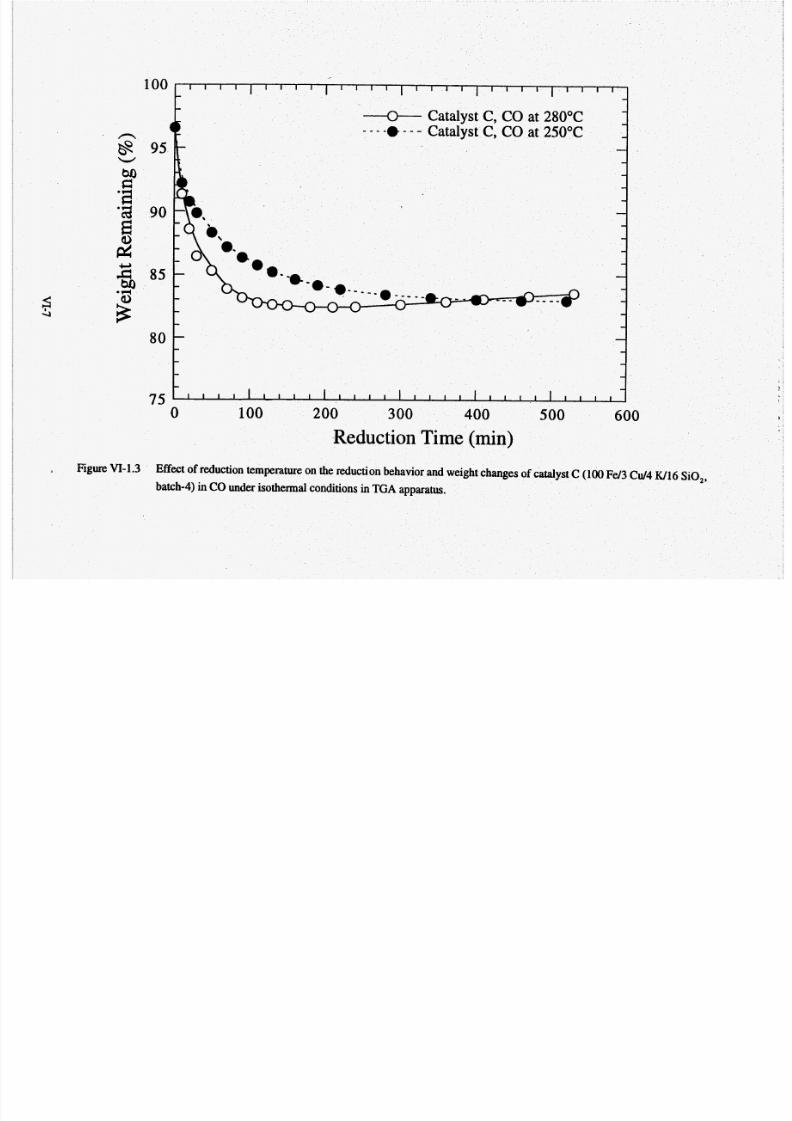
7/28/2019 808495(1).pdf
http://slidepdf.com/reader/full/8084951pdf 133/240
Figure VI- .3
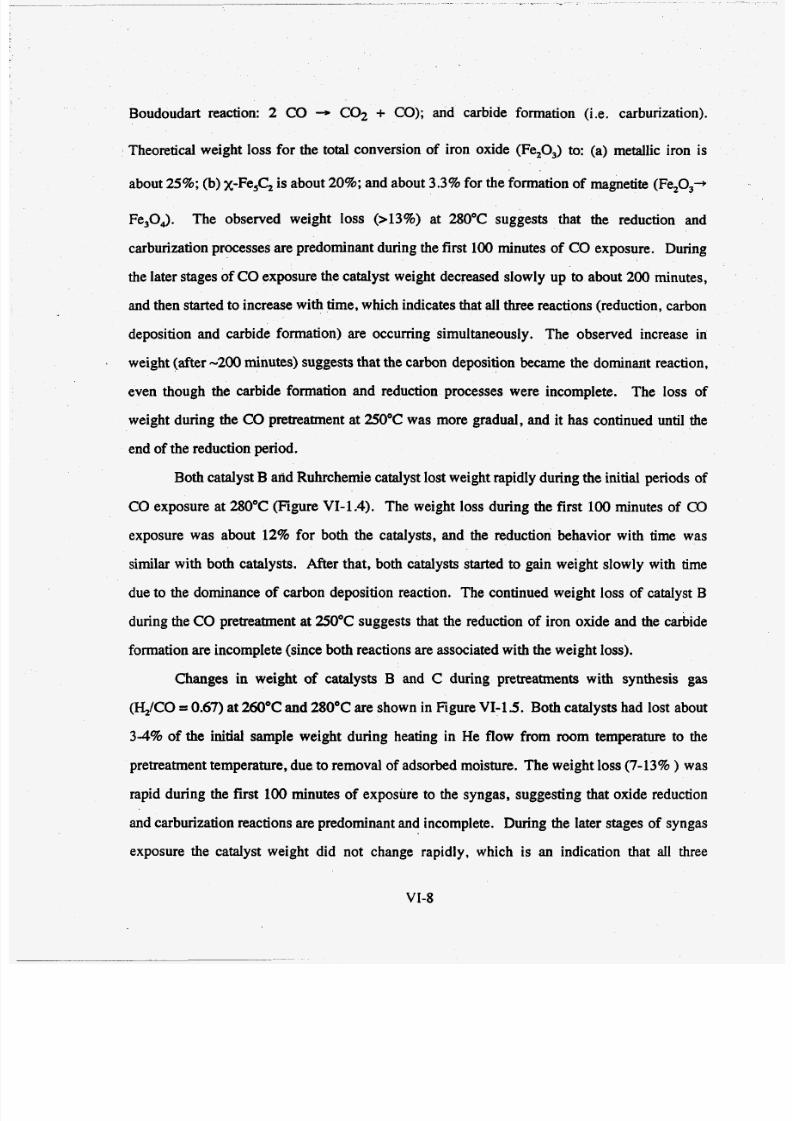
7/28/2019 808495(1).pdf
http://slidepdf.com/reader/full/8084951pdf 134/240
Boudoudart reaction: 2 CO ---z C02 + CO); and carbide formation (i.e. carburization).
Theoretical weight loss fo r the total conversion of iron oxide (Fe,O,) to: (a) metallic iron is
about 25%;(b) x-Fe,C, is about 20%; nd about 3.3% for the form ation of magnetite (Fe,03+
Fe30,). The observed weight loss (>13%) at 280°C suggests that the reduction and
carburization processes are predominant during the first 100 minutes of CO exposure. During
the later stages of COexposure the catalyst weight decreased slowly up to about 200 minutes,
and then started to increase with tim e, which indicates that all three reactions (reduction, carbon
deposition and carbide formation) are occurring simultaneously. The observed increase in
weight (after-200minutes) sugges ts that the carbon deposition became the dominant reaction,
even though the carbide formation and reduction processes were incomplete. The loss of
weight during the CO pretreatment at 250°C was more gradual, and it has continued until the
end of the reduction period.
Both catalyst B nd Ruhrchemie catalyst lost weight rapidly during the initial periods of
CO exposure at 280°C (Figure VI-1.4). The weight loss during the first 100 minutes of CO
exposure was about12%
for both the catalysts, and the reduction behavior with time wassimilar with both catalys ts. After that, both catalysts started to gain weight slowly with time
due to the dominance of carbon deposition reaction. The continued weight loss of catalyst B
during the CO pretreatment at 250°C suggests that the reduction of iron oxide and the carbide
formation are incomplete (since both reactions are associated with the weight loss).
Changes in weight of catalysts B and C during pretreatments with synthesis gas
(IiLJCO = 0.67)at 260°C and 280°C are shown in Figure VI-15. Both catalys ts had lost about
3 4 % of the initial sample weight during heating in He flow from mom temperature to the
pretreatment temperature, due to removal of adsorbed moisture. The weight loss (7-13% ) was
rapid during the first 100 minutes of exposure to the syngas, suggesting that oxide reduction
and carburization reactions are predominant and incomplete. During the later stages of syngas
exposure the catalyst weight did not change rapidly, which is an indication that all three
VI-8
7/28/2019 808495(1).pdf
http://slidepdf.com/reader/full/8084951pdf 135/240
sb
- I I I I I l l 1 I I I I 1 1 1 1 1 1 1 1 1 1 1 I I -
n
Figure VI-
100
95
90
8 5
8 0
75
1.4
+ atalyst B , CO at 250°CI - - -*- - Catalyst B, CO at 280°C- - -0- - Ruhrchemie, CO at 280°C
W24 iO,;

7/28/2019 808495(1).pdf
http://slidepdf.com/reader/full/8084951pdf 136/240
1 1 1 1 ~ 1 1 1 1 ~ ~ ~ ~ ~l l 1 I l l 1-
- - 0 - - Catalyst C, Syngas at 260°C
+- Catalyst C, Syngas at 280°C
- - - -D - - Catalyst B, Syngas at 260°C
, Catalyst B, Syngas at 280°C
-
---
85
- I T - - --0 -
- -a -- a -
-8-
- - -
e
Reduction Time (min)
Figure VI-1.5 Comparison of reduction behavior and weight changes of catalystC 10 0 Fd3 Cu/4W16 SO,, batch-4) and catalyst B
(100 Fd 5 C d 6 K/24 SiO,, batch-3) in syngas (HJCO =0.67) under isothermal conditions inTGA pparatus.
7/28/2019 808495(1).pdf
http://slidepdf.com/reader/full/8084951pdf 137/240
reactions (reduction of iron oxides; carbon deposition and carbide formation) were occurring
simultaneously. How evei, a gradual increase in weight was observed in all the cases, and this
suggests that carbon deposition became the dominant reaction, even though the carbide
formation and iron oxide reduction were incomplete.
Figure VI- .6 llustrates the weight loss behavior of catalysts B and C xposed first to
hydrogen (at 250°C or4 - catalyst B; or at 240°C fo r 2 - catalyst C), and then to syngas
(H2/C00.67) t 260°C. hese two pretreatments simulate pretreatment conditions employed
in slurry reactors (reduction in hydrogen), followed by F-T ynthesis at 260°C. Again, the
initial weight loss of about 3% , is due to loss of moisture during heating in helium from room
temperature to the reduction temperature. During the reduction in hydrogen , the weight loss
was very rapid during the first 20 minutes, and then continued to increase gradually reaching
approximately 10% (catalyst C at 120 minutes) and 13% (catalyst B at 240 minutes).
Theoretical weight losses for reduction of FQQ to Fes04 , and Fe, a re approximately 3.3% and
22%, respectively. Experimental weight losses at the end of hydrogen reduction imply that
both catalysts, at t h i s reduction stage, were not completely reduced to metallic iron. Upon the
catalysts exposure to syngas, the weight remaining of catalyst B began to increase rapidly
(about 2.5% in 100minute s), and then more s lowly, while the catalyst C ontinued to loose
weight initially (about 1% in 1 0 0 minutes), but eventually its weight also started to increase
slowly with time. The sharp increase in weight remaining of the catalyst B after exposure to
syngas suggests that carburization and carbon deposition were the predominant reactions. In
the case of catalyst C, reduction of magnetite was the dominant reaction during the first 100
minutes in syngas, whereas the carbide formation and the carbon deposition were dominant
reactions afterwards.
Iron Phases in Pretre@d and Used Catalvst C from Slum Reactor Test s
XRD nd MES results of pretreated and used catalyst C batch-4) samples from stirred
tank slurry reactor in tests are summarized in Table VI-12 and Figures VI- .7 o VI- .9. '
VI- 1
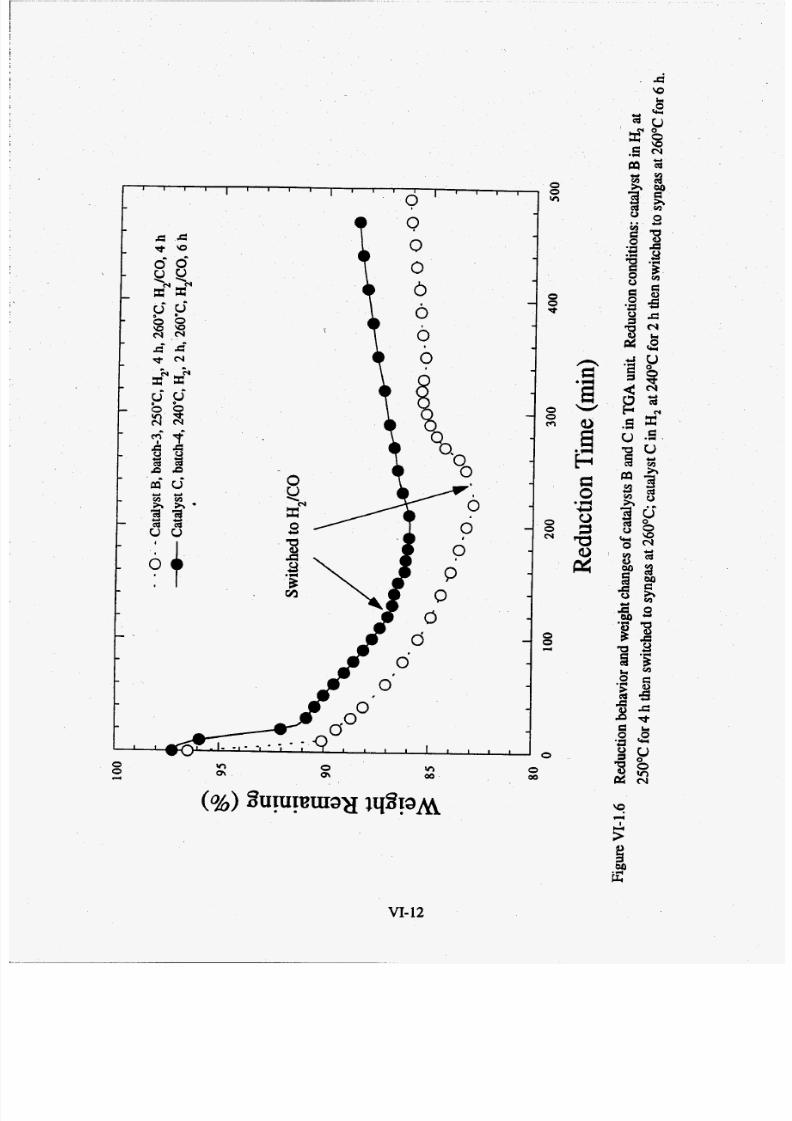
7/28/2019 808495(1).pdf
http://slidepdf.com/reader/full/8084951pdf 138/240
E0*d.c,
2
2 a
VI-12
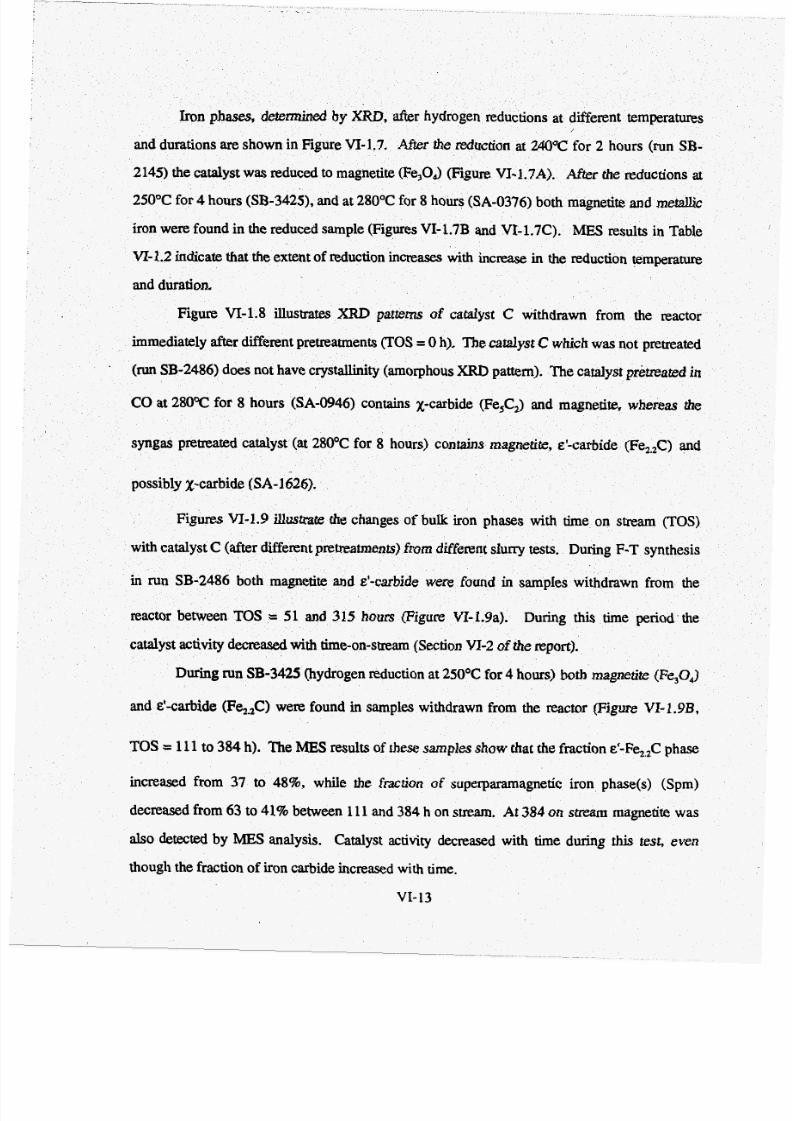
7/28/2019 808495(1).pdf
http://slidepdf.com/reader/full/8084951pdf 139/240
-~
-- -
Iron phases, determined b Oris at different
and durationsare show n in Figure VI- 1.7. After the
2145) the catalyst was reduced to magnetite (Fe304)(
25OOC for 4 hours (SB-3425). and at 280°C for 8 hours (SA-0376) both magnetite and metallic
iron were found in the reduced sample (Figures VI-1.7B and VI-1.7C). MES results in Table
VI-1.2 indicate that the extent of reduction increases with increase in the reduction temperature
and duration.
tion at 2400cor hou
l.7*)* After the
Figure VI-1.8 illustrates XRD patterns of catalyst C withdrawn from the reactor
immediately after different pretreatments (TOS =0 h). Th e catalyst C which was not pretreated
(run SB-2486) does not have crystallinity (amorphousXRD pattern). The catalyst pretreated in
syngas pretreated catalyst (at
possibly x-c
fo r 8 hours) contains magnetite, &'-carbide (Fe2.2C) an
Figures VI-1.9 illustrate the changes of bulk iron phases with time on stream (TOS)
with catalystC (after different pretreatmen
agnetite and E'-c were found in samples w ithdrawn fmn the
During this time period theeactor between TOS = 51 and 315 hours (Figure VI-1.9a).
catalyst activity decreasedwith ime-on-stream (Section VI-2 of the report).
During run SB-3425 (hydrogen reduction at 25OOC for 4 hours) both magnetite (Fe,O,)
and &'-carbideFe2,C) were found in samples withdrawn from the reactor (Figure VI-l.9B,
TOS = 111 o 38 4 h). The MES results of these sam ples show that the fraction &'-Fe,,C phase
increased from 37 to 48% while the fraction of superparamagnetic iron phase(s) (Spm )
decreased from 63 to 41% between 111and 384 h on stream. At 384 on stream magnetite was
also detected by MES analysis. Catalyst activity decreased with time during this test, even
though the fraction of iron carbide increased with time.

7/28/2019 808495(1).pdf
http://slidepdf.com/reader/full/8084951pdf 140/240
Table VI-1.2 X-ray Diffraction and MES Results of Pretreated and Used Samples (Catalyst C:100 Fd3 Cu/4 W16 SiO,, batch-4)
stream
(TOS),067145213401
402@OR)0
1112333303840
1342303500511001472603150
113
2293544275630
137258403
~ ~~
RunNumberSB-2145
Phases Identified by M ssbauer
69 (Spm), and 31% (F%04)
48 (Sprn), 24% (Fe304), 4% (&'-Fe,C) and 14% (Fe,C;)
Phases Identified by XRD
R304,nd e'-Fe,C304
63 (Spm) and 37% (e'-Fe,C)65 (Spm) and 35% (E'-Fe,C)
R304,nd &'-Fe,CR304,and &'-Fe,C
55 (Spm) and 45% (&'-Fe,C) R 3 0 4 , and &'-Fe,c54 (Spm), 3% (Fe,O,), 39% (d-Fe,,C) and4%@e,C) R,O,. andE'-Fe,,C
76%(Spm) and 22% (a-Fe) k304mda-Fe63% (Spm) and 37% (&'-Fe,C) R304,and d-Fe,C52% (Spm) and48% (&'-Fe,C) , R304, and d-Fe,C53% (Spm) and 47% (&'-Fe,C) R304,ndE'-Fe,C
41% (Spm), 11%( Fe,O,) and488 (&'-Fe,,C) R,O,. andd-Fe,,CR304nd a-Fe9%(Spm)and 31%(a-Fe)
54% (Spm), 25% (&'-Fe,C) and 21% (Fe,C;) k 3 0 4 , and E'-Fe,C
R304,nd E'-Fe,C
R304,nde'-Fe,C
R,O, , and E'-Fe,,CR304, ~IXI Fe,C,R304nd Fe,C,
R304ndFe,C,R304nd Fe,C,R304nd Fe,C,RaOA, and Fe,C,
- R304,nd E'-Fe,CR304,nd &'-Fk,Ck 3 0 4 , and &'-Fe,CR,O,. andE'-Fe,,C
48% (Spm), 42% (&'-Fe,C) and 10%(FGC;) E'-Fe,C
34% (Spm), 7% (Fe,O.,). 50% (E'-Fe,,C) and 9%(Fe,C,) RqO,. and E'-Fe,,C
- R304,nde'-Fe,C
R304,nd &'-Fe,C
58% (Spm) and 42% (Fe,G)54% (Spm) and 46% (Fe,CJ
55% (Spm) and45% (Fe,CJ45% (Spm) and 55 % (Fe,CJ41% (Spm) and 59% (Fe,C;)
37% (Spm), 24% (Fe,O,), 27% (&'-Fe,,C) and 12% (Fe,C,)
SB-3425
SB-2486
sA-1626
Pretreatmentconditions
H,, 240°C 2 h
H,, 50°C, 4h
H,, 280°C, 8h
No Retreatment
CO, 280°C, 8h
HJCO, 28OOC, 8 h
Timeon I I i
EOR stands forend of the run sample which was exposed to air; TOS=0 h means reduced sample.
f l S process conditions forthe slurry testswith catalyst C (100 Fd 3 Cu/4 W16 SiO,, batch-4) were: T = 26OoC,P = 1.48 - 2.17 MPa,
H,/CO = 0.67. SV = I .4 - 2.6 NVg-cam.
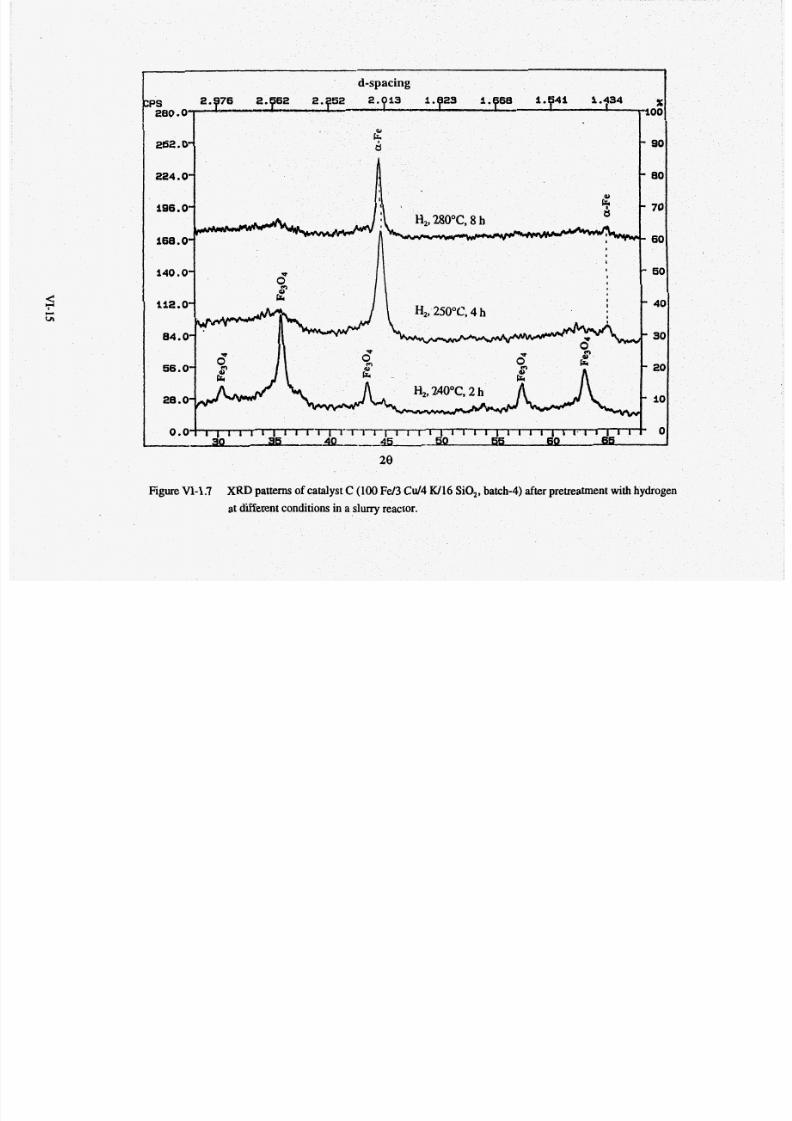
7/28/2019 808495(1).pdf
http://slidepdf.com/reader/full/8084951pdf 141/240
d-spacing
xPs 2. 76 2.762 2.952 2.p13 l.fI23 1.768 i . f i 4 i 1.434
280.0’ E 100
q252.0- 8 - 90
I
224.0’ - 80
6 - 70896.0-
- 60
,
I
I
I
*I
I
I - 6040.0-I
I - 40
- 30
- 20
- 10
Figure VI-1.7 XRD patterns of catalyst C (100 Fd3 C d 4 W16 SiO,, batch-4) after pretreatment with hydrogen
at different conditions in a slurry reactor.
7/28/2019 808495(1).pdf
http://slidepdf.com/reader/full/8084951pdf 142/240
VI-16
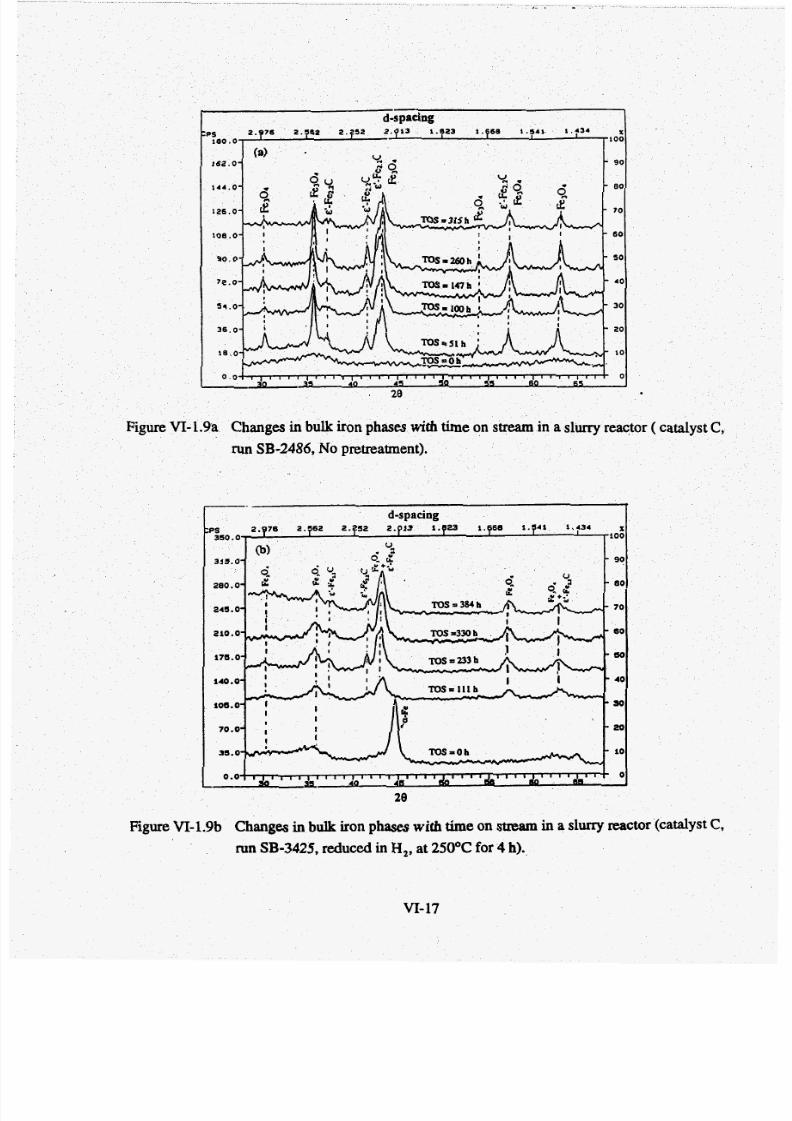
7/28/2019 808495(1).pdf
http://slidepdf.com/reader/full/8084951pdf 143/240
Figure VI-1.9a Changes in bulk iron phases with time on stream in a slurry reactor ( catalyst C,
run SB-2486, No pretreatment).
20
Figure VI-1.9b Changes in bulk iron phases with time on stream in a slurry reactor (catalyst C,
run SB-3425, reduced in H,, at 25OOC for 4 h).
VI- 17
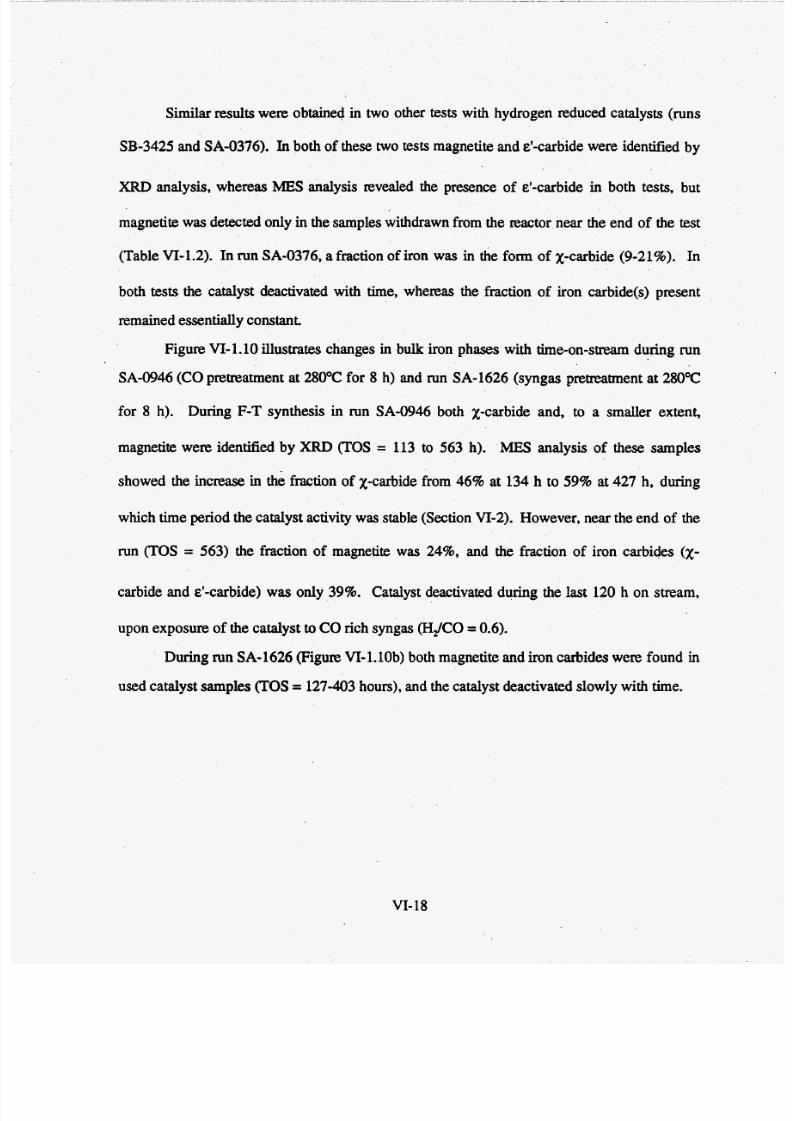
7/28/2019 808495(1).pdf
http://slidepdf.com/reader/full/8084951pdf 144/240
Similar results were obtained in two other tests w ith hydrogen reduced catalysts (runs
SB-3425 and SA-0376). In both of these two tests magnetite and &'-carbidewere identified by
XRD analysis, whereas MES analysis revealed the presence of &'-carbide in both tests, but
magnetite was detected only in the samples withdrawn from the =actor near the end of the test
(Table VI-1.2). In run SA-0376, a fraction of iron was in the form of x-carbide (9-21%). In
both tests the catalyst deactivated with time, whereas the fraction of iron carbide(s) present
remained essentially constant.
Figure VI-1.10 illustrates changes in bulk iron phases with time-on-stream during run
SA-0946 (CO pretreatment at 28OOC for 8 h) and run SA-1626 (syngas pretreatment at 28OOC
for 8 h). During F-T ynthesis in run SA-0946 both X-carbide and, to a smaller extent,
magnetite were identified by XRD TOS = 113 to 563 h). MES analysis of these samples
showed the increase in the fraction of X-carbide from 46% at 134 h to 59% at 427 h, during
which time period the catalyst activity was stable (Section VI-2). However, near the end of the
run (TOS = 563) the fraction of magnetite was 24%, and the fraction of iron carbides ( x -
carbide and &'-carbide) was only 39%. Catalyst deactivated during the last 120 h on stream,
upon exposure of the catalyst toCO rich syngas W C O =0.6).
During run SA-1626 (Figure VI-1.lOb) both magnetite and iron carbides were found in
used catalyst samples (TOS = 127-403 hours), and the catalyst deactivated slowly with time.
VI-18
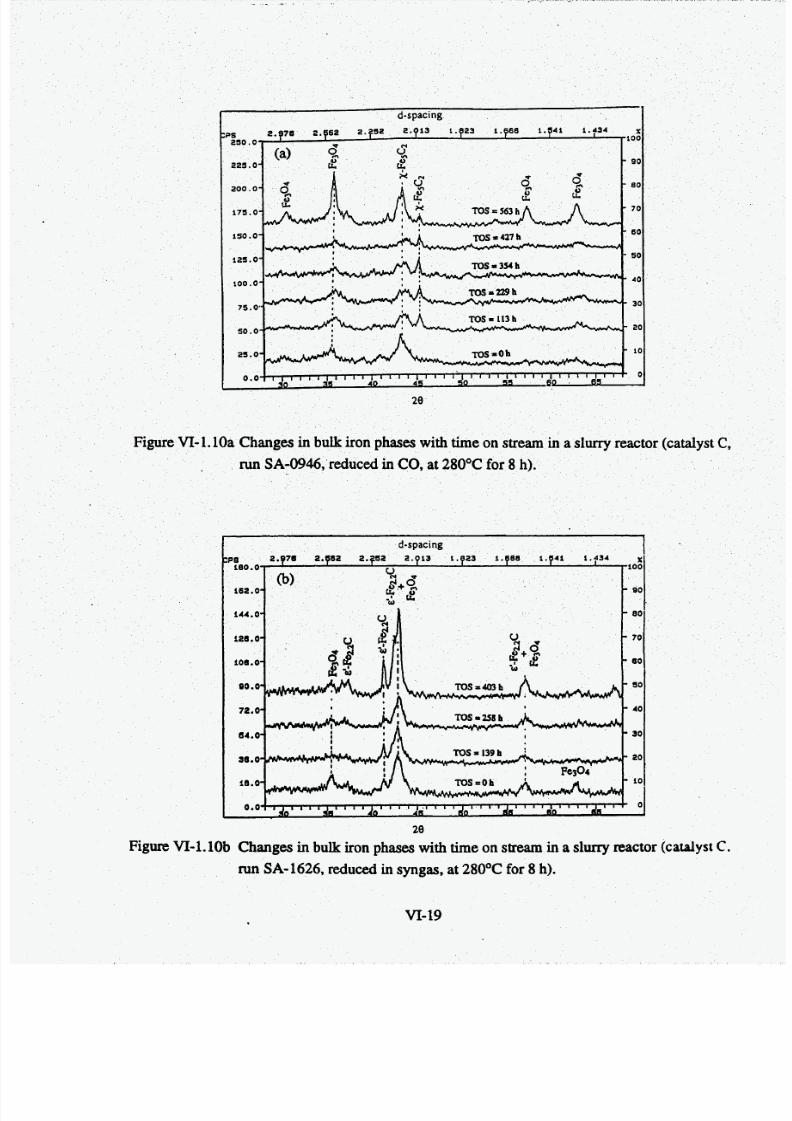
7/28/2019 808495(1).pdf
http://slidepdf.com/reader/full/8084951pdf 145/240
. .
d-spacing
:p s 2.B76 2.762 2.fS2 2.?13 1.723 1.76E 1.p41 1.434 100210.0
- 9022s. -
200.0-
175.0-
150.0'
12s.0-
100.0-
7s.o
so.0-
2s. -
0.0i o
doI I I I I I 1 4 1 I 1 1 I I I 1 1 l & l 1 8 I I I ' '
28
Figure VI- 1.10a Changes in bulk iron phases with time on stream in a slurry reactor (catalystC,
run SA-0946, reduced in CO, at 28OOC for 8 h).
20
Figure VI-1.1Ob Changes in bulk iron phases with time on stream in a slurry reactor (catalyst C.
run SA-1626 , reduced in syngas, at 28OOC for 8 h).
VI-19
7/28/2019 808495(1).pdf
http://slidepdf.com/reader/full/8084951pdf 146/240
V I - 2 Reaction Studies - Pretreatment Effect Research
Seven different pretreatment procedures were employed in stirred tank slurry reactor
tests. Test identifications and pretreatment conditions are listed in Table VI-2.1. Tests SB-
2145 and SA-1665 were completed under task 4 (Reproducibility of Catalyst Preparation), but
selected results from these two tests are included here for comparison purposes. Our standard
(baseline) reduction conditions for the catalyst C were used in these two tests (Le. hydrogen
reduction at 24OOC for 2 hours). The purpose of run SB-1486 was to check reproducibility of
Test
(ID)
SA- 1665
SB-2145
SB-3425
SA-0376
SA-0946
SB-1486
SA- 1626
SA-2 186
SB-2486
results follow ing the CO pretreatment, Le. to repeat pretreatment conditions used in test SA-
Temp. Reductant Duration Pressure Flow rate
("c> (h) WPa) (cm3/min)
240 H2 2 0.78 7500
240 H2 2 0.78 7500
250 H2 4 0.78 7500
280 H2 8 0.7 8 950
280 co 8 0.78 750
280 co 8 0.78 750
280 H /CO = 0.67 8 0.78 750
280 CO/He= 1/ 10 8 1.48 5500
No pretreatment
0946, and obtain results on catalysts activity and selectivity under the same process conditions.
Table VI-2.1 Pretreatment Conditions and Test Designations
Catalyst: 100Fe/3 Cu/4 W16 SiOz
Catalyst loading and particle size in, a l l new tests, were similar to those employed in
previous tests of catalyst C (Le. 10-20 g of catalyst e270 mesh in size in Durasyn 164 oil,
VI-20
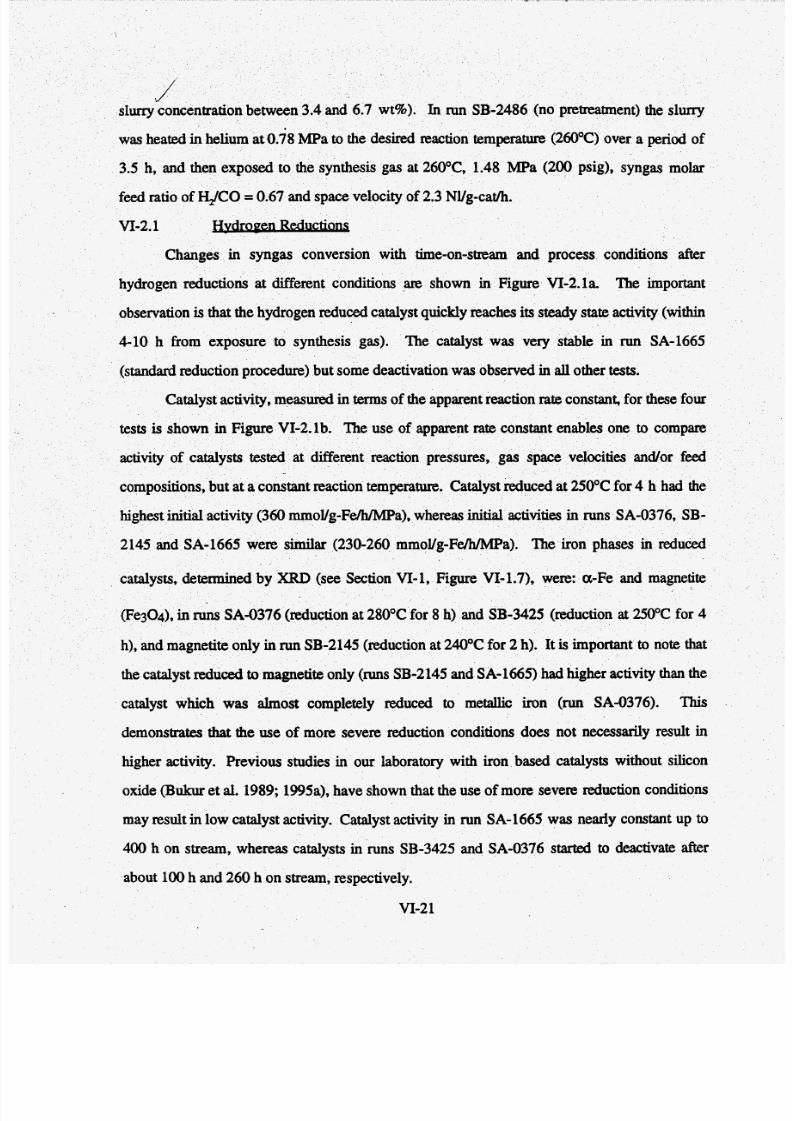
7/28/2019 808495(1).pdf
http://slidepdf.com/reader/full/8084951pdf 147/240
sis gas at 260°C, 1.48 MPa (200 psig), syngas molar
space velocity of 2.3 NYg-cat/h.
VI-2.1
Changes in syngas conversion with time-on-stream and process conditions after
hydrogen reductions at different conditions am shown in Figure VI-2.la. The important
observation is that the hydrogen reduced catalyst quickly reaches its steady state activity (within
4-10 h from exposure to synthesis gas). The catalyst was very stable in run SA-1665
(standard reduction p ) but some deactivation was observed in all other tests.
ured in terms of the apparent reaction rate constant, for these four
t enables one to compareests is sh o
activity of
compositions, but a t a c
highest initial activity (360 mmoVg-FeAdMPa), whe
2145 and SA-1665 were similar (230-260 mmoVg-
ns SA-0376, SB-
XRD see Section VI-1, Figure V1-1.7), were: a-Fe and magnetite
uction at 28OOC for 8 h) and SB-3425 at 250°C fo r 4
B-2145 (reduction a t 240OC fo r 2 h). It is important to note that
the catalyst reduced to magnetite only (runsSB-2145 and SA-1665) had higher activity than the
catalyst which was almost completely reduced to metallic iron (run SA-0376). This
demonstratesthat he use of more severe reduction conditions does not necessarily result in
higher activity. Previous studies in our laboratory with iron based catalysts without silicon
oxide (Bukur et al. 1989; 1995a), have shown that the use of more severe reduction conditions
may result in low catalyst activity. Catalyst activity in run SA-1665 was nearly constant up to
400 h on stream, whereas catalysts in runs SB-3425 and SA-0376 started to deactivate after
about 100h and 260 h on stream, respectively.
!
VI-21
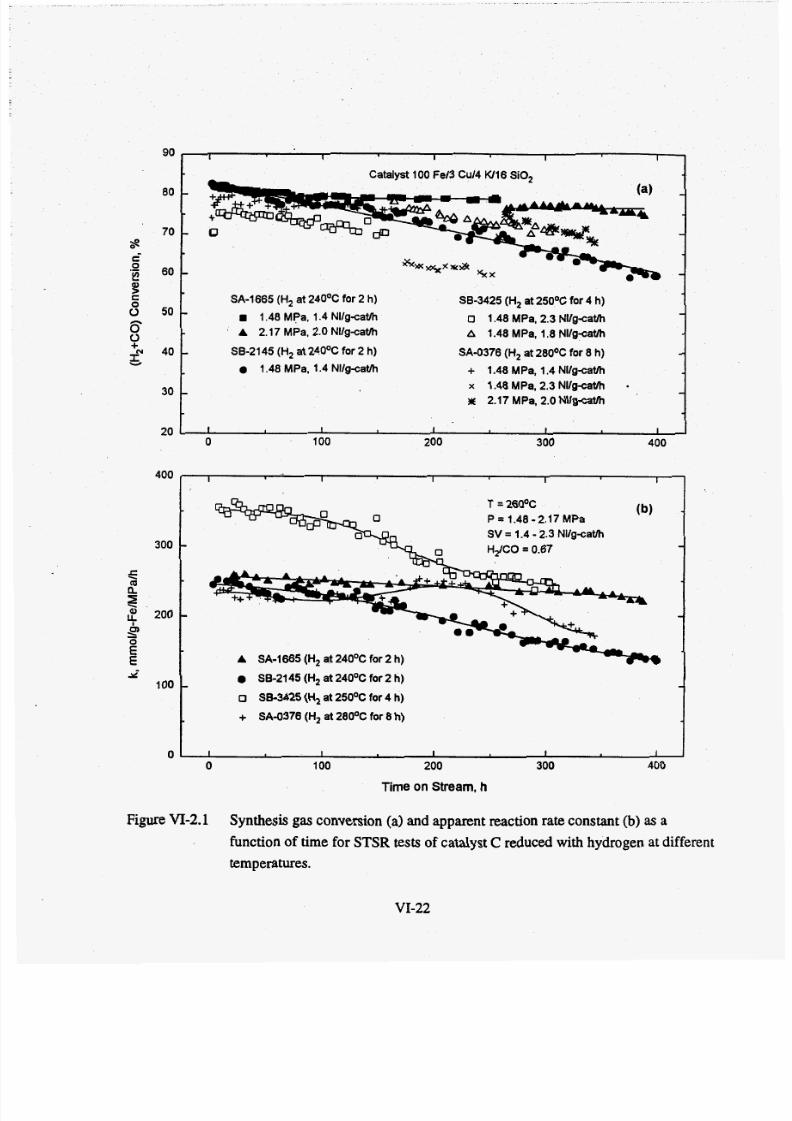
7/28/2019 808495(1).pdf
http://slidepdf.com/reader/full/8084951pdf 148/240
90I I I I I
300
200
100
Catalyst 100 Fe13 Cu14 W16 SiO,
-
-
-
SA-1665 (H2 t 24OOC for 2 h)
m 1.48 MPa, 1.4 Nllg-cath
A 2.17 MPa, 2.0 N llgcatlh
SB-2145 (H2 t 24OOC for 2 h)
0 1.48 MP a, 1.4 Nllg-catlh
88-3425 (H2 t 25OoC for 4 h)
0 1.48 MPa, 2.3 NUgcatlh
A 1.48 MPa, 1.8 Nllg-cath
SA4376 (H2 t 28OOC for 8 h)
+ 1.48 M Pa, 1.4 Nllg-catlh
x 1.48 MPa, 2.3 Nllg-cath
m 2.17 MPa, 2.0 Nllg-cath
20 I I I 1 I I
0 100 200 300 400
400 I I I I I
r-
(b)= 26OOC
P =1 . 48 -2 . 17M P a
SV = 1.4 - 2.3 Nllg-cath
A SA-1665 (H2at 24OOC for 2 h) W --0 38-2145 (H, t 24OOC for 2 h)
0 SB-3425 (H, at 25OOC for 4 h)
+ SA4376 (H2 t 28OOC for 8 h)
01 I I I I 1 I0 100 200 300 400
Time on Stream, h
Figure VI-2.1 Synthesis gas conversion (a) and apparent reaction rate constant (b) as a
function of time for STSR tests of catalyst C reduced with hydrogen at different
temperatures.
VI-22
7/28/2019 808495(1).pdf
http://slidepdf.com/reader/full/8084951pdf 149/240
Methane and C,+C, gaseous hydrocarbon selectivities in run SA-0376 were similar to
those obtained in run SB-3425 (Figure VI-2.2), and slightly higher than those n runs SA-1665
and SB-2145 (standard reduction procedure). This is consistent with results obtained
previously in our laboratory, with other iron Fischer-Tropsch catalysts (Bukur et al. 1989;
1995a), which show ed that the use of more severe reduction conditions often results in higher
gaseous hydrocarbon selectivities.
Total olefin and 2-olefin contents were not affected by differences in reduction
conditions employed (Figure VI-2.3). Total olefin content in all three tests decreased from
about 85% at C, to about 55% at C15,whereas the 2-olefin content increased with increase in
carbon number, e.g. it is about 5% for C,-C, hydrocarbons and about 30% at CI5’
Lumped hydrocarbon product distributions and product yields obtained in four tests in
which hydrogen reductions were employed axe summarized in Table VI-2.2, together with
results from Mobil‘s and Rheinpreussen’s bubble column slurry reactor tests of precipitated
Fe-Cu-K catalysts. Hydrocarbon product distribution in run SA-1665 was similar to that
obtained in Mobil‘s run CT-256-13 (Kuo, 1985). Catalyst productivity (expressed as gHC/g-
F a ) n this test at reaction pressure of 1.48 MPa was similar to that obtained in Mobil‘s run,
but it was significantly higher during testing at 2.17 MPa In the other thnx tests the average
moleculai- weight of hydrocarbon products produced was lower than that in run SA-1665.
Catalyst productivity was either higher (run SB-3425) or lower (runs SB-2145 and SA-0376)
than that obtained in run SA-1665.Yield of oxygenates was relatively low in all four tests,
except inrunSA4376 a t 324 hours on stream (testing at 2.17 MPa).
VI-2.2In comparison to hydrogen reductions, the time needed to reach a steady state activity
was longer when other reductants were used, i.e. about 20 h for the syngas pretreated (SA-
1626) or unreduced catalyst (SB-2486), and about 80 h for the CO pretreated catalyst (run SA-
0946). Since the process conditions, including the gas space velocity, were the same in runs
SB-2486, SA-1626, and SA-0946, the values of syngas conversion can be used as a measure
VI-23
7/28/2019 808495(1).pdf
http://slidepdf.com/reader/full/8084951pdf 150/240
2!
8 -
6 -
4 -
++++ I
A
0
A SA-1665 (H2at 24OOC for 2 h)
0 SB-2145 (H, at 24OOC for 2 h)0 38-3425 (Hz t 25OOC for 4 h )
+ SA-0376 (H2at 280°C for 8 h)
1 1 I I I I I I I I I
50 100 150 200 250 300 350 400
10 I I I I I I I I I ICatalyst: 100 Fe/3 Cu14 W16 SiO, (batch-4)
Test Conditions : T = 26OOC
P = 1.48 - 2.17 MPa
SV = 1.4 - 2.3 NVgcatlh
HdCO = 0.67
Figure VI-2.2 Methane selectivity (a) and (Cl+ 2) ydrocarbon selectivity (b) as a function of
time for time for STSR tests of catalyst C reduced with hydrogen at different
temperatures.
VI-24
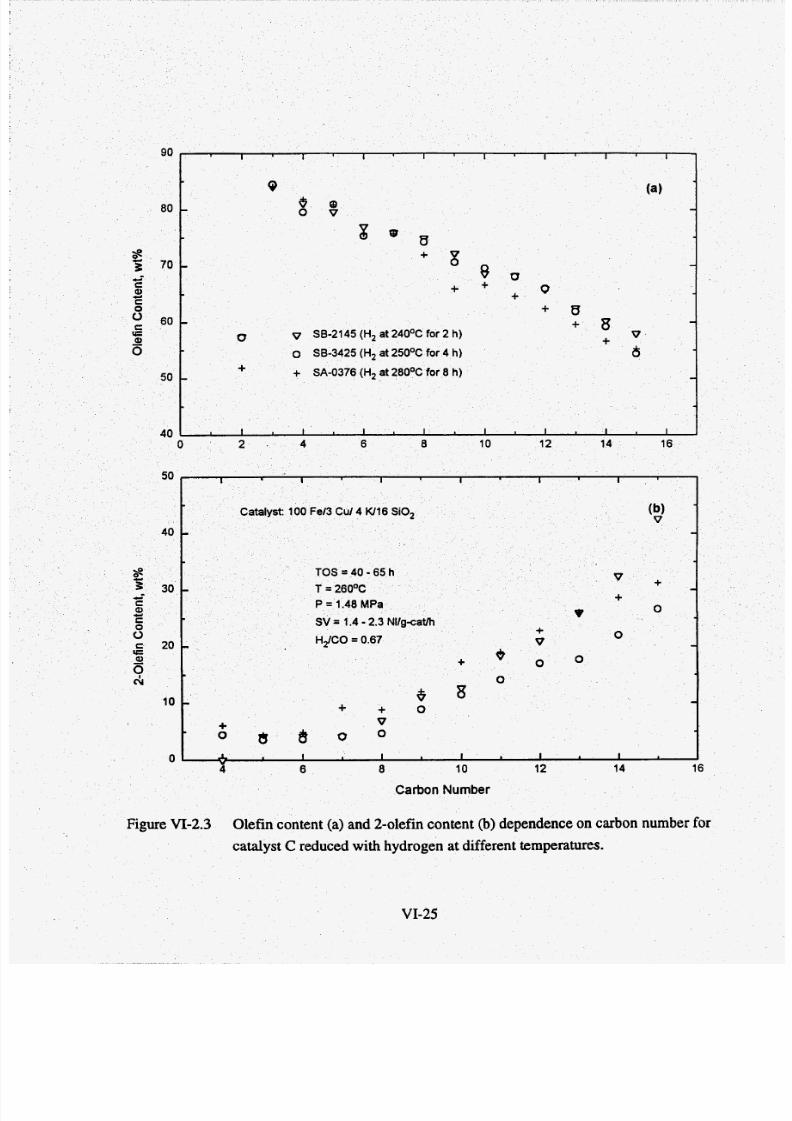
7/28/2019 808495(1).pdf
http://slidepdf.com/reader/full/8084951pdf 151/240
v SB-2145 (H2 at 24OOC for 2 h)
o 88-3425 (H2 at 25OOC for 4 h)+ SA-0376 (H2at 28OOC for 8 h)
+ + o
Carbon Number
Figure VI-2.3 Olefin content (a) and 2-olefin content (b) dependence on carbon number for
catalyst C reducedwith hydrogen at different temperatures.
VI-25
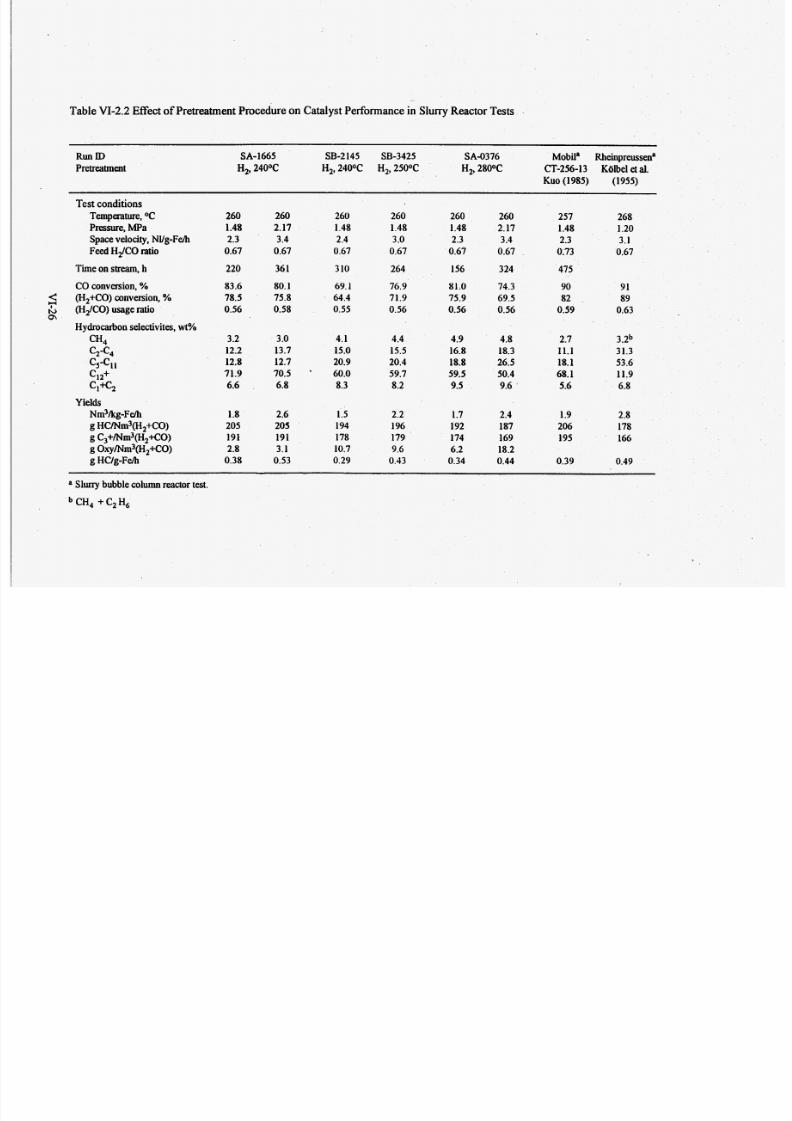
7/28/2019 808495(1).pdf
http://slidepdf.com/reader/full/8084951pdf 152/240
Table VI-2.2 ffect of PretreatmentProcedure on CatalystPerformance in Slurry Reactor Tests
Mobila Rheinpreussenaun ID SA-1665 SB-2 145 SB-3425 SA4376
Pretreatment H,, 24OOC H2,24OoC H,, 25OOC H2,28OoC CT-256-13 Kolbel et al.
Kuo 1985) (1955)
Test conditions
Temperature, OC
Pressure, MPa
Space velocity, NVg-Feh
Feed Hi CO ratio
Time on stream, h
CO conversion, YOC (H2+C0) Conversion, %
X ( ~ 4 ~ 0 )sage ratio
CH4
c12+
Cl+C2
Q\
Hydrocarbon selectivites,W'YO
'24
c5-c11
Yields
Nm3/kg-Feh
g HCMm3(H2+CO)
g C3+/Nm3(H,+C0)
g O X ~ M ~ ~ ( H ~ + C O )
g HC/g-Fe/h
260
1.48
2.3
0.67
220
83.6
78.5
0.56
3.2
12.2
12.8
71.9
6.6
1.8
205
191
2.8
0.38
260
2.17
3.4
0.67
36 1
80.1
75.8
0.58
3O
13.7
12.7
70.5 '
6.8
2.6
205
191
3.1
0.53
260
1.48
2.4
0.67
3 10
69.1
64.4
0.55
4.1
15.0
20.9
60.0
8.3
260
1.48
3 O
0.67
260
1.48
2.3
0.67
264 156
76.9 81.0
71.9 75.9
0.56 0.56
4.4 4.9
15.5 16.8
20.4 18.8
59.7 59.5
8.2 9.5
1.5 2.2 1.7
194 196 192
178 179 174
10.7 9.6 6.2
0.29 0.43 0.34
260
2.17
3.4
0.67
324
257
1.48
2.3
0.73
475
74.3 90
69.5 82
0.56 0.59
4.8 2.7
18.3 11.1
26.5 18.150.4 68.1
9.6 5.6
2.4
187
169
18.2
0.44
1.9
206
195
0.39
268
1.20
3.1
0.67
91
89
0.63
3.2b
31.3
53.6
11.9
6.8
2.8
178
166
0.49~
a Slurry bubble column reactor test.
CH, + C2H,
7/28/2019 808495(1).pdf
http://slidepdf.com/reader/full/8084951pdf 153/240
of relative catalystF-T ctivity (Figure VI-2.4a). Initial activity of the unreduced catalyst (SB-
2486) was the lowest, but at approximately 20 h on stream it was the same as that of the CO
catalyst increased during the first 100h of synthesis and hen became stable, whereas methane
selectivities of the syngas and CO activated catalysts exhibited the opposite trend, i.e. they
decreased with time. Initially (during the first 20 h on stream) methane selectivities increased
VI-27
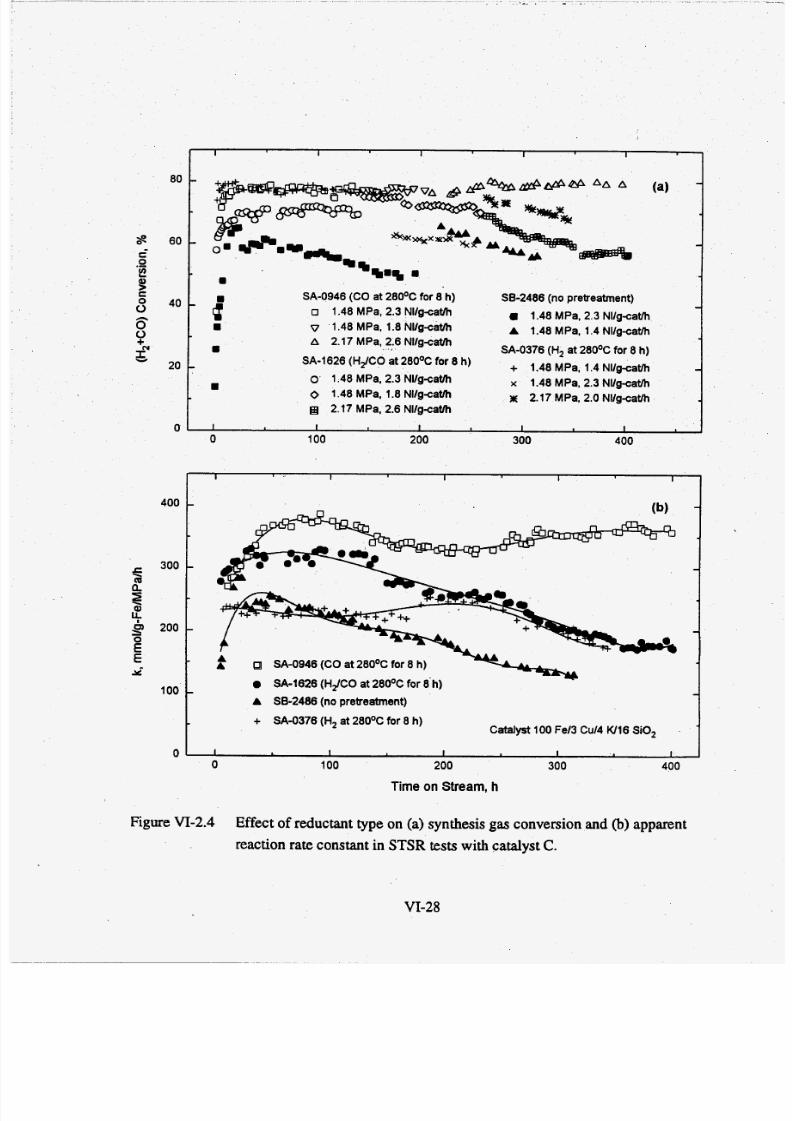
7/28/2019 808495(1).pdf
http://slidepdf.com/reader/full/8084951pdf 154/240
80
400
300f
I$
E9 200
EJ
8 60
I I I I I
-
-
-
i0
*zE6 40
aY1" 20
0
I I I I I
m
8
m
SA-0946 (CO at 28OOC for 8 h)
0 1.48 MPa, 2.3 Nllgcath
v 1.48 MPa, 1.8 Nllgcath
A 2.17 MPa, 2.6 Nllgcath
o 1.48 MPa, 2.3 Nllg-cath
0 1.48 MPa, 1.8 Nllg-cath
2.17 MPa, 2.6 Nllgcath
SA-1626 (HdCO at 28OOC for 8 h)
38-2486 (no pretreatment)
1.48 MPa, 2.3 Nllgcath
A 1.48 MPa, 1.4 Nllgcatlh
SA-0376 (H, at 28OoC for 8 h)
+ 1.48 MPa, 1.4 Nllg-cath
x 1.48 MPa, 2.3 Nllg-cath
m 2.17 MPa. 2.0 Nllgcath
I I I I I
0 100 200 300 400
100
SA4946 (CO at 28OOC for 8 h)
0 SA-1626 (HdCO at 28OOC for 8 h)
A 88-2486 (no pretreatment)
+ SA 43 76 (H, at 28OOC for 8 h)Catalyst 100 Fel3 Cul4 W16 SiO,
Figure VI-2.4 Effect of reductant type on (a) synthesis gas conversion and (b) apparent
reaction rate constant in STSR tests with catalyst C.
VI-28
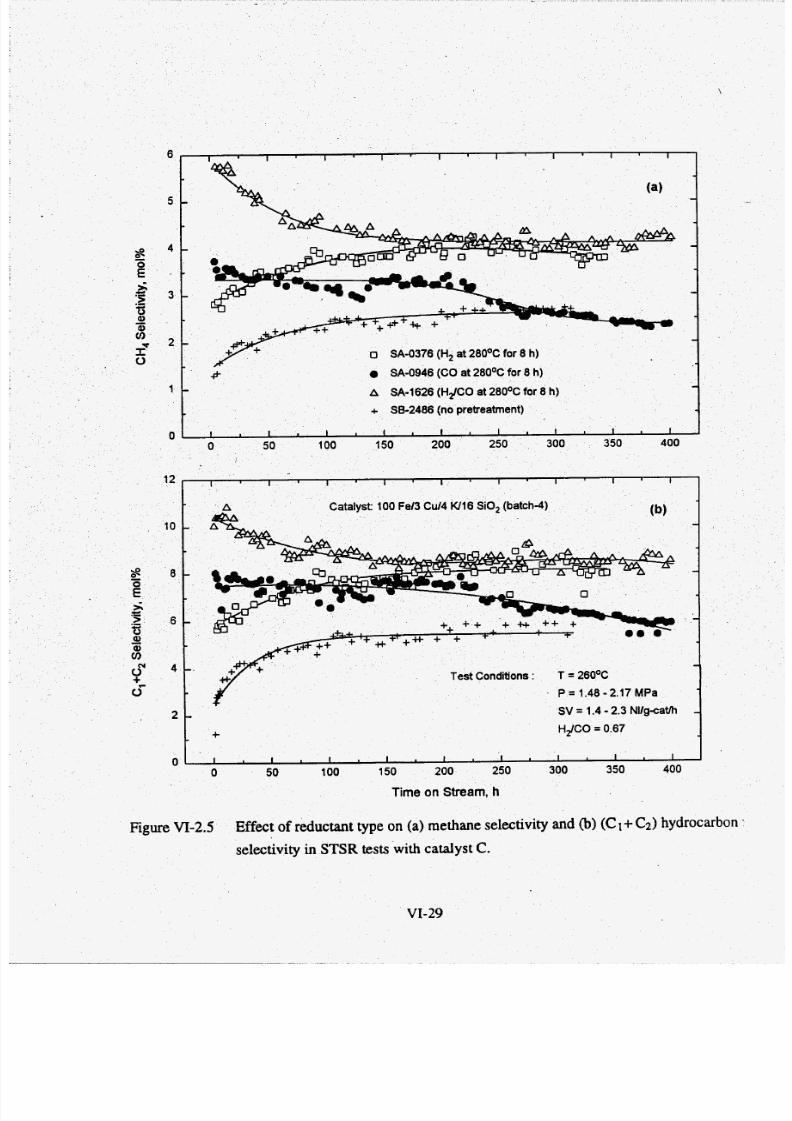
7/28/2019 808495(1).pdf
http://slidepdf.com/reader/full/8084951pdf 155/240
+ H i C O = 0.67
I I I I I I
0 50 100 15 0 200 250 300 350 400
Time on Stream, h
I I I0
Figure VI-2.5 Effect of reductant type on (a) methane selectivity and (b) (C 1+C2)hydrocarbon .
selectivity in STSR tests with catalyst C.
VI-29
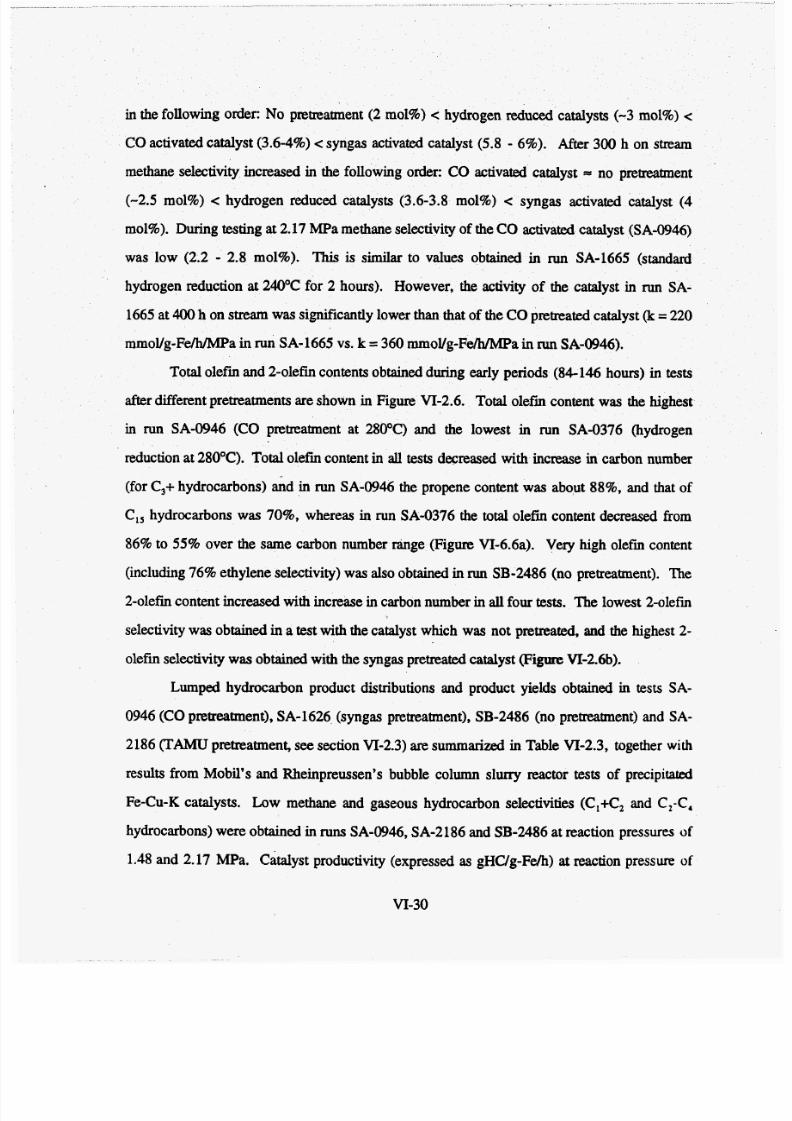
7/28/2019 808495(1).pdf
http://slidepdf.com/reader/full/8084951pdf 156/240
in the following order: No pretreatment (2 mol%) < hydrogen reduced catalysts (-3 mol%) e
CO activated catalyst (3.6-4%) e syngas activated catalyst (5.8 - 6%). After 300 h on stream
methane selectivity increased in the following order: CO activated catalyst = no pretreatment
(-2.5 mol%) < hydrogen reduced catalysts (3.6-3.8 mol%) e syngas activated catalyst (4
mol%). During testing at 2.17 MPa methane selectivity of the CO activated catalyst (SA-0946)
was low (2.2 - 2.8 mol%). This is similar to values obtained in run SA-1665 (standard
hydrogen reduction at 240°C for 2 hours). However, the activity of the catalyst in run SA-
1665 at 400 h on stream was significantly lower than hat of the COpremated catalyst (k= 220
mmoYg-Fe/h/MPa in run SA-1665 vs. k =360 mmoVg-Fe/h/MPa in run SA-0946).
Total olefin and 2-olefin contents obtained during early periods (84- 146 hours) in tests
after different pretreatments are shown in Figure VI-2.6. Total olefin content was the highest
in run SA-0946 (CO pretreatment at 28OOC) and the lowest in run SA-0376 (hydrogen
reduction at 28OOC). To tal olefin content in all tests decreased with increase in carbon number
(for C,+ hydrocarbons) i d n run SA-0946 the propene content was about 88%, and that of
C,, hydrocarbons was 70%, whereas in run SA-0376 the total olefin content decreased from
86% to 55% over the same carbon number range (Figure VI-6.6a). Very high olefin content(including 76% ethylene selectivity) was also obtained in run SB-2486 (no pretreatment). The
2-olefin content increased with increase in carbon number in all four tests. The lowest 2-01efm
selectivity was obtained in a test with the catalyst which was not pretreated, and the highest 2-
olefin selectivity was obtained with the syngas pretreated catalyst (Figure VI-2.6b).
Lumped hydrocarbon product distributions and product yields obtained in tests SA-
0946 (CO pretreatment), SA-1626 (syngas pretreatment), SB-2486 (no pretreatment) and SA-
2186 (TAMU retreatment, see section VI-2.3) are summarized in Table VI-2.3, together with
results from Mobil's and Rheinpreussen's bubble column slurry reactor tests of precipitated
Fe-Cu-K catalysts. Low methane and gaseous hydrocarbon selectivities (C,+C, and C,-C,
hydrocarbons) were obtained in runsSA-0946, SA-2186 and SB-2486 at reaction pressufes of
1.48 and 2.17 MPa. Catalyst productivity (expressed as g H U g - F A ) at reaction pressure of
VI-30
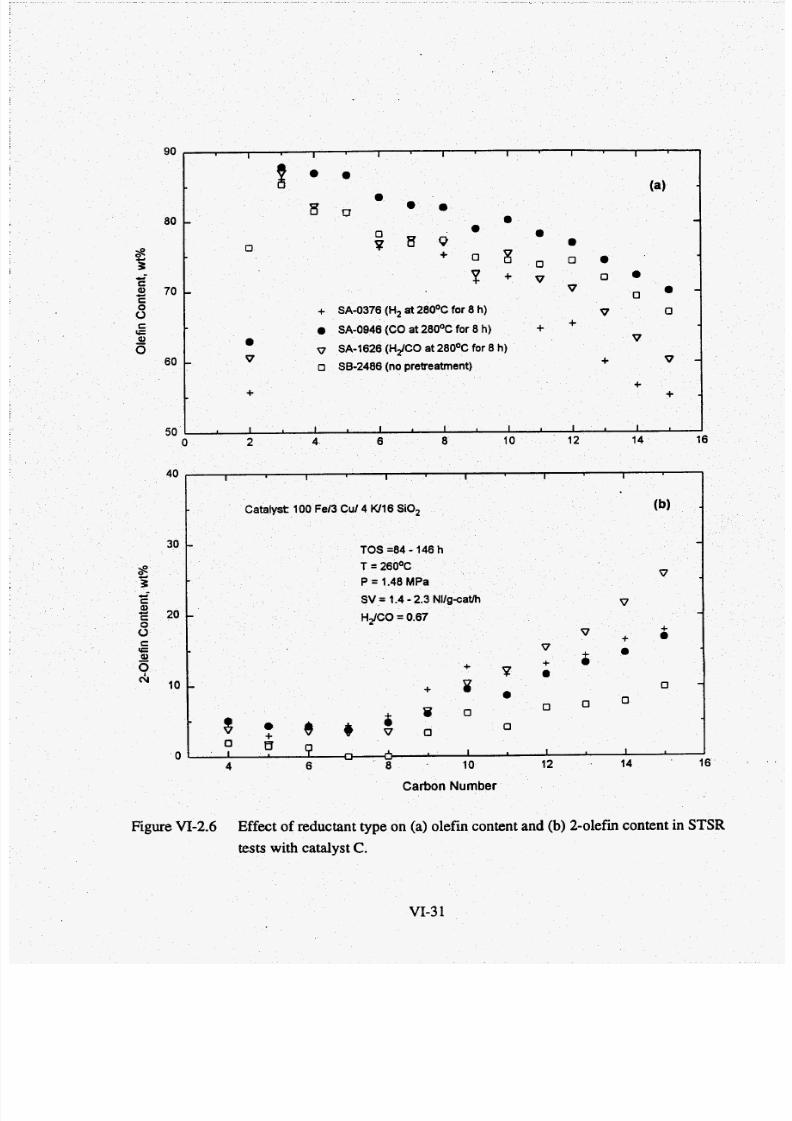
7/28/2019 808495(1).pdf
http://slidepdf.com/reader/full/8084951pdf 157/240
Carbon Number
Figure VI-2.6 Effect of reductanttype on (a) olefin content and (b) 2-olefin content in STSR
tests with catalyst C.
VI-3 1
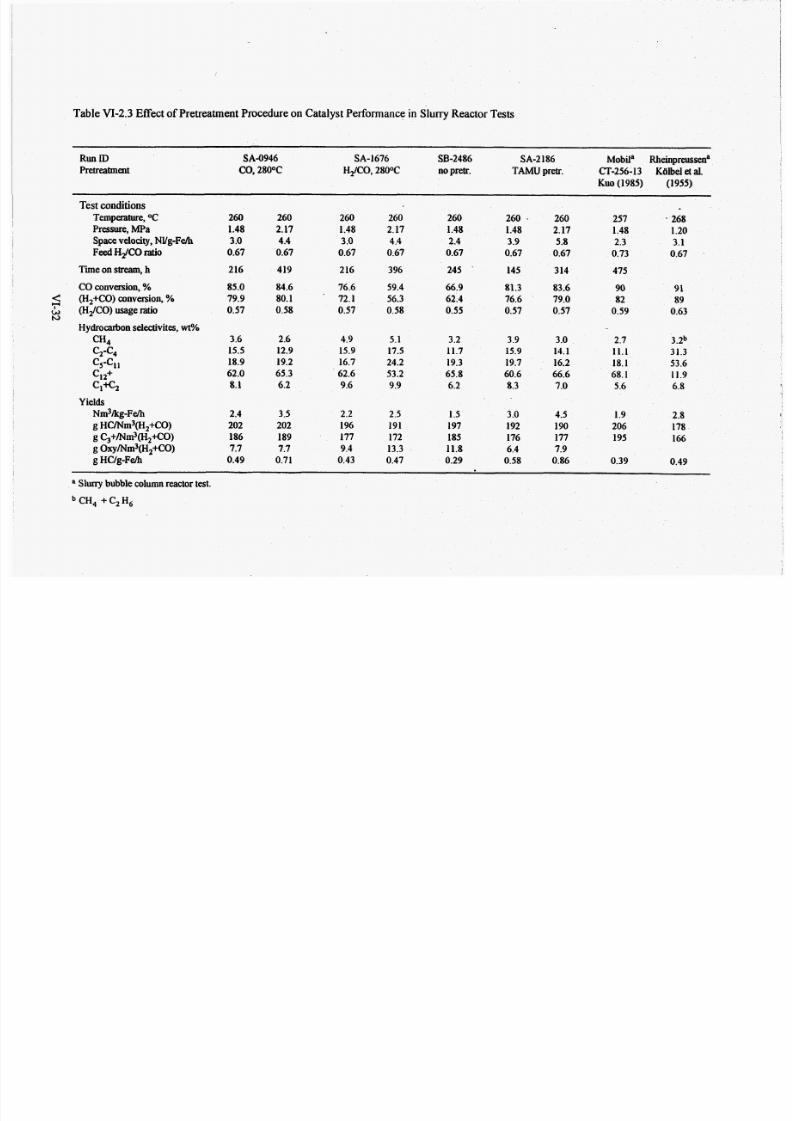
7/28/2019 808495(1).pdf
http://slidepdf.com/reader/full/8084951pdf 158/240
Table VI-2.3 ffectof Pretreatment Procedure on Catalyst Performance in Slu ny Reactor Tests
Run ID SA4946 SA- 1676 SB-2486 SA-2 186 Mobil" Rheinpreussen"
Pretreatment CO, 28OOC H2/C0, 28OOC no pretr. TAMU pretr. CT-256-13 Kdlbel et al.Kuo (1985) (1955)
Test conditionsTemperature, OC
Pressure, MPaSpacevelocity,NVg-Feh
Feed HiCO atio
Timeon stream, h
CO conversion, %
< (H2+C0) conversion, %
z (~2/~0)usagemtio
CH4
cs-c,c12+
Cl+C2
wHydrocarbon selectivites,wtY0
'24
Yields
Nm3/kg-Feh
g HC/Nm3(H2+CO)
g Oxy/Nm3(H2+CO)g C3+mm3(H2+CO)
g HC/g-Fe/h
260
1.48
3 O
0.67
216
85.0
79.9
0.57
3.6
15.5
18.9
62.0
8.1
2.4
202
186
7.7
0.49
260
2.17
4.4
0.67
419
84.6
80.1
0.58
2.6
12.9
19.2
65.3
6.2
3.5
202
189
7.7
0.71
260
1.48
3 O
0.67
2 16
76.6
72.1
0.57
4.9
15.9
16.7
62.6
9.6
2.2
196
177
9.4
0.43
260
2.17
4.4
0.67
396
59.4
56.3
0.58
5.1
17.5
24.2
53.2
9.9
2.5
191
172
13.3
0.47
260
1.48
2.4
0.67
245 '
66.9
62.4
0.55
3.2
11.7
19.3
65.8
6.2
1.5
197
185
11.8
0.29
260
1.48
3.9
0.67
145
81.3
76.6
0.57
3.9
15.9
19.7
60.6
8.3
3O
192
176
6.4
0.58
260
2.17
5.8
0.67
3 14
83.6
79.0
0.57
3 O
14.1
16.2
66.6
7.0
4.5
190
177
7.9
0.86
257
1.48
2.3
0.73
475
90
82
0.59
2.7
11.1
18.1
68.1
5.6
1.9
206
195
0.39
268
1.20
3.1
0.67
91
89
0.63
3.2b
31.3
53.6
11.9
6.8
2.8
178
166
0.49
a Slurry bubble column reactor test.

7/28/2019 808495(1).pdf
http://slidepdf.com/reader/full/8084951pdf 159/240
1.48 MPa in runs SA-0946 and SA-2186 was equal to or higher than that obtained in Mobil's
and Rheinpreussen's bubble column reactor tests, and was markedly higher in both runs
during testing at 2.17 MPa. The highest catalyst productivity, 0.86 g hydrocarbons
producedg-Fdh, was achieved using theTAMU retreatment procedure, while maintaining the
desired selectivity. Th is is the best performan% to date, in o ur laboratory or anywhere else,
for catalysts developed for high wax production ("high alpha" catalysts). The performance of
the CO activated catalyst w as also superior relative to other catalysts developed for high wax
production : atalyst productivity of 0.7 1 gHC/g-Feh, and hydrocarbon selectivity within the
DOE'Sperformance targets (low methane and C,+C, selectivities).
VI-2.3 P un SA 2186 with 100 Fd3 Cu/ i Q 2 U Y S t matth-4)W16 S
decreased from 0.62 to 0.58 at 20 h and then remained stable at these conditions. The apparent
reaction rate constant followed the same trend as the syngas conversion, and was fairly
constant between 20 and 200 hours on stream (about 400 mmoYg-Fe/h/MPa). At 209 h on
stream, the reaction pressure and gas space velocity were increased to 2.17 MPa and 3.4 NVg-
cath (5.8 NYg-Fdh). After 20 hours at these conditions, the syngas conversion was about
76%, and then increased with time reaching 83% at about 500 h on stream. The apparent
reaction constant also increased with time during testing at 2.17 MPa, and reached 450
mmoVg-Fe/h/MPa a t 500 hours.
VI-33
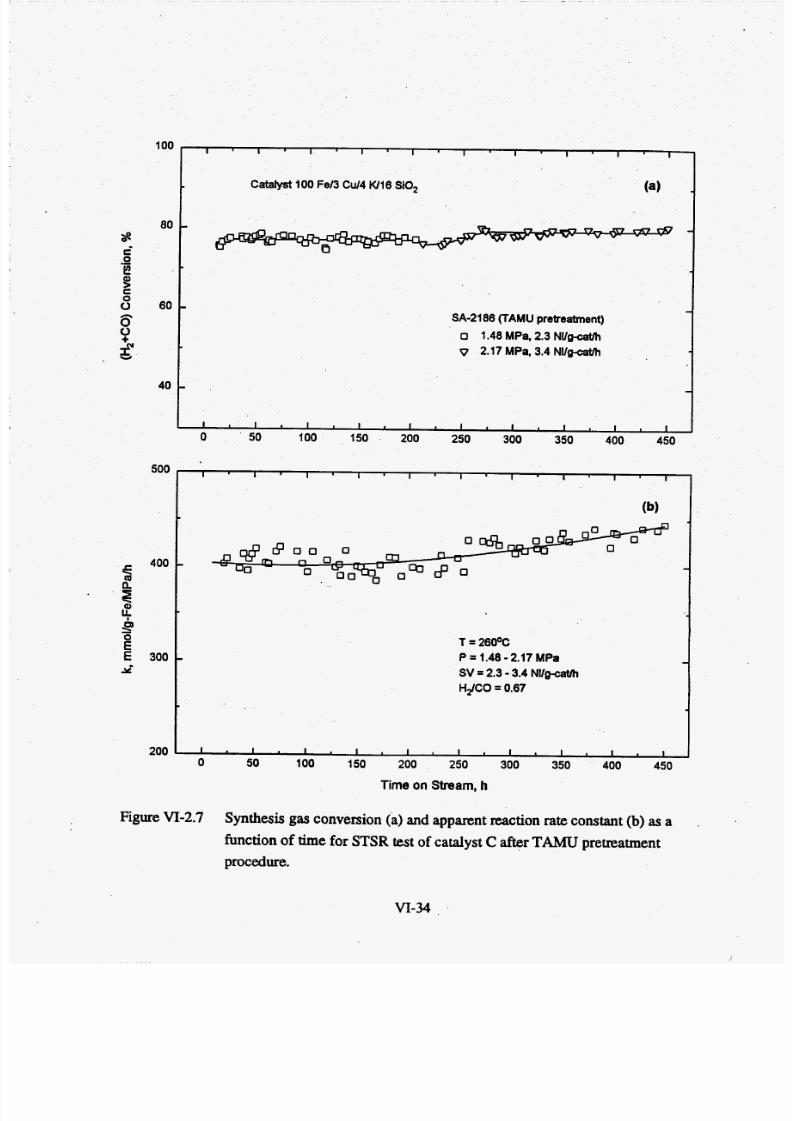
7/28/2019 808495(1).pdf
http://slidepdf.com/reader/full/8084951pdf 160/240
100
80s?c'
'E
2
6Y
, g
0
Q)
8 60
40
500
= I I I I I I II I I~
(a)atalyst 100 Fel3 Cu14 K ll 6 SiO,
- -
- -SA-2186 (TAMU pretreatment)
o 1.48 MPa, 2.3 NUg-cat/h
v 2.17 MPa, 3.4 NVgcaVh
-
I I I I I I 1 I I I
200
I I I I ' I I ' I I I I
(b)
-
T = 26OOC
P = 1.48 - 2.17 MPa
H&O = 0.67
-SV = 2.3 - 3.4 NU
I I I I I I I .
0 50 100 150 200 250I I I .
300 350 400 450
Figure VI-2.7 Synthesis gas conversion (a) and apparent reaction rate constant (b) as a
function of time for STSR est of catalyst C afterTAMU pretreatment
procedure.
VI-34

7/28/2019 808495(1).pdf
http://slidepdf.com/reader/full/8084951pdf 161/240
After20 h o n stteam thane selectivity
mol%, and C1+Q hydrocarbon selectivity was between 6.6 and 7.8 mol% (Figure VI-2.8b).
Gaseous hydrocarbon selectivities gradually decreasing during testing at 2.17 MPa. At
500 h on stream, he me an d C1+C2 electivities were 2.5 and 6.4 mol%, respectively.
The catalyst productivity at 26OoC, 2.17 MPa, syngas molar feed ratio of 0.67 (H2/CO
=0.67) and g as space velocity of 3.4 W g-cath was 0.86 (g hydrocarbons producedlg-Fe/h).
As noted above, this is the highest catalyst productivity obtained in our laboratory, and is
significantly higher than that obtained in the two most successful bubble column slurry reactor
operations at comparable conv ersions and low methane selectivities (Mobil's work, and
Kglbel's Rheinpreussen onstration plant unit). Two main reasons for h igher catalyst
space-time-yield (productivity) obtained in the present study relative to the previous ones are:
activity of o ur catalyst.
ure VI-2.1) of the hydroge
r that magnetite and a-Fe
ide phase. How ever, the
n of iron oxide, and it is
to syngas at 260OC. For
example, the unreduced iron requires about 20 h of exposure to reach its steady state activity
(SB-2486). Activity of the unreduced catalyst (largely Fe3+ iron) is low initially, and it
increases during the fmt 25 h of synthesis, due to formation of magnetite and/or &'-carbide,
indicating that o ne or both of these phases are active for FTS. Activity of the CO reduced
catalyst is rather low initially &-carbide), and increases gradually with time. This behavior is
not cons istent with a hypothesis that iron carbide is the active phase for the FTS. If the latter
hypothesiswas correct, one would expect the initial activity of the partially carbided catalyst to
be markedly greater than that of the catalyst in the form of magnetite (run SB-3425). Also. the,
VI-35
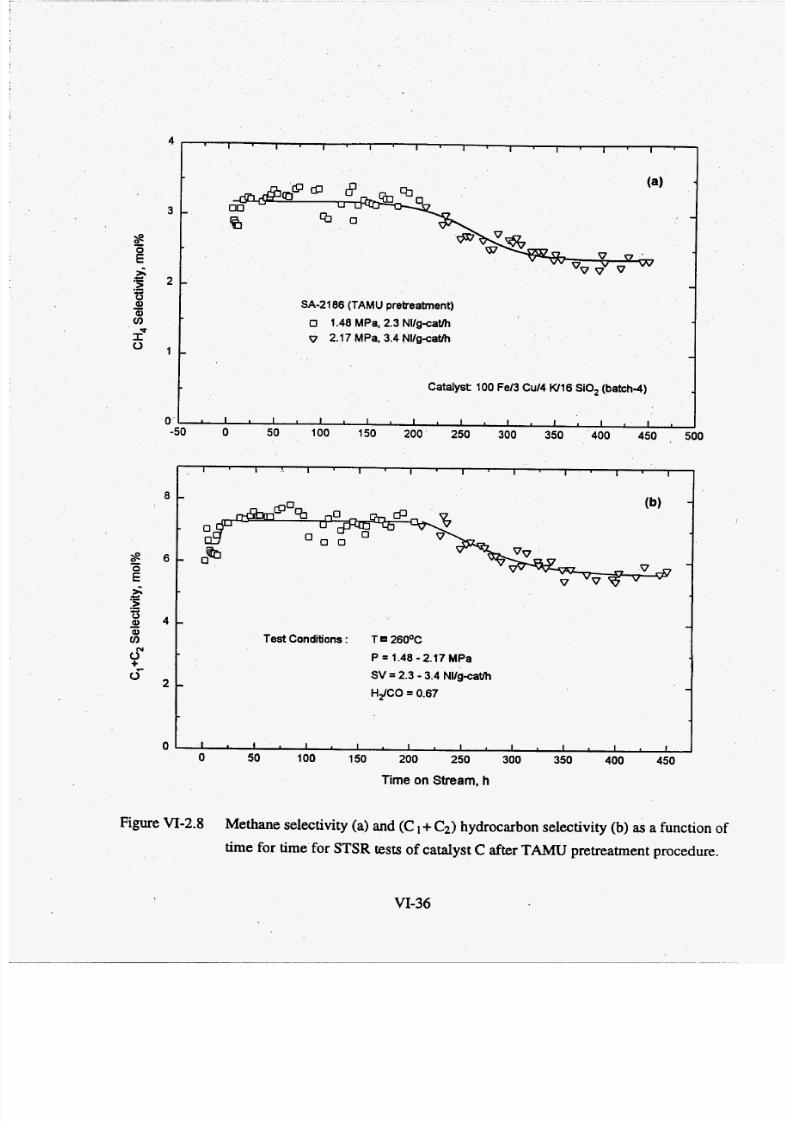
7/28/2019 808495(1).pdf
http://slidepdf.com/reader/full/8084951pdf 162/240
0"
5
1 , 1 , 1 , 1 , 1 , [ , [ , 1 I , l ,
SA-2186 (TAMU pretreatment)
0 1.48 MPa, 2.3 N llgcatlh
v 2.17 MPa, 3.4 N llgc ath
Catalyst 100 Fe13 Cu14 W16 SiO, (batch-4)
I I I I I I II I I
Test Conditions : T 26OOC
P = 1.48 - 2.17 MPa
SV = 2.3 - 3.4 Nllgcatlh
HdCO = 0.67
I . I I I I I I
0 50 100 150 200 250 300 350 400 450I I
Time on Stream, h
Figure VI-2.8 Methane selectivity (a) and (C +C2) ydrocarbon selectivity (b) as a function of
time for time for STSR tests of catalyst C after TAMU pretreatment procedure.
VI-36

7/28/2019 808495(1).pdf
http://slidepdf.com/reader/full/8084951pdf 163/240
I .
A-0946 ad a long induction period, an
the ~nr ed ic ed atalyst. ~nitiatctivity of the syngas activated catalyst (mixture
of iron carbides and magn was high, but it also went through an induction period lastingapproximately 25 h. It is possible that the active surface sites of the CO and syngas pretreated
catalysts were partially blocked with excess carbon formed during the prehreatment, and that
this had caused low er than expected activity. Steady state activities, of catalysts pretreated by
CO and syngas were higher than those of the hydrogen and unreduced catalysts. Magnetite
was virtually absent in the CO and syngas pretreated catalysts, whereas both hydrogen and
tivity at -20 h on stream
unreduced catalyst contained both magnetite and &'-carbide (Section VI-1, Table VI-1.2).
These observations are consistentwith the hyp
active for FTS, nd that iron carbides have higher
selectivities of the CO and
en reduced and
These data suggest that me
is higher on carbided catalys
higher methane selec tivity on carbided c
uced by reaction between hydrogen and surface carbon formed during the
improvements in the catalyst activity were ob gh the use of
procedures. Our standard reduction procedure with the catalyst C
(hydrogen reduction at 240°C fo r 2 hours) resulted in the initial activity, expressed in terms of
the apparent reaction rate constant, of about 250 mmoVg-Fe/h/MPa The activity decreased
with time and a t about 400 the apparent rarereached the value of 220 m m o V g - F W a (run
SA-1665) r 140mmoYg-F& (runSB-2145). The initial activity of the catalyst reduced with
hydrogen at 2 W C fo r 4 hours (run SB-3425) was about 350 mmoVg-Fe/h/MPa, which
represents a 40% increase relative to the standard reduction procedure. However, the catalyst
VI-37

7/28/2019 808495(1).pdf
http://slidepdf.com/reader/full/8084951pdf 164/240
activity decreased with time and at about 300 h the apparent rate constant was 250 m o l / g -
Fe/h/MPa (similar to the value obtained in run SA-1665)./
The CO pretreatment (SA-0946), syngas pretreatment (SA-1626) and TAMU
pretreatment (SA-2186) also resulted in improved catalyst activity, relative to the standard
reduction procedure. The initial values of the apparent reaction rate cons tant, after these
pretreatments, were 300-400 mmol/g-Fe/h/MPa, corresponding to 2 0 4 % ncrease in activity
relative to the standard procedure. Activity of the CO and T A W pretreated catalysts increased
with time, and at 400hours the values of the apparent reaction rate constants were 360 and 430
mmol/g-Fe/h, respectively. As the result of the improvement in the catalyst activity, while
maintaining low methane and gaseous hydrocarbon selectivities, the catalyst productivities in
these two tests were markedly higher than those obtained in Mobil’s and Rheinpreussen’s
slurry bubble column reactor tests. The catalyst productivity in Rheinpreussen test was 0.49
gHC/g-Felh, and those obtained in runs SA-0946 and SA-2186 were 0.71 and 0.86 gHC/g-
Fe/h, respectively (Tab€e VI-2.3). This represents 45-75% improvement in catalyst
productivity relative to that achieved in Rheinpreussen’s demonstration plant unit, and sets new
standards of performance for “high alpha” iron catalysts. We believe that the performance of
our catalyst B (100 Fe/5 Cu/6 W24 SiOJ can be also improved through the use of better
pretreatment procedures.
VI-38
7/28/2019 808495(1).pdf
http://slidepdf.com/reader/full/8084951pdf 165/240
Bukur, D. B., Lang, X., Rossin, J. A., Zimmerman, W. H., Rosynek, M. P., Yeh, E. B.,
and Li, C. "Activation Studies with a Promoted Precipitated Iron Fkcher-T ropschCatalyst," Ind. Eng. Chem. Res., 28,1130-1140 (1989).
Bukur, D. B., Koran, M., Lang, X., Rao, K. R. P. M. and Huffman, G. P., "Pretreatment
Effect Studies with a Precipitated Iron Fischer-Tropsch Catalyst", Appl. Catal., 626,
85-113 (1995a).
Bukur, D. B., Nowicki, L., and Lang X., "Fischer-Tropsch Synthesis in a Slurry Reactor-
Pretreatment Effect Studies", Energy & Fuels, 9, 620-629 (1995b).
'
Bukur, D. B., Okabe, K., Rosynek, M. P., Li, C., W ang, D., Rao, K. R. P. M., and
Huffman, G. P., I' Activation Studies with a Precipitated Iron Catalyst for Fischer-
Tropsch Synthesis - Part I Characterization Studies ", . Catal.,B,53-365 (199%).
Bukur, D. B., Nowicki, L., Manne, R. and Lang, X., 'I Activ Studies with a
n Studies 'I, J.recipitated Iron Catalyst for Fische psch Synthesis - Part II
1, S. A., "Activation Studies with an Iron Fischer-
tors", The Can. J. ofn Fixed Bed and Stirred Tank Slurry
Kuo, J. C. W., 1985, stage process for conversion of synthesis gas to high
transportation fuels. Final report prepared for DOE Contract No. DE-
83PC600019, Mobil Research and Development Corp., Paulsboro, NJ.
Pennline, H. W., M.F. Zarochak, J. M. Stencel and J. R. Diehl, "Activation and Promotion
Studies in a Mixed S lurry Reactor with an Iron-Manganese Fischer-Tropsch Catalyst",
Ind. Eng. Chem. Res., 26 ,595-6 01 (1987).
Zarochak, M. E, and McDonald, M. A., 1986, in "Sixth DOE Indirect Liquefaction
Contractors' Meeting Proceedings" (G. Cinquegrane and S. Rogers, Eds.), p. 5 8 :
U.S.Department of Energy, Pittsburgh Energy Technology Cente r, Pittsburgh.
VI-39
7/28/2019 808495(1).pdf
http://slidepdf.com/reader/full/8084951pdf 166/240
Zarochak, M. F. and M. A. McDonald, 1987, "A Study of Iron Fischer-Tropsch Catalysts"in
"SeventhDOE ndirect Liquefaction Contractors' Meet. Proc., G. Cinquegrane and N .
Narain, Eds., Pittsburgh, PA, Dec. 7-9, 1987, U. S. Department of Energy,
Pittsburgh Energy Technology Center, Pittsburgh, PA, pp. 96- 12 1.

7/28/2019 808495(1).pdf
http://slidepdf.com/reader/full/8084951pdf 167/240
_ -
VII CalcinationEffect Research
Calcination involves heating the dried powder in the tempera ture range 300-60O0C in
various atmospheres, usuallyair.
Several processes occur: sin tering, solid state reaction,loss
of porosity. In most ca talyst systems calcination is beneficial since it e stablishes the correct
“state” of the ca talyst that is most responsive to activation.
Very little system atic study of the effect of calcination on precipitated F-T catalysts
has appeared (A nderson, 1956, 198 4), yet this is a promising area for controlling essential
properties. It is known that heat treatment of co-precipitated Fe z0 3 -C u0 samples gives
mixed phases, e.g. Cu Fez0 4 , hat may result in superior dispersions with reductive activation.
Calcination results in sintering and loss of surface area. Ca lcined cataly sts have better
attrition properties, w hich is important for the slurry F-T rocess. Ch ange s in the pore
volume and pore size distribution may have significant effect on intraparticle diffusion and
consequen tly on hy drocarbon product distribution. However, there have been no studies to
investigate these effects.
In a related study (Hadjigeorghiou and Richard son, 1986 ) it was reported that
N m 0 2 catalysts, used in the F-T synthesis of light hydrocarbons, showed an activity
enhancement of up to a factor of ten when the hydrogel was calcined rapidly on a hot-plate
pared with conventional oven heating. This was attributed to rapid
reactions in the gel that led to “decoration” of reduced nickel particles by Tho, (Richardson
et al., 1989). It is possible that thiseffec t may enhance activity of precipitated lo0F d x C d y
Wz iO, catalys ts during calcination. The large-scale analogy to the hot-plate is a “spray-
roasting” which may be employed in the catalyst scale-up, if this procedure proves to be
effective.
Th e ef fec t of calcination tem perature (300-’50O0C) and flash calc ination on physical
properties of catalysts B and C is described in section VII-1,whereas results from F-T
synthesis tests in fixed bed and stirred tank slurry reactors are described in section VII-2.
VII- 1
7/28/2019 808495(1).pdf
http://slidepdf.com/reader/full/8084951pdf 168/240
W-1 Catalyst Characterization Studies
Calcinations at temperatures 300-500°C were done in a downflow fixed bed reactor
unit. The air flow rate during calcination was set at approximately 50 cms/g-cat/min and the
catalyst bed temperature was increased to a desired calcination temperature at a rate of
2'C/min. After reaching the final temperature these conditions were maintained for 5 hours.
After that the system was allowed to cool down to room temperature with air flowing
through the catalys t bed. Calcination at 700°C was done in a high temperature furnace. The
furnace was preheated to 700°C first, and the catalyst was spread over a prehea ted crucible to
form a thin layer. During one hour calcination the air flow was fed in to the furnace, passing
over a thin ayer of catalyst. This procedure is referred to as flash calcination.
Calcined cataly sts were characterized by BET surface area, pore volume and pore
size distributions. The pretreated and used catalysts from sluny a ndor fixed bed runs were
characterized by XRD and MES.
BET S&e Area and pore Vo-
BET su rface area and pore volume results of catalysts B (100Fe/5 C d 6 W24 SiO,,
batch-3) and C (100 Fe/3 Cu/4 W16 SiO,, batch-4) calcined at different temperatures are
summarized in Ta ble VII-1.1. The surface areas of catalyst C and B calcined at 300°C for 5
h (baseline conditions) were about 290m2/g, and decreased gradually to about 100mZ/gwith
the increase in calcination temperature from 300 to 700°C. The BET surface areas of both
catalysts are simila r after cdcination s at the same conditions (temperature and duration). The
surface area of catalysts B and C y s also affected by the duration of calcination , and it
decreases with increase in calcination time (results at 500°C at different durations of
calcination).
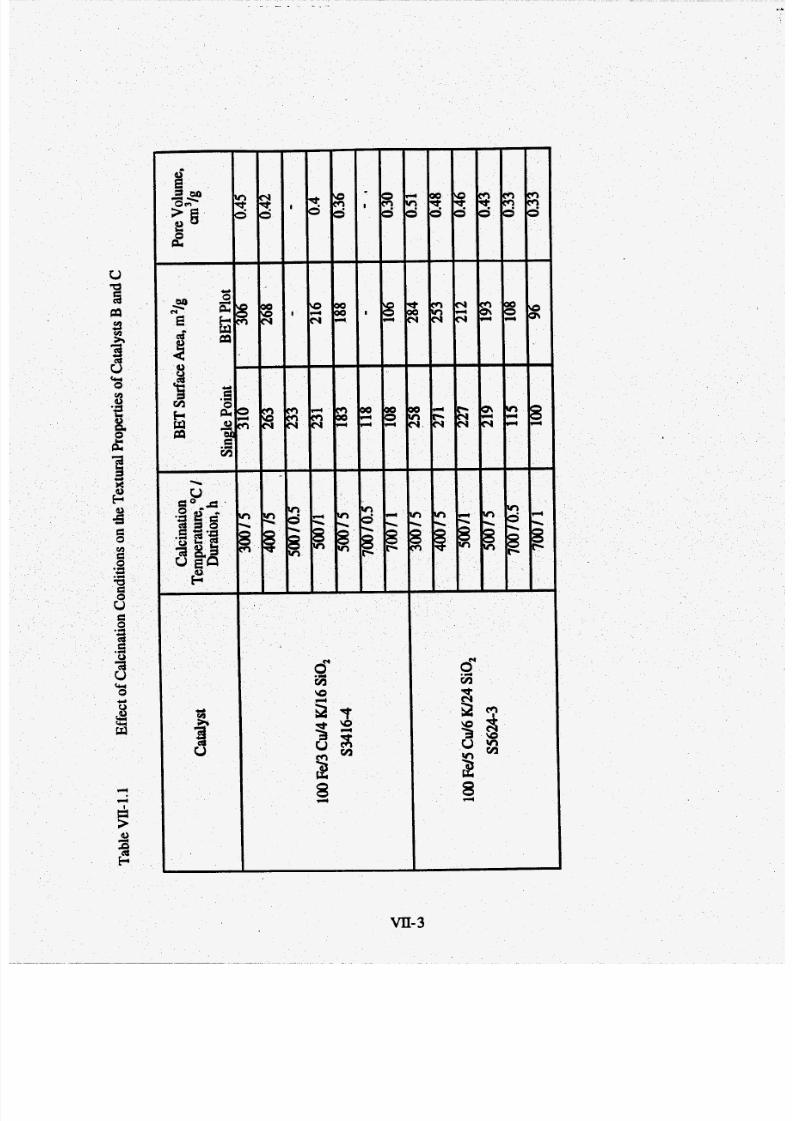
7/28/2019 808495(1).pdf
http://slidepdf.com/reader/full/8084951pdf 169/240
. . - . . . . . , -
cu0
%I
0
'jlEw
84
VII-
7/28/2019 808495(1).pdf
http://slidepdf.com/reader/full/8084951pdf 170/240
Pore volumes of catalysts C and B (calcined at 300OC) were 0.45 and 0.50 cm3/g,
respectively, and the corresponding values after calcination at 700OC w ere 0.30 and 0.33
cm3/g, respectively. Total pore volume of catalyst B is slightly larger than that of catalyst C
at all calcina tion temperatures. The pore volumes of these two catalysts are also affected to
some extent by the duration of calcination. The decrease in surfa ce area and pore volume
with increasing calcination temperature is due to sintering,
Pore SizeDi-. . .
Figure VII-1.1 illustrates the pore size distribution of catalysts C and B after
calcination at differen t temperatures ranging from 300 to 700OC. The cata lysts exhibit bi-
. modal pore size d istributions at all calcination temperatures. The pore size (diameter) varied
from about 2 to 20 nm for both catalysts, but the pore size shifted to larger values with
increase in calcina tion temperature. Catalysts calcined at 700°C for 1 hour, had a more
narrow pore size distribution,with a large fraction of pores being about 10nm n diameter.
Iron P w n Reduced& Used C
Catalysts B and C calcined at temperatures 3W 50O 0C did not exhibit crystallinity, .e.
they are either amorphous or the crysta llites are too sm all to be detected by XRD. atalysts B
and C calcined at 70O0C for 1h were crystalline, and exhibit the X RD pattern of hematite (a-
Fe203). esults of XRD and MES analysis of reduced and used catalysts from fixed bed and
stirred tank slurry reactor testsare summarized in Table VII-1.2.
Used catalysts B and C, calcined at 300-50O0C, from fixed bed reactor tests contained
only e'-FqS2C samples from both top and bottom portions of the reactor). In two tests with
catalysts calcined a t 70O0C (FA-3495 and FB-0236) magnetite and & '-carbidewere identified in
samples from the bottom portion of the reactor (oxidizing atmosphere) by both XRD and MES
analysis, whereas only &'-carbidewas identified in samples from the top portion of the reactor
(reducing atmosphere).
VII-4

7/28/2019 808495(1).pdf
http://slidepdf.com/reader/full/8084951pdf 171/240
_ _ . --
0.0016 i
: (a) 100Fd3 Cu/4 W16 SO,, batch 4 :- -0.30VC 5 h, + W C , 5 h-0 5OO'CSh
---a*--W'C 1 h
-
10 100 1000
Pore Diameter (angstrom)
Figure VII-1.la Effect of calcination temperature on the pore size distribution of catalyst C
(100 e13Cu/4W16 SO,, batch-4).
0.0016
3 0.0012
j$ 0.001
3
3
8
2 0.0008
a 0.00060
& 0.0004e
a 0.0002
010 100 1000
Pore Diameter (angstrom)
Figure VII-1.1b Effect of calcination temperature on the pore size distribution of catalyst B
(100 Fd5 Cd6 W24 SiO,, batch-3).
VII-5
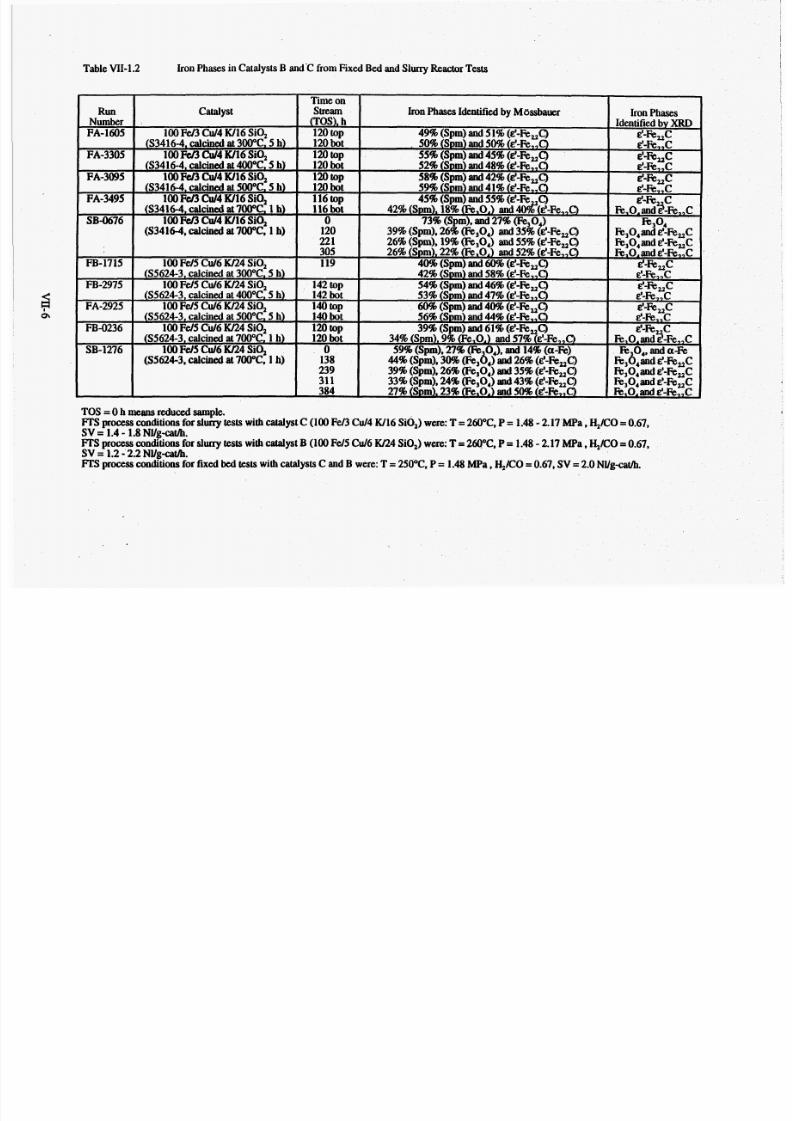
7/28/2019 808495(1).pdf
http://slidepdf.com/reader/full/8084951pdf 172/240
Table VII-1.2 Iron Phases in Catalysts B and%from Fixed Bed and Slurry Reactor Tests
RUnNumberFA-1605
FA-3305
FA-3095
FA-3495
SB-0676
FB-1715
FB-2975
FA-2925
FB-0236
SB-1276
Time on
CrOS). hIronPhases dentifkd by Massbatter Iron Phases
Identifiedby Mu)
catalyst Stream
100 F& Cd 4 W16 SiO, 120top 49% (Sprn) and 5 196 (&'-Fe& E-%&
63416-4, calcined at300°C. 5 h) 120 bot 50% (Spm) and 50%(&'-Fe,,C) &'-Fe,,C100 M3 u/4 W16 SiO, 120 top 55% (Sprn) and 45% (d-Fe,C) d-k&
63416-4, calcined at4OO"C, 5 hl 120 bot 52% (Spm) and 48%(d-Fe,,C) Ef-k,,C100 Fe/3W 4 16 SiO, im op 58% (Sprn) and42%(d-Fe,C) d-k,C
63416-4,calcined at500°C 5 h) 120 bot 59% (Spm) and 41%(&'-Fe,,C) E'-k,,C100 FCnCu/4 W16 SiO, 116top 45% (Sprn) and 55%(d-Fe C) d-k c
10 0Fc/3 Cu/4 W16 SiO, 0 73% (Sprn), and 27%e o , ) R304
221 26% (Spm), 1996 and 55% (&'-Fe,C) F&O,and d-Fe,C305 R,O, andd-Fe,,C
100 Fd5Cd6 w24 SiO, 119 40% (Spm) and60%(d-k,C) d-Fe,C(S5624-3. calcined at 300°C. 5 h) &'-Fe,,C
100Fd5 Cd6 w24 SiO, 142top 54% (Sprn) and 46% (d-Fe,C) &'-k,C(S5624-3. calcined at 400°C. 5 h) 142 bot 53% (Spm) and 47%(d-Fe,,C) &'-k,,C
100Fd5 Cd6 w24 SiO, 140 top 60% (Spm) and 40% (d-Fe& &-Fe,C65624-3, calcined at 500"C, 5 h) 140 bot 56% (Spm)and 44%(&'-Fe,,C) &'-k,,C
(S3416-4. calcined at7WC. 1h) 116bot 42% (Sprn), 18% Fe,O,) and 4#(&'-Fe,,C) R,OAand3-Fe,,C
(S3416-4, calcined at 700°C 1 h) R30,aad&'-Fe,C20 39% (Sprn), 26%@e#,) and 35% (d-Fe,C)
26% (Spm). 22% (Fe,O,) and 52% (&'-Fe,,C)
42% (Spm) and 58%(d-Fe,,C)
100Fd5 Cd6 w24 SiO, 120top 39% (Spm) and 61% &'-Fe,C) &f-FeyC(S5624-3, calcined at700°C. 1 h) 120 bot 34% (Spm). 9% (Fe,O,) and 57%(d-Fe,,O k,O,andE-Fe,,C
100 Fd5 Cd6 w24 SiO,(S5624-3. calcined at700°C 1 h)
0138
31 1 384
59% (Sprn), 27% (Fb 0,).atui 14%(a-Fe)44%(Spm), 3096 @e3b4) nd 26% (d-Fe,C)
33% (Sprn), 24% @e30,) and 43% (d-Fe,C)27% (Spm), 23% (Fe,O.) and 50%(d-Fe,,C)
Fk 0,.nda-FeR,b,and d-Fe,C
Fk,O,and &*-Fe,CR,O, and&I-Fe,,c
239 39% (Sprn), 26% (Fe,O,) and 35% (d-Fe,C) R30,and&'-k,c
TOS =0h means r e d u d sample.FTS process conditions for slurry tests with catalyst C(100Fe/3 Cd4 W16 SiO,) were: T=260°C, P= 1.48 - 2.17 MPa ,&/CO =0.67,
FI'S processconditions for slurry tests with catalyst B (100Fe/5 Cd 6 K/24 SiO,) were:T 260°C, P= 1.48 - 2.17 MPa ,&IC0 =0.67,
R S rocessconditions for fmed bed tests with catalysts C and B were:T = 250°C, P= 1.48 MPa ,&/CO =0.67, SV =2.0 NYg-cath.
SV = 1.4 - 1.8NYg-cat/h.
SV = 1.2 - 2.2 NVg-catm.
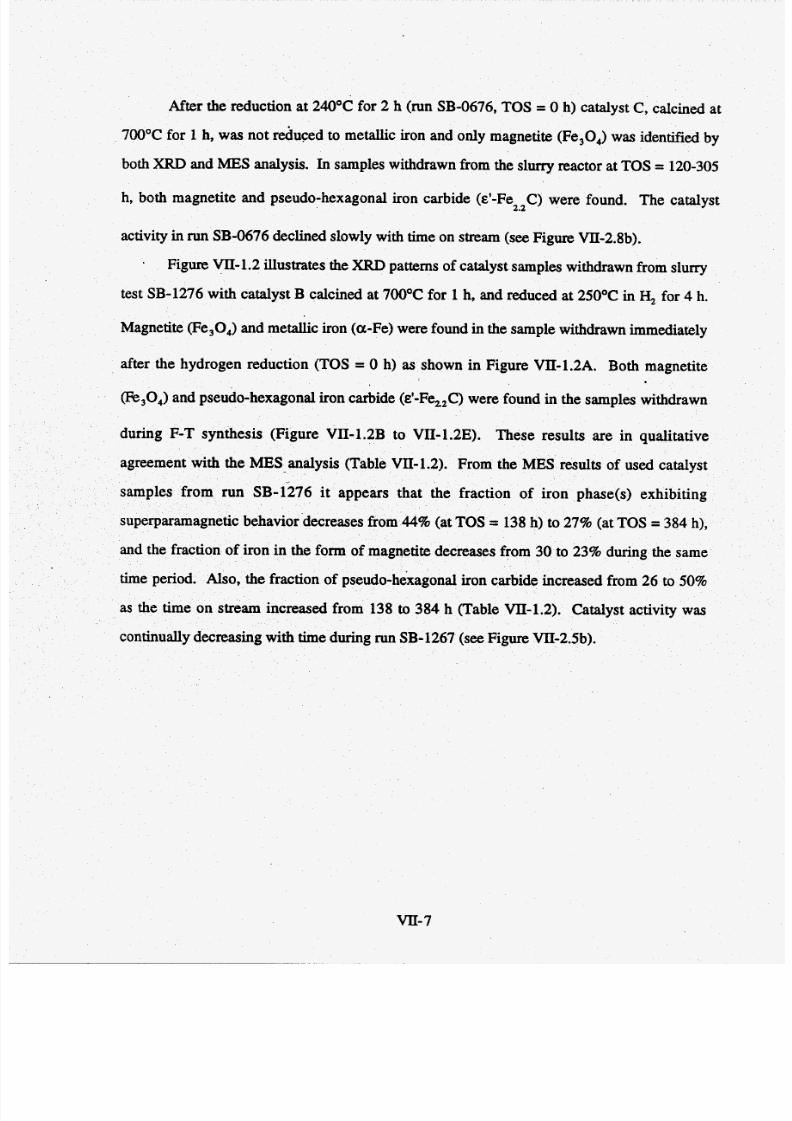
7/28/2019 808495(1).pdf
http://slidepdf.com/reader/full/8084951pdf 173/240
After the reduction a t 240OC fo r 2 h (run SB-0676, TOS = 0 h) ca talyst C, calcined at
700OC for 1h, was no t reduced to metallic iron and only magne tite (Fe,O,) was identified by
both XRD and MES nalysis. In samples withdrawn from the slurry reactor at TOS= 120-305
h, both magnetite and pseudo-hexagonal iron carbide (&'-Fe2.2C)were found. The catalyst
activity in run SB-0676 declined slowly with time on stream (see F igure VII-2.8b).
. Figure VII-1.2 illustrates the X RD patterns of cataly st samples withdrawn from slurry
test SB-1276 with cata lyst B calcined at 700OC fo r 1 h, and reduced at 250°C in H, or 4 h.
Magnetite (Fe304) nd metallic iron (a -F e) were found in the sample withdrawn immediately
after the hydrogen reduction (TOS= 0 h) as shown in Figu re VII-1.2A. Both magnetite
(Fe,O,) and pseudo-hexagonal iron carbide (e'-Fez&) were found in the sam ples withdrawn
during F-T synthesis (Figure VII-1.2B to VII-1.2E). These results are in qualitative
agreement with the ME S analysis (Table VII-1.2). From the MES results of used catalyst
n SB-1276 it appears that the fraction of iron phase(s) exhibiting
behavio r decreases from 44% (atTOS= 138 h) to 27% (at TOS= 384 h),
and the fraction of iron in the form of magnetite decreases from 30 to 23% during the same
iron carbide increased from 26 to 50%
as the time on stream increased from 138 to 384 h (Table Vn-1.2). Catalyst activity was
continually decreasing with time during run SB-1267 (see Figu re VII-2.5b).
period. Also, the fraction of pseudo-
7/28/2019 808495(1).pdf
http://slidepdf.com/reader/full/8084951pdf 174/240
I d-spacing 1
Figure VII-1.2 Changes in bulk iron phases with time on stream duringrun SB-1276 with catalyst B ( 100 Fd5 C d6 a 2 4 SiO,,
batch-3) calcined at 700OC for 1 h and reduced at 25OOC in H, for 4 h: (A)TOS= 0 h; (B ) TOS = 138 h; (C)
TOS=239 h; (D) TOS = 31 1 h; (E)TOS= 384 h.
7/28/2019 808495(1).pdf
http://slidepdf.com/reader/full/8084951pdf 175/240
Vir-2 Reaction Studies
In this section we report results on the effect of calcination temperature on
performance of cata lysts B (from batch-3) and C (from batch-4) during F-T synthesis. Both
catalysts were calcined in air at 400°C, 500OC and 7OO0C, to study the effect of calcination
temperature relative to our tandard (baseline) calcination temperature of 300OC for 5 hours.
Six fixed bed tests were completed and results from these tests are compared with
those obtained in tes ts carried out with ca talysts calcined at 300OC. Test identification and
calcination conditions are listed in Table VII-2.1. Two tests with catalysts B and C calcined
at 700OC for 1 h w ere conducted in a STSR to determine whether the trends found in fixed
VII-9
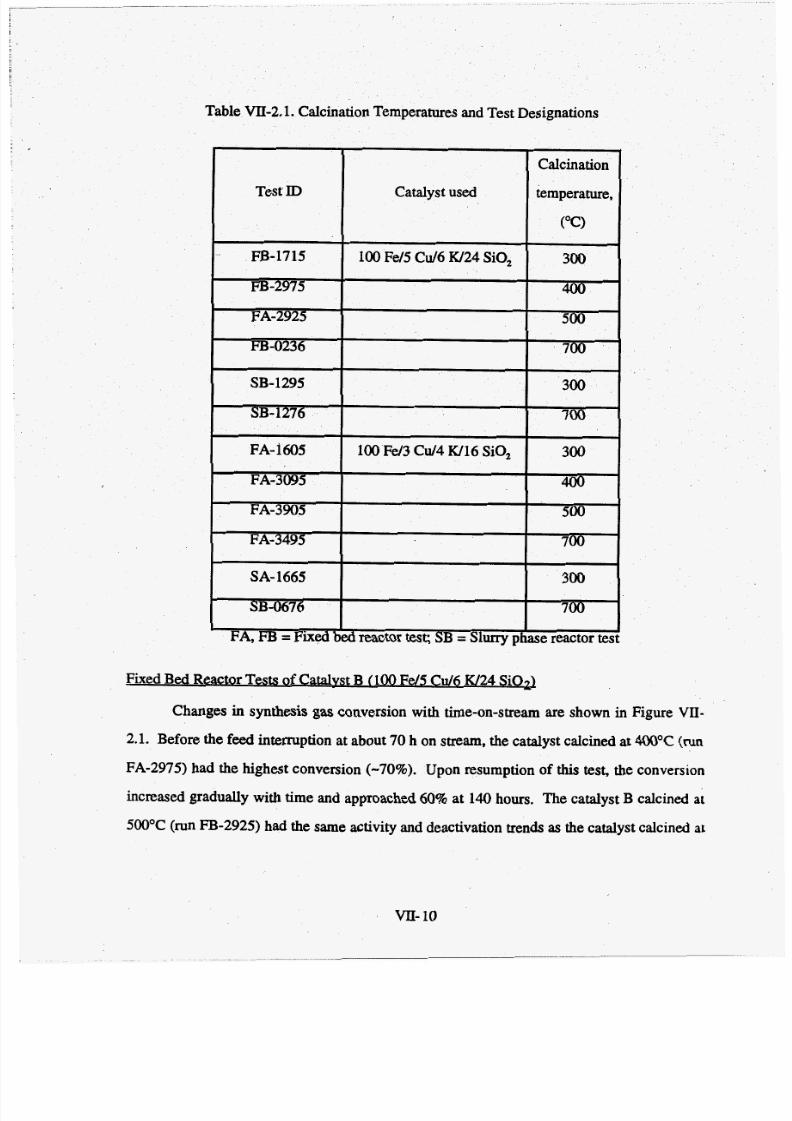
7/28/2019 808495(1).pdf
http://slidepdf.com/reader/full/8084951pdf 176/240
SA- 1665
SB-0676
VII-10
300
700I
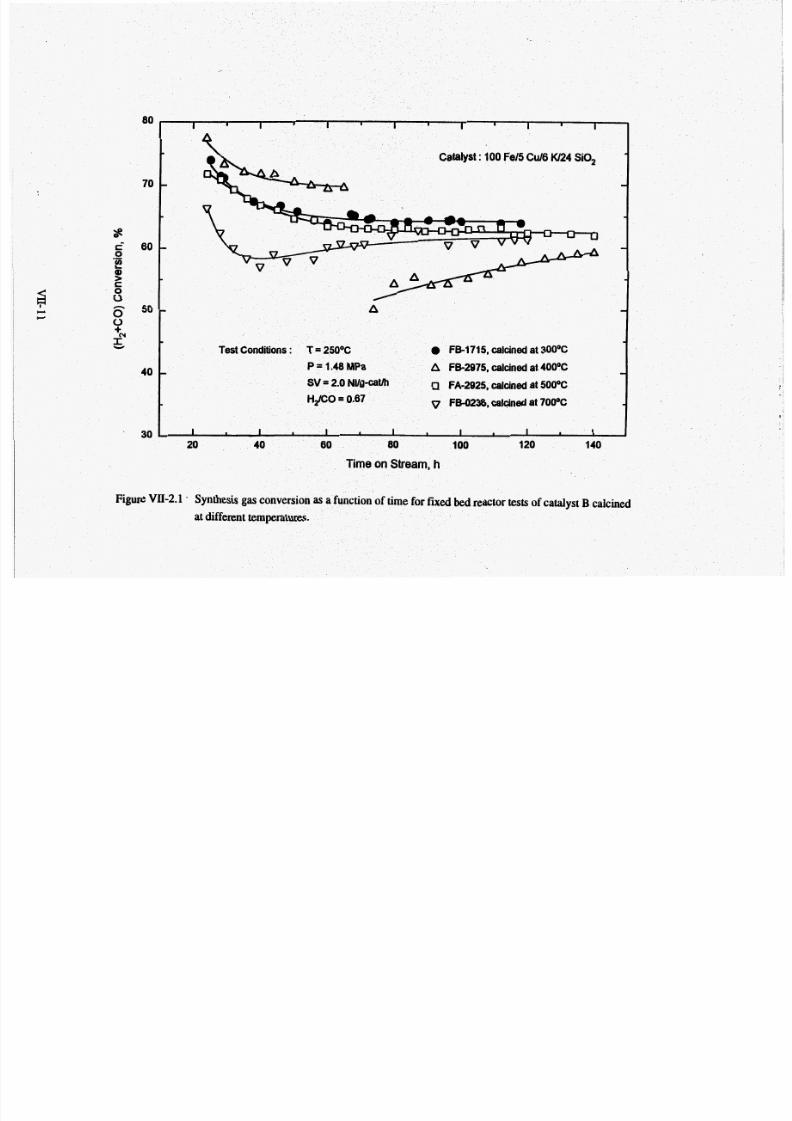
7/28/2019 808495(1).pdf
http://slidepdf.com/reader/full/8084951pdf 177/240
80
70
c 60
E0.-
9
8c
3 500
40
' 30
I I I 8 I I I I I 8 I I I
-
-
AtTest Conditions : T 25OOC 0 FB-1715, calcined at 3OOOC
P = 1.48 MPa A FB-2975, calcined at 4OOOC
SV= 2.0 NUg-caUh 0 FA-2925, calcined at 5OOOCHfiO = 0.67 v F80236, calcined at 7OOOC
Time on Stream, h
Figure VII-2.1 . Synthesis gas conversion
at different temperatures.
of time for fixed bed reactor tests of catalyst B calcined

7/28/2019 808495(1).pdf
http://slidepdf.com/reader/full/8084951pdf 178/240
300°C (run FB-1715). Initially, conversions in run FB-0236 with the catalyst calcined at
700°C for 1h were lowe; t h w in other tests, which was partly due to fluctua tions in reactor
temperature. However, after abou t 80 h on stream, the syngas conversions in this run were
similar to those obtained with catalysts calcined at lower temperatures (300 to 500°C). The
usage ratios in all four tests were similar (0.58-0.60) and stable with time.
Gaseous hydrocarbon selectivitiesas a function of time on stream for all four tests are
shown in Figure VII-2.2. Catalysts calcined at 400°C (before interrup tion of the feed flow)
and at 700°C produced m ore.methane than the ones calcined at 300°C or 500°C (FigureVU-
2.2a). Gase ous hydrocarbon selectivity (C ,C , hydrocarbons) of the catalyst calcined at
700°C (run FB-0236) was higher than that obtained in other tests (Figure VII-2.2b).
FixedBed Reactor Tests of C u v s t C (100Fd 3 Cu/4 W16 Si03
As shown in Figure VII-2.3, the initial syngas conversion of the catalysts calcined at
400°C (run FA-3305) and 500°C (run FA-3095), were the same as that of the catalyst
calcined at 300°C (run FA-1605). However, the catalysts calcined at 4 00°C and 500OC
deactivated faster than the catalyst calcined a t 30O0C, and at 100h on stream the conversions
in these two tests were about 8% less than those obtained inrunFA-1605. he synthesis gas
conversion in run FA-3495 with the catalyst calcined at 700°C w as significantly lower than
that obtained with catalysts calcined at 300-500"C. The usage ratios in all four tests were
about the same, 0.57-0.60 indicating similarWGS ctivity.
Gaseous hydrocarbon selectivities in all fou r tests were similar. For example,
methane selectivity was generally between 5% and 6%, (Figure VII-2.4a), and C,€
selectivities were between 21% and 25% (Figure VII-2.4b).
VII-12
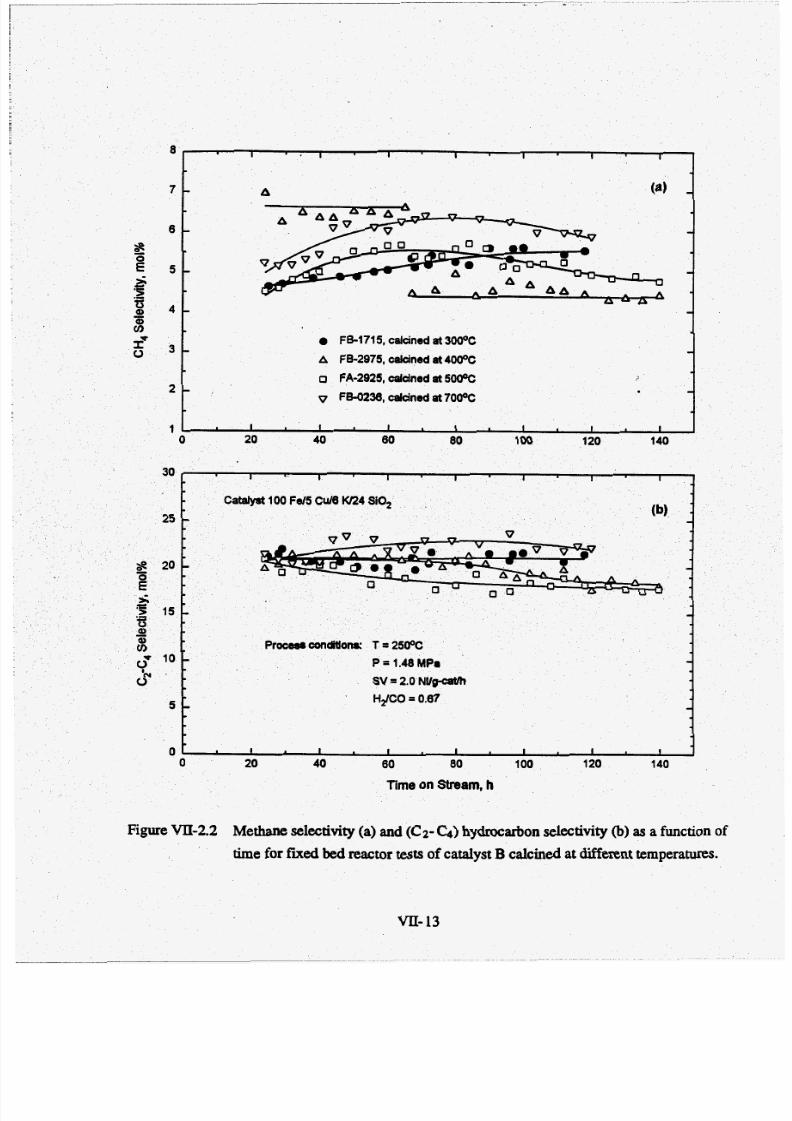
7/28/2019 808495(1).pdf
http://slidepdf.com/reader/full/8084951pdf 179/240
2 t
30
25
$ 2 0 -
s
-E3.e
Q)-8
5
q ' 0 :
5 -
0
a
rI I I I I I I
Catalyst 100 FelS Cul6 KR4 SiO,
- (b) :
-
- -
o m T=2500C
P = 1.48 MP8 -SV = 2.0 NWacaM,
H+CO = 0.67 -
I I I I I I I
0 FB-1715, calcined at 3OOOC
A FB-2975, calcined at400%
o FA-2925, caldned at 5oooC ?
v FB-0236, caldned at7OOOC
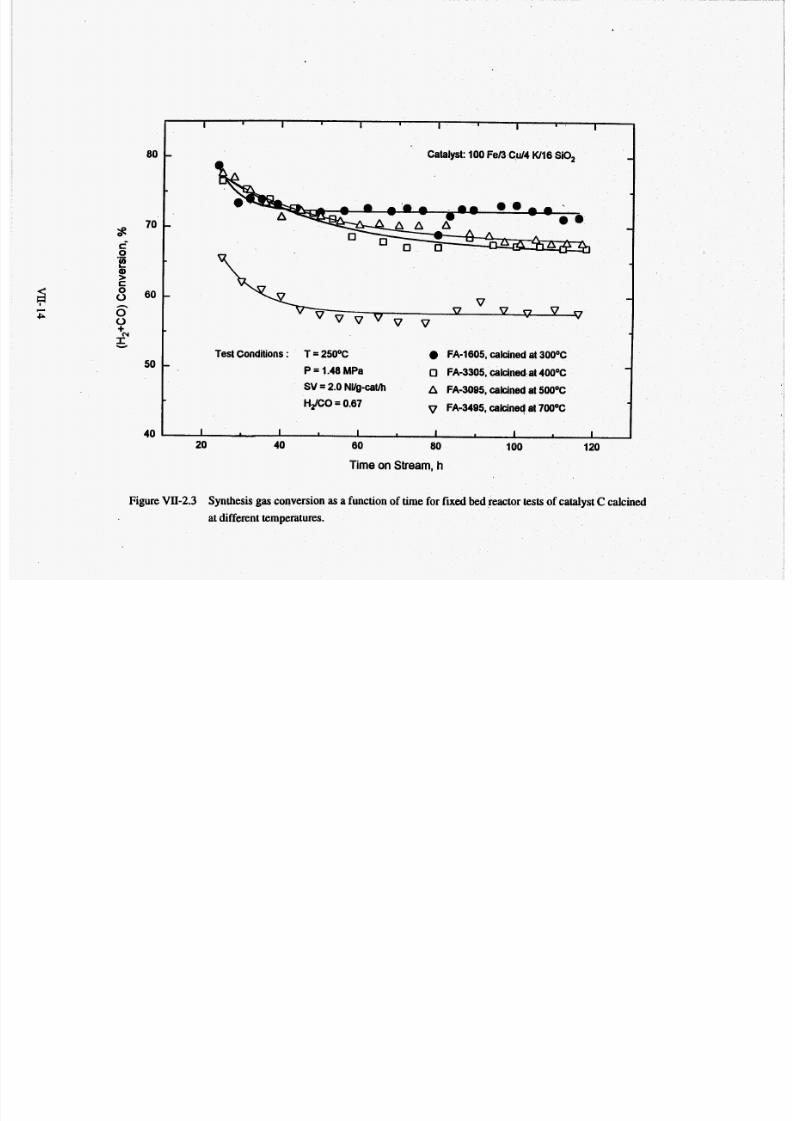
7/28/2019 808495(1).pdf
http://slidepdf.com/reader/full/8084951pdf 180/240
80
70
60
50
40
I I I I I I I II I
I
cCatalyst: 100Fen Cu/4 K/16 SiO,
Test Conditions : T = 25OOC FA-1605, calcined at 300°C
P= 1.48 MPa 0 FA-3305, calcined at 4OOOC
SV = 2.0 NUg-cat/h A FA-3095, calcined at 5OOOC
HdCO= 0.67 v FA-3495, calcined at 7WoC
I I I I I I I I 1 I
20 40 60 80
Time on Stream, h
100 120
Figure VII-2 .3 Synth esis gas conversion as a function of time for fixedbed reactor tests of catalystC calcined
at different temperatures.
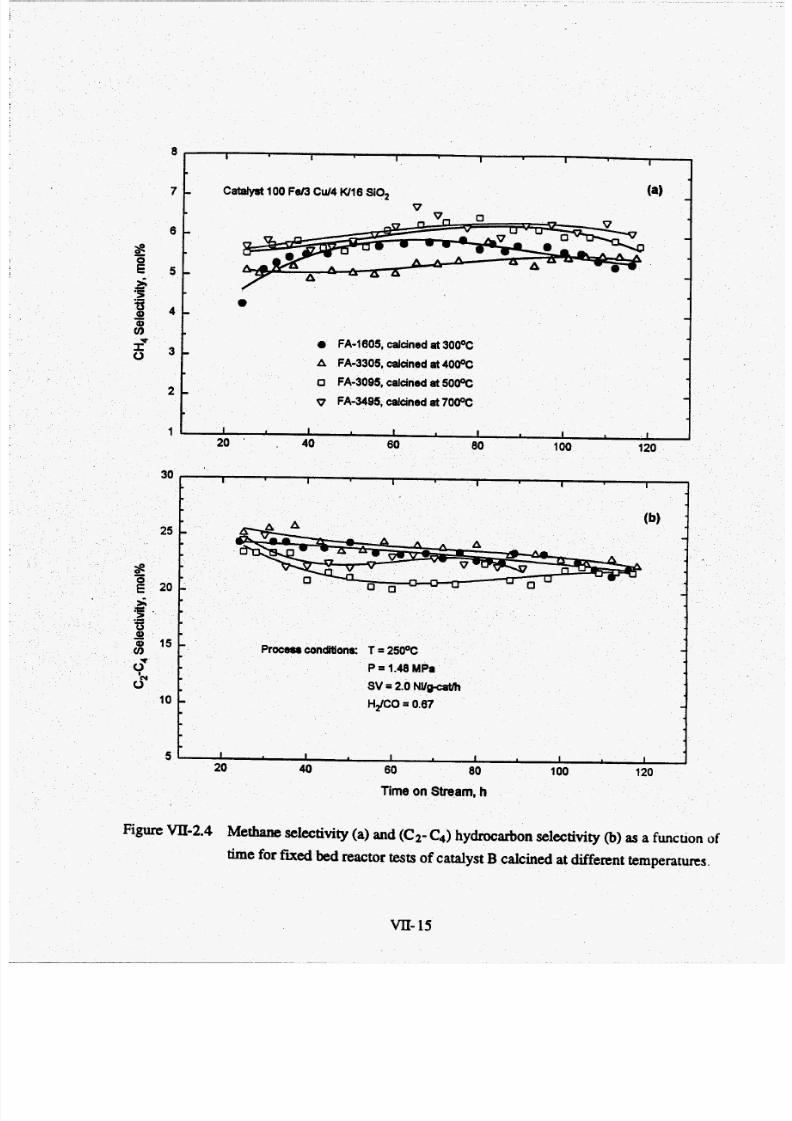
7/28/2019 808495(1).pdf
http://slidepdf.com/reader/full/8084951pdf 181/240

7/28/2019 808495(1).pdf
http://slidepdf.com/reader/full/8084951pdf 182/240
..- ... . . ......... . . .. .. .- .. .. . _.. .~. .... ~- -. .. . ... .
VII-2.2 Stirred Tank Slurry Reactor Tests
For slu rry reactor tests 14 to 16 g of catalyst B and C (particle size less than 53 pm)
calcined at 7OOOC for one hour was charged to a reactor, and Durasyn 164 oi l was used as the
initial slurry liquid. The initial concentration of slurry was 4.8-5.4 wt%. The catalyst was
reduced with hydrogen, at 7500 cms/min, 0.8 MPa and 25OoC fo r 4 hours (catalyst B), or
240OC or 2 hours (catalyst C). The same reduction conditions were used for catalystsB and
C calcined a t 30OOC.
After the p retreatment, the cata lysts were tested at 26OoC, 1.48 MPa, synthesis gas
molar feed ratio of 0.67 and gas space velocity of 2,2 NYg-cat& for 48 h, and then at 1.8
Nllg-cat& for the next 138 hours. The syngas conversion in run SB-1276 with the catalyst
calcined at 7OOOC was significantly lower than that obtained in the test of the catalyst
calcined at 300OC (SB-1295) under the same process conditions (Figure VII-2.5a). For
example at 26OoC, 1.48 MPa, gas space velocity of 1.8 NVg-cat& the syngas conversion was
about 70% for the catalyst calcined at 3OO0C, whereas the syngas conversion with the
catalys t calcined at 70OOC was 57%. To get higher conversions with the cataly st calcined at
7OO0C,higher reaction pressure (2.17 MPa) and lower gas space velocity (1.2 NVg-cat&)
were used.
Com parison of catalyst activity in terms of the apparent reaction rate constant is
shown in Figure VII-2.5b. The catalys t deactivated with time in both tests, but during the
first 150 hours on stream the rate of deactivation was much higher on the catalys t calcined at
300°C(run SB-1295). The deactivation rate of the catalyst calcined at 70OOC (runSB-1276)
VII-16
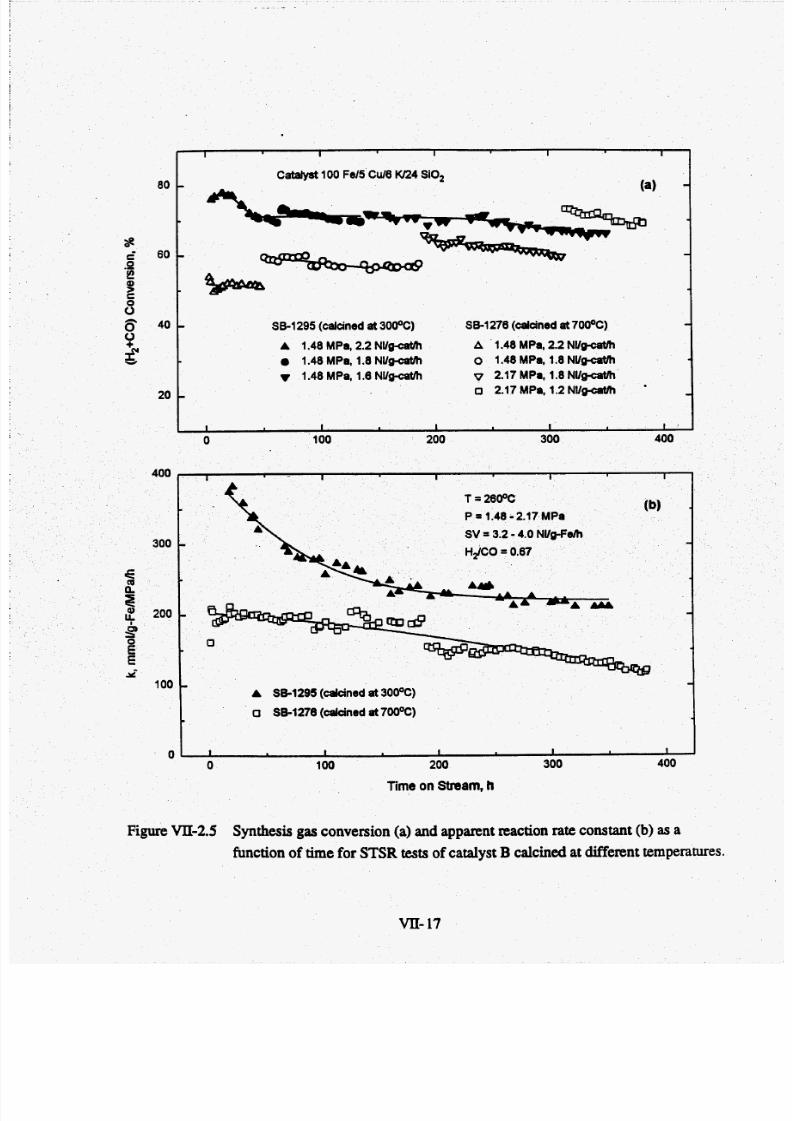
7/28/2019 808495(1).pdf
http://slidepdf.com/reader/full/8084951pdf 183/240
80
8
3
6
600
t
8 40
Y
z20
400
fsq 200
9 EEu-
0
100
a
I I I I I
Catalyst 100 F0/5 Cui6 w2 4 SiO,
SB-1295 (calcined at 300%) SB-1278 (calcined at700%)
A 1.48 MPa, 2.2 N U g a t h A 1.48 MPa, 2.2 NUpcat/h
0 1.48 MPa, 1.8 N U g a t h o 1.48 MPa, 1.8 NUg-caVh1.48 MPa, 1.6 N U g a U h v 2.17 MPa, 1.8 NU-
o 2.17MPa. 1.2NUg-caVh *
0 58-1278 (&nod at 700OC)
I I I I I
0 100 200 300 400
Figure VII-2.5
Time on Stream, h
Synthesis gas conversion (a) and apparent reaction rate constant (b) as a
function of time for STSR tests of catalyst B calcined at di ff em t temperatures.
VII- 17
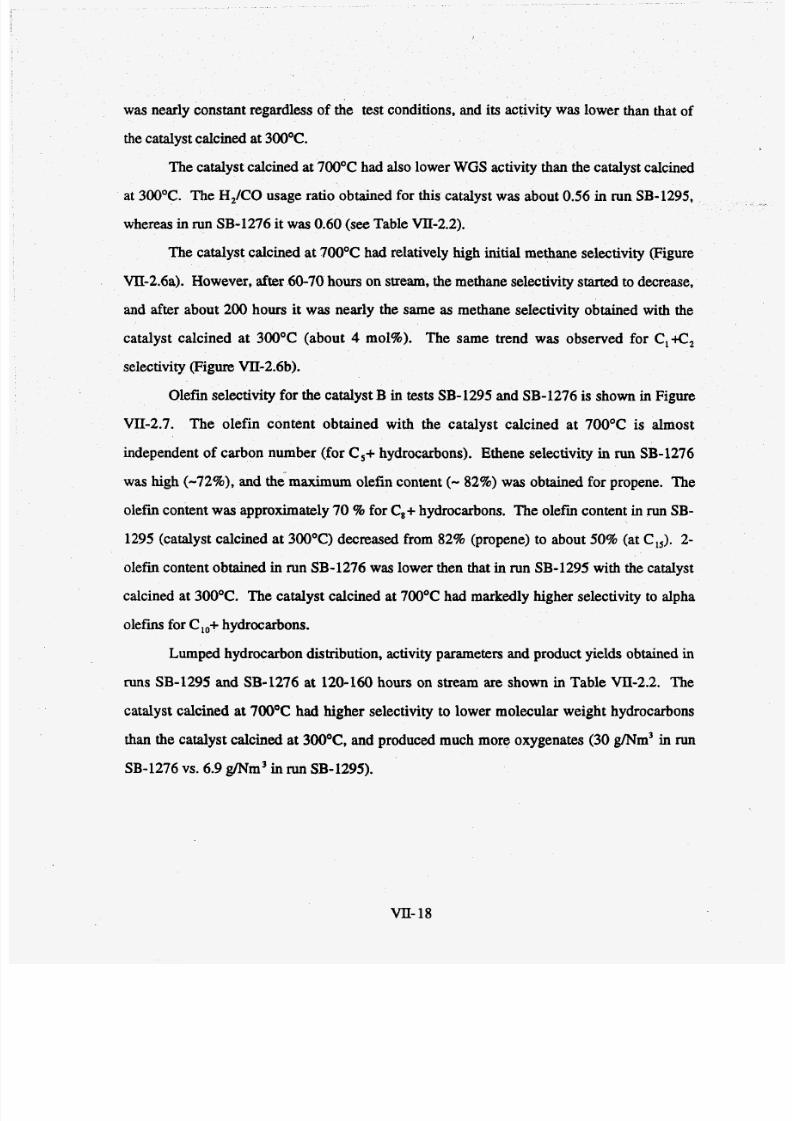
7/28/2019 808495(1).pdf
http://slidepdf.com/reader/full/8084951pdf 184/240
was nearly constant regardless of the test condition s, and its activity was lower than that of
the catalyst calcined a t 300OC.
The catalyst calcined at 700OC had also lowerWGS ctivity than the catalyst calcined
at 3OoOC. The H,/CO usage ratio obtained for this catalyst was about 0.56 in run SB-1295,
whereas in run SB-1276 it was 0.60 (see Table VII-2.2).
The ca talyst calcined a t 700OC had relatively high initial methane selectivity (Figure
Vn-2.6a). However, after 60-70 hours on stream, the methane selectivity started to decrease,
and after about 200 hours it was nearly the same as methane se lectivity obtained with the
catalyst calcined at 300OC (about 4 mol%). The same trend was observed for C,tC,
selectivity (Figure VII-2.6b).
Olefin selectivity for the ca talyst B in tests SB-1295 and SB-1276 is shown in Figure
VII-2.7. The olefin content obtained with the catalyst calcined at 7OOOC is almost
independent of carbon number (for C,+ hydrocarbons). Ethene selectivity in run SB-1276
was high (-72%), and the maximum olefin content (- 82%)was obtained for propene. The
olefin content was approxim ately 7 0 % fo r C,+ hydrocarbons. The olefin content in run SB-
1295 (catalyst calcined at 300OC) decreased from 82% (propene) to about 50% (at CIS ). 2-olefin content obtained in run SB-1276 was lower then that in run SB-1295 with the catalyst
calcined at 300°C. The catalyst calcined at 700OC had markedly higher selectivity to alpha
olefins for Clo+ydrocarbons.
Lumped hydrocarbon distribution, activity parameters and product yields obtained in
runs SB-1295 and SB-1276 at 120-160 hours on stream are shown in Table VII-2.2. The
catalyst calcined at 700OC had highe r selectivity to lower m olecular weight hydrocarbons
than the ca talyst calcined at 30O0C, and produced much more oxygenates (30 g/Nm3 in run
SB-1276 vs. 6.9 g/Nm3 n run SB-1295).
W-8

7/28/2019 808495(1).pdf
http://slidepdf.com/reader/full/8084951pdf 185/240
7I I I I I
1
6 - (a) -
5 - -ZR
4 -
Gg 3 -
f 2 - -
-
- -8
Catalyst 100 Fd5 CU B w24 SiO,- -
0 I I I I I
0 100 200 300 400
14
12
10
g a;.e
62 6
5 SB-1295 (&nod at 300%) SB-1276 (dried at7 m )
0 A 1.48 MPa, 2.2 NU A 1.48 MPr, 2.2 NVgcatlh
0 1.48 MP8, 1.8 NU
v 2.17 MPa, 1.8 NVgcaM,
o 2.17 MPa, 1.2 NU
8
+ 4
0 1.48 MPq 1.8 NUg-caUh
v 1.48 MPq 1.6 NVg-cath
2
00 100 200 300 400
Time on Stream, h
Figure VII-2.6 Methane selectivity (a) and (C I +C,)hydrocarbon selectivity (b) as a function’
of time for STSR tests of catalyst B calcined at differenttemperatures.
VII-19
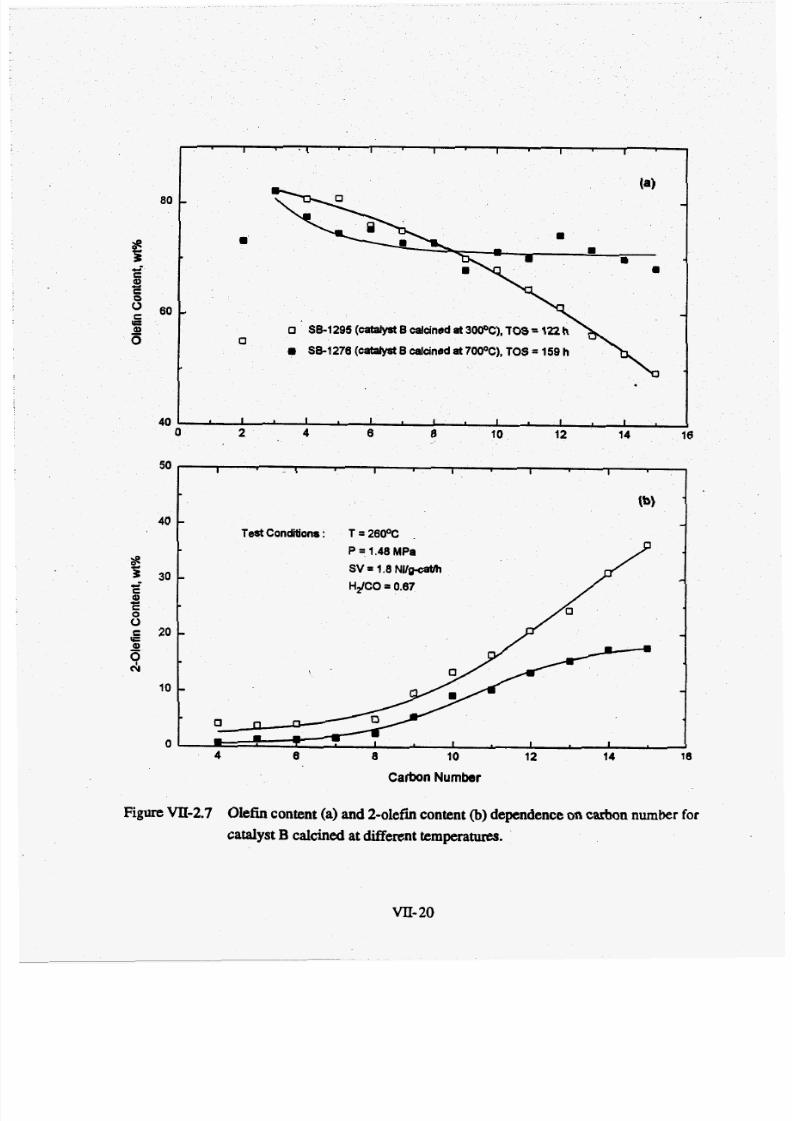
7/28/2019 808495(1).pdf
http://slidepdf.com/reader/full/8084951pdf 186/240
80
3U-
c
c' 0 -rICQa
B
40
I I I I I I I
(a)- -
-o SB-1295 (cablystB calcined at SOOOC), TOS = 122 h
SB-1276 (catalystB calcined at 70OOC), TOS = 159 h0
I I I I I I I
FigureVII-2.7 Olefin content (a) and 2-olefin content (b)dependence on carbon number for
catalyst B calcined at different temperatures.
40
VII- 0
I I I I I I
(b)
- -Test Condifions : T = 260%
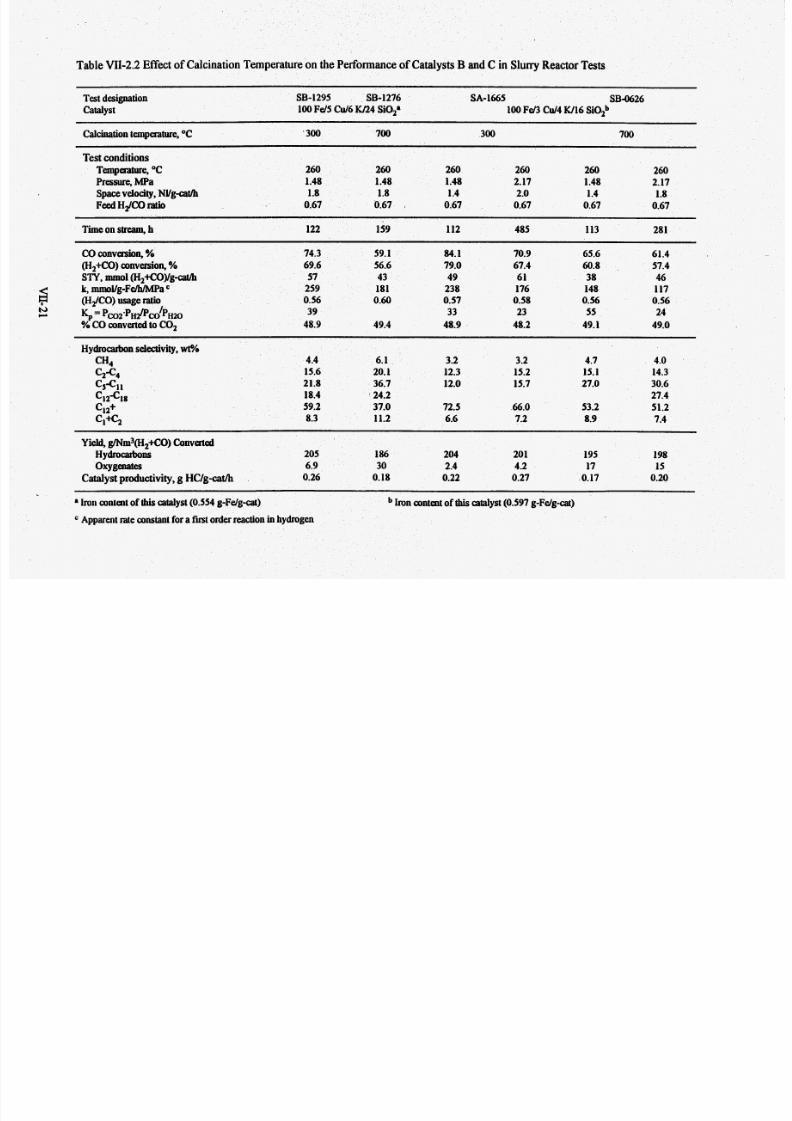
7/28/2019 808495(1).pdf
http://slidepdf.com/reader/full/8084951pdf 187/240
Table VII-2.2 ffect of Calcinatio n Tempe rature on the Pexformance of CatalystsB and C n Slurry Reactor Tests
SB-0626est designation SB-1295 SB-1276 SA-1665
catalyst 100Fd5Cu/6 IU24 SiO,. 100Fd3 C d 4 W16 SiOZb
Calcination emperature, "C '300 700 300 700
Test conditionsTemperature, OC 260 260 260 260 260 260
Pressure, MPa 1.48 1.48 1.48 2.17 1.48 2.17
Spacevelocity,NYgCatm 1.8 1.8 1.4 2.0 1.4 1.8FeedHdCOratio 0.67 0.67 0.67 0.67 0.67 0.67
Time on stream, h 122 159 112 485 113 281
CO conversion,% 74.3 59.1 84.1 70.9 65.6 61.4
(H,+CO) conversion,% 69.6 56.6 79.0 67.4 60.8 57.4
STY, mmol (H,+Coyg=cat/b 57 43 49 61 38 46k, mmOYg-Fem/Mpa 259 181 238 176 148 117
(HdCO) usage ratio 0.56 0.60 0.57 0.58 0.56 0.56
l$ = pC!02'pH~CO'pH2039 33 23 55 24
% CO convertedtoCO, 48.9 49.4 48.9 48.2 49.1 49.0
Hydrocarbon electivity, wt?!
4.4 6.1 3.2 3.2 4.7 4.0
15.6 20.1 12.3 15.2 15.1 14.3
21.8 36.7 12.0 15.7 27.0 30.618.4 24.2 27.4
59.2 37.0 72.5 66.0 53.2 51.2
8.3 11.2 6.6 7.2 8.9 7.4
CH4
%-c4
CS-Cll
c12+
Cl%
c12-c18
Yield, g/Nm3(H2+CO) Converted
Catalyst productivity, g HC/g-cat/h 0.26 0.18 0.22 0.27 0.17 0.20
Hydrocarbons 205 186 204 201 195 198
oxygenates 6.9 30 2.4 4.2 17 15
a Iron content of thiscatalyst(0.554 g-Fdga t) Ironcontent ofthiscatalyst (0.597 g-Fdgat)
Apparent rate constant fora firstorderreaction n hydmgen
7/28/2019 808495(1).pdf
http://slidepdf.com/reader/full/8084951pdf 188/240
<he catalysts were tested initially a t 26OoC, 1.48 MPa, synthesis gas molar feed ratio
of 0.67 and gas spa ce velocity 1.4 NYg-cat&, and then the pressure was increased to 2.17
MPa, and the gas spac e velocity was increased to either 2.0NYg-cath in run SA-1665 or to
1.8 NYg-cat& in run SB-0626. The syngas conversions on the catalyst calcined at 7OOOC
(run SB-0626) were lower than those obtained in run SA-1665 with the catalyst calcined at
300OC (Figure VII-2.8a).
The apparent reaction'rate constants for these two tests are shown in F igure VII-2.8b.
The initial value of k inrun
SA-1665 was about 250 mmoVg-Fe/h/MPa and then it decreasedto 24 0 mmoY g-Fe/h/MPa at 270 hours.. The activity of the catalyst C calcined at 700°C also
decreased with time, and its deactivation rate was fairly constant. The reaction rate cons tant
decreased from initial value of 150mmoVg-Fe/h/MPa to 117 mmoVg-Fe/h/MPa at 380 hours.
The WGS ctivity of the catalyst C was not a ffected by calcination temperature, and varied
between 0.56 and 0.57 in both tests (Table VII-2.2).
Initially, the catalyst calcined a t 700°C (SB-0626) had higher methane and C , K ,
selectivity than the c atalyst calcined a t 300OC (SA-1665) (Figure VII-2.9). For example, at
about 100h on stream the m ethane selectivities were 4 mol% and 2.8 mol% fo r the catalysts
calcined at 700OC and 300"C, respectively. However, methane and C ,tC , hydrocarbon
selectivity of the catalyst calcined at 70OOC decreased with time, and becam e more similar to
those obtained in run SA-1665. For example, at 250 hours the m ethane selectivities were 3.5
mol% and 2.8 mol% for the catalys t calcined at 70O0Cand 300°C, respectively.
VII- 22

7/28/2019 808495(1).pdf
http://slidepdf.com/reader/full/8084951pdf 189/240
100
8 0 -
z3
T!
008
-c0
9 60c
Y40
20 I
VII- 23
.I I 1 I I
Catalyst 100 Fed3 CU14 W16 SiO,(a)
-
-i -0
SA-1665 (calcinedat 300o)C)
m 1.48 MPa, 1.4 NUg=&hA 2.17 MPa, 2.0 N U g a u h
88-0626 (calcinedat 700%)
o 1.48 MPa, 1.4 NU-
A 2.17 MPa, 1.8 NUg.cat- -
I I I
100
1 I
300
200
f- 3
4
E9
E 100
r-
0
'I I I I I
- -
- -A SA-lMS (cdcined at 300%) T = 260%
o S60626 (calcined at 700°C) P = 1.48 - 2.17 MPa
HdCO = 0.67
SV 3.0
-3.8 NUg-Feh
I I I I I
0
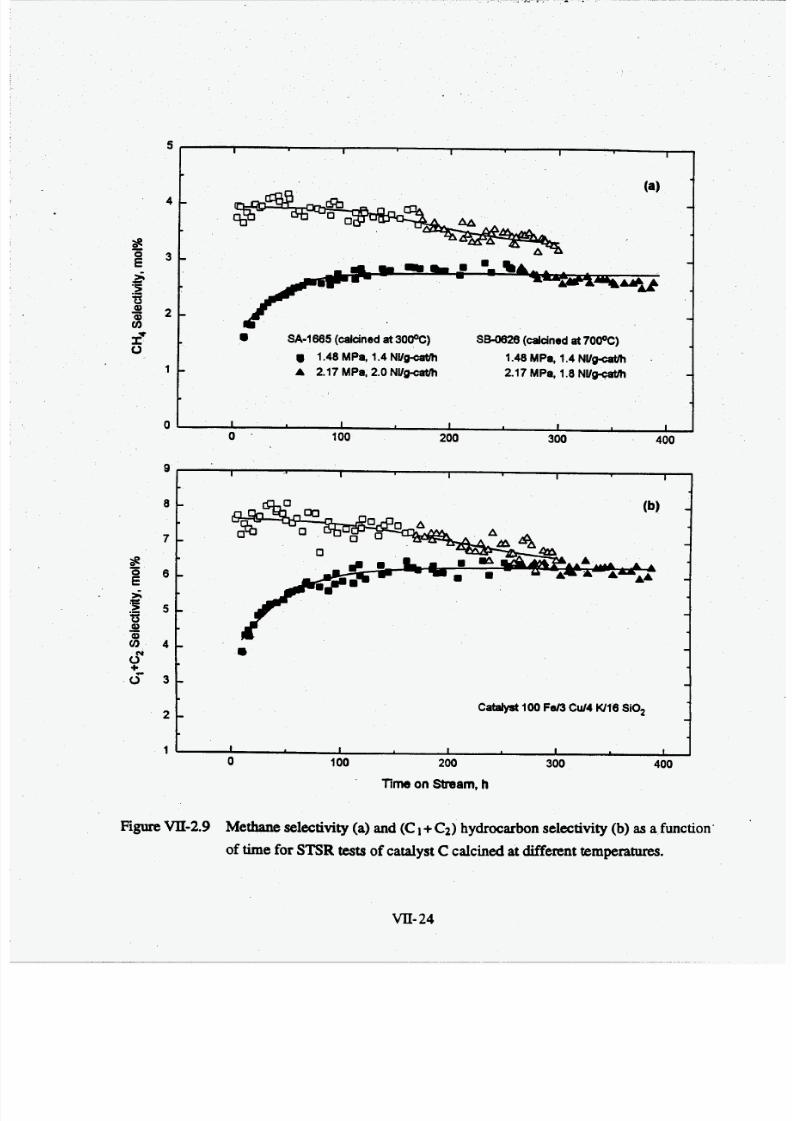
7/28/2019 808495(1).pdf
http://slidepdf.com/reader/full/8084951pdf 190/240
5
4
-z 3
1 -
0
SA-1665 (calanedat300%) SB-0626 (calaned at 700%)
1.48 MPa, 1.4 NWg-caUh 1.48 MPa, 1.4 NWgeaUhA 2.17 M Pa, 2.0 NWg-caUh 2.17 MPa, 1.8 NWgeaUh -
I I I I I
9
8 -
7 -
6 -
5 -
4 -
3 -
2 -
1
Figure VII-2.9 Methane selectivity (a) and (C 1+C2) ydrocarbon selectivity (b) as a function'
of time for STSR tests of catalyst C calcined at different temperatures.
I I I I I
-
-
-
-
-
-
CaWyst 100 Fd3 Cu14 W16 SiO,
-I I I I I
VII- 4
7/28/2019 808495(1).pdf
http://slidepdf.com/reader/full/8084951pdf 191/240
Total olefin and 2-olefin contents of catalyst C calcined at two different
temperatures are shown in Figure VII-2-10. As in the case of catalyst B, the olefm content of
the catalyst calcined at 700°C is alm ost independent of carbon number for C,+ hydrocarbons,
and its 2-olefin content is lower then that obtained with the catalyst calcined at 300°C (SA-
1665).
Lumped hydrocarbon distribu tion at differen t times on stream is shown in Table
VII-2.2. Catalyst calcined at 700°C had higher selectivity to lower molecular weight
products, and its gasoline fraction is 27-31% of total hydrocarbon products. Also, he
catalyst calcined at 700°C had much higher yield of oxygenates than the catalyst calcined at
300°C.
VII- 5

7/28/2019 808495(1).pdf
http://slidepdf.com/reader/full/8084951pdf 192/240
+-E
E2
8
80
60
Ccc9)
a
-
-
+-C
EB
s
I I I I 1 I
-
-
-
-
I I I I I I
4 6 8 10 12 14 16
EccQ)
6A
I0
50
40
30
20
10
0
A
A
A SA-1665 (cahdystC calaned at 3OO0C),TOS = 220h
A SB-0626 (cablystC calcined at7oooC), TOS = 159 h
I I I I I I I I I
0 2 4 6 8 10 12 14 16
Test Conditions : t 26OoCP = 1.48 MPa
S V = 1.4 NVg-caUh
HdCO = 0.67
Carbon Number
FigureVII-2.10 Olefin content (a) and 2-olefin content (b)dependence on carbon number for
catalyst C calcined at different temperatures.
VII-26
7/28/2019 808495(1).pdf
http://slidepdf.com/reader/full/8084951pdf 193/240
COW- on the C a l c m o n Effect Resew h.
We have conducted six fixed bed reactor tests, and two slurry reactor tests under this
task. Both catalyst B (100 Fe/5 Cu/6 W24 SiO,) and C (100 Fd 3 Cu/4 W16 SiO,) were
tested in fixed bed reactors after calcinations at 40O0C and 500OC for 5 h, and after flash
calcination at 700OC for 1 h, and in a s t i r r e d tank slurry reactor after flash calcination at
VII-27
7/28/2019 808495(1).pdf
http://slidepdf.com/reader/full/8084951pdf 194/240
VII-3 References
Anderson, R. B., inCatalysis, Emmett, P. H., Ed.,Van Nostrand-Reinhold, New York, Vol.
IV, p. 29-255 (1956).
Anderson, R. B., The Fischer-Tropsch Synthesis, Academic Press,Orlando (1984).
Hadjigeorghiou, G. A. and Richardson, J. T., “Fischer-Tropsch Selectivity of N U N 2 0 3
Catalysts”, Appl. Catal., 21, 1 1 (1986).
Richardson, J. T.; Cullinane, M. B. and Frank,A. S., “Characterization and Deactivation of
NiO -Th o2 Catalysts,” Appl. Catal., 48 , 15 9 (1989).
VII- 8
7/28/2019 808495(1).pdf
http://slidepdf.com/reader/full/8084951pdf 195/240
VI11 Catalyst Characterization
The goals of this task are to: (a) provide basic characterization of all catalyst prepared
(atomic absorption analysis, surface area, X-ray diffraction); (b) determine bulk iron phases
after the pretreatment and during Fischer-Tropsch synthesis in fixed bed and or slurry reactors
by XRD and Miissbauer effect spectroscopy (at University of Kentucky); and (c) study
reduction behavior of iron F-T catalysts by isothermal and temperature programmed reduction
(TPR).These studies may lead to activity-structure relationships, and better understanding of
the factors w hich influence catalyst activity, selectivity and longevity.
vm- 1
7/28/2019 808495(1).pdf
http://slidepdf.com/reader/full/8084951pdf 196/240
M Testing of Alternative Catalysts
Although catalysts B and C have desirable activity and selectivity characteristics, hey
may not have a sufficient m echanical strength and attrition properties required for utilization
in comm ercial bubble column slurry reactors. Th is task has been undertaken with the
objective to test catalysts with potentially improved mechanical and attrition properties. Four
supported catalysts were synthesized (see Appendix 1 for details) by conventional
impregnation of two comm ercial supports (silica - Davison grade 952; and alumina - Vista
B). Nominal compositions (on m ass basis) of syn thesized catalysts are: (1) 100 Fe/5 Cu/6
W139 SiO, (2) 100 Fell0 C d 6 W134 SiO,, (3) 100 Fe/5 C d 6 W139 Al,03 and (4) 100
Fe/lO Cu/6 W 134 Al,03 . The corresponding weight % of iron (as metal) in the prepared
catalysts is about 33.8%.
Reduction behavior of the fou r supported catalysts was studied by both temperature
programmed and isothermal reduction in hydrogen, and by isothermal reduction in CO at
280°C. Also, two precipitated promoted iron catalysts, containing aluminum oxide as a
binder, were characterized by isotherm al reduction in the TGA unit with hydrogen at 240°C
and 280°C. Nominal compositions of these two catalysts are: 100 Fe/5 Cd 4.2 W20 A1,0,
and 100Fe/5Cd4.2K/3 1.6AI,0 3. These catalysts were synthesized earlier in our laboratory
during DOE ontract DE-AC22-85PC80011 using the procedure described in Appendix 1.
Compositionof these two catalysts is sim ilar to our catalystsC and B, except that aluminum
oxide was used as a b inder instead of silicon oxide. Results from catalyst characterization
studies are described in section IX-1, whereas results from three slurry reactor tests of
catalysts 100 Fe/5 Cd 4.2 W20Al,O, (run SA-0097), 100 Fe15 C d 6 W139 SiO, (SB-0627)
and 100 Fe/5 C d 9 U 139 Al,O, (SB-2337) are described in section IX-2.
7/28/2019 808495(1).pdf
http://slidepdf.com/reader/full/8084951pdf 197/240
1x01 Catalyst CharacterizationStudies
Elemental and BET Surface Area Measurem ents
Elemental compositions of the four catalysts prepared by impregnation of the two
supports, determ ined by Huffman Laboratories , Inc., are listed in Table IX-1.1. In general,
amounts of promoters (Cu and K), relative to metallic iron, are in good agreem ent with their
intended (nominal) amoun ts. How ever, experimentally determined amounts of silica and
alumina are in all cases less than the expected amounts, which is due t o experimental errors
(incomplete dissolution of these two oxides and errors in their quantification).
The BE T surface areas of calcined supports (air at 500°C for 5 h) were 308 m2/g
(Davison silica support) and 195 m2/g (Vista B alumina support), whereas the correspondingpore volumes were 0.7 m3/g and 0.45 cm3/g (Table IX-1.1).
The surface areas of impregnated supports (after calcination at 300°C for 5 h)
determined by single point BET method in the Pulse Chemisorb 2705 unit are also
summ arized in Tab le IX-1.1. Th e BET urface area of silica supported catalysts (100 Fe/5
Cu/6 W139 SiO, and 1 00 Fe ll0 Cu/6 W134 SO ,) is about 94-103 m2/g ,and that of alumina
supported catalysts (100 Fe/5 Cu/6 W139 AI,O, and 100 Fe/5 Cu/6 W1 34 Al,O,) is 94-136
m2/g. Comparing the BET surface areas of supports before and after the impregnation it is
observed that the surface areas of both supports (252 m2 /g for silica and 2 13 m 2/g for
alumina) is reduced markedly (to about 94-136 m2/g) after the addition of iron, copper, and
potassium. Th e decrease in surface area of the supports is attributed to the pore filling andlor
pore blocking of mesopores during the impregnation step.
TemDerature Pro-d ReductiQp (TPU
Results from TPR measurem ents (peak positions and degree of reduction) of the four
supported catalysts are sum marized in Tab le IX-1.2.
Figure IX-1.1llustrates TPR profiles of 100Felx C d 6 Wy SiO, catalysts (where x=
5 or 10; y = 13 4 or 139) prepared by impregnation of the Dav ison silica support. The peak
positions fo r the catalyst having smaller amount of copper promoter (5 pbw of Cu per 100
Ix-2
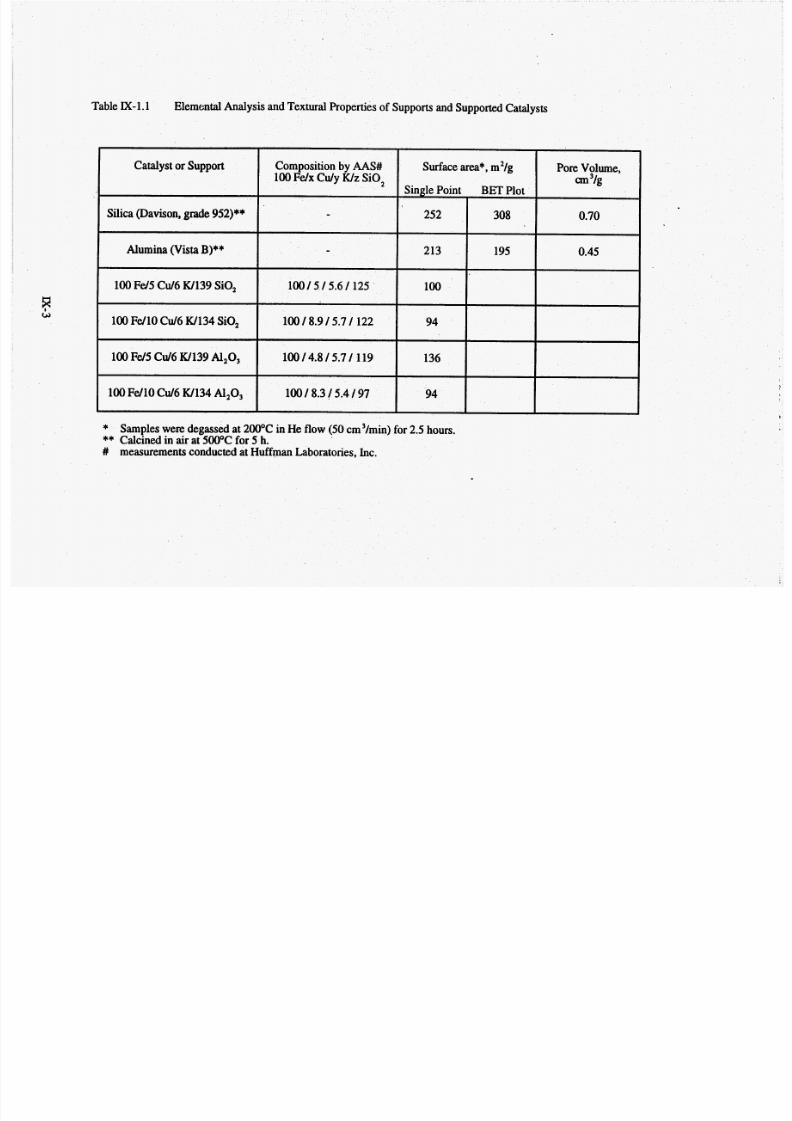
7/28/2019 808495(1).pdf
http://slidepdf.com/reader/full/8084951pdf 198/240
Table IX-1.1 Elemental Analysis and Textural Properties of Supports and Supported Catalysts
Catalyst or Support
Silica (Davison, grade 952)**
Alumina (Vista B)**
10 0 F d5 C d 6 W139 SiO,
10 0 FdlO C d 6 W134 SiO,
100 Fd 5 C d 6 W139 A1203
100 FdlO Cd6 W134 A1203
Pore Volume,omposition by AAS# Surface area*, m2/g
Single Point BET Plot
100Fdx C d y Wz iO , cm Ig
- 252 308 0.70
213 195 0.45
100I 5 I 5.6 I 125
10 0 18.9 15.7 I 122
100
94
10014 .815 .71 119 136
10 0 I 8.3 I 5.4197 94
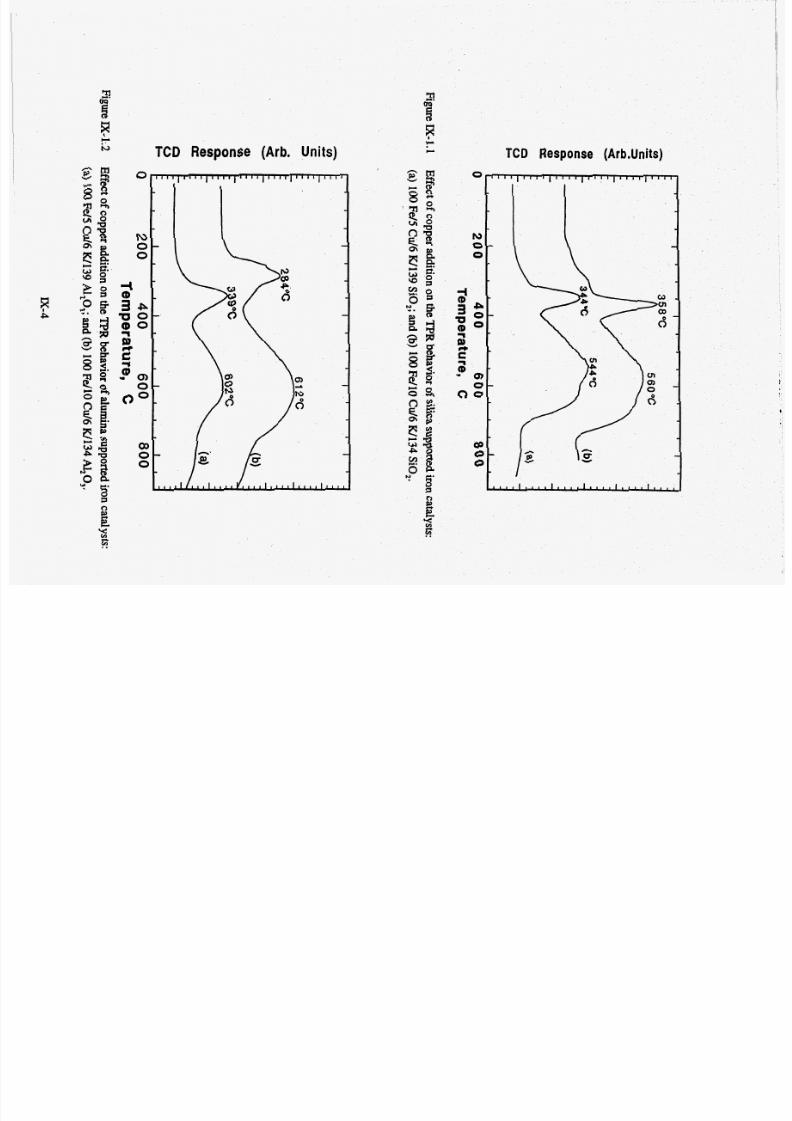
7/28/2019 808495(1).pdf
http://slidepdf.com/reader/full/8084951pdf 199/240
TCD Response (Arb. Units)
PP
TCD Response (ArbJnits)

7/28/2019 808495(1).pdf
http://slidepdf.com/reader/full/8084951pdf 200/240
TableIX- .2 TPR Results for Supported Fischer-Tropsch Catalysts
Sample
100 Fd5 C d 6 U 1 39 SiO,
100 FdlO C d 6 a134 SiO,
100 F d 5 C d 6 W 1 39 Al,O,
100 F d lO C d 6 W134 Al,O,
Peak Position , "C Degree of Reduction, (%)
First stage Total*
Reduction
Range, OC First Stage Second Stg.
RT to 800 344 544 21 85
RT to 800 358 560 27 102
RT to 900 339 602 20 73
Temperature (#I
RT to 900 284 612 26 103
* The %degree of reduction are for the temperature range of RT to 800OC.
# Sample wt = 20 mg, reducing gas = 5%&/95%N,, flow rate =40 cm3/min, ramp = 20°C/min, temperaturerange = room temperature to 80 0 - 900OC.
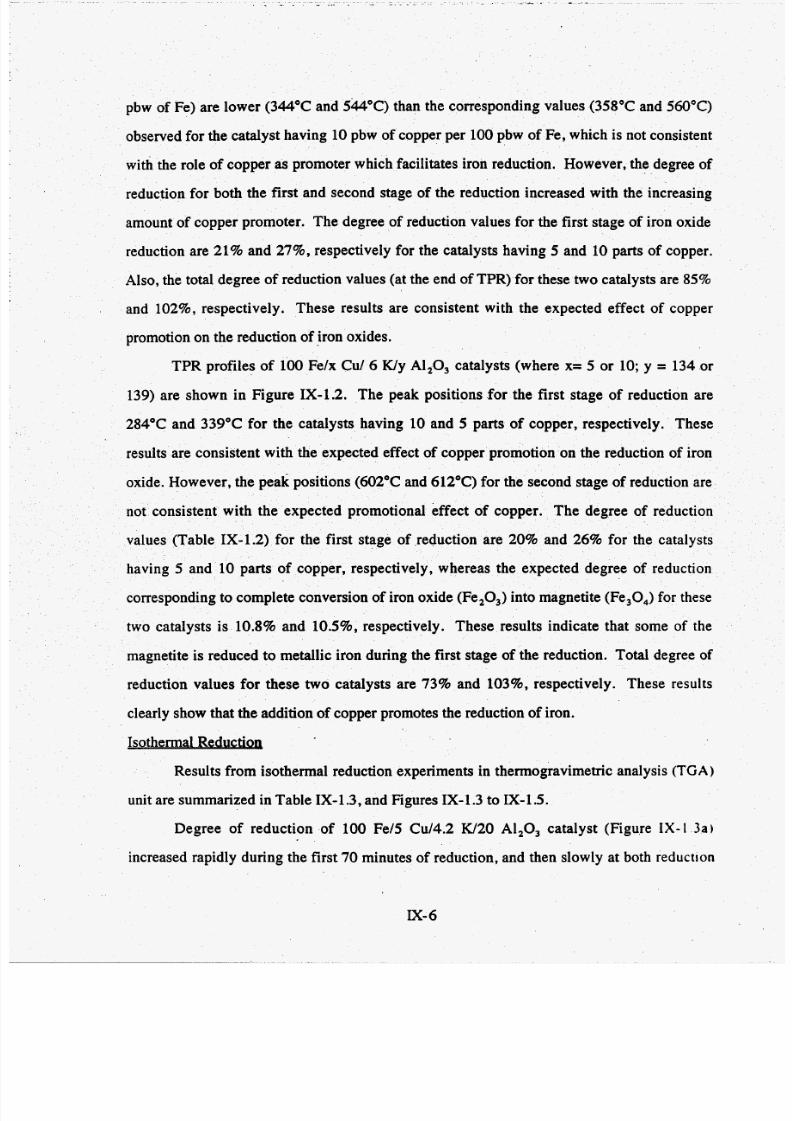
7/28/2019 808495(1).pdf
http://slidepdf.com/reader/full/8084951pdf 201/240
. _ . . -_ . . _ . . . -
pbw of Fe) are lower (344°C and 544°C) than the corresponding values (358°C and 560°C)
observed for the catalyst having 10 pbw of copper per 100 pbw of Fe, which is not consistent
with the role of copper as promoter which facilitates iron reduction. How ever, the degree of
reduction for both the fir st and second stage of the reduction increased with the increasing
amount of copper promoter. The degree of reduction values fo r the first stage of iron oxide
reduction are 21%an d 27%, respectively for the catalysts having 5 and 10 parts of copper.
Also, the total degree of reduction values (at the end of TPR) for these two catalysts are 85%
and 102%, espectively. These results are consistent with the expected effect of copper
promotion on the reduction of iron oxides.
TPR profiles of 100 Fe/x CUI6 Wy A1203catalysts (where x= 5 or 10; y = 134 or
139) are shown in Figure IX-1.2. The peak positions fo r the first stage of reduction are
284°C and 339°C for the catalysts having 10 an d 5 parts of copper, respectively. These
results are consistent with the expected effect of copper promotion on the reduction of iron
oxide. How ever, the peak positions (602°C and 612°C) for the second stage of reduction are
not consistent with the expected prom otional effect of copper. The degree of reduction
values (Table IX-1.2) for the first stage of reduction are 20%and 26%for the catalysts
having 5 and 10 parts of copper, respectively, whereas the expected degree of reduction
corresponding to com plete conversion of iron oxide ( Fe 20 3) nto magnetite (Fe30,) for these
two catalysts is 10.8% an d 10.5%, respectively. The se results indicate that some of the
magnetite is reduced to m etallic iron during the first stage of the reduction. Total degree of
reduction values for these two catalysts are 73% and 103%, respectively. These results
clearly show that the ad dition of copper promotes the reduction of iron.
Isothermal ReductiQn
Results from isothermal reduction experiments in thermogravim etric analysis (TG )
unit are sum marized in Table IX-1.3, and Figures IX-1.3 to IX-1.5.
Degree of reduction of 100 Fe/5 Cu/4.2 W20 A1203 catalyst (Figure IX-I 3 a )
increased rapidly during the fir st 70 minutes of reduction, and then slow ly at both reduction
IX-
7/28/2019 808495(1).pdf
http://slidepdf.com/reader/full/8084951pdf 202/240
. .._ . . .
Table IX-1.3 Summary of isothermal reduction experiments with alternative F-T
catalysts in the TGA unit
Catalyst
~~
100 F d5 Cd4.2 K/20 A1203
100 Fd5 Cd4.2 K/3 1.6 Al,O,
100 Fd5 Cd4.2 W100 SiO,
100 Fd5 Cu/6 W139 SiO,
100 FdlO Cu/6 IU134 S O ,
100 Fd5 Cu/6 IU139 A1203
100 FdlO Cu/6 W134 Al,03
ReductionTemperature , OC
240280
240280
280240
280
280
280
280
% Degree ofReduction.
5969
28 .42
3833
43
79
35
51
Reduction conditions: Reducing gas =4 (100 cm 3/min),ramping in He = 5OC/min, samplew=- 20 mg, and to tal reduction time =- 8 h. The sample was d r i d at 28OOC in He (100an /min) for 30 minutes.
Ix-

7/28/2019 808495(1).pdf
http://slidepdf.com/reader/full/8084951pdf 203/240
80
@
I I I I I l l 1 I I I I I I I I I I I I
' (a) -I I
-100 Fd5 Cd4.2 W O l,O,
a -- aw
m n 0 -W
-
-H, and24OT
+ 2,and2800C
. l l " " l ' l l l ~ ' l ' ' ' l ' l l l l l
+' 600
w0
Q
203n
0
.r(
!-YY3d
Figure E - 1 . 3 Effect of alumina content and reduction temperatureon the reduction behavior of
promoted Fischer-Tropsch catalysts in hydrogen: (a) 100 Fd5 Cd4.2 w20 N,O, ;
(b) 100Fd5 Cd4.2W31.6A ZO , .
IX-

7/28/2019 808495(1).pdf
http://slidepdf.com/reader/full/8084951pdf 204/240
temperatu res (240°C and 280°C ). The degree of reduction values (Table IX- 1.3) at the end
of 8 h reduction period are abou t 59% and 69% , for the reduction temperatures of 240°C and
280"C, respectively.
Degree of reduction of 100 Fe/5 Cu14.2 W31.6 A1 203 catalyst (Figure IX-1.3b)
increased rapidly during the first 100 minutes of reduction, and then continued to increase
slowly at both reduction temperatures (240°C and 280°C). At the end of the reduction period
the degree of reduction values are about 28% and 42%, at the reduction temperatures of
240°C and 280°C. respectively. These results show that the reduction is inhibited by the
addition of aluminum oxide, which is indicative of interactions between the iron and the
alumina.
Degree of reduction of 100 Fe/5 Cu/6 W139 SiO, catalyst increased gradually during
the first 220 minutes of reduc tion, and then very slowly (Figure IX-1.4). Afte r 8 h of
reduction with hydrogen at 280°C the final degree of reduction is about 43%. The degree of
reduction of 100Fe ll 0 C u/6 W13 4 S iO, catalyst increased rapidly during the first 50 minutes
of reduction (to abou t 70% ), and then very slowly reaching 79% after 8 hours of reduction in
hydrogen at 280°C. These resu lts clearly show that the reduction of iron in silica supported
catalysts inc reases with the increasing amount of Cu promoter.
The alumina supported catalysts (100 Fe/5 Cu/6 W 139 A1203and 100 Fe/lO Cu/6
W134 Al,03) exhibited the same type of behavior as the two silica supported catalysts
(Figure IX-1.5). At the end of 8 h reduction period at 280°C. the degrees of reduction were
about 35% and 51%, for the catalysts containing 5 and 10parts pbw of Cu per 100 pbw of
Fe. These results again show that the addition of copper promotes the reduction of ironoxide. Also, it appears that the interactions between iron and alumina support are stronger
than on the silica support, resulting in lower reducibility of iron on alum ina.
Reduction behavior of the silica and alumina supported catalysts in CO at 280°C is
shown in Figures IX-1.6 and IX-1.7, respectively. The two silica supported catalysts lost
about 2% of the initial weight during heating in helium from room temperature to 280°C. due
IX-9
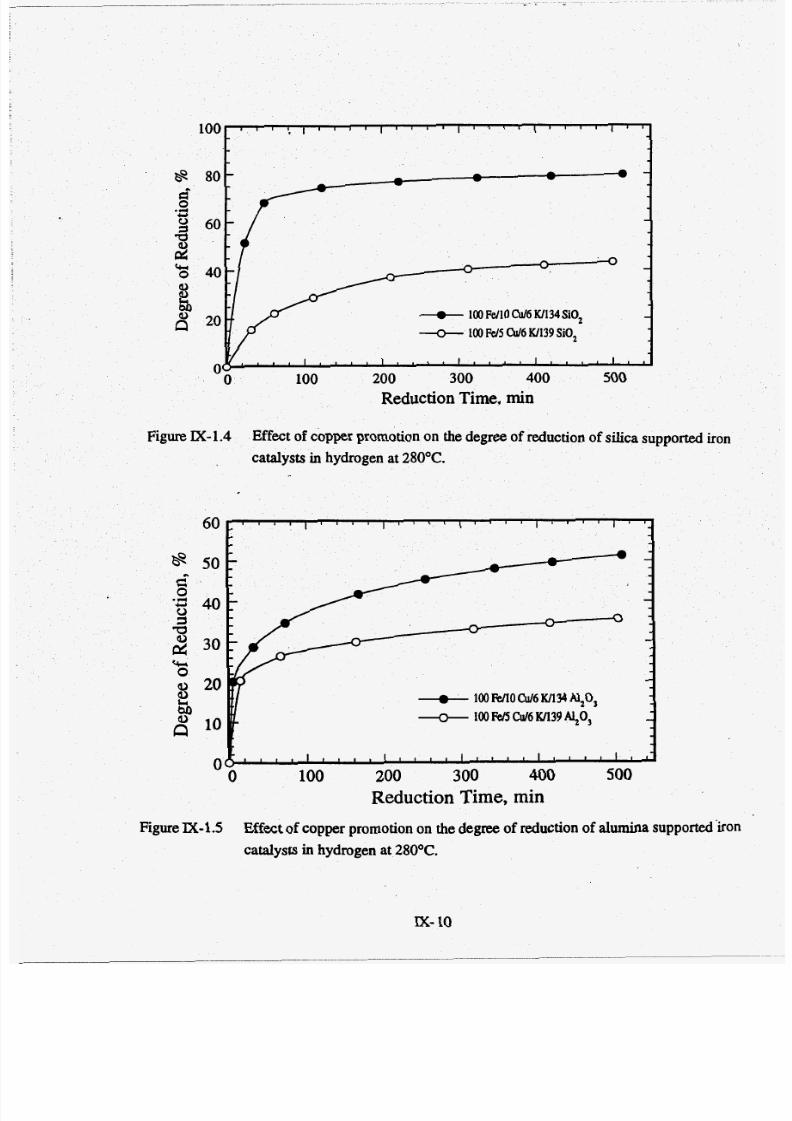
7/28/2019 808495(1).pdf
http://slidepdf.com/reader/full/8084951pdf 205/240
w
- * --
f i " 0 -
+ 00 FdlOW6W134 iO, -100 Fd5W6 W139 iO,
' ' 1 ' ' ' * 1 ' ' ' ' 1 ' '
0 100 200 300 400 500
Reduction Time, min
Figure IX-1.4 Effect of copper promotion on the degree of reduction of silica supported iron
catalysts in hydrogen at 280°C.
Ix- 0
Figure IX-1.5 Effect of copper promotion on the degree of reduction of alumina supported'kon
catalysts in hydrogen at 280OC.
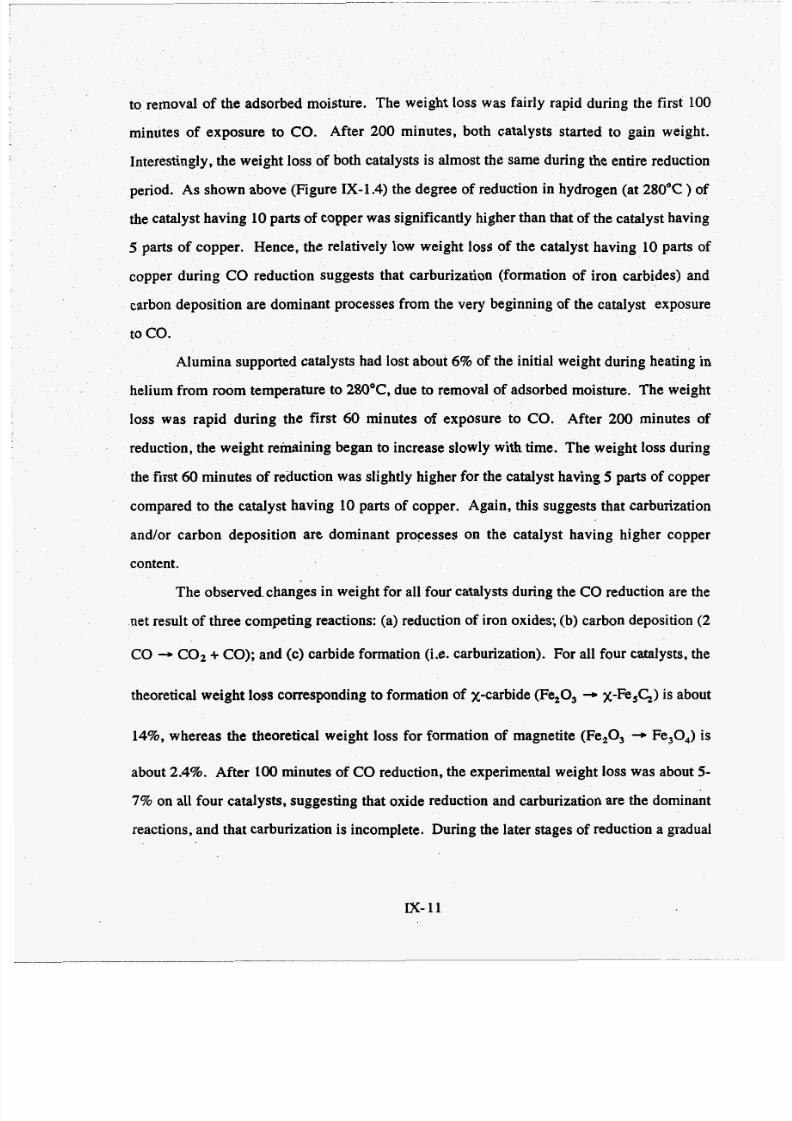
7/28/2019 808495(1).pdf
http://slidepdf.com/reader/full/8084951pdf 206/240
to removal of the adsorbed moisture. The weight loss was fairly rapid during the first 100
minutes of exposure to CO. After 200 minutes, both catalysts started to gain weight.
Interestingly, the weight loss of both catalysts is almost the same during the en tire reduction
period. A s shown above (Figure IX-1.4) the degree of reduction in hydrogen (at 280°C of
the catalyst having 10 parts of copper was significan tly higher than that of the cata lyst having
5 parts of copper. Hence, the relatively low weight loss of the catalyst having 10 parts of
copper during CO eduction suggests that carburization (formation of iron carbides) and
carbon deposition are dominant processes from the very beginning of the catalyst exposure
to co.
Alumina supported catalysts had lost about 6% of the initial weight during heating in
helium from room tem perature to 280"C, ue to removal of adsorbed moisture. The weight
loss was rapid during the first 60 minutes of exposure to CO. After 200 minutes of
reduction, the w eight remaining began to increase slowly with time. The weight loss during
the first 60minutes of reduction was slightly higher for the catalyst having 5 parts of copper
compared to the catalyst having 10 parts of copper. Again, this suggests that carburization
and/or carbon deposition are dominant processes on the catalyst having higher coppercontent.
The observed.changes in weight for all fou r catalysts during the CO reduction are the
net result of three competing reactions: (a) reduction of iron oxides; (b) carbon deposition(2
CO - 02+CO); nd (c) carbide formation (Le. carburization). For all four ca talysts, the
theoretical weight loss corresponding to formation of X-carbide (Fe20,+ x-Fe,CJ is about
14%,whereas the theoretical weight loss for formation of magnetite (F e2 0, -B Fe,O,) is
about 2.4%.After 100 minutes of CO eduction, the experimental weight loss was about 5-
7% on all fo ur catalysts, suggesting that oxide reduction and carburization are the dominant
reactions, and that carburization is incomplete. During the later stages of reduction a gradual
I x - 1 1
7/28/2019 808495(1).pdf
http://slidepdf.com/reader/full/8084951pdf 207/240
100
loo/ 1 I I I I ' ' ~ ' ' ' ' 1 ' ' ' ' 1 " ' ' , ' '
-_f_ 100 FdlOW6 W134AI,O,
100 Fd5Cd6W139AZO,e
-
0 -
3 -
a a 0- w
n v
r rU
8d 90
s85
_+_ 100Fell0 W6 W134 SiO,
100Fd5 W6 W139SiO,
I I I I I , , , I l l , I I I I I I I I I ,
0 100 200 300 400 500
iron
Figure IX-1.7 Effect of copper promotion on the reduction behavior of alumina supported iron
catalysts inCO at 280°C.
7/28/2019 808495(1).pdf
http://slidepdf.com/reader/full/8084951pdf 208/240
increase in weight was o bserved with all four catalysts. Th is suggests that the carbon
deposition is the d ominant reaction, even though the carburization was not completed.
XRD Measureme-
Results of XRD analysis of used catalysts from three slurry reactor tests are
summarized in T able IX-1.4. A s an illustration, the XR D patterns of catalysts withdrawn
from the slurry reactor run SA-0097 w ith 100 Fe/5 C d 4 . 2W20AI,O, cata lyst are shown in
Figure IX-1.8.
Magnetite (Fe and a-Fe were the major phases (Figure IX-1.8A) in the sample
withdrawn immediately after the hydrogen reduction at 250°C for 4 hours (TOS = 0 h).
During Fischer-Tropsch synthesis both magnetite and &'-carbide Fe2.2C) were identified in
samples withdrawn from the reactor between 4 and 308 hours on stream (Figure IX-1.8B to
IX-1.8E. XRD patterns of samples withdrawn d e r 4 h (1-B) and 308 h (1-E) on stream are
similar. The catalyst activity during this test decreased slowly with time (see section IX-2 of
this chapter).
Used catalysts from runs SB-0627 (silica supported catalyst) and SB-2337 (alumina
supported catalyst) conta ined magnetite and &'-carbide and possibly X-carbide, as well). The
increase in crystallinity of iron phases (Le. increase in crystallite size) with time on stream
was observed in catalyst samples from both runs. Catalysts deactivated with time in both
tests (Section IX-2).
IX- 3

7/28/2019 808495(1).pdf
http://slidepdf.com/reader/full/8084951pdf 209/240
TableIX- .4 Iron Phases in Used Catalyst Samples by X-ray Diffraction
RUn
Number
SA-0097
SB-2337
SB-0627
I
I TimeTes;yamatalyst
04
2410 0 Fe/5 Cd4.2 W20 A1203 162
308
100 Fd5 Cd 9 W139 A Z O 3
- I 306
F-T process conditions in run SA-0097 were: T = 26OoC, P = 1.48 - 2.17 m a , H2/C 0=0.67,
SV = 1.4 - 2.1 NYg-cat/h.
F-T process conditions in runSB-2337 were: T = 26OoC, P = 1.48 MPa, HJCO =0.67, SV = 1.3 NYg-cat/h.
F-T process conditions in run SB-0627 were: T =26OoC, P = 1.48 - 2.17 MPa, HJCO =0.67,
SV = 1.4 - 2.0 Wg-cat/h.
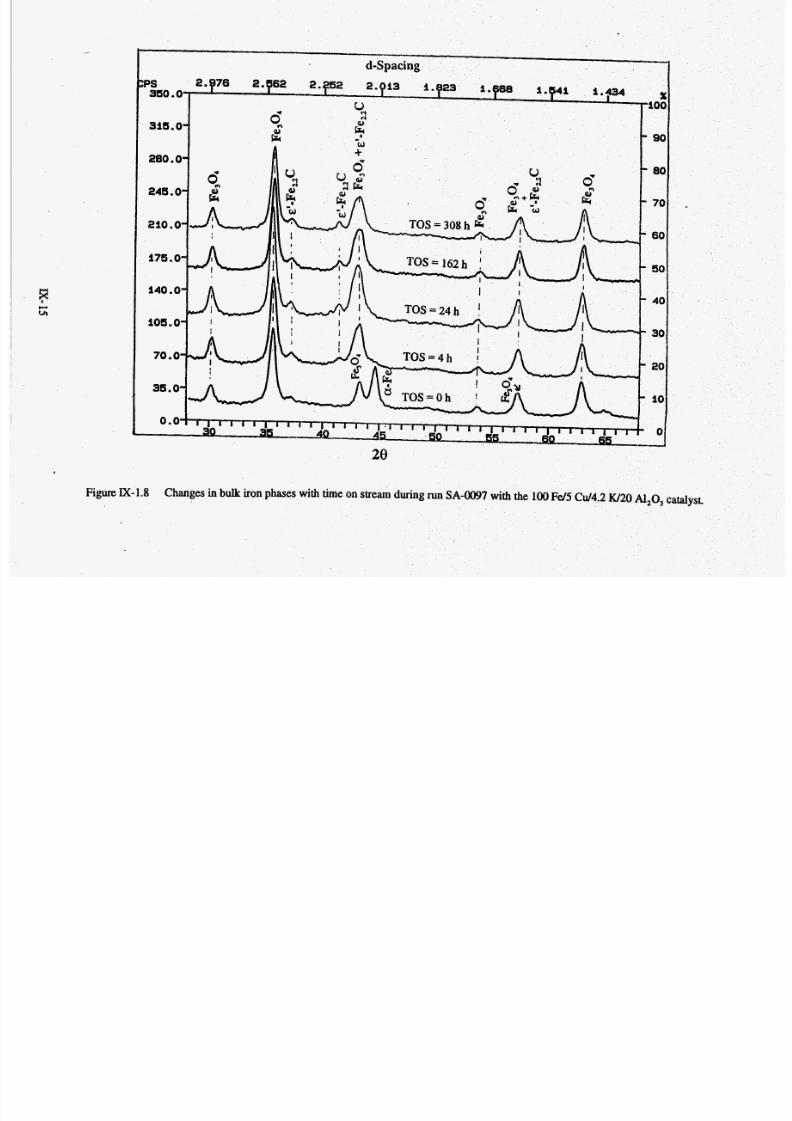
7/28/2019 808495(1).pdf
http://slidepdf.com/reader/full/8084951pdf 210/240
Figure N-1.8 Changes inbulk iron phases With h e n stream during run SA-0097 With the 100 Fe/5 Cd4.2W20Al,O, catalyst.
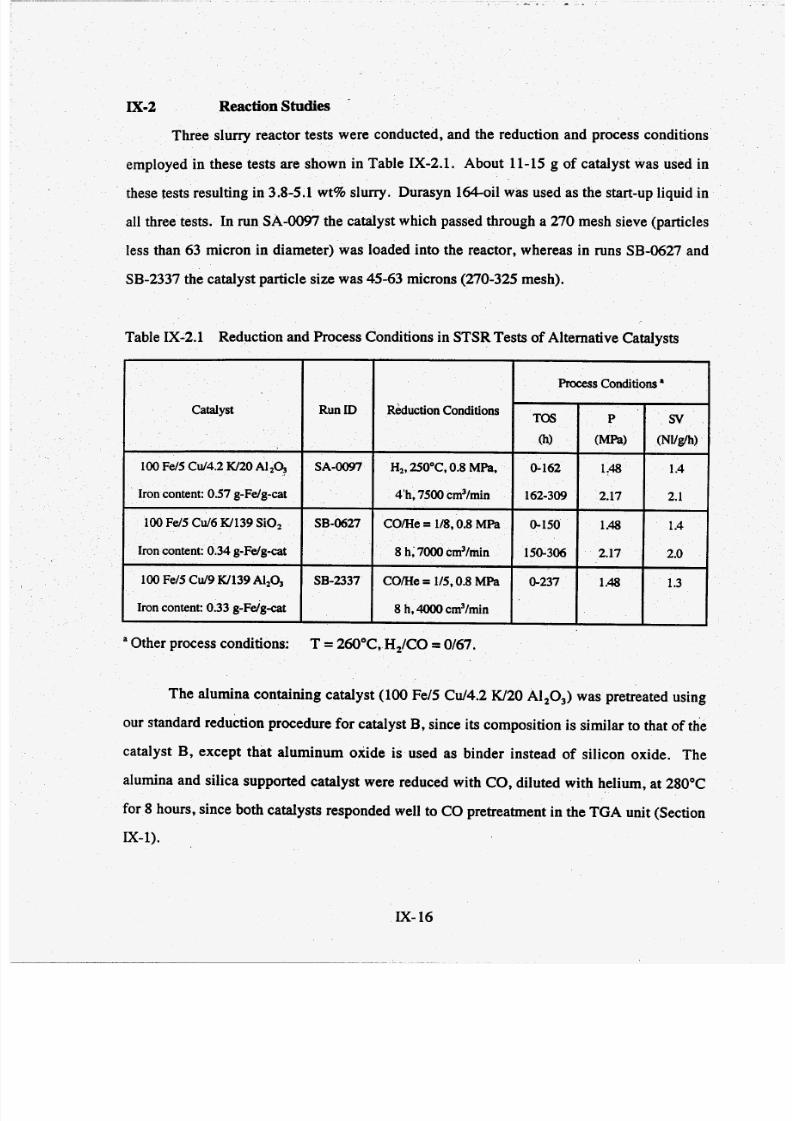
7/28/2019 808495(1).pdf
http://slidepdf.com/reader/full/8084951pdf 211/240
IX-2 Reaction Studies
Three slurry reactor tests were conducted, and the reduction and process conditions
employed in these tests are shown in Table IX-2.1. About 11-15 g of cata lyst was used in
these tests resulting in 3.8-5.1 wt% slurry. Durasyn 164-oil was used as the start-up liquid in
all three tests. In run SA-0097 the cata lyst which passed through a 270 mesh sieve (particles
less than 63 micron in diameter) was loaded into the reactor, whereas in runs SB-0627 and
SB-2337 the catalyst particle size was 45-63 microns (270-325 mesh).
Catalyst
100 Fe/5 Cd4.2 W20 A1,Q
Iron content: 0.57 g-Fdg-cat
100Fd5Cd6 W139 SiO,
Iron content: 0.34g-Fdg-cat
100 Fe/5 Cd9 W139 A1,03
Iron content: 0.33 g-Fdg-cat
ProcessConditions'
P svun ID Rd uct ion Conditions Tos
Q (MPa) (NVglh)
SA-0097 H,,250°C, 0.8 MPa, 0-162 1.48 1.4
4'h,7500cm3/min 162-309 2.17 2.1
SB-0627 CO/He = 1/8,0.8 MPa 0-150 1.48 1 A
8 h; 7000cm3/min 150-306 2.17 2.0
SB-2337 C o m e = 1/5,0.8 MPa 0-237 1.48 1.3
8 h, 4OOO cm3/min
catalyst B, except that aluminum oxide is used as binder instead of silicon oxide. The
alumina and silica supported catalyst were reduced with CO, diluted with helium, at 280°C
fo r 8 hours, since both cata lysts responded well to CO pretreatment in the TGA unit (Section
IX-1).
IX- 6
7/28/2019 808495(1).pdf
http://slidepdf.com/reader/full/8084951pdf 212/240
ilityatalvst Activltv and S tab.
Changes in synthesis gas conversion and HJCO usage ratio with time-on-stream at
different process cond itions for all three tests are shown in Figure IX-2.1. Results from run
SA-1665 with catalyst C (100 Fe/3 C d 4 W16 S O ,) are also shown for comparison.
Th e baseline catalyst C had the highest conversion (about 80%) and was very stable
with time during testing at both 1.48 MPa and 2.17 MPa (Figure IX-2.la). The alumina
containing catalyst (SA-0097) had lower syngas conversion of about 60%, and was fairly
stable during testing at 1.48 MPa (up to 162 h), but began to deac tivate during testing at 2.17
MPa. The s ilica supported catalyst (SB-0627) was significantly more active than the alumina
supported catalyst (SB-2337), but both catalysts deactivated fairly rapidly with time. For
example the syngas conversion in run SB-0627 decreased from about 70% at 30 hours on
stream to about 40% a t 300 hours, whereas in run SB-2337 the maximum value of
conversion was about 47% (at 32 h) and only 19% at 236 h.
1
Th e w ater-gas-shift (WGS) activity of the catalyst C was high (Figure IX-2.lb), as
evidenced by low value of the usage ra tio (about 0.57), whereas the silica supported catalyst
(SB-0627) had relatively low WGS activity, particularly during testing at 2.17 MPa (usage
ratio between 0.8 and 1). The WGS activity of the two alumina con taining catalysts was
relatively high (usage ratio of 0.60-0.64).
Changes in catalyst activity, expressed in terms of the apparent reaction rate constant
for the first order reaction with respec t to hydrogen, are shown in Figure IX-2.2. In addition
to results obtained in three tests with alternative catalysts results from two tests with baseline
catalysts B (run SB-1295) and C (run SA-1665) are also shown for comparison. Initially, the
catalyst B and the silica supported catalyst (SB-0627) were the most active (k = 350-380
mm ol/g-Fe/h/MPa), but both catalysts deactivated with time on stream. The apparent
reaction rate constant in run SB-1295 (Catalyst B) reached a constant value of about 225
mmollg-Fe/h/MPa at about 150h on stream, whereas the silica supported catalyst (SB-0627)
continued to deactivate with time and at 300 h its apparent reaction rate constant was 150
IX- 7

7/28/2019 808495(1).pdf
http://slidepdf.com/reader/full/8084951pdf 213/240
1 o
0.8
100I I I I
80 -
60 -
40 -
20 -
0 I I I I
0 100 200 300
0.4
0.2
0.0
(I
SA4097 (100 Fe/5 Cu14.2 W ZOA1203) SB-2337 (100 Fd5 Cu19 W139
v 1.48 MPa, 2.5 NWg-Felh + 1.48 MPa, 3.9 NWg-Feh
0 2.17 MPa, 3.6 NWg-Feh
A 1.48 MPa, 4.0 NWg-Felh A 2.17 MPa, 3.4 NWg-Felh
0 2.17 MPa, 5.7 NWg-Feh
I I I
0 100 200 300
SA-1665 (100 Fe/3 Cu14 W16 SiO,)
S6-0627 (100 Fel5 C m W139 Si021 1.48 MPa, 2.3 NWg-Fm
I 1
Time on Stream, h
Figure IX-2.1 Synthesis gas conversion (a) and HJCO usage ratio (b) as a function of time for
STSR tests of alternative catalysts and the baseline catalyst C.

7/28/2019 808495(1).pdf
http://slidepdf.com/reader/full/8084951pdf 214/240
400
35 0
300
I 1 I I I I I 1 I I I I I I I
v SA-0097 (100 Fe15 Cu14.2 KQOA209 -
o SB-2337 (100 Fe15CU B W139 AI2O3)
A SA-1665 (100 Fe M Cu14 W16 SiO,)
- 0 SB-0627 (100 Fe15 CUB Kn39Si02) --
- 88-1295 (100 Fe15 CUR KQ4 Si02) -
- --- -- -- -- -
- --
- -
I I I I I I I I I I I I I I I
0 50 100 150 200 250 300 350
J
100
50
0
Figure
7/28/2019 808495(1).pdf
http://slidepdf.com/reader/full/8084951pdf 215/240
. .
mmol/g-Fe/h/MPa. Catalyst C (SA-1665) was the most stable and its apparent reaction rate
constant decreased from ' the initial value of about 250 mm ol/g-Fe/h/MPa to abou t 225
mmol/g-Fe/h/MPa at 350 hours. The alumina containing catalyst (SA-0097) was markedly
less active than the silica containing catalysts B and C, and its apparent reaction rate constant
was between 125 and 175 mm ol/g-Fe/h/MPa. The alumina supported catalyst was the least
active and its apparent reaction rate constant was between 60 and 175 mmoi/g-Fe/h/MPa.
Gaseo us Hydrocarbon Select v ities
Silica supported catalyst (SB-0627) had the highest methane (7-8 mol%) and C,+C,
selectivities (Figures IX-2.3a and IX-2-3b). Alumina containing catalyst (SA-0097) had
methane selectivity between 5 and 6 mol%, w hich is high in comparison to our baseline
catalysts C (2-3 mol%) and B ( 3 4 mol%, not shown in Figure IX-2.3a). Methane selectivity
of the alumina supported catalyst was the lowest of the three alternative catalysts (about 3.5-
3.8 mol%) which is consistent with its high potassium content (9 bw of K per 100 pbw of
Fe). However, the activity of this catalyst was very low and its deactivation rate was high
(Figure IX-2.2). C ,t C , selectivities of the three alternative catalysts were high in comparison
to the baseline catalyst C (Figure IX-2.3b).
E - 2 0
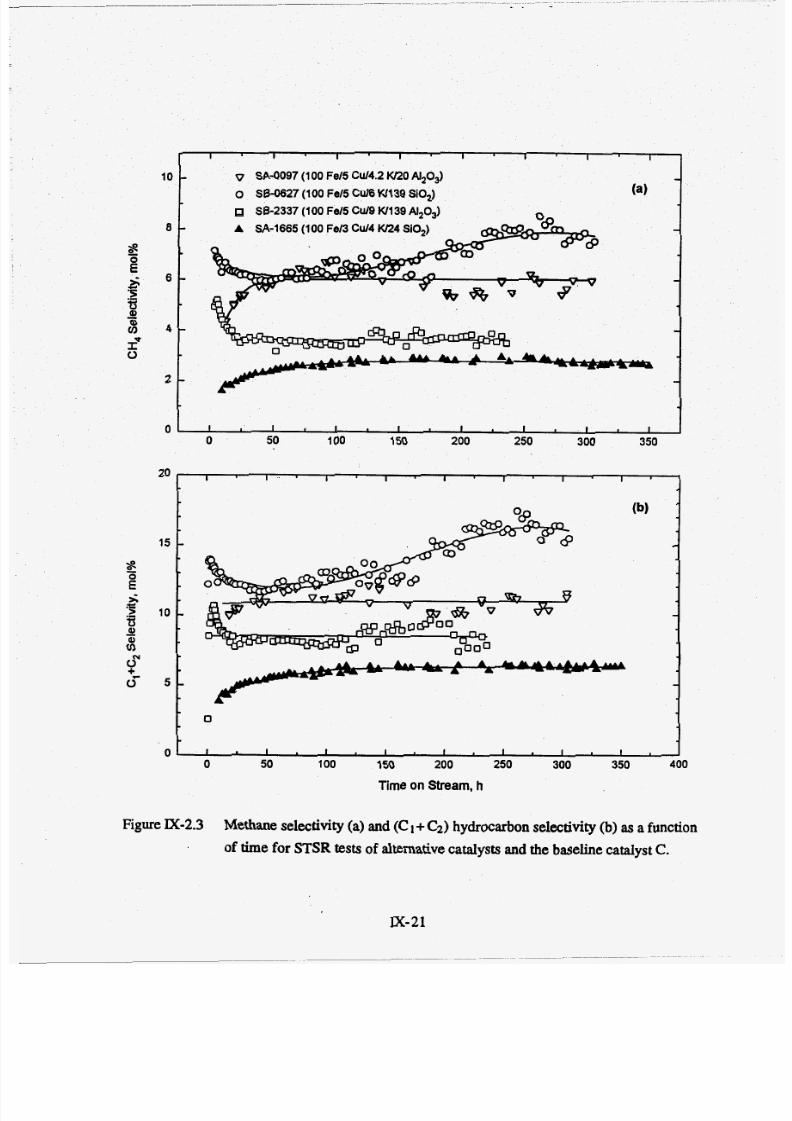
7/28/2019 808495(1).pdf
http://slidepdf.com/reader/full/8084951pdf 216/240
10
8 -
6 -
4 -
2 -
0
20I I ' ' I I I I I I 1
I I I I I I 1 I
- vSA4097 (100 Fe15 Cu14.2 Kl20AI,Od
-o SB-0627 (100 Fel5 Cu16 W139 SiO,) (a)
38-2337 (100 Fd5 Cu19 W139 AI20d
A SA-1665 (100 Fe13 Cu14 Kl24 SiO,) -
-
-
I I I I I I I I
0 50
15
-
10 -
I I I I I I I 1
c
0
5L
A AA A
A
c1
Figure E-2.3 Methane selectivity (a) and (C 1+C2) ydrocarbon selectivity (b) as a function
of time for STSR tests of alternative catalysts and the baseline catalyst C.
Ix-21
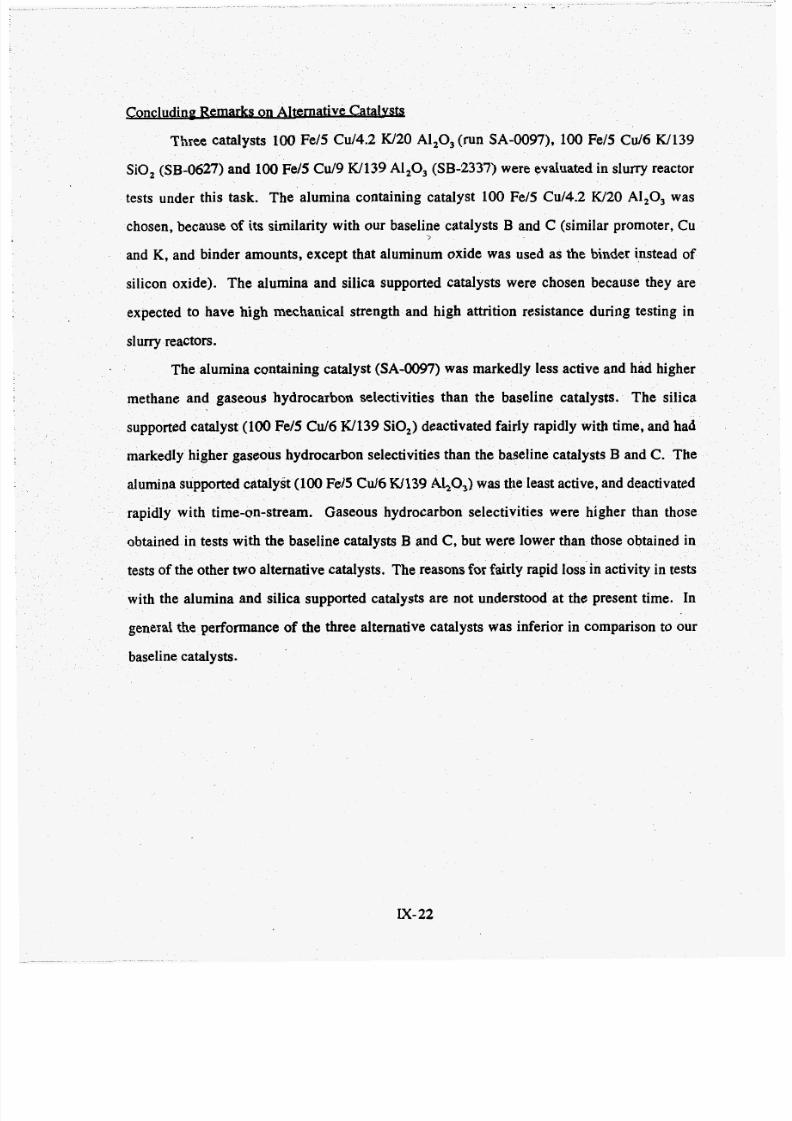
7/28/2019 808495(1).pdf
http://slidepdf.com/reader/full/8084951pdf 217/240
Concludin? Remarks on A ~ b tve Catalvstg
Three catalysts 100 Fe/5 Cu14.2 W20 Al,O,(run SA-0097), 100 Fe/5 Cu/6 W139
SiO, (SB-0627) and 100 Fe/5 Cu/9 W139 AI,O, (SB-2337) were evaluated in slurry reactor
tests under this task. The alumina containing catalyst 100 Fe/5 W 4 . 2 W20 AI,O, was
chosen, because of its similarity with our baseline catalysts B and C (similar promoter, Cu
and K, and binder amounts, except that aluminum oxide was used as the binder instead of
silicon oxide). The alumina and silica supported catalysts were chosen because they are
>
expected to have high mechanical strength and high attrition resistance during testing in
slurry reactors.
The alumina containing catalyst (SA-0097) was markedly less active and had higher
methane and gaseo us hydrocarbon selectivities than the baseline catalysts. The silica
supported catalyst (100 Fe/5 Cu/6 W139 S O ,) deactivated fairly rapidly with time, and had
markedly higher gaseous hydrocarbon selectiv ities than the baseline catalysts B and C. The
alumina supported catalyst (100 Fe/5 Cu/6 U1 39 AI,O,) was the least active, and deactivated
rapidly with time-on-stream. Gaseous hydrocarbon selectiv ities were higher than those
obtained in tests with the baseline catalysts B and C , but were lower than those obtained in
tests of the other two alternative catalysts. The reasons for fairly rapid loss in activity in tests
with the alum ina and silica supported catalysts are not understood at the present time. In
general the performance of the three alternative catalysts was inferior in comparison to our
baseline catalysts.
Ix- 2

7/28/2019 808495(1).pdf
http://slidepdf.com/reader/full/8084951pdf 218/240
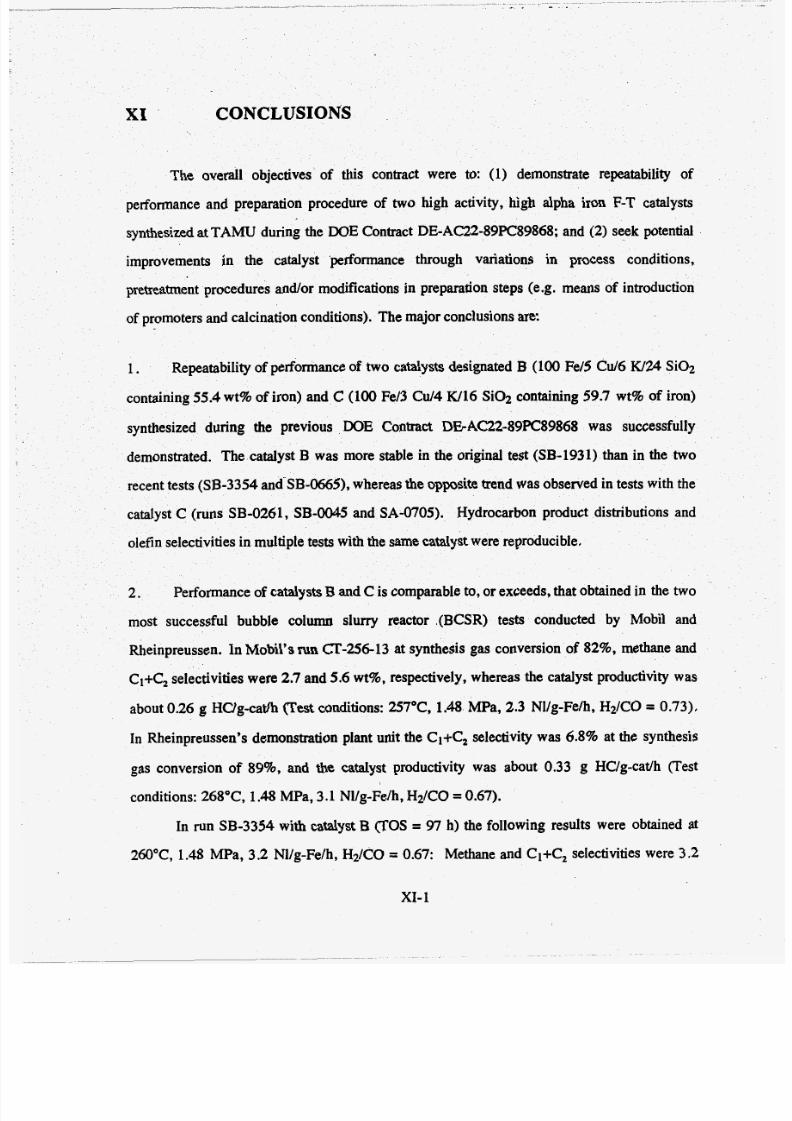
7/28/2019 808495(1).pdf
http://slidepdf.com/reader/full/8084951pdf 219/240
XI CONCLUSIONS
The overall objectives ofthis
contract were to: (1) demonstrate repeatability ofperformance and preparation procedure of two high activity, high alpha iron F-T catalysts
synthesized at TAMU during the DOE Contract DE-AC22-89PC89868; and (2) seek potential
improvements in the catalyst performance through variations in process conditions,
pretreatment procedures and/or modifications in preparation steps (e.g. means of introduction
of promoters and calcination conditions). The m ajor conclusions are:
1. Repeatability of performance of two catalysts designated B (100 Fe/5 Cu/6 W24 Si02
containing 55.4 wt% of iron) and C (100 Fe/3 Cu/4 W16 Si02 containing 59.7 wt% of iron)
synthesized during the previous DOE Contract DE-AC22-89PC89868 was successfully
demonstrated. The catalyst B was more stable in the original test (SB-1931) than in the two
recent tests (SB-3354 and SB -066 3, whereas the opposite trend was observed in tests with the
catalyst C (runs SB-0261 , SB-0045 and SA-0705). Hydrocarbon product distributions and
olefin selectivities in multiple tests with the same catalyst were reproducible.
2. Performance of catalysts B and C is comparable to, or exceeds, that obtained in the two
most successful bubble column slurry reactor .(BCSR) tests conducted by Mobil and
Rheinpreussen. In Mobil's run (SI'-256-13 at synthesis gas conversion of 82%, methane and
C1+C2 selectivities were 2.7 and 5.6 wt%, respectively, whereas the catalyst productivity was
about 0.26 g Hag -cat /h (Test conditions: 257°C' 1.48 MPa, 2.3 Nl/g-Fe/h, H2/CO = 0.73).
In Rheinpreussen's demonstration plant unit the Cl+C, selectivity was 6.8% at the synthesis
gas conversion of 89%' and the catalyst productivity was about 0.33 g HC/g-cat/h (Test
conditions: 268"C, 1.48 MPa, 3.1 Nl/g-Fe/h, H2/CO = 0.67).
In run SB-3354 with catalyst B (TOS = 97 h) the following results were obtained at
260°C, 1.48 MPa, 3.2 Nl/g-Fe/h, H2/CO = 0.67: Methane and C1+C2 selectivities were 3.2
XI- 1

7/28/2019 808495(1).pdf
http://slidepdf.com/reader/full/8084951pdf 220/240
and 5.3 wt%, respec tively, and the catalyst productivity was 0.26 g HC/g-cadh at the synthesis
gas conversion of 71.5%:
The performance of catalyst C in run SB-0045 t the reaction pressure of 1.48 MPa and
215 hours on stream , was very similar to that obtained in Mobil's run CT-256-13. However,
the productivity of catalyst C was improved at reaction pressure of 2.17 MPa and gas space
velocity of 3.4Nl/g-Fe/h (TOS = 336 h). Methane and C1+C, selectivities were 2.6 and 5.4
wt%, respec tively, and the catalyst productivity was 0.36 g HC/g-cat/h at the synthesis gas
conversion of about 80%. The latter productivity is higher than productivity's obtained in
Mobil's and Rheinpreussen's bubble column slurry reactor tests, primarily due to the use of
higher reaction pressure and higher gas space velocity in the present study.
3. The use of higher reaction pressure and proportionally higher gas space velocity, to
maintain constant gas residence time in the reactor, was successfully demonstrated in several
tests with catalyst C (runs SB-0045, A-0075, SA-1665, SA-0946and SA-2186). Slurry F-T
reactors have normally operated at pressures less than 1.5 MPa, whereas the coal gasifiers
which genera te the synthesis gas operate at pressures between 2 and 3 MPa. The use of higher
operating pressures and higher gas space velocity increases reactor productivity and improves
the process economics. Space-time-yields were increased up to 48% by increasing reaction
pressure from 1.48MPa to 2.17 MPa, while maintaining the gas contact time and synthesis gas
conversion at a constant value. No adverse effects of operation at higher pressure on catalyst
activity were observed in several of these tests (up to 250 hours of testing at 2.17 MPa).
4. Repeatability of performance of catalysts B and C was demonstrated in multiple tests
with catalysts from different preparation batches. Three STSR tests were conducted with
catalyst B, and four tests with catalyst C. In general, catalysts from different preparation
batches (100-400 g of catalyst batches) had similar performance (activity and selectivity) and.
XI-2
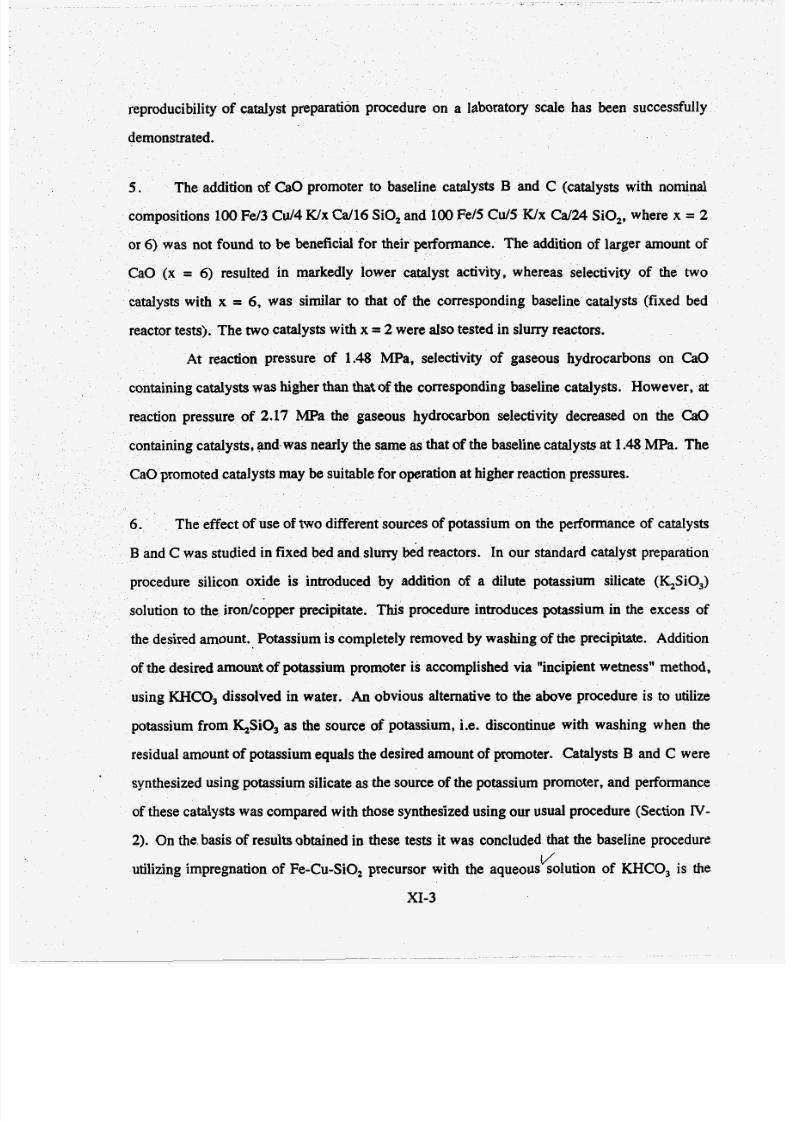
7/28/2019 808495(1).pdf
http://slidepdf.com/reader/full/8084951pdf 221/240
reproducibility of catalyst preparation procedure on a laboratory scale has been successfully
demonstrated.
5 . The addition of CaO promoter to baseline catalysts B and C (catalysts with nominal
compositions 100 Fe/3 Cu /4 Wx C d16 SiO, and 100 Fe/5 Cu/5 Wx Cd2 4 SO ,, where x = 2
or 6) was not found to be beneficial fo r their perform ance. The addition of larger amount of
CaO (x = 6) resulted in markedly lower catalyst activity, whereas selectivity of the two
catalysts with x = 6, was similar to that of the corresponding baseline catalysts (fixed bed
reactor tests). The two catalysts with x =2 were also tested in slurry reactors.
At reaction pressure of 1.48 MPa, selectivity of gaseous hydrocarbons on CaO
containing catalystswas higher than that of the corresponding baseline catalysts. However, at
reaction pressure of 2.17 MPa the gaseous hydrocarbon selectivity decreased on the CaO
containing catalysts , and.was nearly the same as hat of the baseline catalysts at 1.48 MPa. The
CaO promoted ca talysts may be suitable for operation at higher reaction pressures.
6. The effect of use of two different sources of potassium on the performance of catalysts
B and C was studied in fixed bed and slurry bed reactors. In our standard catalyst preparation
procedure silicon oxide is introduced by addition of a dilute potassium silicate (QSiO,)
solution to the irod copper precipitate. This procedure introduces potassium in the excess of
the desired amount. Potassium is completely removed by washing of the precipitate. Addition
of the desired amount of potassium promoter is accomplished via "incipient wetness" method,
using KHCO, dissolved in water. An obvious alternative to the above procedure is to utilize
potassium from &SO3 as the source of potassium, Le. discontinue with washing when the
residual amount of potassium equals the desired amount of promoter. Catalysts B and C were
synthesized using potassium silicate as the source of the potassium promoter, and performance
of these catalysts was compared with those synthesized using our usual procedure (Section IV-
2). On the basis of results obtained in these tests it was concluded that the baseline procedure
utilizing impregnation of Fe-Cu-SiO, precursor with the aqueous solution of KHCO, is the/
XI-3

7/28/2019 808495(1).pdf
http://slidepdf.com/reader/full/8084951pdf 222/240
preferred method of catalyst preparation. The second procedure, which avoids the
impregnation step, provides satisfactory results, and may be used as an alternative .
7. Significant improvem ents in activity of the catalyst C (from batch-4) were obtained
through the use of different pretreatment procedures. The initial activity (measured by a value
of the apparent reaction rate constant, k) of the catalyst reduced with hydrogen at 250°C for 4
hours (run SB-3425) was about 40% higher than that of hydrogen reduced at 240°C for 2
hours (baseline reduction procedure). How ever, the catalyst activity decreased with time and at
about 300 h its apparent rate constant (k = 250 m m ol /g -F ew ah ) was similar to the value
obtained in run SA-1665 employing the baseline reduction procedure.
The CO pretreatment (SA-O%), syngas pretreatment (SA-1626) and TAMU
pretreatment (SA-2186) also resulted in improved catalyst activity, relative to the standard
reduction procedure. The initial values of the apparent reaction rate constant, after these
pretreatments, were 300-400 m m ol /g -F ew ah , corresponding to 20-60% increase in activity
relative to the standard procedure. Activity of the CO and T A W pretreated catalysts increased
with time, and at 400 hours the values of the apparent reaction rate constants were 360 and 430
mmoVg-Fe/MPa/h, respectively. As the result of the improvement in the catalyst activity, while
maintaining low methane and gaseous hydrocarbon selectivities, the catalyst productivities in
these two tests were markedly higher than those obtained in M obil's and Rheinpreussen's
slurry bubble column reactor tests. The catalyst productivity in Rheinpreussen test was 0.49
gHC/g-Fe/h, and those obtained in runs SA-0946 and SA-2186 were 0.71 and 0.86 gHClg-
Felh, respectively. This represents 45 7 5 % improvement in catalyst productivity relative to
that achieved in Rheinpreussen's demonstration plant unit, and sets new standards of
performance for "high alpha" iron catalysts. We believe that the performance of our catalyst B
(100 Fe/5 Cu/6 W24 SiOJ can be also improved through the use of better pretreatment
procedures.
X I 4
7/28/2019 808495(1).pdf
http://slidepdf.com/reader/full/8084951pdf 223/240
8 . The effect of calcination temperature on performance of catalysts B and C during F-T
synthesis was investigated in fixed and slurry bed reactors, Both catalyst B (100 Fe/5 Cd6
W24 SiOJ and C (100 Fe/3 Cu/4 W16 SiOJ were tested in fixed bed reactors after
calcinations at 400°C and 500°C fo r 5 h, and after flash calcination at 700°C for 1 h, and in a
stirred tank slurry reactor after flash calcination at 700°C for 1h.
The main find ings from slurry reactor tests were: (1) The activity of catalysts B and C
calcined at 700°C was lower than that of these two catalysts calcined at 300°C (baseline
calcination temperature); (2)Gaseous hydrocarbon selectivities were higher on catalysts
calcined at700°C;3) Alpha olefin selectivity of C,,+ hydrocarbons was markedly higher on
catalysts calcined at 700"C, which is of potential significan ce, since alpha olefins are valuableproducts; and (4) Oxygenates yields were about four times higher on the catalysg B and C
calcined a t 700"C, than on the catalysts calcined at 300°C.
9. Although catalysts B and C have desirable activity and selectivity characteristics, they
may not have a sufficient mechanical strength and attrition p roperties required fo r utilization in
commercial bubble column slurry reactors. Three catalysts 100 Fe/5 W4.2 W20 A1,0, (run
SA-0097), 100 Fe/5 Cu/6 W139 SiO, (SB-0627) and 100 Fe/5 Cu/9 W139 AI,O, (SB-2337)
were evalua ted in slurry reactor tests as potential alternatives to our baseline catalysts B and C .
The performance of the three alternative catalysts was inferior in comparison to our baseline
catalysts. The alternative catalysts had lower activity, faster deactivation rate , and produced
more gaseous hydrocarbon products than the baseline catalysts.
In general, al l major objectives of this contract have been achieved. Significant
improvements in catalyst productivity were achieved through the use of higher operating
pressure (2.17 MPa) and use of different pretreatment procedures. Catalyst productivities
achieved in runs SA-0946 and SA-2186, 0.71 and 0.86 gHC/g-Fe/h, respectively. have
established new standards of performance for "high alpha" iron catalysts.
XI-5
7/28/2019 808495(1).pdf
http://slidepdf.com/reader/full/8084951pdf 224/240
.
XI1 Acknowledgments
I am grateful to Dr. Richard E. Tischer, DOE Project Manager from Pittsburgh Energy
Technology Center, for his continuing interest, encouragement, and helpful comments
throughout the duration of this contract. I have also received helpful suggestions from the
following individuals at PETC: Gary Stiegel, Robert Go nnley, Michael Zarochak, and Dr.
Udaya Rao, as well as from Drs. R. D. Srivastava and P. Zhou of Bums and Roe Services
Co. Numerous discussions with Dr. John Shen, DOE headquarters in Washington D. C.,
have been stimulating and helpful. All these individuals have contributed to the success of the
XII- 1

7/28/2019 808495(1).pdf
http://slidepdf.com/reader/full/8084951pdf 225/240
Appendix 1 Catalysts Preparation Procedure
Al-1 Co - Precipitation Procedure
Desired compositions of copper-promoted iron-based catalysts were prepared by
continuous co-precipitation, using an apparatus and a technique similar to that employed by
previous investigators (Kolbel and Ralek, 1980; Deckw er et al., 1982). Unlike conventional
batch precipitation, this approach ensures that precipitation occurs at a constant, rather than
continuously changing, pH, resulting in much more uniform and predictable particle size and
porelstructure.In the present case, an aqueous solution containing Fe(NO,), (- 0.6 M) and a
concentration of Cu(NO,), that corresponds to the desired Fe/Cu ratio in the final catalyst,
and a second solution containing aqueous NH, (-2.7 M) are m aintained in stirred vessels at
84 * 2°C. The two solutions are separately conveyed by fluid pumps to a stirred tubular
reaction vessel that is thermostated at 82 * 2°C. Precipitation (to form FeOOH and
Cu(OH),) occurs continuously as the two solutions are pumped upward through the vessel,
while an in-line pH electrode is used to monitor the pH of the reactor effluent, which is
maintained at 6.0 * 0.2. Collection of the slurried precipitate is made in ice-cooled vessels
and is continued until one of the two solutions is consumed. The p recipitate is then
thoroughly washed by vacuum filtration to remove excess NH, and NO,-, using - 10 liters of
deionized and distilled water per 100 g (dry weight) of the final catalyst. The washed
precipitate is then used for the preparation of final catalysts.
A1-2 Addition ofSilicon Oxide
The wet Fe/Cu precipitate is mixed with deionized and distilled water to make a
uniform slurry. Dilute potassium silicate solution containing a desired amount of silica
(SiO,) was added to the slurry very slow ly. During potassium silicate addition the pH was
A- 1
7/28/2019 808495(1).pdf
http://slidepdf.com/reader/full/8084951pdf 226/240
maintained at about 9.0. Once the addition of potassium silicate was over and the pH was
stabilized, a 10% dilute nitric acid was added drop by drop until the pH reaches - 6.0 - 6.5
with constant stirring. Stirring was continued for additional four hours after the addition of
nitric acid. Imm ediately after comp leting the stirring procedure the resulting silica
containing slurry was filtered, washed (to remove the K' ions) and vacuum oven dried at
50°C for 48 h and then at 120°C for 24 h.
A1-3 Addition of Aluminum Oxide
The method used to prepare the alumina containing precipitated iron catalysts
employed an Fe/Cu precipitate of the desired composition (100 Fe/5 Cu) that had been
already vacuum dried. Under an atmosphere of dry nitrogen (to prevent exposure to
atmospheric water) an appropriate amount of liquid sec-butoxide was dissolved in a volume
of 2-butanol needed to just fill the pores of the precipitate sample (incipien t wetness method).
The required amount of dried Fe/Cu precipitate was added to the bu toxide solution, and the
resulting slurry w as stirred fo r 16 hours to ensure com plete pore filling by viscous alkoxide
solution. Excess alcoho l solvent was then removed by heating the mixture in a vacuum oven
for 6 h at 60°C. Hydroly tic decom position of the impregnated aluminum sec-butoxide to
form Al,O, was accom plished by exposure of the material fo r 16 h a t 25°C to air that was
saturated with water vapor. The alumina-containing catalysts after being thoroughly washed
and dried in a vacuum oven for 16 h at 120"C, were impregnated with KHCO, (see below)
and were re-dried to yield the find catalysts.
A1-4 Impregnation by Potassium
Addition of the desired levels of potassium promoter to Fe-Cu-SiO, (or Fe-Cu-Al,O,)
catalyst precursors was made by pore filling techn ique, using dried precipitate that has been
crushed to < 30 mesh. In this method, the required amount of KHCO, is dissolved in a
volume of water that is - 5 % larger than that needed to just fill all of the pores of the solid.
A-2
7/28/2019 808495(1).pdf
http://slidepdf.com/reader/full/8084951pdf 227/240
The solution is then added to a weighed sample of the dried catalyst, resulting in the so-
called "incip ient wetness" condition. Excess solvent (water) is then removed by vacuum-
aided evaporation, with continuous rotational agitation. The final product is dried further in a
vacuum oven a t 12OOC for 16h. Th is procedure ensure s uniform and complete distribution
of the potassium salt throughout the catalyst pore structure.
A1-5 Potassium from Potassium Silicate (K,SiO,) Source
In some of the iron based F-T synthesis catalysts the source of potassium was
potassium silicge. For the preparation of these catalyst formulatiorg the wet precipitate
(cake) was utilized after the addition of potassium silicate to the Fe-Cu precipitite slurry.
After the addition of potassium silicate, the potassium content in the slurry is usually higher
than the desire d potassium content. Excess potassium w as removed by decan tation of
appropriate amounts of water from the slurry, and the remaining water was removed by
vacuum aided evaporation. Then the final solids were dried in a vacuum oven at 5OoC for 48
h and at 12OOC fo r 24 h.
.
AI-6 Addition of C alcium Oxide Promoter
Catalysts with nom inal composition 100 Fe/3 Cu/4 W x Cd16 SiO, and 100 Fe/5-
Cu/5 Wx C d 2 4 SiO, (where: x = 2 or 6 ) were prepared by impregnation of the
corresponding Fe-Cu-SiO, precursors. Dried precursors (prepared as described above in A l-
l and A1-2) were impregnated first with calcium acetate monohydrate (in catalysts with x =
2) and then with potassium bicarbona te by incipient wetness method. For catalysts with x =
6 , the dried precursors were impregnated first with potassium bicarbonate, followed by
impregnation with calcium acetate monohydrate.
A- 3
7/28/2019 808495(1).pdf
http://slidepdf.com/reader/full/8084951pdf 228/240
A1-7 Impregnation of Commercial Supports
We have prepared four supported catalysts (- 50 g each) by impregnation with
aqueous solutions of iron and promoter salts. The supports (silica - Davison grade 952; and
alumina - Vista B) were sieved and calcined at 500°C in air for 5 h prior to impregnation.
Catalysts containing iron, copper and potassium on silica or alumina were prepared by co-
impregnation with aqueous solutions containing desired am ounts of ferric nitrate, copper
nitrate and potassium bicarbonate in successive steps. The total volume of impregnating
solution (which contains the calculated amounts of promoters) was about 95 ml in each
catalyst preparation. How ever, the amount of impregnating solution consumed in each
impregnation step was differen t and varied with the support. For example during the
preparation of silica supported cata lysts we were able to complete the preparation of cakilysts
in three impregnation steps, whereas seven im pregnation steps were used in preparation of
alumina supported cata lysts. After each impregnation step the sample was vacuum dried at
100°C for about 2 h. After the fin al impregnation and drying for 12 h in vacuum, the catalyst
was calcined in air at 300°C for 5 h. Various steps in the ca talyst preparation are shown in
Figure A l- 1. Nominal compositions (on mass basis) of synthesized catalysts are: (1) 100
Fe/5 Cu/6 W139 S i 4 (2) 100 Fell0 Cu/6 W134 SiO,, (3) 100 Fe/5 Cu/6 W139 Al,O, and
(4) 100 Fe/lO Cu/6 W1 34 Al,O,. The corresponding weight % of iron (as metal) in the
prepared catalysts is approxim ately 33.8%.
References
Deckwer, W.-D.,erpemen,Y, alek, M. nd Schmidt, B., "Fischer-Tropsch Synthesis in
the Slurry Phase onMn/Fe Catalysts", Ind. Eng. Chem . Roc.Des. Dev., 21,222-231
(1982).
Kolbel, H. and Ralek, M.,The Fischer-Tropsch Synthesis in the Liquid Phase", Catal. Rev. -
Sci. and Eng., 2 1,225-27 4 (1980).
A-4
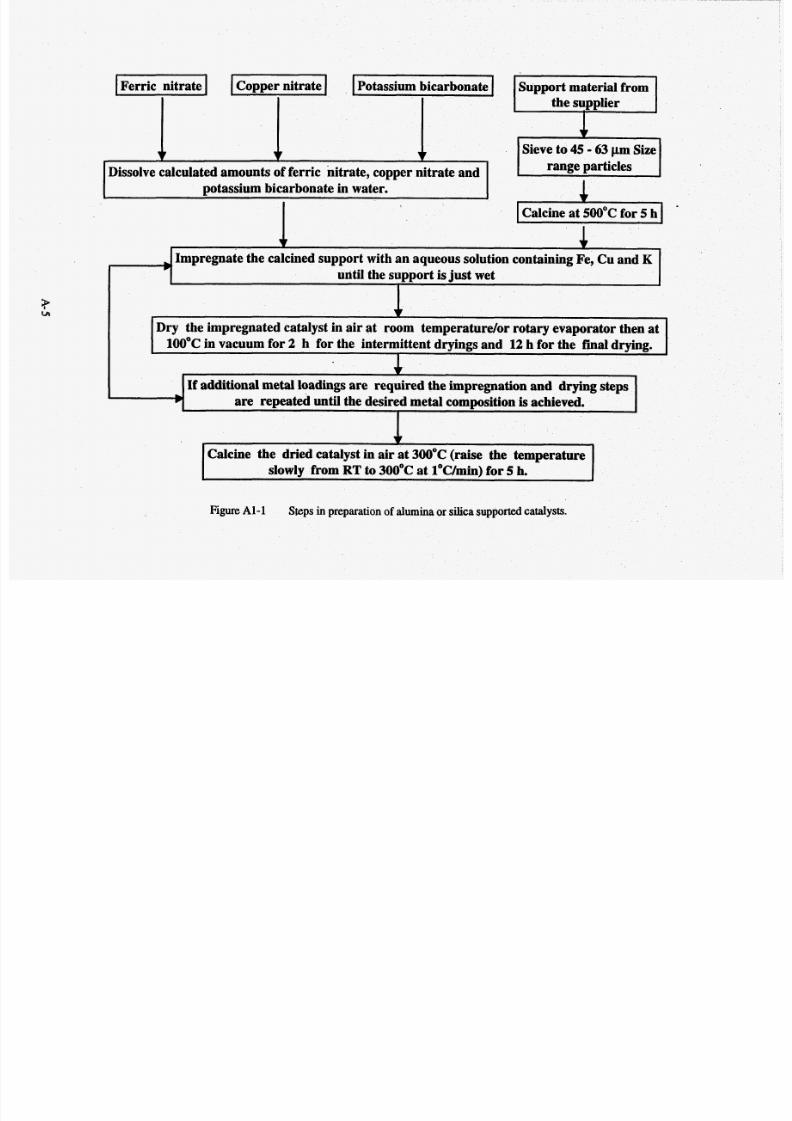
7/28/2019 808495(1).pdf
http://slidepdf.com/reader/full/8084951pdf 229/240
1 - 1Potassium bicarbonate 1
I I ISupport material from
- the supplier
~~~~
1Dissolve calculated amounts of ferric nitrate, copper n i t r a t e 4
-Calcine the dried catalyst in air at 300°C (raise the temperature
slowly from RT o 300°C at l"C/min) for 5 h.> L
I potassium bicarbonate in water. I
1
I range particles I(alcine at 500°C for 5 h
I
Figure Al-1 Steps in preparation of alumina or silica supported catalysts.
7/28/2019 808495(1).pdf
http://slidepdf.com/reader/full/8084951pdf 230/240
Appendix 2 Catalyst Characterization Equipment and Procedures
A2-1 Elemental Analysis
Catalyst bulk compositions were determined by Atomic Absorption Spectroscopy
(AAS) using a Varian SpectrA A-30 spectrophotometer. For AAS analy sis, a required
amount of catalyst was dissolved in an acid mixture of hydrochloric (HCI) and hydrofluoric
acid (HF)ollowed by dilution with distilled water to 100 ml. Portions of this sample were
properly diluted and then the amounts of Cu, K, and Fe were determined by AAS. The
composition of silica was determined either directly by the A A S method or by calculation
method. In the latter method, the composition of silica in the catalyst was estimated
indirectly using the measured amounts of Fe, Cu, and K and by assuming that oxides of these
elements were in the form of Fe,03, CuO, and GOO3. The weight percent of SiO, was
calculated from the equation:
wSi02 = 100% - WFe (MW203/2MFe) - W C u ( M C u 0 ~ C u ) WK @ 4~ 2c 03 /2 W
where: W i is the weight percent of element i determined by AAS, Mi is the molecular (or
atomic) weight of species i.
A2-2 BET Surfa ce Area, Pore Volume and Pore SizeDistribution Measurements
The BET surface area and pore volume measurements of the catalysts after
calcination were obtained by nitrogen physisorption at 77K using Micromeritics Digisorb
2600 system. The sam ples (- 1-2 ) were degassed at 150°C or 12 h prior to eachmeasurement. Surface area only was also determined using Pulse Chemisorb 2705
instrument (Micromeritics Inc.). Catalyst samples were outgassed in a flow of nitrogen (- 30
cm3/min)at 200°C for 3 to 12 h prior to each measurement.
A- 6
7/28/2019 808495(1).pdf
http://slidepdf.com/reader/full/8084951pdf 231/240
. .
A2-3 X-Ray Diffraction Measurements
c
Powder X-ray diffraction patterns of catalyst samples before pretreatment, after
pretreatment, and after Fischer-Tropsch synthesis reaction (used catalysts) were obtained on
a Scintag XDS-2000 iffractometer using C u K a radiation (A= 1.54 "A) starting from 28 =
28" to 68" at a rate of l"/min. Th e pretreated and used catalyst samples from fixed bed and
slurry reactor tests were handled in an inert atmosphere to prevent catalyst oxidation prior to
and during XRD measurements.
Handlinp of S l u m Reactor Samoles - No Extraction
A small portion (7-8 ) of a slurry sample withdrawn from the reactor was transferred
into a small cylindrical vessel (sampling cylinder) which can be sealed air-tight. The
sampling cylinder was transferred to a glove box filled with inert gas (Argon). The slurry
samples fo r XRD analy ses were removed in an inert atmosphere and washed w ith dry and
warm Varsol so lvent, until the filtrate (Varsol) was clear. After this the solid residue
(catalyst plus som e wax) is transferred into a sam ple holder or stored in a sample vial. The
sample holder is sealed in the glove box and then placed directly in the X-ray diffractometer.
The sample holders are made out of Plexiglas which does not yield any diffraction peaks.
The above procedure prevents exposure of catalyst samples to an oxidizing environment.
Extracted Sam de s for X-rava
'
Catalyst samples from slurry reactor tests were separated from wax in an inert
atmosphere according to the following procedure. A slurry sample (about 7-8 ), from the
sampling cylinder w as dispersed in 500ml of warm and degassed Varsol and then filtered at
about 80°C. Th e filter cake, mostly catalyst and a small amou nt of wax, was then rinsed withwarm degassed xylene. Th e wet cake was dried in vacuum at ambient temperature in a pre-
chamber of the glove box. After drying, the cake was put into an extraction thimble which
was placed inside a small sealable plastic bag. Th e thimble was then transferred into the
Soxhlet extraction apparatus in a glove bag filled with pure Argon. The extraction apparatus
was then taken ou t of the glove bag and the extraction is carried out first with 200ml xylene
A- 7
7/28/2019 808495(1).pdf
http://slidepdf.com/reader/full/8084951pdf 232/240
for 10 h, followed by m ethyl ethyl ketone (MEK) or another 10h. The top of the condenser
unit was closed so that no air could enter the system during the extraction. At the end of
extraction, the ca talyst was transferred again to the glove box where it was removed from the
thimble and sealed in sample vials and stored, or placed in specially designed sample holders
for characterization by XRD.
Fixed Bed Reactor S a
At the end of reaction tests the reactor was sealed (air-tight) in an inert gas
atmosphere and then transferred to a glove box. Catalyst samples removed from the top,
bottom, and /or m iddle portions of the reactor were analyzed separa tely, after magnetic
separation from g lass beads (used a s a d iluent during FT synthesis) in a glove box. Such a
separation was found to increase the intensity of the XRD peaks significantly.
Catalvst Passivation Procedyre after IsothermalRed-
After an isothermal reduction in a thermal gravimetric analyzer the catalyst sample
was cooled to a room tem perature in helium flow (100 cm3/min). The n a small stream (at a
low flow rate) of purified air was introduced into the helium stream. Gradually the air flow
was increased very slowly until a final oxygen content was about 20%. The passivationprocess was marked by the occurrence of small exotherms (typically 2-3 K) n the catalyst
bed and subsequent return to room temperature. At the end of passivation the sample was
loaded into a specia lly designed sample holder and analyzed by X-ray diffractometer.
A24 Mossbauer Effect Spectroscopy
The Mossbauer measurements were conducted at the University of Kentucky (The
Consortium fo r Fossil Fuel Liquefaction Science) using a constant acceleration spectrometer
of s tandard design . The radioactive source consisted of 50 - 100 mCi of 57Co in a Pd matrix.
The samples were in powdered form and were mounted in Plexiglas compression holders to
present a thin aspec t to the gamma ray beam. Calibration spectra of metallic iron were
obtained simultaneously at the other end of the drive. The spectra were analyzed by least-
A- 8
7/28/2019 808495(1).pdf
http://slidepdf.com/reader/full/8084951pdf 233/240
squares regression of a sum of Lorentzian lines to the experimental data. The hyperfine
parameters (the isomer sh ift, the quadrupole splitting, and the magnetic hyperfine field) were
obtained from the estimated line positions. Iron phases were identified by m atching the
observed values of the hyperfine parameters to those from literature .
A24 Temperature Programmed R eduction (TPR) Measurements
Temperature-programmed reduction (TPR) studies were performed using 5% H2/95
%N2 s reductant. In a typical TPR experiment about 10 to 20 mg of catalyst was packed in
a quartz reactor and purged 'with helium to remove the moisture from the ca talyst sample.
Then the catalyst samp le was heated in a flow of 5% HJ95%N2 flow rate of 40 m3/min)
from room tem perature to 800-900°C at a heating rate of 20"C /min. Consum ption of the H,
was monitored by a change in the thermal conductivity of the effluent gas stream. A dry
ice/acetone bath was used to remove water formed during hydrogen reductions. In order to
quantify the degree of reduction, CuO standard was used for the ca libration of the peak areas.
All experiments were conducted in Pulse Chemisorb 2705 unit (Micromeritics Inc.) equipped
with thermal condu ctivity detector and temperature programmable furnace for TPR RP D
studies.
A2-6 Isotherm al Reductions by Thermogravimetric Analysis
Isothermal reduction in thermogravimetric analysis (TGA) experiments was
conducted using approximately 20 mg catalyst samples. The catalyst sample was purged
with helium (40 m3/min) and temperature was ramped a t a rate of 5"C/min from room
temperature to a desired reduction temperature. Then the helium flow was switched to a
reductant (hydrogen, carbon monoxide or synthesis gas) at 40-100 cm'lmin, and the
temperature was maintained at a constant value for a total period of up to 8 hours. The
degree of reduction was calculated from the weight loss vs. time data. Experimen ts were
conducted in a simultaneous TGA/DTA apparatus (TA Instruments, Model SDT 2960).
A-9

7/28/2019 808495(1).pdf
http://slidepdf.com/reader/full/8084951pdf 234/240
Appendix 3 Fixed and Slurry Bed Reactors and Product Analysis System
A3-1 Fixed bed reactor
Two fixed bed reactors were for screening tests of F-T catalysts. A simplified flow
diagram of one of the existing reactors is shown in Figure A3-1. The reactor is a
conventional downflow f ixed bed reactor (1.3 cm inside diameter, effective length of 30 m).
Bed temperature is monitored through six thermocouples placed along the reactor. The
reactor is heated ex ternally with heating tapes wound around periphery of alum ina blocks
surrounding the stainless steel reactor. The reduction gas, an inert gas (helium or nitrogen),
an do r a premixed syn thesis gas passes through a series of oxygen remov al, alumina, and
activated charcoal traps to remove trac e impurities. The gas flow rate is controlled using
calibrated mass flow controllers, and the feed was preheated before entering the reactor.
After leaving the reactor, the exit gas passes through a high pressure trap, which is
maintained at abou t 90 150°C, to condense high molecular weight products. After releasing
pressure through a back pressure regulator, the gas passes through a low pressure ice trap to
collect any remaining condensibles. The flow rate of the tail gas exiting the system is
measured frequently with a soap film flow meter.
During mass balance periods liquid products are allowed to accumulate in high and
low pressure mass balance (steady state) traps. At the conclusion of the mass balance period,
flow is directed to waste traps placed in parallel with the mass balance traps, and liquid
products from the mass balance traps are collected and weighed. After startup, and following
any change in process con ditions, the reactor is allowed to opera te undisturbed for 20 - 40
hours in order to achieve steady conditions before the next mass balance is performed. High
molecular weight hydrocarbons (wax), collected in the high pressure trap, and liquid
products, collected in the ice trap, are analyzed by gas chromatography.
A- 10
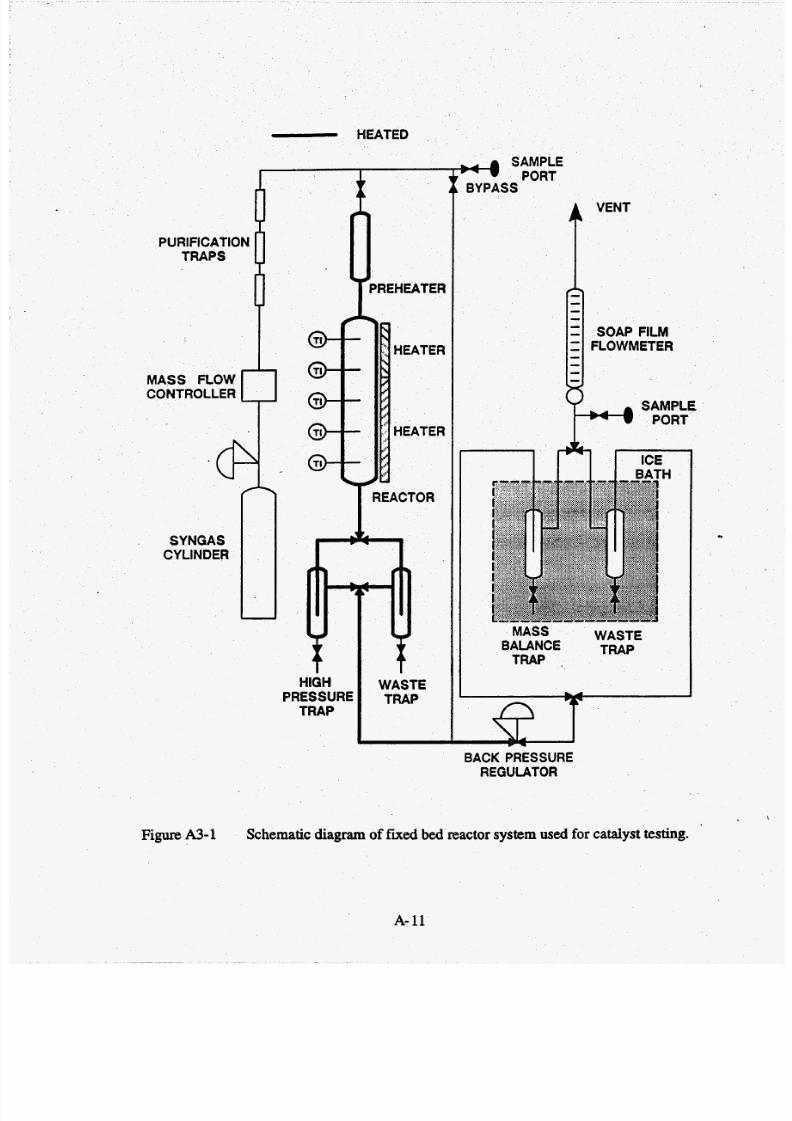
7/28/2019 808495(1).pdf
http://slidepdf.com/reader/full/8084951pdf 235/240
- EATED
1
IPURIFICATION
TRAPS
MASS FLOWCONTROLLER
SYNGASCYLINDER
t
I
HIGHPRESSURE
TRAP
tWASTE
TRAP
SAMPLE
*ORTBYPASS
A VENT
n----Z SOAP FILM
Z FLOWMETER
---
SAMPLEPORT
H
~ MASS WASTEBALANCE TRAP
TRAP .
BACK PRESSUREREGULATOR
Figure A3-1 Schematic diagram offixed bed reactor system used for catalyst testing.
A-11
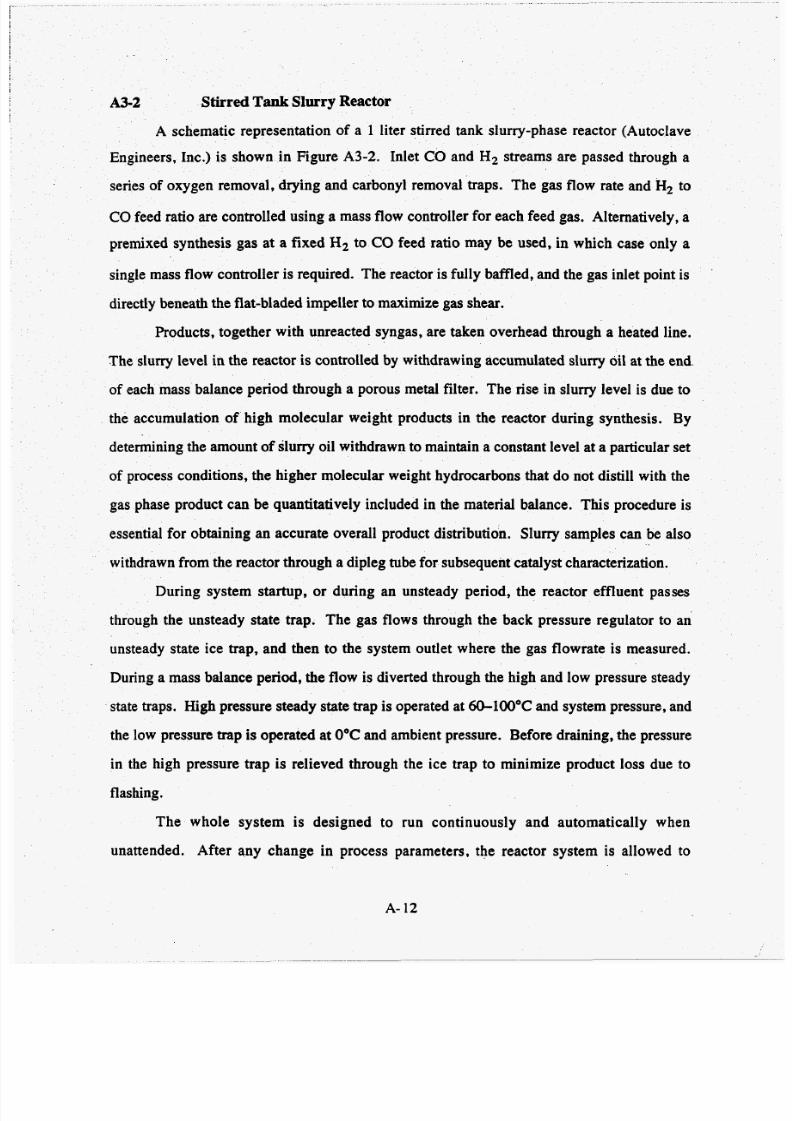
7/28/2019 808495(1).pdf
http://slidepdf.com/reader/full/8084951pdf 236/240
A3-2 Stirred Tank Slurry Reactor
A schematic representation of a 1 liter stirred tank slurry-phase reactor (Autoclave
Engineers, Inc.) is shown in Figure A3-2. Inlet CO and H, stream s are passed through a
series of oxygen removal, drying and carbonyl removal traps. The gas flow rate and H2 o
CO feed ratio are controlled using a mass flow controller for each feed gas. Alternatively, a
premixed synthesis gas at a fixed H2 o CO feed ratio may be used, in which case only a
single mass flow controller is required. The reactor is fully baffled, and the gas inlet point is
directly beneath the flat-bladed impeller to maximize gas shear.
'
Products, together with unreacted syngas , are taken overhead through a heated line.
The slurry level in the reactor is controlled by withdrawing accumulated slurry oil at the end
of each mass balance period through a porous metal filter. The rise in slurry level is due to
the accumulation of high mole cular weight products in the reactor during synthesis. By
determining the am ount of slurry oil withdrawn to maintain a constant level at a particular set
of process cond itions, the higher molecular weight hydrocarbons that do not distill with the
gas phase product can be quantitatively included in the material balance. This procedure is
essential for obtaining an a ccura te overall product distribution. Slurry samples can be alsowithdrawn from the reactor through a dipleg tube for subsequent catalyst characterization.
During system startup, or during an unsteady period, the reactor effluent passes
through the unsteady sta te trap. The ga s flow s through the back pressure regulator to an
unsteady state ice trap, and then to the system outlet where the gas flowrate is measured.
During a mass balance period, the flow is diverted through the high and low pressure steady
state traps. High pressure steady state trap is operated at 60-1OO"C nd system pressure, and
the low pressure trap is operated at O°C and ambient pressure. Before draining , the pressure
in the high pressure trap is relieved through the ice trap to minimize product loss due to
flashing.
The whole system is designed to run continuously and automatically when
unattended. Afte r any change in process parameters, the reactor system is allowed to
A- 12
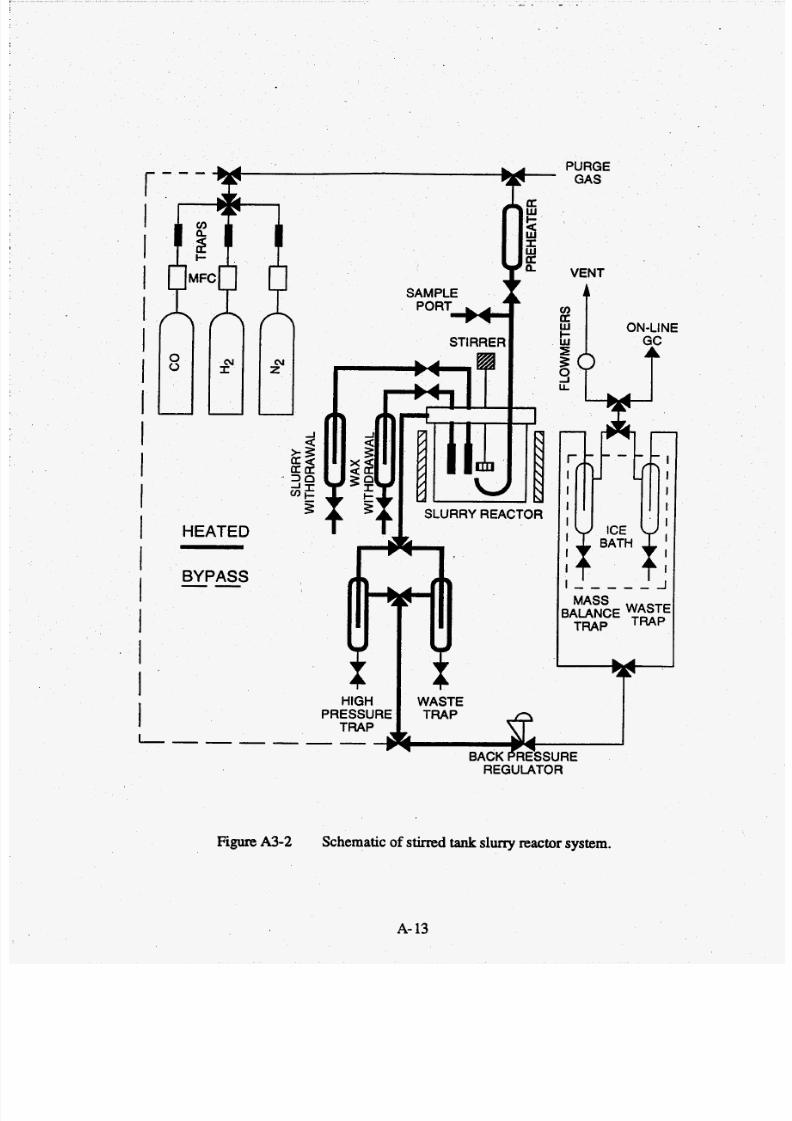
7/28/2019 808495(1).pdf
http://slidepdf.com/reader/full/8084951pdf 237/240
r - - - W I
I
II
1i"i li";IIIII11IIl
HEATED
BYPASS--
SAMPLE
poRTuSTIRRER
-7
ta
cSLURRY REACELURRY REAC
PURGE
GAS
VENT
ON-LINE
L L
1
IiOR
MASS8ALANCE
TRAP
HIGH 1 WASTE I
REGULATOR
Figure A3-2 Schematic of stirred tank slurry reactor system.
A- 13

7/28/2019 808495(1).pdf
http://slidepdf.com/reader/full/8084951pdf 238/240
equilibrate for at least 14 to 16hours before obtaining material balances over an additional 8-
12 hour period. Due to the complexity of the Fischer-Tropsch product, equilibration of the
reactor and the product co llection system and a flexible qu antitative analysis scheme
incorporating all product, including waxes, are required to produce good mass balances and
prevent misleading results. All products collected in the steady s tate traps are analyzed by
gas chromatography after physical separation into an aqueous and organic phase. Exit gas
composition is determined by an on-line gas chromatograph, and wax from the reactor is
analyzed on a ca pillary column (see below).
A3-3 Product Analysis
A versatile analytica l and com puterized data handling system consis ting of four GC's
linked to a data acquisition system is used for product analysis (Figure A3-3). In the gas
effluent from the reactor unreacted H2, CO and product C 02 and C ,€, hydrocarbon gases
are analyzed on the Carle AGC-400 chromatograph. Small amounts of c6 and higher
hydrocarbons and light oxyg enates that are not condensed in the cold trap are analyzed by a
Varian 3400 GC. The liquid product is separated into aqueous and organic fractions. The
aqueous layer is analyzed for C ,€ alcohols, C 2 €4 aldehydes,G-C,ketones and carboxylic
acids. The water con tent is determin ed by Karl-Fischer titrator. Th e organic fraction is
analyzed in a Varian 3400 GC for C4€ hydrocarbons ,C4€,, alcohols,C;C, ketones, and
G-C,aldehydes. The wax fractio n is dissolved in CS2 or other organ ic solvents and is
analyzed on the Varian 3400 f or hydrocarbons up to C, .Several integrators are used to co llect and integrate the data from all the GC's. The
results are then transferred to a PC or further analysis and reduction. Mass balance program
uses pull up templates to prompt the operator to enter the needed inform ation. Calibration
data for each GC are stored in databases files. The program is designed to handle up to 50
classes of products with up to 100 members in each class. Five types of streams: feed gas,
aqueous liquid product, organic liquid product, reactor tail gas, and reactor wax are
A- 14
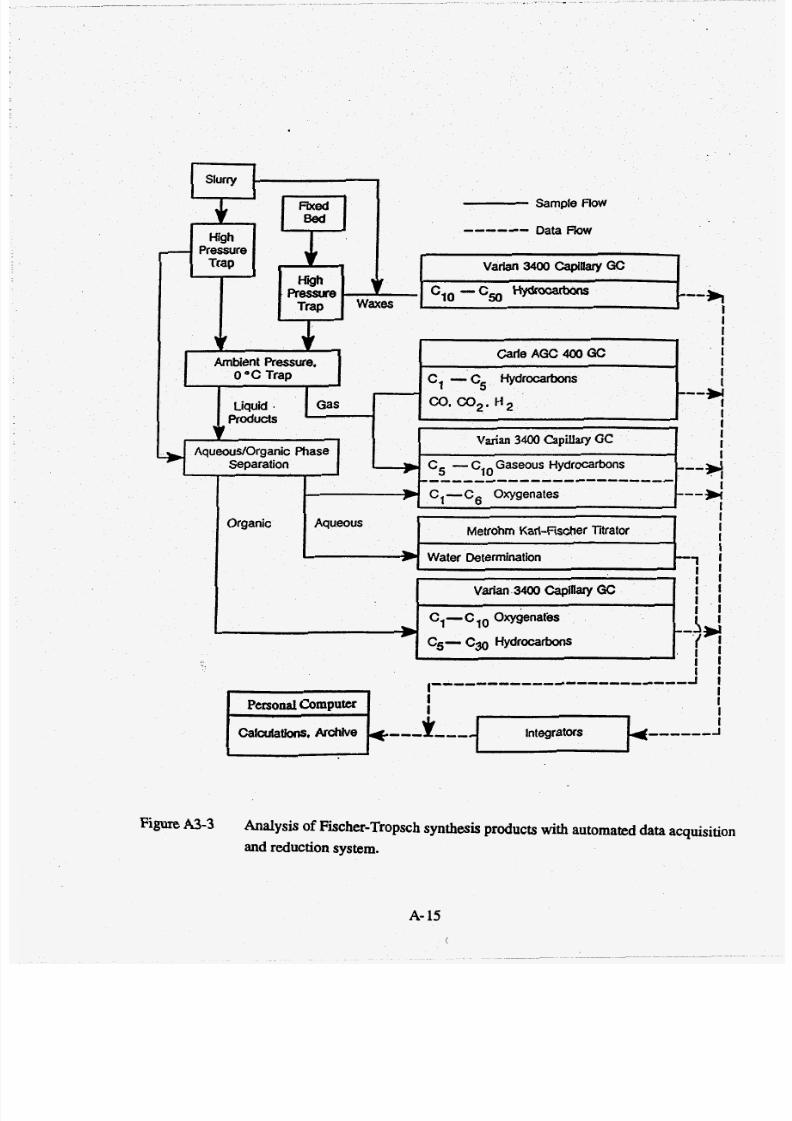
7/28/2019 808495(1).pdf
http://slidepdf.com/reader/full/8084951pdf 239/240
- ressure
Trap Varian 3400 capiuaryGC>
---*l0 -Cm Hydfocarborrsigh
pressure.Trap waxes I
III
carle AGC 400GcI
II
Products IIII
+ I
Ambient Pressure. I0"C rap C, -C5 Hydrocarbons
Liquid . Gas CO. Oe. H Z ---y
Varian 3400 Capillary GCAqueousIOrganic Phase
Figure A3-3 Analysis of Fischer-Tropsch synthesis products with automated data acquisition
and reduction system.
.-* C5- l0 aseous Hydrocarbonseparation.......................
+ C1-C6 Oxygenates
Organic Aqueous
L
Metrohm Karl-Fischer Titrator
-ater Determination
A- 15
(
---*I
III
II
---m
---I 1
: ' I
7/28/2019 808495(1).pdf
http://slidepdf.com/reader/full/8084951pdf 240/240
considered by the program. Using measured sample weights, the program can calculate
individual species flow rates and arrive at total inlet and outlet weight and mole fractions of
all identified compounds. The material balance program calcu lates mass and atomic balance
closures, yields, and selectivities of products, and lumps products according to carbon
numbers. The mass balance program also calculates Schulz-Flory chain growth parameters


![Case_Studies[1] (1).pdf](https://static.documents.pub/doc/80x56/55cf8fbc550346703b9f471e/casestudies1-1pdf.jpg)


![science3stprimaryschool[1] (1).pdf](https://static.documents.pub/doc/80x56/5695d0681a28ab9b029256b7/science3stprimaryschool1-1pdf.jpg)


![1 habit 1[1].pdf](https://static.documents.pub/doc/80x56/55cf92cb550346f57b999be7/1-habit-11pdf.jpg)


