03/21/22 Slide 1 The only legitimate mathematical operation that we can use with a variable that we treat as categorical is to count the number of cases that fall in each category, and work with those counts as numbers, percentages, probabilities, or odds. Hypothesis tests for categorical variables have the same limitation – they can only compare counts, percentages, probabilities, or odds. The chi-square test of goodness-of-fit is used to test whether or not the distribution of a categorical variable fits a particular pattern. Specifically, the goodness-of- fit test compares the actual or observed frequency for a categorical variable to a hypothesized distribution, referred to as the expected frequencies. The pattern of expected frequencies can be based on: •a distribution from previous research, e. g., does the breakdown of the variable in my study match what is found in previous studies; •a conceptual distribution of the way we think events should occur, e.g. are the number of referrals to an agency consistent across months; •a theoretical distribution, e.g. are the frequencies in my distribution equivalent to what we would expected for a variable that is normally distributed.
Transcript
04/19/23 Slide 1
The only legitimate mathematical operation that we can use with a variable that we treat as categorical is to count the number of cases that fall in each category, and work with those counts as numbers, percentages, probabilities, or odds. Hypothesis tests for categorical variables have the same limitation – they can only compare counts, percentages, probabilities, or odds.
The chi-square test of goodness-of-fit is used to test whether or not the distribution of a categorical variable fits a particular pattern. Specifically, the goodness-of-fit test compares the actual or observed frequency for a categorical variable to a hypothesized distribution, referred to as the expected frequencies.
The pattern of expected frequencies can be based on:•a distribution from previous research, e. g., does the breakdown of the variable in my study match what is found in previous studies;•a conceptual distribution of the way we think events should occur, e.g. are the number of referrals to an agency consistent across months;•a theoretical distribution, e.g. are the frequencies in my distribution equivalent to what we would expected for a variable that is normally distributed.
The comparison of actual to expected frequencies assumes there will be differences due to sampling variation. The statistical question asks whether the differences are large enough to make it unlikely that they represent the same distribution in the population.
04/19/23 Slide 2
Goodness of fit defines the degree to which two distributions are similar.
The null hypothesis for the test is: the actual frequencies from our sample are equal to the expected frequencies.
The alternative hypothesis specifies a difference similar to a two-tailed research hypothesis: the actual frequencies are not equal to the expected frequencies.
To compute the expected frequency counts, we need a percentage breakdown of the categories in the distribution we want to compare to, e. g. 20% in category 1, 30% in category 2, 15% in category 3, etc.
The expected frequencies are the percentage in each category multiplied by the total number of valid cases for the variable. For example, if I had 50 cases in my sample to compare to the percentage breakdown above, my expected frequencies would be 50 x 20% = 10 for category 1, 50 x 30% = 15 for category 2, 50 x 15% = 7.5 for category 3, etc. Note that expected frequencies can be decimal fractions, even though actual counts would always be whole numbers.
The chi-square statistic is based on the difference between actual and expected counts divided by a measure of standard error, which is this case is the expected frequency. The statistic is computed by summing across all categories.
04/19/23 Slide 3
The chi-square statistic goodness-of-fit test derives its name from the chi-square distribution, which is the theoretical distribution used to derive probabilities.
The chi-square distribution can take on different shapes according to the degrees of freedom in the analysis. Fortunately, SPSS can easily compute both the degrees of freedom and the probability as the p-value or sig value that we use for making statistical decisions.
The chi-square distribution provides accurate probabilities providing the distribution meets the minimal requirement that the expected frequency for each cell is 5 or more. There are more complicated versions of this rule (e.g. expected frequencies of 5 or more cases in 80% of the cells and no cells with an expected frequency less than 1) but we will apply the rule of expected frequencies of 5 or more per cell, or category, for the frequency distribution.
The chi-square distribution is also affected by very large samples. Since the statistic is based on differences in counts, doubling the sample size doubles the size of the statistic. Since degrees of freedom is based on the number of categories in the distribution, the probability will be smaller (more significant) as the sample size increases. This is demonstrated on the next slide.
04/19/23 Slide 4
Finally, we note that, similar to our other hypothesis tests, the interpretation of the results of the statistical test is applied to the population from which our sample is drawn.
The sample size is doubled from the first table to the second, and from the second table to the third, though each table contains the same percentage breakdown in the three categories. The size of the chi-square statistic in the second table is double that for the first table, and the chi-square statistic in the third table is double the size of the statistic for the second table.
04/19/23 Slide 5
The introductory statement in the question indicates:• The data set to use: GSS2000R.SAV• The task to accomplish: a chi-square test of goodness-of-fit• The variable to use in the analysis respondent's degree of
religious fundamentalism [fund]• The percentage breakdown from previous research: 21.3%
in the category 'fundamentalist', 30.8% in the category 'moderate' and 47.8% in the category 'liberal'
• The alpha level of significance for the hypothesis test: 0.05
04/19/23 Slide 6
Since the SPSS chi-square goodness-of-fit test requires that the breakdown be entered by count rather than percentage, the second paragraph of the directions gives you the counts to use for each category.
04/19/23 Slide 7
The first statement asks about the level of measurement. The chi-square test of goodness-of-fit requires that the variable be categorical.
04/19/23 Slide 8
"Respondent's degree of religious fundamentalism" [fund] is ordinal level, which can be treated as a categorical variable.
Mark the statement as correct.
04/19/23 Slide 9
The next statement asks about the sample size. The chi-square test of goodness-of-fit requires that all cells have an expected frequency of five or more.
To answer this question, we need to compute the chi-square test of goodness-of-fit.
04/19/23 Slide 10
To compute the chi-square test of goodness-of-fit, select the Nonparametric Tests > Chi-Square from the Analyze menu.
04/19/23 Slide 11
First, move the variable fund to the Test Variable List.
Second, click on the Values option button to signal that we will enter the expected frequencies in the dialog box.
Third, type the count for the first category, 54, in the text box. The counts must be entered in the correct order or the test will produce incorrect results.
Fourth, click on the Add button to add the 54 to the list of expected values.
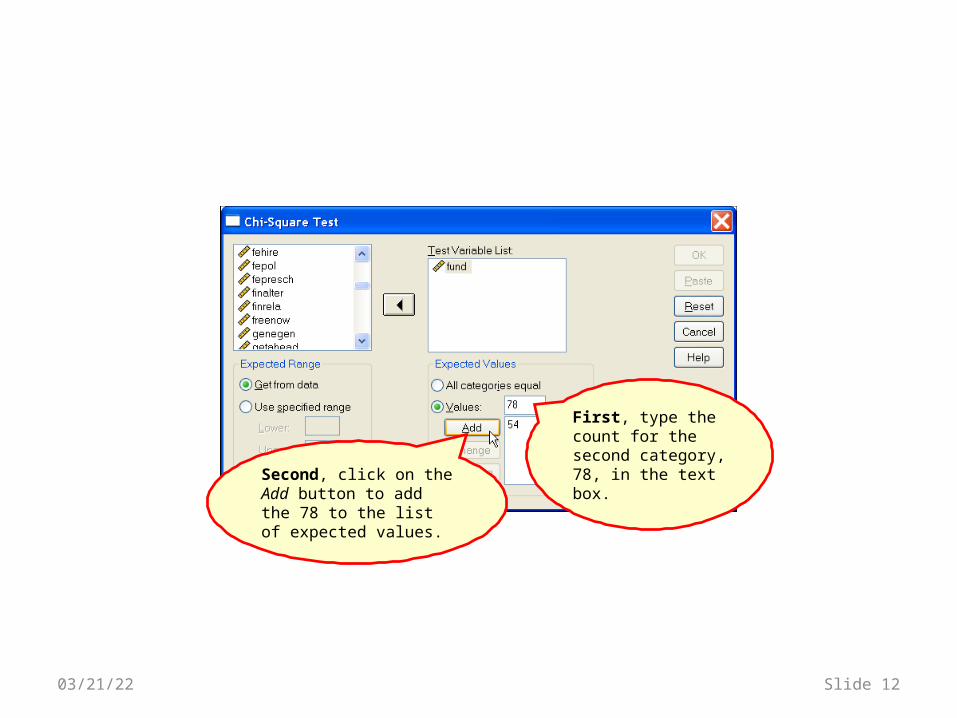
04/19/23 Slide 12
First, type the count for the second category, 78, in the text box. Second, click on the Add
button to add the 78 to the list of expected values.
04/19/23 Slide 13
First, add the count for the third category, 121, to the list of expected values.
Second, click on the OK button to produce the output.
04/19/23 Slide 14
We can use the Expected N column of the frequency table to verify that we entered the expected frequencies correctly.
The critical piece of information about sample size is found in the footnote to the Test Statistics table.
0 cells had an expected frequency less than 5.
04/19/23 Slide 15
The expected frequency for all cells was equal to or greater than 5. The sample size requirement is satisfied.
Mark the check box for a correct answer.
04/19/23 Slide 16
The next statement asks us what the null hypothesis for the test states.
04/19/23 Slide 17
The null hypothesis for the test is stated correctly: the actual frequencies are equal to the expected frequencies.
Mark the check box as correct.
04/19/23 Slide 18
The next statement asks us to relate the chi-square test to the data in our problem.
04/19/23 Slide 19
Mark the statement as correct.
The chi-square statistic is based on the differences between the actual frequencies and the expected frequencies relative to the expected frequencies.
04/19/23 Slide 20
The next statement asks us about the probability (p-value or sig. value) for the chi-square test of goodness-of-fit.
04/19/23 Slide 21
The probability that the actual frequencies are equal to the expected frequencies was p < .001.
04/19/23 Slide 22
The probability that the actual frequencies are equal to the expected frequencies was p < .001.
Mark the check box for a correct answer.
04/19/23 Slide 23
The next statement asks about the statistical decision or conclusion that we would make based on the p-value.
04/19/23 Slide 24
When the p-value for the statistical test is less than or equal to alpha, we reject the null hypothesis and interpret the results of the test. If the p-value is greater than alpha, we fail to reject the null hypothesis and do not interpret the result.
The p-value for this test (p < .001) is less than or equal to the alpha level of significance (p = .050) supporting the conclusion to reject the null hypothesis.
Mark the check box for a correct answer.
04/19/23 Slide 25
The final statement asks us to interpret the results of the statistical test.
04/19/23 Slide 26
Since we rejected the null hypothesis, we know that the breakdown of cases in our sample is different from that found in previous research. We can interpret this difference as indicating that the sample used in this analysis is probably not from the sample population reported in previous research, or some event has altered the breakdown of the cases.
We mark the check box for a correct answer.
When we do not reject the null hypothesis, we do not interpret the results.
04/19/23 Slide 27
Variable is categorical?
Yes
Do not mark check box.
Mark statement check box.
No
Mark only “None of the above.”
Stop.
Compute chi-square goodness-of-fit test in SPSS
All cells have expectedfrequency of 5+?
Do not mark check box.No
Stop.
Yes
Mark statement check box.
04/19/23 Slide 28
Yes
Do not mark check box.
No
Mark statement check box.
H0: actual frequencies = expected frequencies
Chi-square test accurately described?
Yes
Do not mark check box.No
Mark statement check box.
04/19/23 Slide 29
Yes
P-value (sig.) stated correctly?
Yes
Do not mark check box.
Mark statement check box.
No
Do not mark check box.
No
Mark statement check box.
Reject H0 is correct decision (p ≤ alpha)?
Stop.
We interpret results only if we reject null hypothesis.


![Exploring Categorical Structuralismcase.edu/artsci/phil/PMExploring.pdfExploring Categorical Structuralism COLIN MCLARTY* Hellman [2003] raises interesting challenges to categorical](https://static.documents.pub/doc/80x56/5b04a7507f8b9a4e538e151c/exploring-categorical-categorical-structuralism-colin-mclarty-hellman-2003-raises.jpg)
