ARL-AERO-R-173 AR-004-572 0 DEPARTMENT OF DEFENCE DEFENCE SCIENCE AND TECHNOLOGY ORGANISATION AERONAUTICAL RESEARCH LABORATORY MELBOURNE, VICTORIA Aerodynamics Report 173 AXISYMMETRIC VORTEX BREAKDOWN PART I CONFINED SWIRLING FLOW (U) by J.M. LOPEZ I I Approved for Public Release This work is copyright. Apart from any fair dealing for the purpose of study, research, criticism or review, as permitted under the Copyright Act, no part may be reproduced by any process without written permission. Copyright is the responsibility of the Director Publishing and Marketing, AGPS. Inquiries should be directed to the Manager, AGPS Press, Australian Government Publi " '. GPO Box 84, Canberra, ACT 2601. commonwealth ot Australia \Oc JANUARY 1988 89 9 18 063
Transcript
ARL-AERO-R-173 AR-004-572
0
DEPARTMENT OF DEFENCE
DEFENCE SCIENCE AND TECHNOLOGY ORGANISATION
AERONAUTICAL RESEARCH LABORATORY
MELBOURNE, VICTORIA
Aerodynamics Report 173
AXISYMMETRIC VORTEX BREAKDOWN PART I
CONFINED SWIRLING FLOW (U)
by
J.M. LOPEZ I I
Approved for Public Release
This work is copyright. Apart from any fair dealing for the purposeof study, research, criticism or review, as permitted under theCopyright Act, no part may be reproduced by any process withoutwritten permission. Copyright is the responsibility of the DirectorPublishing and Marketing, AGPS. Inquiries should be directed to theManager, AGPS Press, Australian Government Publi " '.
GPO Box 84, Canberra, ACT 2601. commonwealth ot Australia
\Oc JANUARY 1988
89 9 18 063
AR-004-572
DEPARTMENT OF DEFENCEDEF ICE SCIENCE AND TECHNOLOGY ORGANISATION
AERONAUTICAL RESEARCH LABORATORY
Aerodynamics Report 173
AXISYMMETRIC VORTEX BREAKDOWN PART I:
CONFINED SWIRLING FLOW
byJ.M. LOPEZ
SUMMARY
A comparison between the experimental visualization and numericalsimulations of the occurrence of vortex breakdown in laminar swirling flowsproduced by a rotating endwall is presented. The experimental visualizationsof Escudier (Experiments in Fluids, 2, 1984) were the first to detect thepresence of multiple recirculation zones and the numerical model presentedhere, consisting of a numerical solution of the unsteady axisymmetric Navier-Stokes equations, faithfully reproduces these newly observed phenomena andall other observed characteristics of the flow. Part H of the paper examinesthe underlying physics of these vortex flows.
DSTOM E L B 0 U R N'E
(C) COMMONWEALTH OF AUSTRALIA 1988
POSTAL ADDRESS: Director, Aeronautical Research Laboratory,P.O. Box 4331, Melbourne, Victoria, 3001, Australia
CONTENTS
Page No.
1. INTRODUCTION 1
2. GOVERNING EQUATIONS AND BOUNDARY CONDITIONS 4
3. METHOD OF SOLUTION 6
4. RESULTS AND DISCUSSION 9
5. CONCLUSION 16
References
Figures
Distribution
Document Control Data
r izl I C
DiT
1. Introduction
Vortex breakdown in swirling flows has been the subject of much attention since it
was first recognized in the tip vortices of delta winged aircraft (Peckham & Atkinson
1957). More recently it has emerged as a serious problem at high angle of attack for
highly manoeuvrable military aircraft. As yet, there is no general consensus on the phys-
ical mechanisms responsible for its occurrence. The term vortex breakdown is associated
with an abrupt change in the character of a columnar vortex at some axial station. It
is usually observed as a sudden widening of the vortex cure together with a deceleration
of the axial flow and is often followed by a region or regions of recirculation.
Experimental studies of vortex breakdown over delta winged aircraft have been
severely hampered by the sensitivity of the flow to the presence of external probes,
making quantitative measurements of the flow in the 'burst' regions much more difficult.
Further complications arise as a result of the large number of parameters involved,
some of which are difficult to measure and/or control and whose importance to the
mechanisms leading to vortex breakdown is not known. With the identification of t01
vortex breakdown of swirling flows in cylindrical tubes (Harvey 1960), a large number of
Escudier & Zehnder 1982). A number of distinctive forms of breakdown were observed
in these investigations. which also showed the phenomenon typically to be unsteady and
possessing various degrees of turbulence and asymmetry. From these results, it had been
assumed that a description of vortex breakdown would require a three-dimensional, time
dependent calculation of the Navier-Stokes equations albeit with the possibility at high
Reynolds numbers of modelling the small scale turbulence.
Recently, Escudier (1984) observed the phenomenon of vortex breakdown in swirling
flows in a cylindrical container with a rotating endwall, using a laser-induced fluores-
cence technique. The experimental results extended those obtained earlier by Vogel
(1968) and lonnenberg (1977) and are the first te be reported in which multiple break-
down bubl)bles exist in the closed cylindric ,co (try. The recirculation bubbles were
observed to be axisymmetric and steady ove; irge range of the governing parame-
ters, which re-inforced Escudier's (198-1) view, earlier expressed as a result of a series
of swirling pipe fllw experiments (l'scildir & Keller 1983), that vorte(x breakdown in
general is inherent ly axisymmetric aiid I h: departures from axial symmetry result from
instabilities riit directly associated with I 1w breakdown process. Escudic.r's experiments
2
provide a particularly well-defined set of flows in which vortex breakdown occurs and
his figures (1984) motivated the present study in which the Navier-Stokes equations are
solved numerically under the assumption of axial symmetry. A principal aim of this
study was to clarify whether, under the assumption of axial symmetry, the numerical
solutions accurately reproduce all of the observed flow characteristics reported by Es-
cudier (1984). A further motivation for undertaking the investigation was to develop a
more detailed understanding of the physics of the flow and to clarify features that were
not readily resolved from the visualizations. For example, the dye streaks are 'blurred'
in the region of critical points in the experiment and the nature of the downstream end
of the recirculation bubble is difficult to ascertain from flow visualization. A main reason
for this 'blurred' picture is dye diffusion but, in some cases Escudier (1984) noted that
certain recirculation zones never develop a well defined internal structure. The numeri-
cal study shows that these regions in fact possess a localized low frequency unsteadiness
and this unsteadiness would result in a 'blurred' flow visualization.
In part II of this study the physics of the flows is examined in more detail. The
solutions are considered from the point of view of standing centrifugal waves and an
understanding of the mechanism responsible for the vortex breakdown of these con-
fined swirling flows is presented. The mechanics of vortex breakdown in this particular
geometry suggests a generalization which is discussed for some other geometries.
Previous numerical studies of swirling flows confined within a cylindrical container
(eg. Pao 1970; Lugt & Haussling 1973; Dijkstra & Heijst 1983) have either been restricted
to small aspect ratio flows (H/R, ratio of height and radius of the cylinder, less than
1), or flows with Re, the rotational Reynolds number, too small for vortex breakdown
to occur. Lugt & hlaussling (1982) is a notable exception in which HI/R < 1.6. and the
occurrence of a single breakdown bubble is reported. Their computational mesh does
not appear to be fine enough, however, since they found the size and location of the
bubble to vary as the resolution was altered and the time scales of their solutions are
not consistent with experimental observations.
Since submitting the first version of this paper, Lugt and Abboud (1987) have
also published numerical computations of the vortex breakdown phenomenon produced
in an enclosed cylinder by a rotating eidwall. Their calculations and those presented
here overlap somewhat as both sttidios use tie available experimnental results of Escudier
(198,1) as comparisons for the numnerica; -alciations. The results prsentel by Lugt and
3
Abboud (1987) generally agree very well with those presented here and their numerical
method of integrating the governing equations is quite different to the present method.
A large number of their results had not been integrated forward until a true steady
state had been reached and no information regarding the distribution of the azimuthal
component of vorticity is presented, which will be shown in Part II of this study to be
crucial in understanding the physical mechanism responsible for the vortex breakdown
of the vortical core flow.
4
2. Governing Equations and Boundary Conditions
The flows of interest are simulated by considering a cylinder of radius R and length
H, the bottom endwall of which is impulsively started to rotate at constant angular ve-
locity Q. The fluid, which completely fills the cylinder, is incompressible, of uniform den-
sity and a constant kinematic viscosity v. The axisymmetric form of the Navier-Stokes
equations, in cylindrical co-ordinates (r, 0, z) with corresponding velocity components
(u,v,n,), is employed. Time and length are scaled by (- and I/R respectively.
The system of equations is solved by employing the streamfunction-vorticity formu-
lation, where the pressure does not appear explicitly. This is achieved by the introduction
of a streamfunction 1, where
u - and w -= 9 (1)
which satitfies continuity and gives for the azimuthal component of vorticity
I 02V 9 1 'go
7=- - (2)
Incorporating (1) and (2) in the Navier-Stokes equations leads to the following predic-
tion equations for the azimuthal components of velocity and vorticity together with the
prognostic equation for the streamfunction:
8v 1 1VD o I C1 19 2 v 1 V v-t rJ(V) + - - 7-. i_ + 6 + - r2_ (3)
1 vv 1 2,+ aq+J(v) + 2- -+--- -± , ()
t r arz Re Oz 2 92 rar _2
and
a2- a 0 2¢ 10a5az2 + Orj r 5r r7, (5)
where
£1R2
Re =
anda'o - 90 9Oz Or Or az
The boundary conditions relevant to the experiments of Escudier (1984) to complete
5
the system (3)-(5) are:
zV= = 0 -7 = O (r 1, O < z < H/R),
10¢ (rzz1, 0 z < H/R),
V'=0, v = r, 77- r Oz2 (z =0, 0<r<1),
1 0=v =-O, ,7 2 (z=H/R, 0<r<).
The boundary condition at r 0 is due to the axial symmetry of the flow, the
boundaries at z = H/R and r = 1 are rigid and stationary, while at z = 0, the rigid
endwall is in constant rotation for t > 0. The fluid is stationary for t < 0.
6
3. Method of Solution
The system of differential equations (3) - (5) is replaced by an approximating set
of finite-difference equations, defined ,on a uniform mesh in the r, z plane at times nzt
(is = 0, 1,2,...). There are (nr + 1) x (nz + 1) grid nodes, and in all the cases presented
here, the increments Ar and Az are equal. Second-order accurate centered differences
are used to approximate all the spatial derivatives except those in the advection terms,
where the Jacobian conserving difference operator J is approximated using a scheme due
to Arakawa (1966). The time-differencing scheme used is that of Miller & Pearce (1974)
which consists of alternate timesteps. For a prediction equation of the form OF/& -
G(F), the odd time-steps are advanced according to
F' = F" + AtG(F"),
F -+ I = F" + AtG(F*),
while for even time-steps
F -+ 1 = Fn + AtG(Fn).
'Fle prognostic equation (5) for the streamfunction is solved using the generalized cyclic
reduction method of Sweet (1974).
To implement the boundary conditions for the azimuthal vorticity at the solid
boundaries at time (n + 1)At, the streamfunction field at that time is needed. This
is achieved by the following algorithm. First, the prediction equations (3) and (4) for v
and q may be advanced to the next time-step (n + 1)AI for the interior points since the
prognostic equation (,)) for V) only requires knowledgc of the inLerior values of t,. From
the solution to (5) together with the boundary conditions for 0, the streamfunction is
known everywhere at t = (n + 1)At. The boundary values of 17 can now be estimated
from 1 by noting that ¢ and its normal derivative vanish at a rigid boundary. Ietice.
expanding tb about the first point in from the boundary leads to
,(nr + l,j) = -2¢(nr,j)/Ar
77(i, 1) = -2¢(i, 2)/(rAZ2),
and
, 1) -2t,(i, nz)/(rA.z2 ).
7
Proper resolution of the boundary layers and any recirculation zones was ensured
by the use of Ar = Az = 1/60. A number of runs for lt/R = 1.5 were perfoirmed
using Ar = Az = 1/40 with only slight differences in the outline of the recirculation
zone being noted - the positions of the stagnation points were not appreciably altered
by the reduction in resolution. One run at H/R = 2.5 and Re = 2126 implemented
Ar = Az = 1/100. The difference between the streamlines from these results and those
from calculations with Ar = Az = 1/60 were insignificant. All the calculations presented
here are for Ar = Az = 1/60 and At 0.05, except for the one case of HIR = 2.5
and Re = 2126 where Ar = Az = 1/100 and At = 0.025. In all cases, the stability
of the model was ensured by the time-step satisfying both the Courant-Friedrichs-lewy
condition and the diffusion requirement (Williams 1967),
1 2At < -ReAr.
8
The quality of the numerical computations was further verified by (i) direct crm-
parisons with experimental results (§4), and by (ii) evaluation of the vorticity integral
(Dijkstra & van Heijst 1983). From the definition of the azimuthal vorticity (2), together
with the boundary conditions, the streamfunction and its normal derivatives vanish on
solid boundaries and 0 = 0 on the axis of symmetry, hence
JfjrrdV = 27r Ij HRr 2uzr=0 (7)f fI z=0
At t = 1000, this integral was evaluated by means of a two-dimensional trapezoidal
rule, and the positive and negative contributions to the trapezoidal sum accumulated
separately in J(r-) and I(7j-) respectively. In the limit Ar, Az - 0, I(-Q) .+ !(7- ) -:
The degree to which this is achieved is an indication of the quality of the numerical
scheme. Table I lists the values of the integral (7) together with I(77+ ) and 1(r- ) for
a selection of the cases considered. It is clear that the accura'y of the calculat -op
is impr(.ved by increasing the resolution from Ar, Az = 1/40 t,, 1/60. For the case
Re = 1256, 1,,j = (I(n7-) + I(s+))/(I( ) - I(,7+)) - 0.0015 when Ar, Az = 1/40,
whereas I,, - 0.00069 for Ar, .Nz = 1/60. On further grid refinement, as illustrated
by the Re = 2126 case, l -_ 0.00077 for Ar, Az = 1/60 and I-1 . 0.00055 for Ar,
A- : 1/100, indicating that Ar, A: = 1/60 constitutes a good compromise between
the ]v,I of accuracy and the c, iputl tionnal effort required Io achieve it. The extent to
which to. vorticity integral (7) is sat isied is reduced as Re is inc-,;tsed. However, in the
Re range considered, this trend is very weak, as when Re 1492 and Ar, Az 1/60,
Ij -- 0.00072, whereas for Re = 3023 and Ar, Az = 1/60, Irt - 0.00078.
Although most of the solutions presented in this study reach a steady state (those
which do not are noted), it is important to ensure that the model has temporal as well as
spatial accurracy. In the parameter range where the flow reaches a steady state, Escudier
(1984) reported that the time taken to reach this steady state from an impulsive start
was typically tens of seconds. In that same parameter range, i.e. 1.5 < HIR < 2.0 and
1000 < Re < 1500, the numerical model reaches steady state for t between 500 and 700.
In the case where v = 4.5 x 10⁻⁵ m 2 /S and R = 9.5 x 10⁻²M, which are the values in the
experiments of Escudier (1984), we find Q _ Re/200 and a 'spin-up' time to steady state
of approximately 60 seconds. The numerical result is consistent with the experimental
observations.
Escudier found experimentally that the flow undergoes a transition to unsteadiness
at some critical combinations of Re and HIR and he has mapped out this transition
(Figure 1). At the point where the flow becomes unsteady, the flow visualization tech-
nique is no longer able to give a clear picture of the flow characteristics. The present
numerical solutions are found to accurately predict those flows which lead to a stead'
state. This has given us confidence to investigate the transition to unsteadiness and this
aspect of the flow is the subject of a further report which is in preparation.
9
4. Results and Discussion
Escudier (1984) has mapped out a stability diagram in the (Re, H/IR) plane de-
lineating the regions where single, double and triple recirculation zones occur, together
with the boundary between steady and oscillatory flows. This diagram is reproduced in
Figure 1. The parameter values at which the flow has been simulated in this study are
also indicated in this figure. Escudier has made available photographs of the recircula-
tion zones and a number of these are reproduced here for comparison with the numerical
solutions. The reader should be aware that in the photographs of the experiment, radial
distances are reported to appear uniformly stretched by 8% due to refraction at the
various interfaces.
The following is a brief description of the basic flow features.
The fluid, which completely fills the cylindrical container, is initially at rest. At
t = 0, the bottom endwall is impulsively set to rotate at constant angular speed Q. An
Ekman boundary layer develops on the rotating disk with thickness of order (v/R 2 )°'0 .
This rotating boundary layer then acts as a centrifugal pump, sending fluid radially
outwards in a spiralling motion while 'sucking' fluid into it from above. This pumping
action of the boundary layer together with the presence of the cylindrical wall at r =
R sets up a secondary meridional circulation. The fluid pumped out of the Ekman
layer spirals up the cylindrical wall establishing a Stewart son-type boundary layer (see
Greenspan 1968). In time, fluid with angular momentum reaches the vicinity of the
stationary top endwall, where it is turned and advected towards the centre. It spirals
inwards creating a further boundary layer on the top endwall. On the endwall the fluid
separates at r = 0 and a concentrated central vortex is formed whose core size depends
on the depth of the boundary layer from which it emerged. The fluid then spirals down
this central vortex to be sucked back into the Ekman layer.
The experimental studies of this flow show that it undergoes a series of bifurcations
as the two governing parameters, Re and HIR, are varied. The present study focusses
on the development of the flow characteristics with Re and HIR up to the point where
the flow no longer reaches a steady state. In particular, in the region of parameter
space considered, i.e. Re < 3000 and Il/R < 3.5, the flow is observed experimentally toremain axisymmetric and laminar. atd for the most part to reach a steady state.
hFigur,' I suggests that the fl.,w chiract,,ristics depend critically on the Reynolds
number. The numerical solutions 'h-w. howe, --r, that the basic dyia nics -f the central
f
10
vortex are inertially driven and that viscous shears are negligible outside recirculation
zones, boundary layers and away from the meridional shear layer in the bottom half
of the cylinder which is caused by the strong turning at the corner r = R, z = 0. A
comparison of the 'streamline' contours, i.e. intersections of stream surfaces with the
meridional plane, and contours of the angular momentum F = rv, on the meridional
plane show that even at the relatively low value of Re = 1000 (see Figure 2a) F is
constant, to high order, on streamlines outside boundary layers. At this value of Re, the
curvature of the streamlines of the vortical fluid returning towards the lower rotating
endwall does not change sign and the secondary meridional flow consists of a simple
overturning motion. From the contour plots of the azimuthal vorticity (Figure 2a(iii)).
we find that 77 is positive in the boundary layer regions and negative in the interior
flow, consistent with a deceleration of the meridional flow in the boundary layers. Of
particular interest, one should note the small region of positive 7 just above the Ekman
layer about the axis of symmetry.
It is interesting to examine the effect of increasing Re for the case in which HIR =
2.5. At Re = 1600 a waviness is evident in the streamtubes of the central vortex as
well as in the contours of F (see Figure 2b). Comparing the F contours of the two cases
Re = 1000 and Re = 1600, it is clear that a greater proportion of the fluid's angular
momentum has been advected towards r = 0, in the upper boundary layer region.
leading to the formation of what appears to be a weak centrifugal wave in the higher
Re case. The contours of 7 at Re = 1600 (see Figure 2b(iii)) are qualitatively similar
to those at Re = 1000, but now the extrema in the values of the azimuthal vorticitv
have increased. The region of positive azimuthal vorticity in the interior of the flow is
extended considerably and roughly coincides with the region of 'wavy' streamtubes.
The above effects are further enhanced as Re is increased to 1800. Htere the stream-
tubes (Figure 2c) clearly indicate the presence of a centrifugal wave with two periods
and two bulges on the axis at approximately 1/3 and 2/3 of HIR. Note however that
the central vortex, i.s it emerges from the endwall boundary layer has streamtubes which
are almost parallel with a relatively large radial gradient, indicating the presence of a
relatively large axial velocity in this core flow.
An increase in Re to 1918 crosses the boundary between no 'breakdowns' and 1
- 2 'bre:ik, .ns' o:! Figure 1. The amplitude of the waves has inct,.ased and their
wavele:i ' .,'reascd (see Figure 2d). V,ith tihe increased amplitud,. and decreased
11
wavelength, the associated axial deceleration is large enough to cause the flow to stagnate
under the crest of the wave. Within this stagnant region is found a near spherical region
of recirculating fluid which is termed a vortex breakdown bubble, i.e. a toroidal vortex
centered on the axis of a columnar vortex. At this particular value of H/R there are
two breakdown bubbles, the downstream bubble being considerably smaller and the
recirculating flow within it slower than in the leading bubble.
For H/R < 1.95, both the experimental investigations of Escudier (1984) and our
numerical calculations only identify single breakdown bubbles and for H/R < 1.2, no
breakdown bubbles are found. Pao (1970) observed, in a related problem where the
cylinder wall also rotates at the same angular speed as the disk, that for HIR = 1.0 and
Re > 500 standing waves appear in the axial plane and reported a similar dependence on
Re for these waves as is found in this study. His experimental investigations include cases
up to Re = 8600 where the flow was reported to be steady, axisymmetric and laminar.
However, he did not find any recirculating breakdown bubbles in his low aspect ratio
(H/R = 1.0) container.
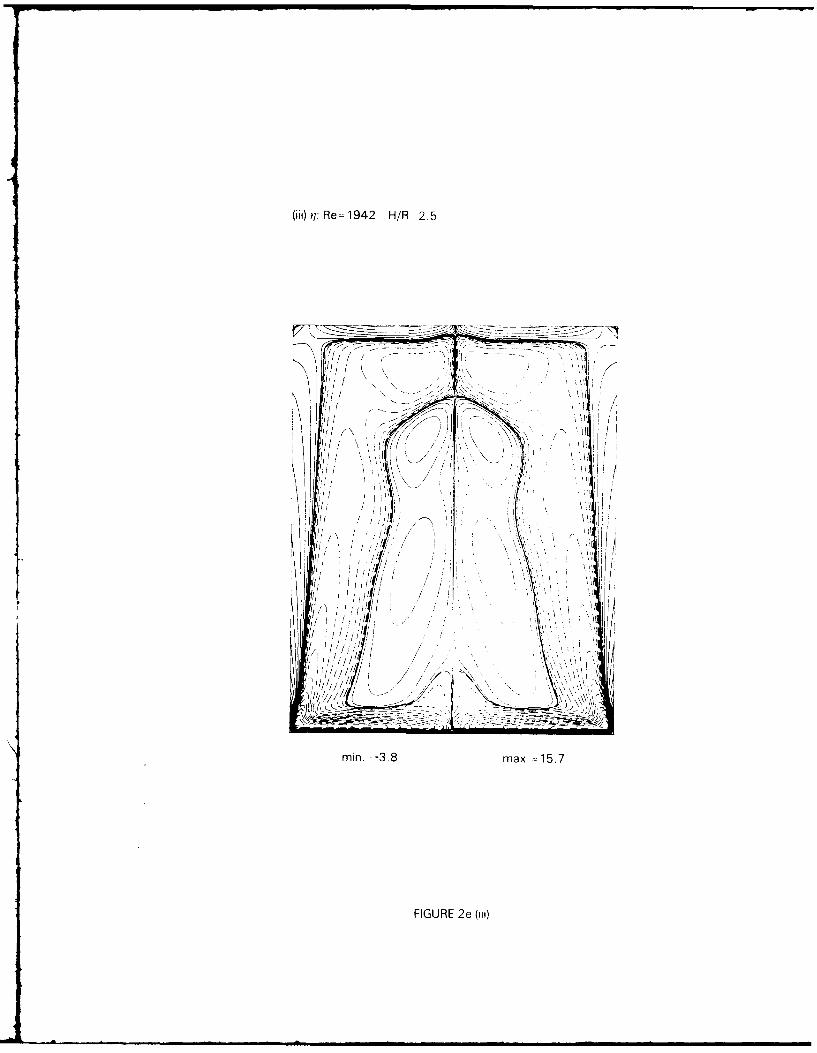
As Re is increased to 1942 (Figure 2e), 1996 (Figure 2f) and 2126 (Figure 2g), very
good agreement is found between the calculated stream surfaces and the observations of
Escudier (1984). Some of these experimental observations are included for comparison
with the numerical solutions in Figure 3.
Although the length of the recirculation bubbles has grown larger with the increases
in Re, the wavelength of the wavy disturbance on the outer streamtubes has been re-
duced. There remains a general trend that as Re is increased, the wavelength is reduced
and the wave amplitude increased. The increase in the bubble diameters with Re is
indicative of the increased wave amplitudes. The shortening of the wavelength is also
consistent with the behaviour of the recirculation bubbles. As Re is increased, the re-
gion of near parallel flow just after the vortex emerges from the boundary layer on the
stationary endwall is shortened. This leads to a migration of the leading bubble to-
wards this endwall. Note also that the distance between the two bubbles is progressively
reduced as Re is increased.
The distribution of 1' is particularly interesting. For fluid in the central vortex
that has emerged from the upper boundary layer, r is conserved on the streamtubes for
some axial distance over which the vortex remains concentrated. As the fluid spirals
downstream past the breakdown region, there is a change in the angular momentum.
12
When the fluid is first deflected radially outwards around the breakdown bubble, there is
an increase in r and when it is converged again around the downstream half of the bubble
it loses some of this gain in angular momentum. The gradients in azimuthal velocity
are large enough for the viscous stresses to effect these changes. Past the breakdown
regions, the angular momentum distribution then corresponds to essentially solid body
rotation of the fluid. In essence, in these flows, the breakdown region is like a transition
region from a concentrated vortical flow to solid body rotation.
The details of the flow structure in the recirculation bubble are of particular interest
in this study, even though their dynamical significance to the overall flow structure is
quite secondary. The main reason for this interest is that they provide an excellent
test for the accurracy of the numerical solutions. It is possible to obtain very good
flow visualizations of the breakdown bubbles and their structure, and correspondingly
of critical points and flow reversals. These features are much more demanding on a
numerical model than the relatively simple structure of the outer flow.
Comparing in detail the structure of the recirculation regions as determined nu-
merically and observed experimentally for Re = 2126 and HIR = 2.5 we find very
good agreement between the two. The structure of the upstream bubble is now clearly
interpreted with the aid of the numerical streamlines. The leading stagnation point is
well defined in the flow visualization, however the downstream stagnation point is not
as some dye finds its way into the bubble and some is swept past. Note that the leading
dye streak is very thin - this is also reflected in the calculated streamlines which are
very close together in the approach flow to the stagnation point. As the fluid passes
over the bubble at maximum diameter, the streamlin-'s indicate a local acceleration of
the meridional flow over the 'obstacle', i.e. bubble. As the fluid passes the bubble, it
converges back towards the axis, however the axial flow is now considerably slower than
it was in its approach to the leading stagnation point. This is seen in the increased
distance between the calculated streamlines as well as in the much broadened dyestreak.
The dye photograph of the leading bubble shows a thin well defined outer envelop with
a rather broad, diffuse inner core. This is matched by the computed streamlines where
they are contracted to the outer edge of the bubble and spread out within the interior.
As for the downstream bubble, a similar situation is found. This information is not
evident from the dye photograph since it appears that the dye is residing principally
between a narrow band of streamlines which envelop the bubble, with virtually no dye
13
inside the bubble. The computed streamlines indicate that the recirculating flow in the
downstream bubble is considerably slower than in the upstream bubble. Downstream
of the second bubble, the enveloping dyestreak is broad and is tapered as it approaches
the Ekman layer. This behaviour is mirrored in the computed streamlines and may be
interpreted as an axial acceleration of the flow, probably as a result of the boundary
layer suction.
This very close agreement between experimental observation and numerical calcula-
tion of the recirculation zones has not been achieved in every case, although in all cases
the agreement has been very good. The reason is because the structure of the recircula-
tion zones in the vicinity of parameter space where a recirculation zone just emerges is
critically dependent on the value of Re. For example, the small change in Re from 1918
to 1942 (1.2%) results in a 25% increase in the diameter of the leading bubble and a 300%
increase in the diameter of the second bubble, whereas the outer flow remains virtually
unchanged. Hence, a small percentage error in the estimate of Re can be responsible for
a significant difference between the observed structure of the recirculation bubbles and
their computed structure. Unfortunately, no uncertainty estimates on Re are available
for the experimental observations. Escudier reports, however, that the temperature of
the fluid was maintained at 25°C ± 0.1 0 C and the viscosity of the fluid varied by about
5% per 'C. Hence a possible uncertainty of 0.5% exists in the estimate of Re due to the
uncertainty in viscosity alone. For flows that are not so close to these critical parameter
regions, the structure of the recirculation bubbles is not so variable with Re and a much
closer agreement between the computations and the observations was found.
As the Reynolds number of the flow increases, the downstream bubble approaches
the tail end of the upstream bubble. Just beyond the value of Re at which the tail
stagnation point of the upstream bubble coincides with the leading stagnation point of
the downstream bubble, the flow bifurcates. This bifurcation leads to a flow in which
there are two stagnation points on the axis of symmetry defining the head and tail of the
recirculation zone which encloses two distinct zones. These two zones are connected by a
ring seen as two saddle-points either side of the axis of symmetry in the meridional plane.
In the case of Re - 2494, HIR - 2.5 (see Figure 2h), this flow pattern is steady. The
two critical streamlines, i.e. V --U enclosing the bubble and V - 1.609 x 10- defining
the saddle-points, are very close together around the outer envelope of the recirculation
bubble, whereas there is a considerable gap between them near the axis of symmetry.
14
This is also reflected in the dye photograph (see Figure 3b) where the dye depicting the
outer shell of the bubble is a thin well defined shell, while it is broad and diffuse in the
inner core. Also, in the vicinity of the saddle-points, the dye lines are confused and it is
difficult to resolve the flow from them.
When Re is increased to 2765, the computed flow is unsteady and its structure
oscillates between the structures typical of Re = 2126 and Re = 2494. Figure 2i shows
time-averages of o, r and q7. The development of this unsteadiness and its periodicity is
the subject of further study. Note, however, that the outline of the head of the upstream
recirculation zone and the outline of the internal downstream recirculation zone shown
in the 'snap-shot' of the experimental flow (Figure 3c, found by Escudier (1984) to be
steadily oscillating) are well represented by the time-averaged computed streamlines.
This suggests that the dye-lines of the unsteady flow retain some information about the
time history of the flow.
The flow develops into three distinct zones for Re > 2680 when H/R = 3.25 and
Re > 3000 for HIR = 3.5. In all cases considered, the two downstream recirculation
zones merge and result in a flow pattern similar to that described earlier for HIR = 2.5
and Re = 2494. The upstream breakdown region however remains separate and its flow
structure is as described for the upstream bubble when HIR = 2.5 and Re = 2126. The
numerical solutions for this triple breakdown did not reach steady state after t = 1000,
which corresponds to 20,000 time steps. In real time, this is equivalent to integrat-
ing the system of governing equations, from rest, for approximately 70 seconds for the
corresponding experimental values of Escudier (1984). The parameter values for which
these solutions were obtained are very near those delineating the unsteady flow regions
according to the stability diagram (Figure 1), where it was observed experimentally that
steady conditions are reached in a very long time, longer than 10's of seconds. Perhaps
if the integrations were carried out for longer times they would indeed reach steady
state. The oscillations for HIR = 3.25 are almost undetectable, consisting of oscilla-
tions of approximately 1% in the values of the streamfunction. The oscillations found
in the solutions for HIR = 3.5 were considerably larger, with the middle breakdown
zone oscillating most. The upstream breakdown bubble is close to steady state, and
the tail end of the downstream breakdown region is also varying very slowly. Figure 4
are time-averaged contours of v), F and qi for Re = 3061 and HIR = 3.5, which are to
be compared with Figure 5 which is a photograph of the flow for the same values of
I
15
the parameters. It is interesting to note Escudier's (1984) observation that the central
recirculation zones for the H/R = 3.5 cases never develop into well defined regions, and
this now appears to be due to these regions never quite reaching steady state.
16
5. Conclusion
A numerical solution of the axisymmetric Navier-Stokes equations has been ob-
taned and used to examine the vortex breakdown phenomenon which occurs at certain
values of the governing parameters for flows in an enclosed cylinder driven by a rotating
endwal. The accuracy of the numerical solutions has been established by varying the
grid resolution and satisfying an integral identity which exists for the flow. The numer-
ical solutions are compared extensively with available experimental results, particularly
dye-streak photographs of the flow, mostly at steady state. The extent of the agreement
between the numerical solutions and the experimental results is critically examined and
is found to be very good. Certain features which were not fully resolved by the ex-
periments have now been given plausible explanations from the numerical results. The
numerical solutions also provide a clear picture of the topology of the flow, especially of
the structure of the multiple breakdown zones.
In part II of this study, the numerical solutions are examined further and a physical
understanding of the vortex breakdown phenomenom is gained.
The scene is also set for future studies in the unsteady regime. Unsteady flows
are generally less amenable to study by flow visualization techniques as relationships
between unsteady pathlines, streamlines and streaklines are not straightforward. The
interpretation of streaklines from flow visualization results for example, requires more
care. For the time-dependent numerical model presented here, these distinctions are
more readily made and the interpretation of the flow characteristics more tractable.
However, in extending the present axisymmetric model into the unsteady regime the
assumption of axial symmetry is in question where there are no experimental results to
support it. It is not expected to be valid as the flows become increasingly oscillatory
and unstable as Re and HIR are increased.
f
17
REFERENCES
Arakawa, A. 1966 Computational design for long-term numerical integration of the equa-
tions of fluid motion: Two-dimensional incompressible flow. Part 1. J.
Comp. Phys. 1, 119-143.
Dijkstra, D. & van Heijst, G. J. F. 1983 The flow between two finite rotating disks
enclosed by a cylinder. .1. Fluid Mech. 128, 123-154.
Escudier, M. P. 1984 Observations of the flow produced in a cylindrical container by a
rotating endwall. Experiments in Fluids 2, 189-196.
Escudier, M. P. & Keller, J. J. 1983 Vortex breakdown : A two-stage transition. A GARD
CP-342.
Escudier, M. P. & Zehnder, N. 1982 Vortex flow regimes. J. Fluid Mech. 115, 105-121.
Faler, J. H. & Leibovich, S. 1978 An experimental map of the internal structure of a
vortex breakdown. J. Fluid Mech. 86, 313-335.
Greenspan, H. P. 1968 The theory of rotating fluids. (Cambridge Univ. Press).
Harvey, J. K. 1960 Analysis of the 'vortex breakdown' phenomenon, Part 2. Imp. Col-
lege, Aero. Dept. Rep. No. 103.
Lugt, H. J. & Abboud, M. 1987 Axiymmetric vortex breakdown with and without
temperature effects in a container with a rotating lid. J. Fluid Mech.
179, 179-200.
Lugt, H. J. & Haussling, H. J. 1973 Development of flow circulation in a rotating tank.
Acta Mechanica 18, 255-272.
Lugt, H. J. & Haussling, H. J. 1982 Axisymmetric vortex breakdQwn in rotating fluid
within a container. J. App. Mech. 49, 921-923.
Miller, M. J. & Pearce, R. P. 1974 A three-dimensional primitive equation model of
cumulonimbus convection. Quart. J. R. Met. Soc. 100, 133- 154.
Pao, H.-P. 1970 A numerical computation of a confined rotating flow. J. App. Mech.
37, 480-487.
Peckham, D. H. & Atkinson, S. 1957 Preliminary results of low speed wind tunnel tests
on a Gothic wing of aspect ratio 1.0. Aero. Res. Counc. CP-508.
Ronnenberg, B. 1977 Ein selbstjustierendes 3-KomponentenLaserdoppleranemometer
nach dem Vergleichsstrahlverfahren, angewandt fiir Untersuchungen in
einer stationiren zylindersymmetrischen Drehstr6mung mit einen Riick-
stromgebiet. Mo2-Planck-InsL. Bericht 20.
Sarpkaya, T. 1971 On stationary travelling vortex breakdown. J. Fluid Mech. 45,
545-592.
Sweet, R. A. 1974 A generalized cyclic reduction algorithm. SIAM J. Numner. Anal. 10,
506-520.
Vogel, H. U. 1968 Experimentelle Ergebnisse fiber die laminare Str6mung in einen
zylindrischen Gehiuse mit darin rotierender Scheibe. Max- Planck- Inst.
Bericht 6.
Williams, G. P. 1967 Thermal convection in a rotating fluid annulus: Part 1. The basic
TABLE 1: CHARACTERISTICS OF THE VORTICITY INTEGRAL (7) FOR SELECTED
CASES.
FIGURE 1: STABILITY BOUNDARIES FOR SINGLE, DOUBLE AND TRIPLEBREAKDOWNS, AND BOUNDARY BETWEEN STEADY AND OSCILLATORY FLOW,IN THE (Re, H/R) PLANE (EMPIRICALLY DETERMINED BY ESCUDIER (1984)). THELOCATIONS IN PARAMETER SPACE WHERE THE FLOW HAS BEEN SIMULATED AREINDICATED BY 0.
4+000
Re
- 3500i /! /
3000 -~p
/ - 3 Breakdowns
2500 /
I 2 Breakdowns /
2000 - ,
1 BreQkdown 01500 -0
0
1000 D rh1.0 1-5 2.0 2.5 3.0 H/R 3.5
FIGURE 1
FIGURE 2: CONTOURS OF (i) V, (ii) F AND (iii) i1 IN THE MERIDIONAL PLANE FOR H/R=2 5 AND Re AS INDICATED. THE CONTOUR LEVELS ARE NON-UNIFORMLY SPACED,WITH 20 POSITIVE AND 20 NEGATIVE LEVELS DETERMINED BY CONTOURLEVEL(i)= MAX(varable) x (i/20)3 AND CONTOURLEVEL(i) = MIN(variable) x (i/20)3
RESPECTIVELY. ALL ARE PLOTTED AT t = 1000 BY WHICH TIME STEADY STATEFLOW CONDITIONS HAVE BEEN REACHED, EXCEPT FOR (i) WHICH SHOWS THE TIMEAVERAGES OVER 750 < t < 1000 OF AN OSCILLATORY FLOW.
FIGURE 3: VISUALIZATIONS OF THE RECIRCULATION ZONES FOR H/R =2.5 AND ReAS INDICATED. *(a)AND(b) ARE REPORTED TO BE AT A STEADY STATE, WHILE (c) ISA SNAP-SHOT OF A STEADILY OSCILLATING FLOW.
3(a) Re= 21263(b) Re= 24943(c) Re= 2765
0 1 PHOTOGRAPHS OF K E PEFIMENTAL VISU.LIZ;7 :ON\ ARE REPRODLJ 'E D'ERNMISSION FROM I.. P i ;CUDIER.
FIGURE 3a
FIGURE 3b
/
FIGURE 3c
FIGURE 4: CONTOURS OF (i) V', (ii) F AND (iii) ?I IN THE MERIDIONAL PLANE FOR H/R=3.5 AND Re = 3061. THE CONTOUR LEVELS ARE NON-UNIFORMLY SPACED, WITH20 POSITIVE AND 20 NEGATIVE LEVELS DETERMINED BY CONTOURLEVEL(i) =
MAX(variable) x (i/20)3 AND CONTOURLEVEL(i) = MIN(variable) x (i/20)3
RESPECTIVELY. THE CONTOURS ARE OF TIME AVERAGES OVER 750 < t < 1000.
/"
(i) P: Re=3061 H/R=3.5
X
I ~iIi Il/I I til
fl II;1 1t l I i III11
lif I I II II 1 1 Ililt II Ii I 1ii
I I IIItIYllI II I I liii11 1 I IIII II I I III 11 1111 11itII11
IN I I I I1 1111 1 _ __I_ _I_ _ _ _ _ II_
mII, 5 6x 0 ImII II I iltI ItII
FIGUREl 4I I
(ii) F-: Re=3061 H/R=3.5
min.=O max. 1.0
FIGURE 4 (ii)
Io
FIGURE 5: VISUALIZATION OF THE RECIRCULATION ZONES FOR H/R = 3.5 ANDRe = 3061.
FIGURE 5
DISTRIBUTION
AUSTRALIA
Department of Defence
Defence CentralChief Defence ScientistAssist Chief Defence Scientist, Operations (shared copy)Assist Chief Defence Scientist, Policy (shared copy)Director, Departmental PublicationsCounsellor, Defence Science (London) (Doc Data Sheet Only)Counsellor, Defence Science (Washington) (Doc Data Sheet Only)S.A. to Thailand MRD (Doc Data Sheet Only)S.A. to DRC (Kuala Lumpur) (Doc Data Sheet Only)OIC TRS, Defence Central LibraryDocument Exchange Centre, DISB (18 copies)
Aeronautical Research LaboratoryDirectorLibrarySuperintendent - Aerodynamics and Aero PropulsionHead - Aerodynamics BranchDivisional File - Aerodynamics and Aero PropulsionAuthor: J.M. Lopez
Navy Offic,Navy Scientific Adviser (3 copies Doc Data Sheet)Director of Naval Aircraft Engineering (Doc Data Sheet Only)
Army OfficeScientific Adviser - Army (Doc Data sheet only)
Air Force OfficeAir Force Scientific AdviserDirector General Aircraft Engineering - Air Force
(Doc Data sheet only)
Department of Administrative ServicesBureau of Meteorology, Library
Statutory and State Authorities and IndustryAerospace Technologies Australia, Manager/Librarian (2 copies)Hawker de Havilland Aust Pty Ltd, Bankstown, LibraryCSIRO
Chief, Division of OceanographyChief, Division of Energy TechnologyChief, Division of Atmospheric Sciences
Universities and CollegesAdelaide
Barr Smith LibraryProfessor R.E. Luxton, Dept of Mechanical Engineering
FlindersLibrary
La TrobeLibrary
MelbourneEngineering LibraryProfessor P.N. Joubert, Department of Mechanical EngineeringProfessor A.E. Perry, Department of Mechanical Engineering
MonashHargrave LibraryProfessor W.H. Melbourne, Department of Civil EngineeringProfessor B.R. Morton, Department of Mathematics
NewcastleLibrary
New EnglandLibrary
SydneyEngineering LibraryProfessor G.A. Bird, Department of Aeronautical Engineering
NSWPhysical Sciences LibraryProfessor R.D. Archer, Department of Aeronautical EngineeringProfessor P.T. FinkLibrary, Australian Defence Force Academy
QueenslandLibraryProfessor R.J. Stalker, Department of Mechanical Engineering
Western AustraliaLibrary
RMITLibrary
CANADANRC
National Aeronautical EstablishmentMr G.F. Marsters (Director)
Universities and CollegesToronto
Institute for Aerospace Studies
FRANCEONERA, Library
GERMANYInstitute fur Stromungsmechanik der DFVLR, Professor H. Ludwieg
Cranfield Inst. of TechnologyLibraryProfessor J.L. Stollery
Imperial CollegeAeronautics LibraryProfessor P. BradshawProfessor J.T. Stuart
UNITED STATES OF AMERICANASA Scientific and Technical Information FacilityDirector NASA Langley, Mr R.H. Peterson
Director NASA Lewis, Dr T.M. KlinebergDirector NASA Ames, Dr W.F. Ballhaus, Jr.Boeing Company, LibraryUnited Technologies Corporation, LibraryLockheed-California CompanyLockheed Missiles and Space CompanyLockheed GeorgiaMcDonnell Aircraft Company, Library
McDonald Douglas Research Laboratory, Director
Universities and CollegesMassacbiiqetts Inst. of Technology
Professor M.T. Landahl
CALTECHProfessor P.G. Saff manProfessor H.G. HornungProfessor A. Roshko
A comparison between the experimental visualization and numericalsimulations of the occLrrence of vortex breakdown in laminar swirling flowsproduced by a rotating endwall is presented. The experimental visualizations ofl-scudier (Experiments in Fluids, 2, 1984) were the first to detect the presenceof mul'iple recirculation xones and the numerical model presented here,coosisting of a numerical solution of the unsteady axisym metric Navier-StokesLquations, faithfully reproduces these newly observed phenomena and all otherobserved characteristics of the flow. Part II of the paper examines theunderlying physics of these vortex flows.
PAGE CLASSIFICATICN
j TTNY.T A--Tptpnh
PRIVACY MAKING
THIS PAGE IS TO BE USED TO RECORD INFORmATION WHICH IS REQUIRED BY THE ESTABLISHMENT FOR
ITS OWN USE BUT WHICH WILL NOT BE AODEO TO THE DISTIS DATA UNLESS SPECIFICALLY REQUESTED.
16. ABSTRACT (CONT.)
i7. MPRINT
AERONAUTICAL RESEARCH LABORATORY, MELBOURNE
18. COC JXF'(Y SERIES AND N .OEER i9. CCST ODE .TYPE O REPORT AND PERIOD COVERED


![Contents€¦ · .063 Inch [1.59mm] O.D. VINL-063 CLMP-063 TFLN-063 or NYLN-063 NYCLMP-063.125 Inch [3.18mm] O.D. VINL-125 CLMP-125 TFLN-125 NYLN-125HW NYCLMP-125 NYCLMP-125HW Pipe](https://static.documents.pub/doc/80x56/6008af2d53ec7b6e9042b7c5/contents-063-inch-159mm-od-vinl-063-clmp-063-tfln-063-or-nyln-063-nyclmp-063125.jpg)


