Page 1
SIXTH ASSESSMENT REPORTWorking Group I – The Physical Science Basis
9 August 2021
#ClimateReport #IPCC
SIXTH ASSESSMENT REPORTWorking Group I – The Physical Science Basis
28th October 2021
Chapter 8: Water Cycle Changes
Richard Allan (LA)
University of Reading/National Centre for Earth Observation
University of Oslo joint seminar in atmospheric,
ocean and climate science, October 28th 2021
Chapter 8:
16 authors (~50 contributing authors)
1915 scientific publications assessed
4769 review comments addressed
Page 2
SIXTH ASSESSMENT REPORTWorking Group I – The Physical Science Basis
Page 3
SIXTH ASSESSMENT REPORTWorking Group I – The Physical Science Basis
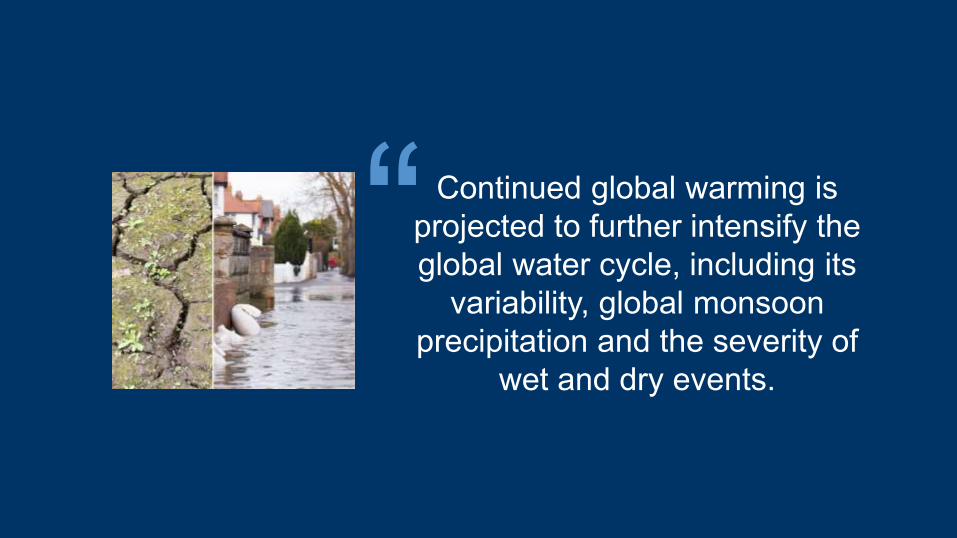
“ Continued global warming is
projected to further intensify the
global water cycle, including its
variability, global monsoon
precipitation and the severity of
wet and dry events.
Page 4
SIXTH ASSESSMENT REPORTWorking Group I – The Physical Science Basis
Why should we expect
water cycle changes?
Page 5
SIXTH ASSESSMENT REPORTWorking Group I – The Physical Science Basis
Douville et al. (2021) IPCC, Ch 8 (Fig. 8.1b; Fig. 8.3a).
See also Allan et al. (2020) NYAS; Abbott et al. (2018) Nature Geosci
Global water cycle and energy budget
Page 6
SIXTH ASSESSMENT REPORTWorking Group I – The Physical Science Basis
6
• …global mean precipitation and evaporation increase with global warming, but the
estimated rate is model-dependent (very likely range of 1–3% per 1°C)…
determined by a robust response to global mean surface air temperature (very
likely 2–3% per 1°C)… partly offset by fast atmospheric adjustments to
atmospheric heating by GHGs and aerosols.
• …anthropogenic aerosols… reduce global precipitation and alter large-scale
atmospheric circulation patterns through their well-understood surface radiative
cooling effect (high confidence). Fig. 8.3; 8.2.1; 8.2.2.2; Box8.1
• Lots of papers by Bjørn Samset, Gunnar Myhre & Øivind Hodnebrog to assess!!
See also Allan et al. (2020) NYAS and just published Yeh et al. (2021) npj Clim Atmos Sci
Page 7
SIXTH ASSESSMENT REPORTWorking Group I – The Physical Science Basis
- Increased moisture transport from
evaporative oceans to high precipitation
regions of the atmospheric circulation will
drive amplified P-E and salinity patterns
over the ocean (high confidence) while
more complex regional changes are
expected over land
- Greater warming over land than ocean
alters atmospheric circulation patterns and
on average reduces continental near-
surface relative humidity which along with
vegetation feedbacks can contribute to
regional decreases in precipitation (high
confidence). {8.2.1; 8.2.2.1}
Intensification of global water cycle
Figure 8.5:
Page 8
SIXTH ASSESSMENT REPORTWorking Group I – The Physical Science Basis
Precipitation mean and extremes• An increase in near-surface
atmospheric water holding
capacity of about 7% per 1°C
of warming explains a similar
magnitude of intensification of
heavy precipitation events
(from sub-daily up to seasonal
time scales) that increases the
severity of flood hazards when
these extremes occur (high
confidence). {8.2.3.2}
Fig. 8.4 – see also FAQ8.2 & Chapter 11!
Page 9
SIXTH ASSESSMENT REPORTWorking Group I – The Physical Science Basis
Will floods become more
severe or more frequent as a
result of climate change?
• Warming drives intensification of
heavy rainfall events and
associated flooding {8.2.3.2}
• Modulated by changes in
atmospheric circulation
• Response also determined by
catchment characteristics
• Ice/snow cover
• Soil moisture
• Human water use and land
use/cover change
• Compound effects (e.g. sea
level rise/heavy precipitation) FAQ 8.2 Figure 1
Page 10
SIXTH ASSESSMENT REPORTWorking Group I – The Physical Science Basis
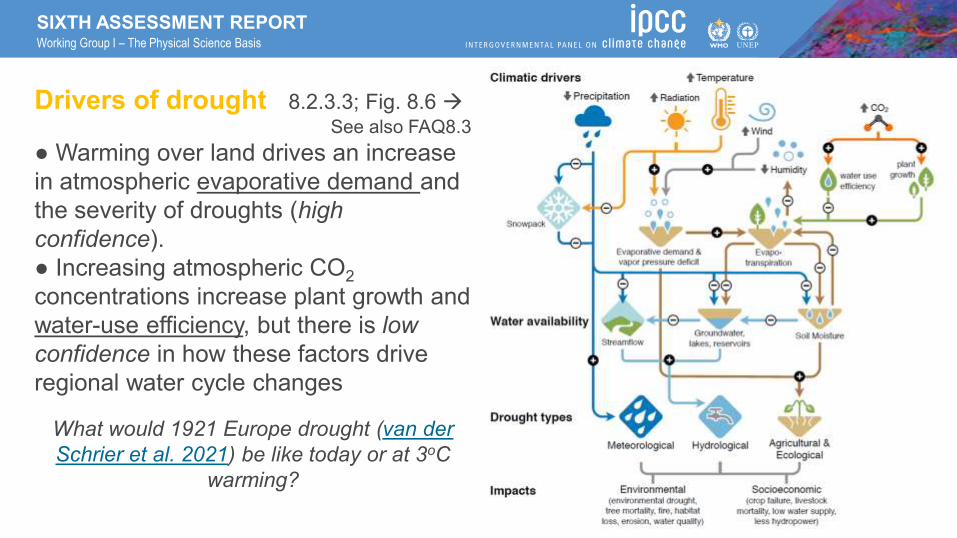
Drivers of drought 8.2.3.3; Fig. 8.6 →See also FAQ8.3
● Warming over land drives an increase
in atmospheric evaporative demand and
the severity of droughts (high
confidence).
● Increasing atmospheric CO2
concentrations increase plant growth and
water-use efficiency, but there is low
confidence in how these factors drive
regional water cycle changes
What would 1921 Europe drought (van der
Schrier et al. 2021) be like today or at 3oC
warming?
Page 11
SIXTH ASSESSMENT REPORTWorking Group I – The Physical Science Basis
SIXTH ASSESSMENT REPORT
CIRCULATION CHANGES
Circulation changes and the water cycle
The severity of very wet & very dry climate events
increases in a warming climate (high confidence)
but changes in atmospheric circulation patterns
alter where/how often these extremes occur with
substantial regional & seasonal contrasts.
• Poleward expansion in Southern Hemisphere
storm tracks (medium confidence)
• Weakening of tropical circulations (medium
confidence)
• Narrowing and strengthening of ITCZ core
(medium confidence)
• High confidence of thermodynamic
strengthening of moisture transport into
monsoons and storms
• Emerging evidence on regional ITCZ shiftsFig. 8.21
Page 12
SIXTH ASSESSMENT REPORTWorking Group I – The Physical Science Basis
SIXTH ASSESSMENT REPORT
• Land use change and water extraction for irrigation drive
local, regional and remote responses in the water cycle
(high confidence).
• Large-scale deforestation likely to decrease precipitation
over deforested regions; low confidence in effects of
limited deforestation.
• Deforestation drives increased streamflow relative to the
responses caused by climate change (medium confidence)
• Urbanisation can increase local precipitation (medium
confidence) and resulting runoff intensity (high confidence)
• A warming climate combined with direct human demand
for water is expected to deplete ground water resources in
dry regions (high confidence). {8.2.3.4, 8.3.1.7, 8.4.1.7, FAQ8.1} see also SRCCL
Direct human influence on water cycle changes
Page 13
SIXTH ASSESSMENT REPORTWorking Group I – The Physical Science Basis
How is the water cycle
changing and why?
Page 14
SIXTH ASSESSMENT REPORTWorking Group I – The Physical Science Basis
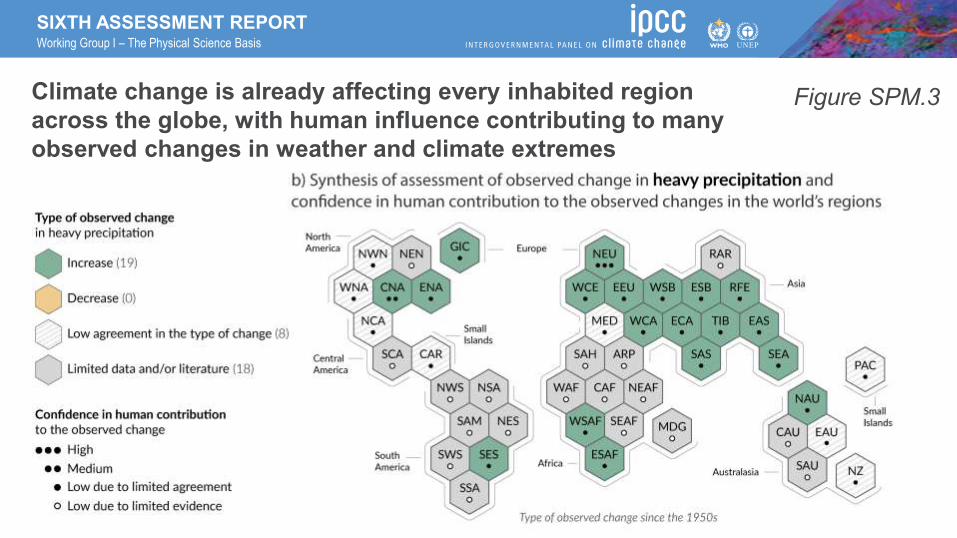
Figure SPM.3 Climate change is already affecting every inhabited region
across the globe, with human influence contributing to many
observed changes in weather and climate extremes
Page 15
SIXTH ASSESSMENT REPORTWorking Group I – The Physical Science Basis
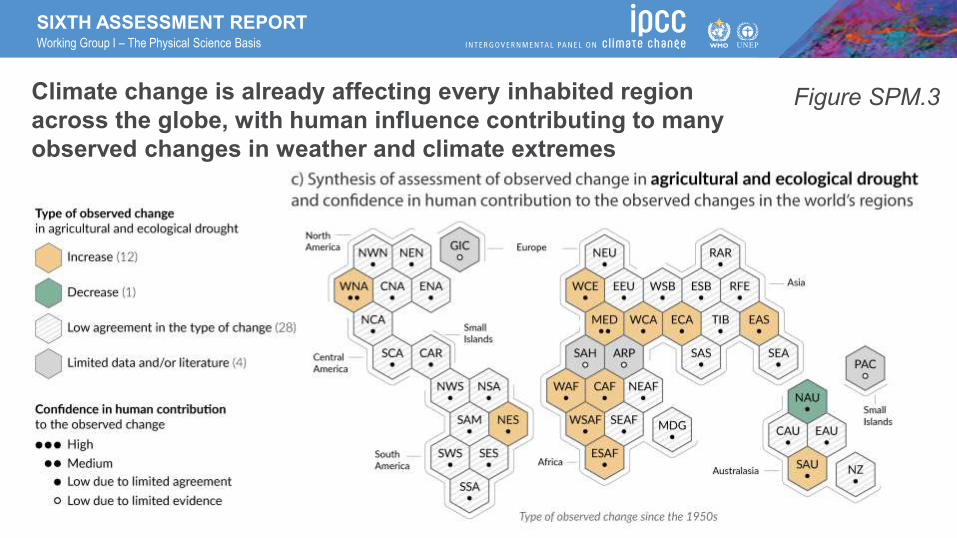
Figure SPM.3 Climate change is already affecting every inhabited region
across the globe, with human influence contributing to many
observed changes in weather and climate extremes
Page 16
SIXTH ASSESSMENT REPORTWorking Group I – The Physical Science Basis
Drivers of
freshwater
availability
• Internal variability
• Direct human
impact
• Climate change
Fig. 8.10: Rodell et al.
(2018) Nature→
Page 17
SIXTH ASSESSMENT REPORTWorking Group I – The Physical Science Basis
Detection & attribution of
water cycle change
• GHG forcing has increased contrasts in
precipitation amounts between wet &
dry seasons/weather regimes over
tropical land areas (medium
confidence) with detectable
precipitation increase in northern high
latitudes (high confidence).
• + drying in dry summer climates, e.g.
Mediterranean, southwestern Australia,
southwestern South America, South
Africa, and western North America
(medium to high confidence).
Figure 8.7
Page 18
SIXTH ASSESSMENT REPORTWorking Group I – The Physical Science Basis
Aridity fingerprint of
GHGs & aerosols
• Contrasting effects of GHGs
and aerosols on precipitation
and aridity
• anthropogenic factors have
influenced global trends in
aridity, mainly through
competing changes in
evapotranspiration… due to
anthropogenic emissions of
GHG and aerosols (very likely)
Figure 8.9 – based on Bonfils et al. (2020) Nature Clim.
Page 19
SIXTH ASSESSMENT REPORTWorking Group I – The Physical Science Basis
Aerosol & Water Cycle Changes
• Shifts in the tropical rain belt are associated with the
inter-hemispheric temperature response to the time-
evolving radiative influence of anthropogenic
aerosols & ongoing warming influence of GHGs
• Cooling in the Northern Hemisphere by sulphate
aerosols explained a southward shift in the tropical
rain belt and contributed to the Sahel drought from
the 1970s to the 1980s (high confidence),
subsequent recovery from which has been linked
with GHG warming (medium confidence).
8.2.2.2; 8.3.1.3; 8.3.2.4; Box 8.1 Figure 1 →
Page 20
SIXTH ASSESSMENT REPORTWorking Group I – The Physical Science Basis
Drivers of monsoon
precipitation changes
• Observed changes in regional
monsoon precipitation, especially
over South Asia, East Asia and
West Africa, have been limited over
much of the 20th century due to
increases driven by warming from
GHGs being counteracted by
decreases due to cooling from
anthropogenic aerosols (high
confidence).
Figure 8.11 →
GHG
AER
Page 21
SIXTH ASSESSMENT REPORTWorking Group I – The Physical Science Basis
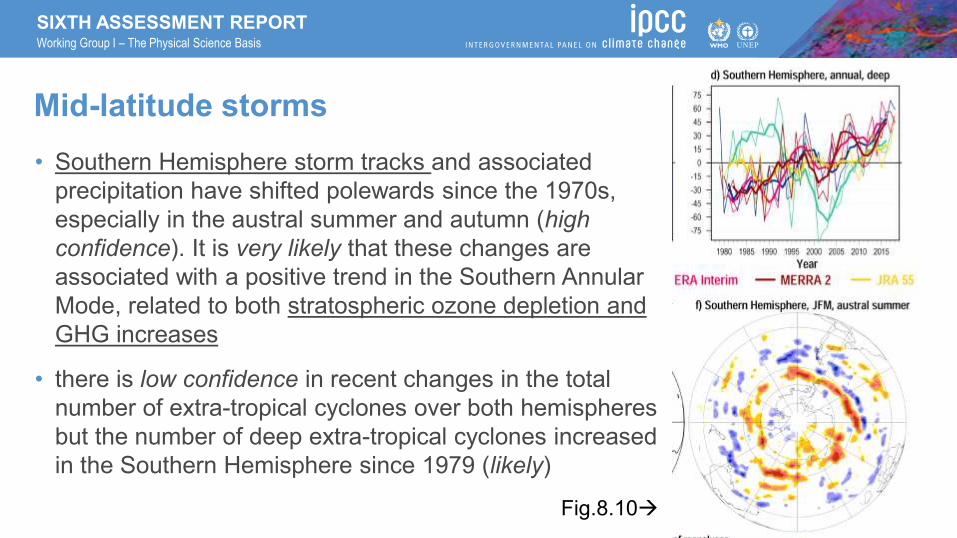
Mid-latitude storms
• Southern Hemisphere storm tracks and associated
precipitation have shifted polewards since the 1970s,
especially in the austral summer and autumn (high
confidence). It is very likely that these changes are
associated with a positive trend in the Southern Annular
Mode, related to both stratospheric ozone depletion and
GHG increases
• there is low confidence in recent changes in the total
number of extra-tropical cyclones over both hemispheres
but the number of deep extra-tropical cyclones increased
in the Southern Hemisphere since 1979 (likely)
Fig.8.10→
Page 22
SIXTH ASSESSMENT REPORTWorking Group I – The Physical Science Basis
What are the projected
water cycle changes?
Page 23
SIXTH ASSESSMENT REPORTWorking Group I – The Physical Science Basis
With every increment of global warming, changes get larger in
regional mean temperature, precipitation and soil moisture
Figure SPM.5
Page 24
SIXTH ASSESSMENT REPORTWorking Group I – The Physical Science Basis
With every increment of global warming, changes get larger in
regional mean temperature, precipitation and soil moisture
Figure SPM.5
Page 25
SIXTH ASSESSMENT REPORTWorking Group I – The Physical Science Basis
• precipitation is projected to
increase over high latitudes,
the equatorial Pacific and
parts of the monsoon
regions, but decrease over
parts of the subtropics and
limited areas in the tropics
in SSP2-4.5, SSP3-7.0 and
SSP5-8.5 (very likely).
• precipitation decreases over
Mediterranean, southern
Africa, Amazonia, Central
America, southwestern
South America,
southwestern Australia and
coastal West Africa
Regional Projections
Figure 8.14
Page 26
SIXTH ASSESSMENT REPORTWorking Group I – The Physical Science Basis
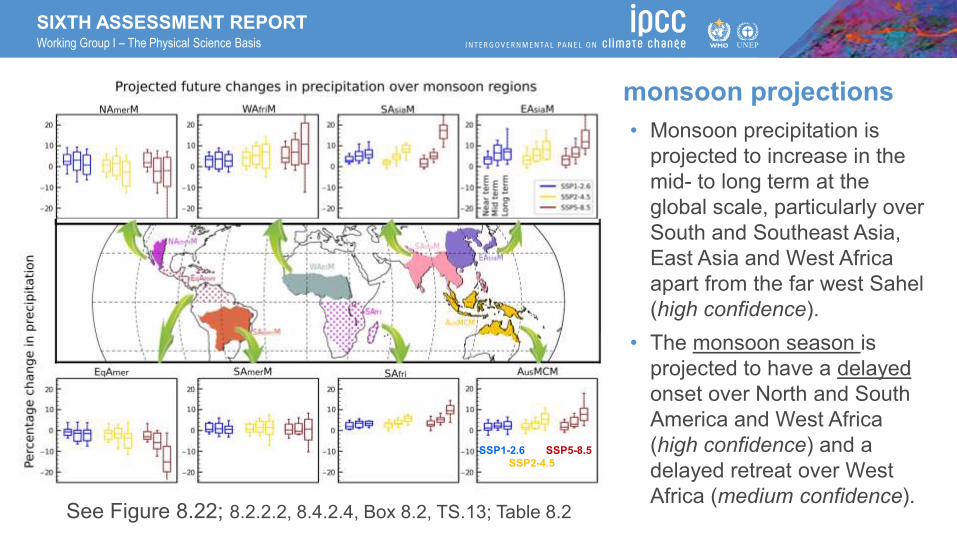
monsoon projections
• Monsoon precipitation is
projected to increase in the
mid- to long term at the
global scale, particularly over
South and Southeast Asia,
East Asia and West Africa
apart from the far west Sahel
(high confidence).
• The monsoon season is
projected to have a delayed
onset over North and South
America and West Africa
(high confidence) and a
delayed retreat over West
Africa (medium confidence).See Figure 8.22; 8.2.2.2, 8.4.2.4, Box 8.2, TS.13; Table 8.2
SSP1-2.6 SSP5-8.5
SSP2-4.5
Page 27
SIXTH ASSESSMENT REPORTWorking Group I – The Physical Science Basis
• Projected increases in
precipitation… will be
associated with increased runoff
in the northern high latitudes
(high confidence).
• Runoff from small glaciers will
typically decrease through loss
of ice mass, while runoff from
large glaciers is likely to
increase with increasing global
warming until glacier mass
becomes depleted (high
confidence). [see SROCC]
• CMIP6: increased evaporation,
decreased soil moisture →
• Box TS.6 Fig. 1 →SSP2-4.5 (2081-2100 minus 1995-2014)
Page 28
SIXTH ASSESSMENT REPORTWorking Group I – The Physical Science Basis
Aridity changes in context of
paleo climate record
Figure 8.20, future: RCP8.5
• In the Mediterranean, south western
South America & western North America,
future aridification will far exceed the
magnitude of change seen in the last
millennium (high confidence).
• Some tropical regions are also projected
to experience increased aridity, including
the Amazon basin and Central America
(high confidence).
Page 29
SIXTH ASSESSMENT REPORTWorking Group I – The Physical Science Basis
Increased water cycle variability
See Box 8.2; Figure TS.12 →
• Precipitation and surface water flows are
projected to become more variable over
most land regions within seasons (high
confidence) and from year to year (medium
confidence), especially in the tropics.
• The seasonality of precipitation, water
availability and streamflow will increase with
global warming over the Amazon (medium
confidence) and in the subtropics,
especially in the Mediterranean and
southern Africa (high confidence).
tropical land
extratropical land
Page 30
SIXTH ASSESSMENT REPORTWorking Group I – The Physical Science Basis
What are the limits to
projecting water cycle
changes?
Page 31
SIXTH ASSESSMENT REPORTWorking Group I – The Physical Science Basis
31
2021-2040 2081-2100Limits to projections: uncertainty due to
internal variability – model – scenario
• model response uncertainty is
substantial and can exceed scenario
uncertainty (Fig. 8.23 →)
• Natural climate variability will continue to
be a major source of uncertainty in near-
term (2021–2040) water cycle
projections (high confidence).
• Climate change studies benefit from
sampling the full distribution of model
outputs when considering future
projections at regional scales. % uncertainty in 20 year
mean precipitation change
near term long term
Page 32
SIXTH ASSESSMENT REPORTWorking Group I – The Physical Science Basis
32
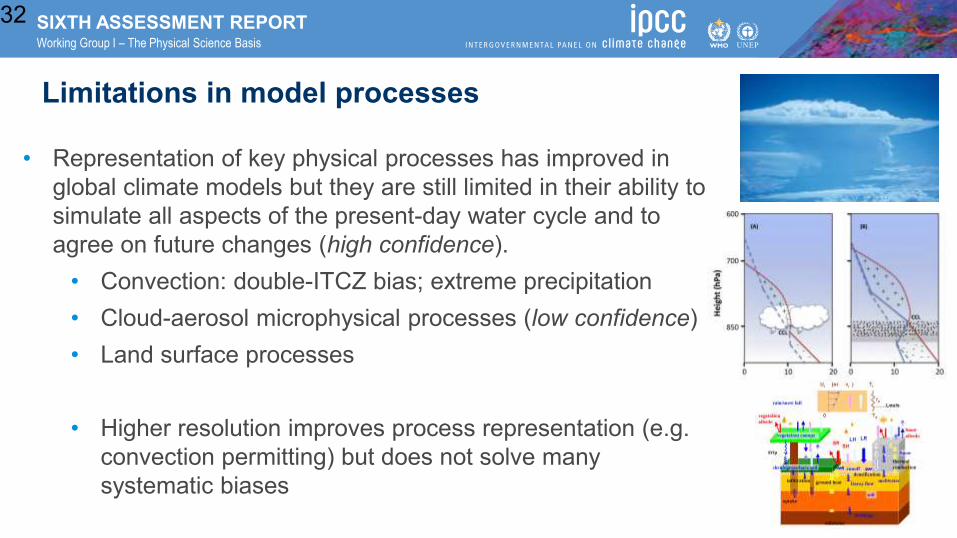
• Representation of key physical processes has improved in
global climate models but they are still limited in their ability to
simulate all aspects of the present-day water cycle and to
agree on future changes (high confidence).
• Convection: double-ITCZ bias; extreme precipitation
• Cloud-aerosol microphysical processes (low confidence)
• Land surface processes
• Higher resolution improves process representation (e.g.
convection permitting) but does not solve many
systematic biases
Limitations in model processes
Page 33
SIXTH ASSESSMENT REPORTWorking Group I – The Physical Science Basis
• Continued global warming will further amplify
GHG-induced changes in large-scale
atmospheric circulation/precipitation patterns
(high confidence), but in some cases
regional water cycle changes are not linearly
related to global warming.
• Water resources fed by melting glaciers are
particularly exposed to nonlinear responses
(high confidence).
• The occurrence of volcanic eruptions (either
single large events or clustered smaller
ones) can alter the water cycle for several
years, decreasing global mean land
precipitation and altering monsoon circulation
(high confidence).
SSP1-2.6 SSP3-4.5 SSP5-8.5
Page 34
SIXTH ASSESSMENT REPORTWorking Group I – The Physical Science Basis
What is the potential
for abrupt change?
Page 35
SIXTH ASSESSMENT REPORTWorking Group I – The Physical Science Basis
Abrupt and non-linear water cycle changes
• Positive land-surface feedbacks, including vegetation/dust,
can contribute to abrupt changes in aridity, but there is low
confidence such changes will occur during 21st century.
• Continued Amazon deforestation, combined with a warming
climate, raises probability this ecosystem will cross a tipping
point into a dry state during 21st century (low confidence).
• It is very likely that abrupt water cycle changes will occur if
Solar Radiation Management (SRM) techniques are
implemented rapidly or terminated abruptly. The impact of
SRM… will not fully mitigate GHG-forced water cycle
changes (medium confidence) and can affect different
regions in potentially disruptive ways (low confidence).
{8.2.3.4, 8.6.1, 8.6.2, 8.6.3; FAQ 8.3}
Page 36
SIXTH ASSESSMENT REPORTWorking Group I – The Physical Science Basis
SIXTH ASSESSMENT REPORT
• The paleoclimate record shows a collapse in the Atlantic Meridional Overturning
Circulation (AMOC) causes abrupt shifts in the water cycle (high confidence),
such as a southward shift in the tropical rain belt, weakening of the African and
Asian monsoons and strengthening of Southern Hemisphere monsoons.
• There is medium confidence that AMOC will not collapse before 2100, but should
it collapse, it is very likely that there would be abrupt changes in the water cycle.
Page 37
SIXTH ASSESSMENT REPORTWorking Group I – The Physical Science Basis
SIXTH ASSESSMENT REPORT
Some Conclusions“…widespread, non-uniform human-caused alterations of the water cycle, which have
been obscured by a competition between different drivers across the 20th century that will
be increasingly dominated by greenhouse gas (GHG) forcing…”
(i) Warming is intensifying the water cycle, making very wet and
very dry events and seasons more severe when they occur
(ii) Aerosol cooling has masked greenhouse gas warming
effects on precipitation, particularly regional responses
(iii) There is a growing substantial direct human impact on the
water cycle through irrigation, deforestation & urbanisation
(iv) Regional monsoons are projected to intensify particularly in
South and Southeast Asia, East Asia & West Africa with delays
affecting North & South America & West Africa
(v) Water cycle variability including precipitation and surface
water flows are projected to increase over most land regions.