Mar 17, 2022 Dr.Bokkasam Sasidhar 1 Project Management • An interrelated set of activities with definite starting and ending points, which results in a unique outcome for a specific allocation of resources. Steps in planning projects – 1.Define work breakdown structure (statement of all work that has to be completed) 2.Diagram the network 3.Develop the schedule 4.Analyze cost-time trade-off 5.Assert risks
Transcript
Apr 18, 2023 Dr.Bokkasam Sasidhar 1
Project Management• An interrelated set of activities with definite
starting and ending points, which results in a unique outcome for a specific allocation of resources.
Steps in planning projects –
1. Define work breakdown structure (statement of all work that has to be completed)
2. Diagram the network
3. Develop the schedule
4. Analyze cost-time trade-off
5. Assert risks
Apr 18, 2023 Dr.Bokkasam Sasidhar 2
NETWORK ANALYSIS
• It is a technique for planning and controlling large projects, such as construction work, R&D projects, computerization of systems etc. Its primary aim is to program and monitor the progress of a project so that the project is completed in the minimum time. In doing this, it pinpoints the parts of the project which are “crucial”.It can also be used in allocating resources such as labour and equipment and thus helps to make the total cost of a project minimum.
Apr 18, 2023 Dr.Bokkasam Sasidhar 3
CPM AND PERT
• Network analysis is operated in various forms under different titles, which include:
Critical Path Analysis (CPA) or
Critical Path Method (CPM);
(Deterministic)Project Evaluation and Review Technique
(PERT) (Probabilistic)
Apr 18, 2023 Dr.Bokkasam Sasidhar 4
Drawing the network diagram
• Estimate the time needed to complete each individual activity or task that makes up a part of the project
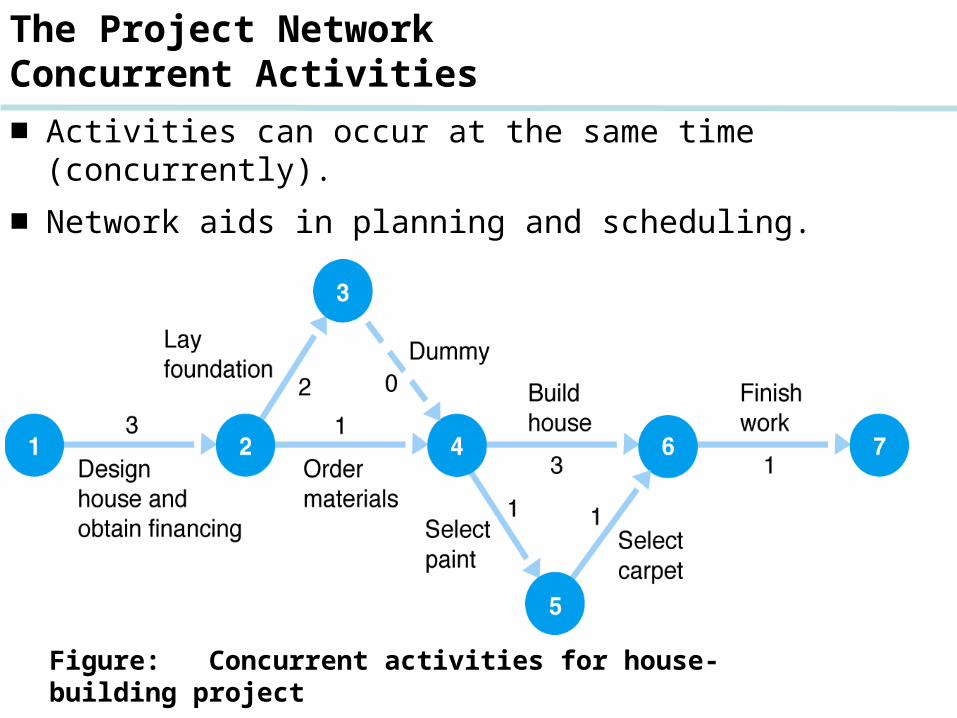
• Sort out what activities must be done one after another, and which can be done at the same time, if required
• Represent these in a network diagram
Apr 18, 2023 Dr.Bokkasam Sasidhar 5
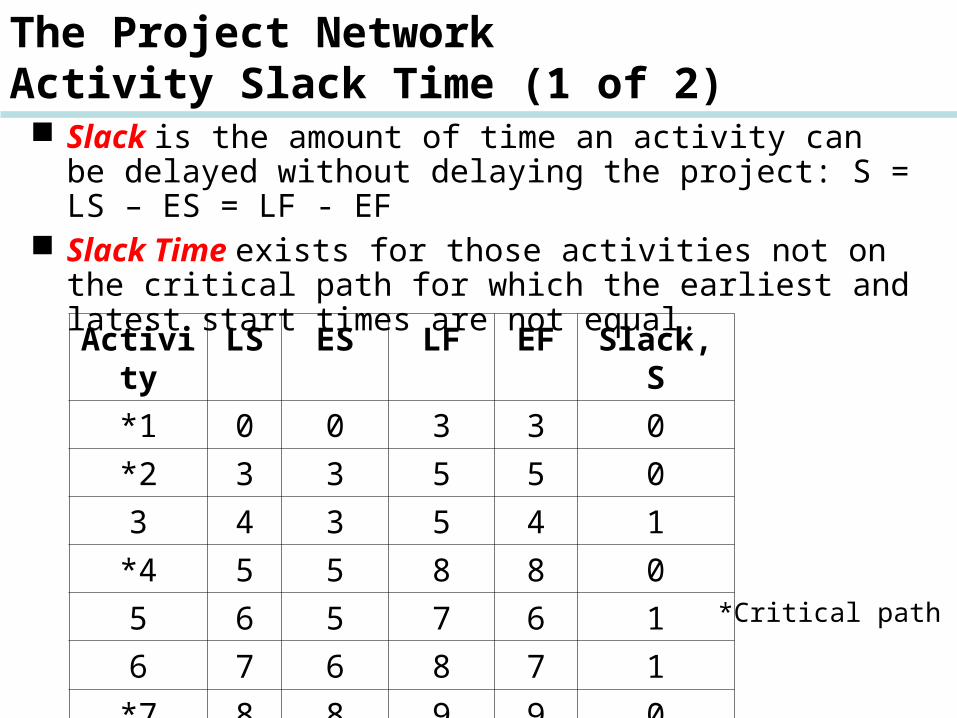
■ A branch reflects an activity of a project.
■ A node represents the beginning and end of activities, referred to as events.
■ Branches in the network indicate precedence relationships.
■ When an activity is completed at a node, it has been realized.
The Project Network - CPM/PERTActivity-on-Arc (AOA) Network
The Project NetworkHouse Building Project DataNumber Activity Predecessor Duration
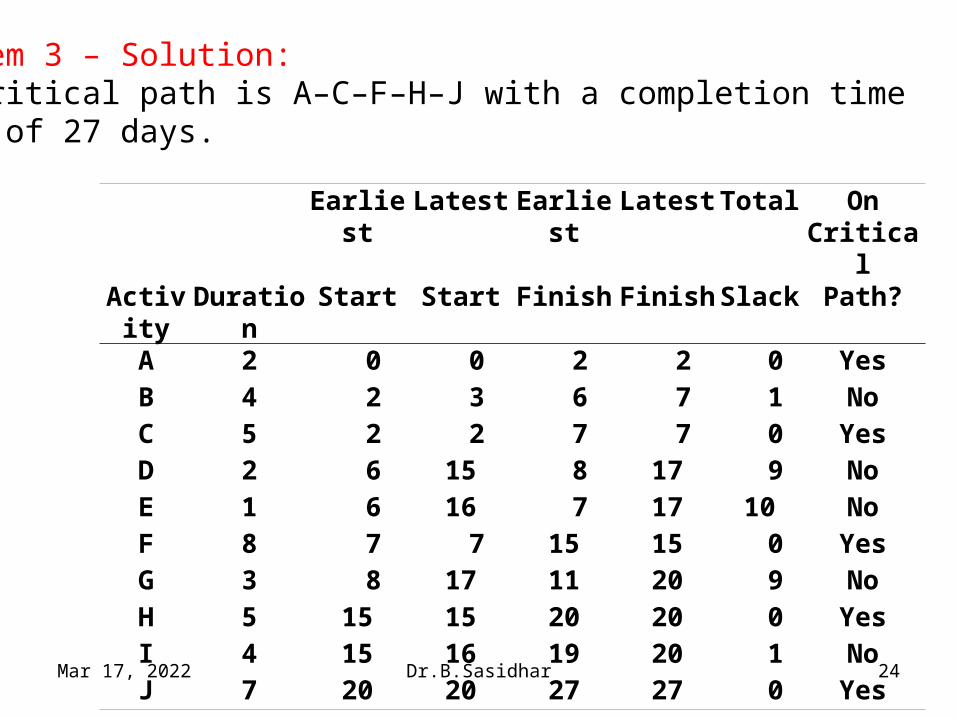
Problem 3 – Solution:The critical path is A–C–F–H–J with a completion time of 27 days.
■Activity time estimates usually cannot be made with certainty.
■PERT used for probabilistic activity times.
■In PERT, three time estimates are used: most likely time (m), the optimistic time (a), and the pessimistic time (b); using Beta Distribution.
■These provide an estimate of the mean and variance of a beta distribution:
variance:
mean (expected time): a 4m bt 6
2b - a6
v
Probabilistic Activity Times
Apr 18, 2023 Dr.Bokkasam Sasidhar 25
Probabilistic Probabilistic Time EstimatesTime Estimates
MeanMeanmmaa bb TimeTime
Pro
babi
lity
Pro
babi
lity
Beta Distribution
PessimisticOptimistic
Probabilistic Activity TimesAnother Example
Apr 18, 2023 Dr.Bokkasam Sasidhar 27
To demonstrate the use of probabilistic activity times, we will employ a new example. (We could use the house-building network from the previous section; however, a network that is a little larger and morecomplex will provide more experience with different types of projects.)
Probabilistic Activity Times - Another Example
Apr 18, 2023 Dr.Bokkasam Sasidhar 28
The Southern Textile Company has decided to install a new computerized order processing system that will link the company with customers and suppliers online. In the past, orders for the cloth the company produces were processed manually, which contributed to delays in delivering orders and resulted in lost sales. The company wants to know how long it will take to install the new system.We will briefly describe the activities and the network for the installation of the new order processing system.
The Southern Textile Company - Activities
Apr 18, 2023 Dr.Bokkasam Sasidhar 29
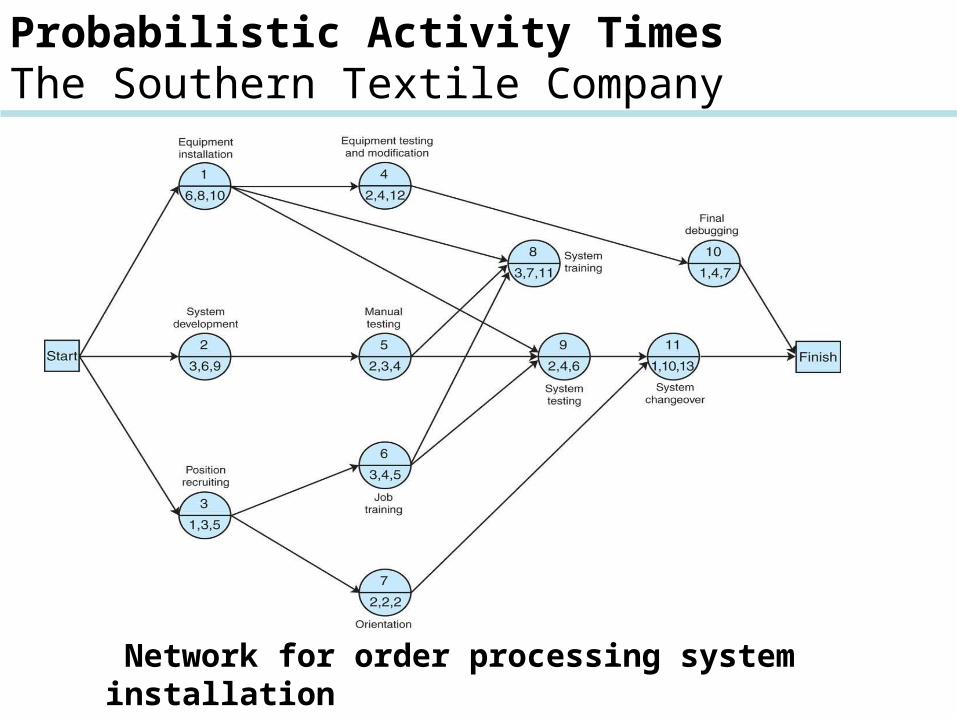
The network begins with three concurrent activities: The new computer equipment is installed (activity 1); the computerized order processing system is developed (activity 2); and people are recruited to operate the system (activity 3). Once people are hired, they are trained for the job (activity 6), and other personnel in the company, such as marketing, accounting, and production personnel, are introduced to the new system (activity 7). Once the system is developed (activity 2), it is tested manually to make sure that it is logical (activity 5). Following activity 1, the new equipment is tested, and any necessary modifications are made (activity 4), and the newly trained personnel begin training on the computerized system (activity 8). Also, node 9 begins the testing of the system on the computer to check for errors (activity 9). The final activities include a trial run and changeover to the system (activity 11) and final debugging of the computer system (activity 10).
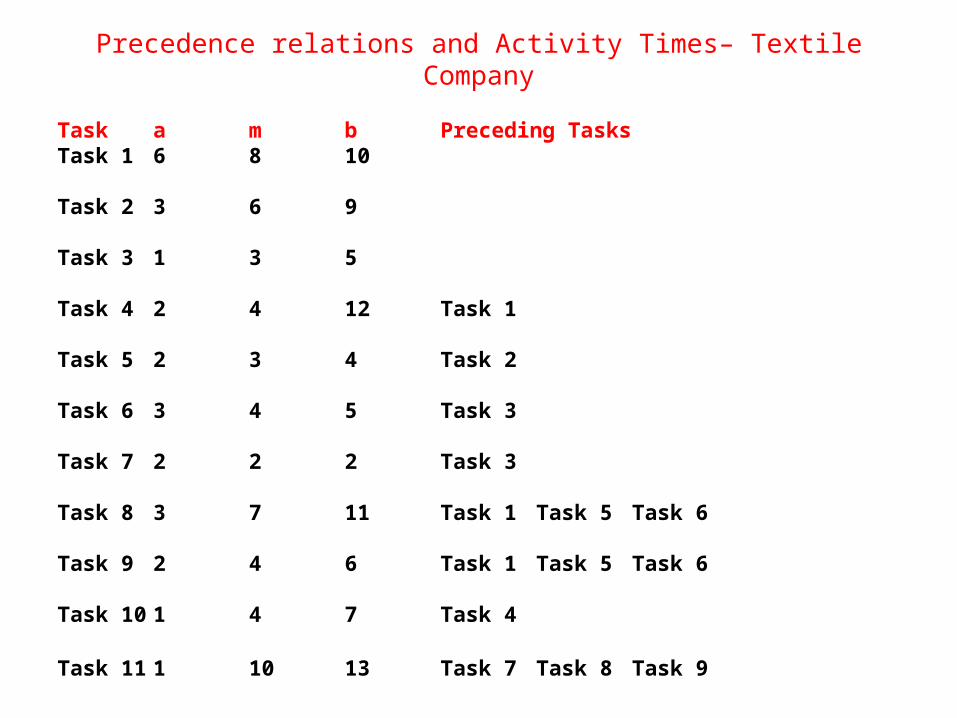
Precedence relations and Activity Times– Textile Company
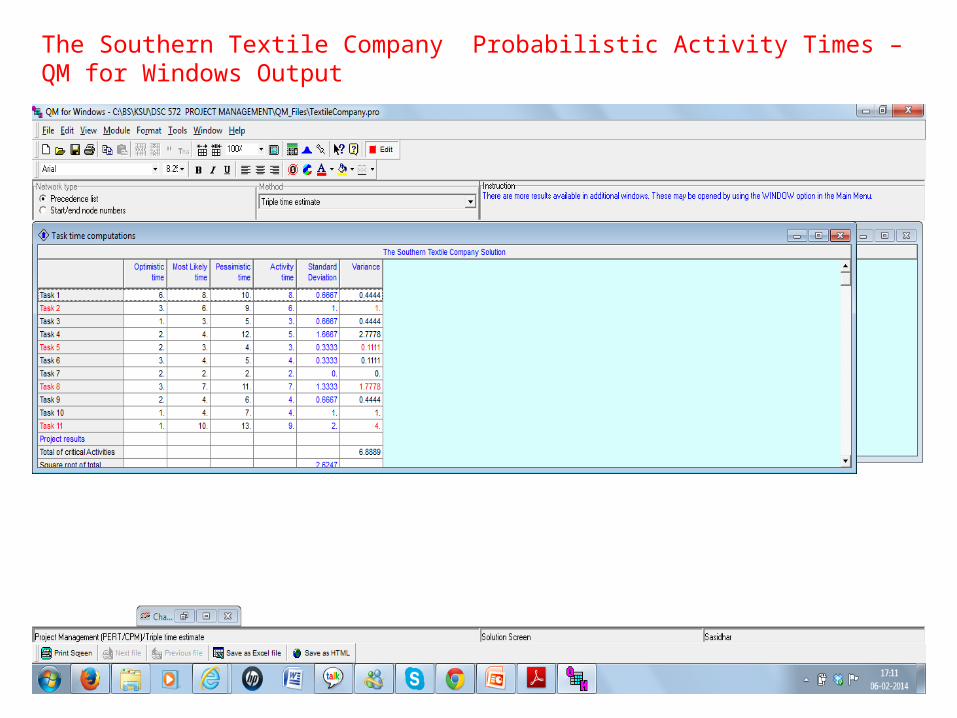
Task a m b Preceding TasksTask 1 6 8 10
Task 2 3 6 9
Task 3 1 3 5
Task 4 2 4 12 Task 1
Task 5 2 3 4 Task 2
Task 6 3 4 5 Task 3
Task 7 2 2 2 Task 3
Task 8 3 7 11 Task 1 Task 5 Task 6
Task 9 2 4 6 Task 1 Task 5 Task 6
Task 10 1 4 7 Task 4
Task 11 1 10 13 Task 7 Task 8 Task 9
Probabilistic Activity TimesThe Southern Textile Company
Activity time estimates for figure
The Southern Textile Company Probabilistic Activity Times – QM for Windows Output
Probabilistic Activity TimesThe Southern Textile Company
Network for order processing system installation
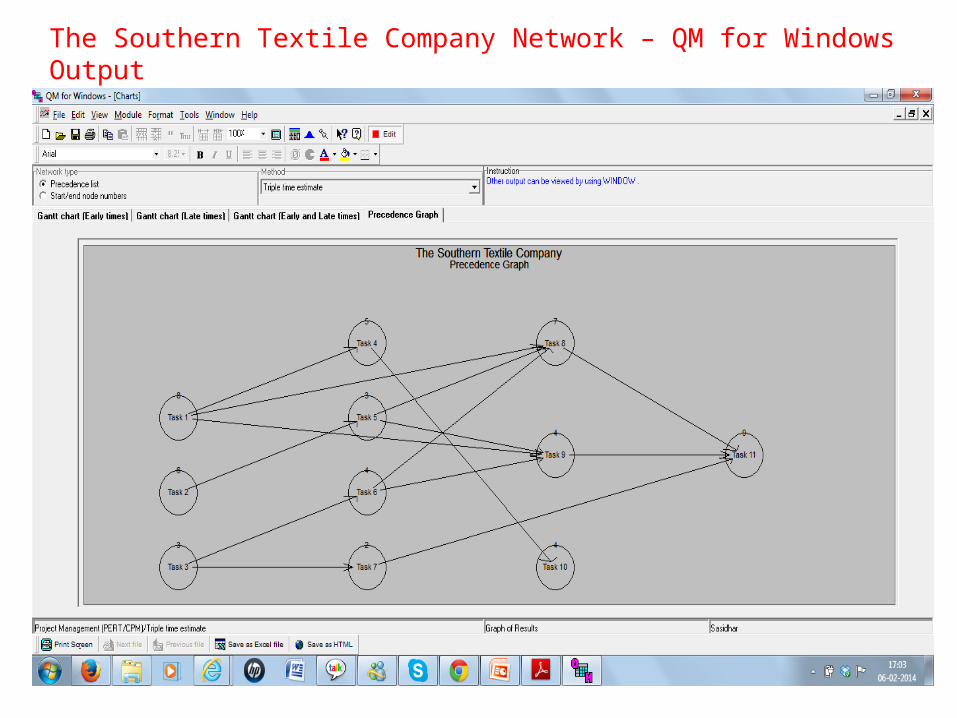
The Southern Textile Company Network – QM for Windows Output
Probabilistic Activity TimesThe Southern Textile Company
Earliest and latest activity times
■Expected project time is the sum of the expected times of the critical path activities.
■Project variance is the sum of the critical path activities’ variances
■The expected project time is assumed to be normally distributed (based on central limit theorem).
■ In example, expected project time (tp) and variance (vp) interpreted as the mean () and variance (2) of a normal distribution: = 25 weeks
2 = 62/9
= 6.9 weeks2
Probabilistic Activity TimesExpected Project Time and Variance
■Using the normal distribution, probabilities are determined by computing the number of standard deviations (Z) a value is from the mean.
■The Z value is used to find the corresponding probability.
Probability Analysis of a Project Network
Apr 18, 2023 Dr.Bokkasam Sasidhar 37
Probability Analysis of a Project Network The Southern Textile Company
Normal distribution of network durationApr 18, 2023 Dr.Bokkasam Sasidhar 38
Probability Analysis of a Project Network The Southern Textile Company
Probability that the network will be completed in 30 weeks or lessApr 18, 2023 Dr.Bokkasam Sasidhar 39
What is the probability that the new order processing system will be ready by 30 weeks?
Probability Analysis of a Project NetworkThe Southern Textile Company
2
25
6.9
6.9 2.63
30 251.90
2.63
weeks
xZ
Z
Z value of 1.90 corresponds to probability of .4713 in Table A.1, Appendix A. The probability of completing project in 30 weeks or less: (.5000 + .4713) = .9713.
Apr 18, 2023 Dr.Bokkasam Sasidhar 40
Probability Analysis of a Project NetworkThe Southern Textile Company
Probability the network will be completed in 22 weeks or lessApr 18, 2023 Dr.Bokkasam Sasidhar 41
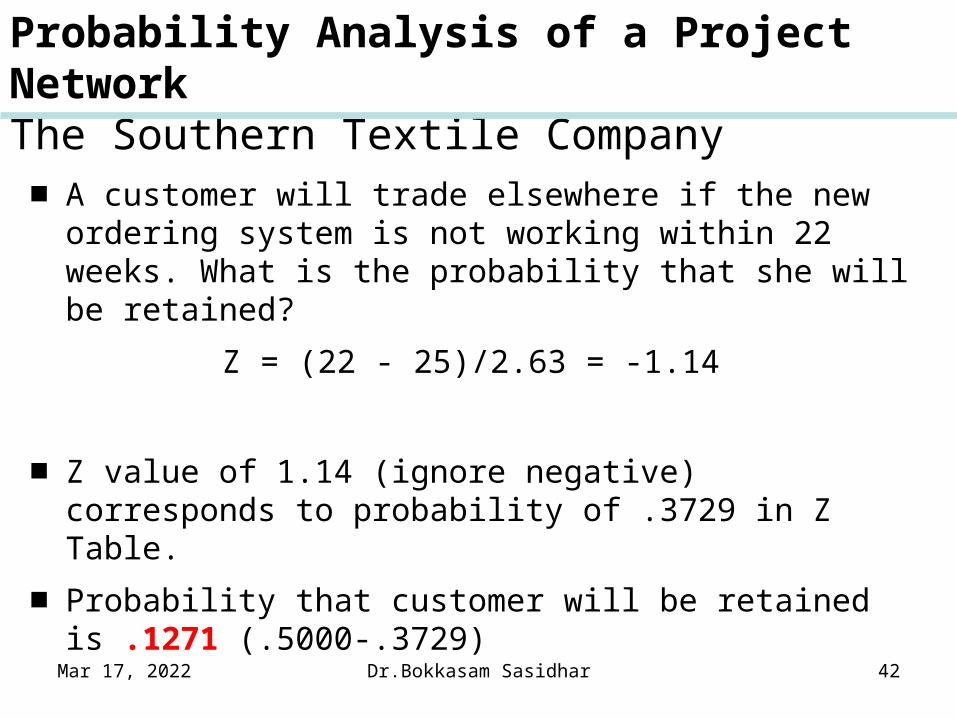
■A customer will trade elsewhere if the new ordering system is not working within 22 weeks. What is the probability that she will be retained?
Z = (22 - 25)/2.63 = -1.14
■Z value of 1.14 (ignore negative) corresponds to probability of .3729 in Z Table.
■Probability that customer will be retained is .1271 (.5000-.3729)
Probability Analysis of a Project NetworkThe Southern Textile Company
Apr 18, 2023 Dr.Bokkasam Sasidhar 42
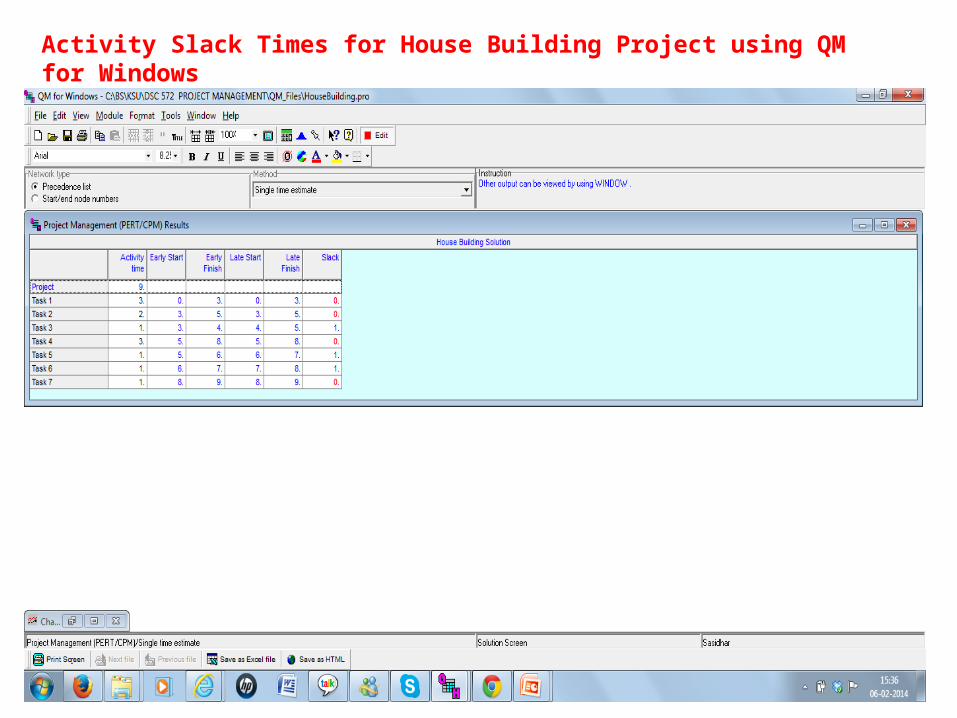
CPM/PERT Analysis Output with QM for Windows
Apr 18, 2023 Dr.Bokkasam Sasidhar 43
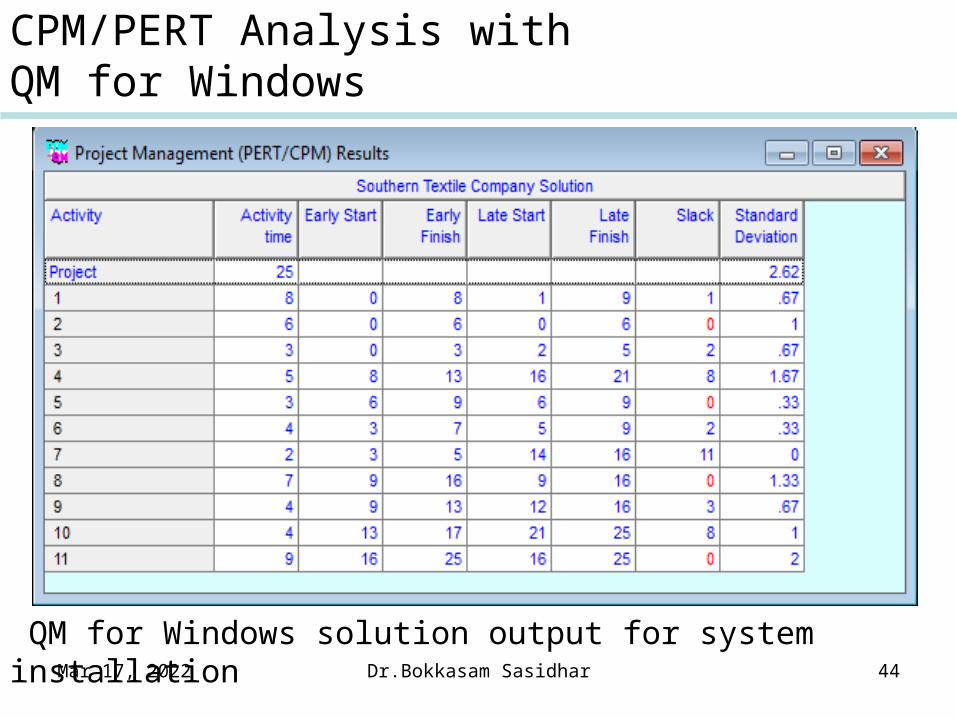
CPM/PERT Analysis with QM for Windows
QM for Windows solution output for system installationApr 18, 2023 Dr.Bokkasam Sasidhar 44
Solved Problem 2Solved Problem 2
What is the probability of completing the project in 23 weeks?
Solved Problem 2Solved Problem 2
Solved Problem 2Solved Problem 2
Using the Normal Distribution, we find that the probability of completing the project in 23 weeks or less is 0.9357.