120
+ Renewable energy and energy efficiency options for UK dairy farms ENERGY EFFICIENCY

+ Renewable energy and energy efficiency options for UK dairy farms
ENERGY EFFICIENCY

This study was commissioned for the Arla/Morrisons Producer Group by Wm MorrisonsSupermarkets PLC.
March 2010
COPYRIGHTThis study is copyright and the intellectual property of Newcastle University. It may not be reproduced in whole or in part except with the written permission of the University. Where permission is sought, consent will normally be granted on the condition that Newcastle University is attributed as the source of the reproduced material. Without such written permission, all such rights to reproduce any part of this document are withheld.
For enquiries relating to renewable energy and energy efficiency options for UK dairy farms please contact:Dr Paul BilsborrowSchool of Agriculture, Food and Rural Development, Newcastle UniversityTel: 0191 222 6868Email: [email protected]
AUTHORS AND ACKNOWLEDGEMENTSAuthors
The main author of the Energy Efficiency section was Philip Dunn with assistance from Gillian Butler. The main author of the Technologies section was Paul Bilsborrow with assistance from David Brough and Paul Quinn.
Project Steering Group
Robert Morris-Eyton Producer Representative - AFMP (Steering Group Chairman)David Evans Head of Agriculture - Wm. Morrison Supermarkets PlcLouise Welsh Agriculture Manager - Wm. Morrison Supermarkets PlcArthur Fearnall Producer Director - AFMP Mark Fletcher Producer Representative - AFMPDavid Watson Producer Representative - AFMPGraham Wilkinson Agriculture Manager - Environment - Arla Foods UKNic Parsons Agriculture Manager - Arla Foods UKMartin Foulger Business Manager - Arla Foods UK

1
Table of Contents 1
List of Tables 4
List of Figures 5
Glossary 6
Executive Summary 8
1.0 Introduction 10
1.1 The UK dairy industry, past, present and future 10 1.2 Economic/political drivers for reducing GHG emissions via 11 increased energy efficiency and the uptake of renewable energy 1.3 Agriculture as a contributor to GHG emissions 12 1.4 UK dairy farming and its contribution to GHG 13
2.0 Energy efficiency 17
2.1 Vacuum pumping 17 2.1.1 Background 17 2.1.2 Vacuum pump sizing 17 2.1.3 Variable speed vacuum pumps 20 2.1.4 Non energy benefits of variable speed vacuum pumps 23 2.1.5 Vacuum system maintenance 24
2.2 Milk cooling 25 2.2.1 Bulk tank systems 25 2.2.2 Milk pre-cooling systems 26 2.2.3 Factors affecting the performance of plate coolers 27 2.2.4 Dual-pass plate cooler 28 2.2.5 Two stage pre-cooling 29 2.2.6 Variable speed milk pumps 29 2.2.7 Scroll compressors 30 2.2.8 Refrigerant types 31 2.2.9 Condenser unit maintenance and location 31
2.3 Water heating 32 2.3.1 Cleaning procedure 32 2.3.2 Tuning the milking system for optimum performance 33 2.3.3 Eliminating system losses 33 2.3.4 Heat recovery units 35
2.4 Lighting 39 2.4.1 Illumination requirements for efficient milk production 39 2.4.2 Long day photoperiod (LDP) 40 2.4.3 Bulb types and selection data 40 2.4.4 Minimising lighting running times 42
2.5 Water and effluent pumping 43 2.5.1 Pump and motor selection 43 2.5.2 Pipe sizing and maintenance 44

2
2.6 Other considerations 45 2.6.1 Ventilation 45 2.6.2 Compressed air systems 46 2.6.3 Parlour heating 47 2.6.4 Automatic scraping systems 47 2.6.5 Farmhouse energy efficiency 48
3.0 Renewable energy technologies 49
3.1 Background 49
3.2 Anaerobic digestion 50 3.2.1 The process and equipment 50 3.2.2 Feedstocks 53 3.2.3 Applications and technology development 55 3.2.4 Outputs 57 3.2.5 Costs 59 3.2.6 Legislative requirements 60 3.2.6.1 Animal by-product regulations 61 3.2.6.2 Environmental permitting regulations 61 3.2.6.3 Digestate application to land 61 3.2.6.4 European Nitrates Directive 61
3.3 Biomass heat and CHP 62 3.3.1 The process and equipment 62 3.3.2 Feedstocks 64 3.3.3 Applications and technology development 66 3.3.4 Costs 68
3.4 Wind 69 3.4.1 The process and equipment 69 3.4.2 Energy source 71 3.4.3 Applications and technology development 73 3.4.4 Costs 73
3.5 Solar thermal and PV 75 3.5.1 The process and equipment 75 3.5.2 Energy source 78 3.5.3 Applications and technology development 79 3.5.4 Costs 81
3.6 Ground source heat pump 82 3.6.1 The process and equipment 83 3.6.2 Energy source 85 3.6.3 Applications and technology development 85 3.6.4 Costs 86
3.7 Micro-hydro 86 3.7.1 The process and equipment 87 3.7.2 Energy source 89 3.7.3 Applications and technology development 90 3.7.4 Costs 91

3
4.0 Other considerations 93
4.1 Financial incentives ROCs, RHI and FITs 93
4.2 Capital support schemes 95
4.3 Grid connection 96
4.4 Planning permission 98
5.0 Summary tables 103
5.1 Summary assessment of renewable energy technologies 103
5.2 Summary assessment and commentary of renewable technologies 104 5.2.1 AD 104 5.2.2 Biomass Heat 104 5.2.3 Biomass CHP 105 5.2.4 Wind 105 5.2.5 Solar Thermal 106 5.2.6 Solar PV 106 5.2.7 GSHP 107 5.2.8 Micro-hydro 107
5.3 Summary of direct CO2 emissions from combustion 108
5.4 Summary of potential annual financial and CO2 savings from
principal efficiency saving opportunities 109
Disclaimer 110
References 111

4
List of Tables Page
Table 1.1 Typical direct and indirect energy uses implicated in milk 14 production Table 1.2 Typical energy use for a range of activities on UK dairy farms 15 Table 2.1 Typical vacuum pump performance 20 Table 2.2 Annual savings from installation of VSD unit to vacuum pump 21 Table 2.3 The effect of plate cooler efficiency on the annual cost of 27 cooling milk Table 2.4 Dairy farm water heating requirements 32 Table 2.5 Estimation of the potential gains from improved hot water tank 34 insulation Table 2.6 Potential annual savings through installation of a Heat 38 Recovery Unit (HRU) Table 2.7 Recommended illumination levels for dairy farms 39 Table 2.8 Bulb type efficiency and selection data 40 Table 2.9 Lighting energy conservation measures and savings 42 Table 2.10 Example of potential savings through improved lighting 42 efficiency Table 2.11 General operating efficiency of different fan types 45
Table 3.1 Biogas production and energy outputs from various feedstocks 55 Table 3.2 Numbers of biogas plants globally 56
Table 3.3 Comparison of nutrient values of slurries and associated 59 digestates Table 3.4 Plant nutrient content of an average digestate 59 Table 3.5 Costs and returns from 3 different AD scenarios 60 Table 3.6 Comparison of CO2 emissions from a range of fuel types for heat 66 generation Table 3.7 Comparative capital costs for biomass and oil based heating 68 systems Table 3.8 Typical domestic fuel prices 69 Table 3.9 Indication of potential revenues from wind turbines 74 Table 3.10 Energy requirement to heat water to washing temperature 81 Table 3.11 Photovoltaic indicative outputs and revenues 82 Table 3.12 Supply temperature requirement for several heating systems 85 Table 3.13 Combinations of head and flow rate to achieve different power 90
outputs Table 4.1 Feed In Tariff scheme for operation in the UK from April 2010 94

5
List of Figures Page
Fig 1.1 Number of dairy herds in the UK 10 Fig 1.2 Changes in the global oil price 11 Fig 1.3 Breakdown of the contribution of renewable energy to total 12 energy usage Fig 1.4 Energy meter 16 Fig 2.1 The flow of air and milk through a milking system 17 Fig 2.2 Potential annual savings from fitting a variable speed vacuum 22 pump Fig 2.3 A single pass plate heat exchanger 26 Fig 2.4 A flow-based Heat Recovery Unit 36 Fig 2.5 A storage-based Heat Recovery Unit 37 Fig 3.1 Schematic diagram of an on-farm anaerobic digestion system 50 Fig 3.2 The key stages of anaerobic digestion 51
Fig 3.3 Heat only combustion plant 63 Fig 3.4 Biomass boiler set up 63 Fig 3.5 Effect of moisture content on the heating value of wood 65 Fig 3.6 Wood pellets 66 Fig 3.7 On farm wind turbine 70 Fig 3.8 Schematic diagram of both horizontal- and vertical-axis wind 71
turbines Fig 3.9 European wind speed data taken at a 10m hub height after 71
correction for topography and local roughness Fig 3.10 Power curve of a typical modern wind turbine 72 Fig 3.11 Solar thermal system 76 Fig 3.12 Typical photovoltaic system configuration 77 Fig 3.13 Average solar radiation levels in the UK falling on one square 79
-metre surface inclined at 30 degrees to the horizontal, measured in kilowatt hours, annual total kWh/m2
Fig 3.14 Photovoltaic array 80 Fig 3.15 Trenching and pipework for a GSHP 83 Fig 3.16 Vertical GSHP system 84 Fig 3.17 Horizontal GSHP system 85 Fig 3.18 Leat run of the river system 87 Fig 3.19 Penstock system 88 Fig 3.20 Head/flow ranges of small hydro turbines 88 Fig 3.21 Crossflow turbine system 89

6
GLOSSARY
Anaerobic Digestion (AD) The process by which bacteria that act only in airless (anaerobic) conditions decompose organic matter with the concurrent production of biogas.
Biogas Gas produced from the anaerobic digestion process which consists of about 60% methane (CH4) and 40% carbon dioxide (CO2).
Biomass Biological material derived from plant or animal matter including agricultural, forestry wastes/residues and energy crops, biodegradable fraction of industrial and municipal waste.
Biodegradable Municipal Waste That part of the household waste stream that would decompose in landfill (makes up around 65% of all household waste).
Carbon Sequestration The capture and storage of CO2 as organic matter in soils.
Combined Heat and Power (CHP) The simultaneous generation of heat and power in a single process, recovering the heat that is normally discharged to the atmosphere, thereby increasing the efficiency of fuel utilisation.
Digestate The output resulting from the anaerobic digestion process which can be separated into liquid and solid fractions.
Emissions Trading Scheme (EU-ETS) A key instrument whereby governments incentivise a reduction in the carbon dioxide emissions from key industries. EU member state governments are required to set an emission cap for all installations covered by the Scheme.
Feed In Tariffs (FIT) Proposed system of financial incentives which support electricity generation with a bonus paid for electricity exported to the grid, to come into operation from April 2010.
Greenhouse gases (GHG) Gases emitted into the atmosphere principally carbon dioxide, methane and nitrous oxides which cause global warming.
Life Cycle Assessment (LCA) The investigation and evaluation of the environmental impacts of a given product or service caused or necessitated by its existence.
Renewable Heat Incentive (RHI) A mechanism to be introduced by Government in 2011 to provide financial support for the production of heat from renewable sources.

7
Renewable Obligation (RO) An obligation on all electricity suppliers to supply a specific proportion of their electricity from eligible renewable sources.
Renewable Obligation Certificates (ROCs) Eligible renewable generators receive ROCs for each MWh of electricity generated. These certificates can be sold to suppliers. In order to fulfil their Renewable Obligation suppliers can present enough certificates to cover the required percentage of their output, or pay a ‘buyout price’ per MWh for any shortfall. All proceeds from buyout payments are recycled to suppliers in proportion to the number of ROCs they present.
Short Rotation Coppice (SRC) The practice of cutting fast growing trees at regular intervals to encourage branching and growth.
Photovoltaic (PV) The direct conversion of solar radiation into electricity by the interception of light.
Watt (W) Unit of energy production where 1 kW = 1,000 watts, 1 MW = 1,000 kW and 1GW = 1,000 MW and 1 TW = 1,000 GW.

8
EXECUTIVE SUMMARY There has been a steady decline in the number of dairy farms and dairy cows in the UK since 1995 largely as a result of volatility in the price of milk and increasing costs of production. Significant increases in energy prices have occurred in recent years on the back of the rising oil price and this has had a direct bearing on dairy operating costs and hence profitability within the sector. At the same time public policy has placed ever more emphasis on the reduction of environmentally damaging emissions. The Climate Change Act of 2008 placed CO2 reduction targets on the UK of 80% by 2050 in addition to which as part of EU-wide action the UK has to ensure that 15% of primary energy comes from renewable sources by 2020. The Milk Roadmap (2008) also sets targets relating to energy use on dairy farms, currently aiming for:
• 20-30% of producers to trial new technologies to reduce total emissions
• an industry wide improvement of 15% in energy efficiency
• 30 businesses to pilot on farm anaerobic digestion (AD) units Agriculture was responsible for 0.8% of carbon dioxide (CO2), 37.6% of methane (CH4) and 74.3% of nitrous oxide (N2O) emissions in 2008. In the future it is likely that reducing the carbon footprint of agricultural production is going to be a major target for the industry. A number of options are available to dairy farmers to reduce their carbon footprint and operating costs, in particular improving energy efficiency and the uptake of renewable energy technologies. With the exception of fieldwork the major contributors to energy use on dairy farms are milk cooling and water heating (each responsible for a third of total electricity use) followed by vacuum pumping and lighting.
Energy efficiency options
Both existing and developing technologies can be used to reduce energy use associated with milk cooling. By maximising the efficiency of the pre-cooling system, producers can significantly cut the amount of in-tank cooling and thus significantly reduce energy usage. A suitably sized plate cooler typically has the potential to save 30-40% of milk cooling costs compared with a situation where a pre-cooler is absent. New technologies such as scroll compressors and variable speed milk pumps also have the potential to deliver significant energy and cost savings.
There are two main ways in which energy use for water heating can be reduced these being a reduction in the volume of hot water required and the installation of heat recovery units (HRU) to milk cooling equipment. An HRU will have a potential pay-back period of between three and five years depending on the actual energy savings achieved.
Varying degrees of energy efficiency improvements may be achieved through a variety of alternative types of vacuum pump. In general, it is not economic to upgrade to a more energy efficient pump if the current pump is still in good condition. However, where existing pumps fail or new dairy units are being considered there is an ideal opportunity for producers to install a pump with improved efficiency. Variable speed vacuum pumps offer the potential for increased energy efficiency with the option of purchasing either a custom built variable speed vacuum pump or alternatively retrofitting existing pumps with variable speed controllers. Variable speed vacuum pump technology will usually yield electricity savings of 40-50% with an estimated payback period of about six years.

9
Whilst lighting only comprises a small proportion of total energy use on a dairy unit, it is an area where usage can be cut almost immediately and at little cost. Energy usage associated with lighting can be reduced through a combination of minimising running hours and selecting the most appropriate lamp types for the task in hand.
Renewable energy options
Renewable energy offers a significant opportunity for dairy farms to reduce their carbon footprint and to diversify their business through new income streams while at the same time reducing energy costs. There are a number of renewable energy technologies with potential for use on dairy farms. In particular these are anaerobic digestion, wind, and solar (both in the generation of heat and electricity) which can help in cutting energy costs in addition to reducing the carbon footprint. The Feed in Tariff (FIT) and proposed Renewable Heat Incentive (RHI) mechanisms proposed for introduction in 2010 and 2011 respectively offer a stable support mechanism for small scale systems. There are also capital allowance and capital funding schemes available which can make the introduction of some of these more financially attractive.
Anaerobic Digestion (AD) offers considerable potential for dairy farmers not only in terms of the generation of energy but also in manure management with respect to NVZ and EU Water Framework Directives. Dairy slurry has a low biogas yield so there is considerable value in utilising other feedstocks with the potential for improving biogas yield. In addition to which some feedstocks can attract a gate fee to significantly improve the economics of the system and reduce the payback period. Anaerobic Digestion also offers considerable environmental and financial benefits through the use of digestates as a substitute for currently used inorganic fertilisers. There are only a small number of on-farm AD systems in the UK but a number of manufacturers and installers are helping to develop the market. The development of on-farm AD facilities in Germany demonstrates the potential scale of this opportunity in the UK but a major limitation is still the very high capital costs for such a system. Wind turbines, photovoltaic (PV) units and micro-hydro systems all have the potential for electricity generation on dairy farms. Attractive rates for PV systems and small scale wind turbines are proposed with the new FIT scheme which significantly reduces the payback periods. Micro-hydro is generally of limited potential for most dairy farmers as very few farms are likely to have sufficient energy source (head or flow rate) to provide an economic return. Generally low amounts of electricity are generated and the cost is very much influenced by the amount and nature of the civil engineering work required. The generation of heat from the combustion of wood chip or pellets in a biomass boiler, solar thermal and ground source heat pumps all have the potential for production of heat. Although there is limited demand for heat within a dairy unit there is considerable value within a wider farm context where additional space heating is required and access to the natural gas grid is limited. Solar thermal and ground source heat pumps have the potential to be used to pre-heat water for use in a dairy unit before it enters the main tank for final heating, but a back-up system is required to achieve the temperature of >85oC generally required for parlour washing.
The range of options open to the dairy sector for either energy saving or for the adoption of renewable energy technologies is therefore considerable, but what is appropriate for an individual farm has to be assessed on a case by case basis. It is nevertheless considered that these options could offer considerable cost and environmental benefits to both the industry and to individual farms.

10
1.0 INTRODUCTION
1.1 The UK dairy industry - past, present and future
There has been a steady decline in the number of dairy herds in the UK (Fig 1.1) over the last 15 years with the number of farms with milking cows falling on average by 5.5% per annum since 1995. At the same time many herds have also become larger and as a consequence the decline in the number of dairy cows (female cattle aged two years or more) has not been so dramatic. Whereas the number of dairy herds in the UK halved between 1998 and 2008, dairy cow numbers only fell by 22% to just over 1.9 million with an average herd size of 114.
0
10
20
30
40
1995 1997 1999 2001 2003 2005 2007
Far
ms
nu
mb
ers
(10
00
s)
Fig 1.1 Number of dairy herds in the UK (Source: DairyCo 2010)
Significant increases in energy prices have occurred in recent years on the back of the rising oil price. In the last 10 years prices have more than tripled increasing from $17.48/barrel in 1999 to $61.06/barrel in 2009. Within this period there have been significant high points in particular $148 a barrel was reached in June 2008 but for most of the last 30 years oil has traded at an average price of between $20 and $35 per barrel (Fig 1.2).

11
Fig. 1.2 Changes in the global oil price
1.2 Economic/political drivers for reducing GHG emissions via
increased energy efficiency and the uptake of renewable energy An increased concentration of CO2 and other greenhouse gases in the atmosphere has led to
global warming. To address this issue, under the Kyoto protocol the UK is committed to reducing CO2 emissions by 12.5% below 1990 levels by 2012. The UK government has through the Climate Change Act of 2008 (DECC 2008) placed even more stringent CO2 reduction targets of 80% of the 1990 level by 2050 and made the UK the first country in the world to have a legally binding long-term framework to cut carbon emissions. The Energy White Paper (2003) suggests that these cuts can be achieved through a combination of renewable energy and increased energy efficiency.
The UK’s energy system demonstrates growing dependence on imported fossil fuels and
growing CO2 emissions. The UK Government’s Energy White Paper of 2003 suggested that by 2020 we will be dependent on imported energy for three quarters of our total primary energy needs (DTI 2003). The increased uncertainty of supply of oil and gas adds a strategic political concern to the already apparent implications for the UK balance of payments. Following a decade of relatively low energy prices there have been rapid increases during recent years. The price of electricity and gas to domestic consumers has risen by 40% and 48% respectively since the Energy White Paper was produced in 2003.
The UK Government’s Energy Policy is to stimulate the development of renewable energy
sources (wherever they have prospects of being economically attractive and environmentally acceptable) to contribute to diverse, secure and sustainable energy supplies and reduction in the emission of pollutants including greenhouse gases. As part of EU-wide action (Renewable Energy Directive 2009/28/EC) the UK has to ensure that 15% of primary energy comes from renewable sources by 2020. This means that renewable energy will have to increase from its 2008 figure of around 40 TWh (2.25% of primary energy) to around 240 TWh by 2020 (DECC 2009). The forecast contribution of renewable energy to transport, heat and electricity is shown in Fig 1.3.

12
ElectricityHeat
Transport
Electricity
Heat
Transport
0
50
100
150
200
250
2008 2020 targets
TW
h
Fig 1.3 Breakdown of the contribution of renewable energy to total energy usage
(Source: UK Renewable Energy Strategy 2009) This strategy will be supported by increased financial support (Section 4.1). Total UK energy use in 1995 was 315TWh of which 4TWh was in the agricultural sector and 101TWh in the domestic sector. In rural communities without access to mains gas there is a greater reliance on highly polluting energy sources such as coal-fired electricity and oil for heating (Table 5.3).
1.3 Agriculture as a contributor to GHG emissions There are a number of greenhouse gases (GHG) which have been linked to climate change i.e. carbon dioxide (CO2), methane (CH4), nitrous oxide (N2O), hydrofluorocarbons, perfluorocarbons and sulphur hexafluoride, all of which are weighted by global warming potential (GWP). The GWP of each gas is defined as its warming influence relative to that of carbon dioxide e.g. CO2 = 1, CH4 = 23:1, N2O = 296:1. Carbon dioxide is the main greenhouse gas accounting for about 85% of total emissions in 2007 in the UK (DECC 2009a). Agriculture in the UK is estimated to be responsible for <1% of CO2, 37.6% of CH4 and 74.3% of N2O emissions with an overall contribution of 7.5 % to GHG emissions. The main sources of this methane from agriculture are enteric fermentation (i.e. the rumen of ruminants e.g. cattle and large intestine of monogastrics e.g. pigs) which accounts for about 90%, with emissions from manure storage constituting about 10% of total agricultural emissions. Enteric fermentation accounts for about 80% of CH4 emissions in dairy husbandry whereas 70% of the methane on pig and poultry farms originates from manures (Monteny 2006). During storage of animal manures significant GHG emissions occur particularly N2O and CH4 as a result of microbial breakdown but using anaerobic digestion (Section 3.2) can significantly reduce GHG emissions (Clemens et al 2006). Methane emissions from agriculture in the UK have fallen by 17% since 1990 largely as a result of declining livestock numbers. The main source of N2O emissions in agriculture is from the use of artificial fertilisers.

13
The EU-Emissions Trading Scheme
The EU-Emissions Trading Scheme (EU-ETS) is a key mechanism used to reduce greenhouse gas emissions and allows governments to regulate the amount of emissions produced by setting an overall cap for the scheme. Participating companies are allocated allowances, each allowance representing a tonne of the relevant emission, in this case carbon dioxide equivalent. The EU-ETS allows companies to emit in excess of their allocation of allowances by purchasing allowances from the market. Similarly, a company that emits less than its allocation of allowances can sell its surplus allowances. In contrast to regulation which imposes emission limit values on particular facilities, emissions trading gives companies the flexibility to meet emission reduction targets according to their own strategy; for example by reducing emissions on site or by buying allowances from other companies who have excess allowances. The environmental outcome is not affected because the amount of allowances allocated is fixed. At present the EU-ETS covers CO2 emissions from heavy industries such as electricity generation, iron and steel, mineral processing industries such as cement manufacture, pulp and paper processing industries etc. In the future the scheme is likely to cover other industries and gases. It is likely that agriculture being a major emitter of both methane and nitrous oxide may feature in future EU-ETS schemes.
Reducing the carbon footprint of agriculture
In the future it is likely that reducing carbon footprint of agricultural production is going to be a major target for the industry. A number of options are available for dairy farmers to reduce their carbon footprint:
• Reduce direct and indirect energy consumption i.e. increased energy and other resource use efficiency.
• Installation of renewable energy technologies.
• Reduce nitrous oxide emissions – about 1.25% of applied nitrogen fertiliser to soils is released as nitrous oxide which equates to 1.88 Kg N2O from 150 Kg of N applied. There are a number of measures which can be used to reduce nitrous oxide emissions e.g. match supply with demand, effective utilisation of manures, optimise tillage, irrigation and drainage to prevent anaerobic soils which aid the nitrification process.
• Reduce GHG emissions via management and storage of slurry/manure and via anaerobic digestion (there is possible scope to alter rumen fermentation but this is unpredictable at present).
• Sequester carbon via the production of perennial crops, reduced tillage etc.
• Increased plantation of trees or biomass energy crops.
• Maintain and improve animal health to increase output and reduce emissions per head.
1.4 UK dairy farming and its contribution to GHG emissions
The Climate Change Bill set the UK a target of an 80% reduction in Greenhouse Gas (GHG) emissions by 2050 relative to the baseline 1990 level. Agriculture has to join all other industries in working towards this target, however, whilst other energy demanding industries such as power generation have been set statutory/mandatory short term targets, UK farming has a voluntary reduction of 34% on 1990 levels by 2020. The Department of Agriculture Food and Rural Development has committed English farming as a whole to reduce GHG emissions by 3 Mt CO2e.
Farming has a number of options in working towards these targets:

14
1. Reducing energy use from fossil fuels thereby cutting net emissions of CO2.
2. Reducing emissions of the more potent GHG; nitrous oxide and methane.
3. Mitigation by generating energy from renewable sources.
4. Mitigation by increasing carbon sequestration on farms.
The scope for reducing GHG emissions may appear large since agriculture is the major source of N2O and behind landfill the second largest source of CH4, and both are far more potent GHGs than CO2. Option one has not been tackled in this report since the current (2010) national accounting system or inventory is not sensitive enough to register changes in either of these gases in its current form (except for reductions in livestock numbers or fertiliser use). Similarly a number of questions exist over carbon sequestration under option four and again it might well feature in future initiatives, but is not recognised at present.
Hence this report focuses on options one and three i.e. improving energy efficiency on UK dairy farms and the scope to adopt alternative energy generation and wherever possible in this report assessment has been provided for likely financial and GHG savings.
Direct vs. indirect energy uses
If the carbon footprint of milk production is to be determined then hidden or indirect energy linked with anything brought onto as well as energy used directly on the farm itself, such as electricity, needs to be considered. Such a comprehensive accounting system or Life Cycle Assessment (LCA) is complex and can provide variable answers depending on where the boundaries are drawn, the inclusion of greenhouse gases other than CO2 etc.
Table 1.1. Typical direct and indirect energy uses in milk production.
Direct energy use on the farm Indirect energy use - energy
‘invested’ in the production of:
Diesel for machinery Milking plant and associated hardware
Vacuum pumping Tractors and other machinery
Milk cooling Bought in feeds
Lighting Fertiliser
Water and space heating Drugs and dairy chemicals
Direct energy use for milk production (mostly electricity) represents approximately 20% of the total energy use and hence carbon dioxide output on a dairy farm. This may appear a very small contribution to the overall environmental impact of milk production but it is the part that an individual producer can control and as such it offers an additional bonus of a direct cost saving.
There have been a number of studies recently looking at energy consumption on dairy farms in the UK and Ireland (Cafre 2009; Upton 2009) and although total energy use is dominated by field activities, this is highly variable across dairy farms and often includes activities not specific to milk production, which are not covered in this report. Values (excluding field work) recorded from a number of surveys range from between 120 kWh up to almost 500 kWh per cow per year. Disregarding fieldwork, the major contributors to energy use on the
15
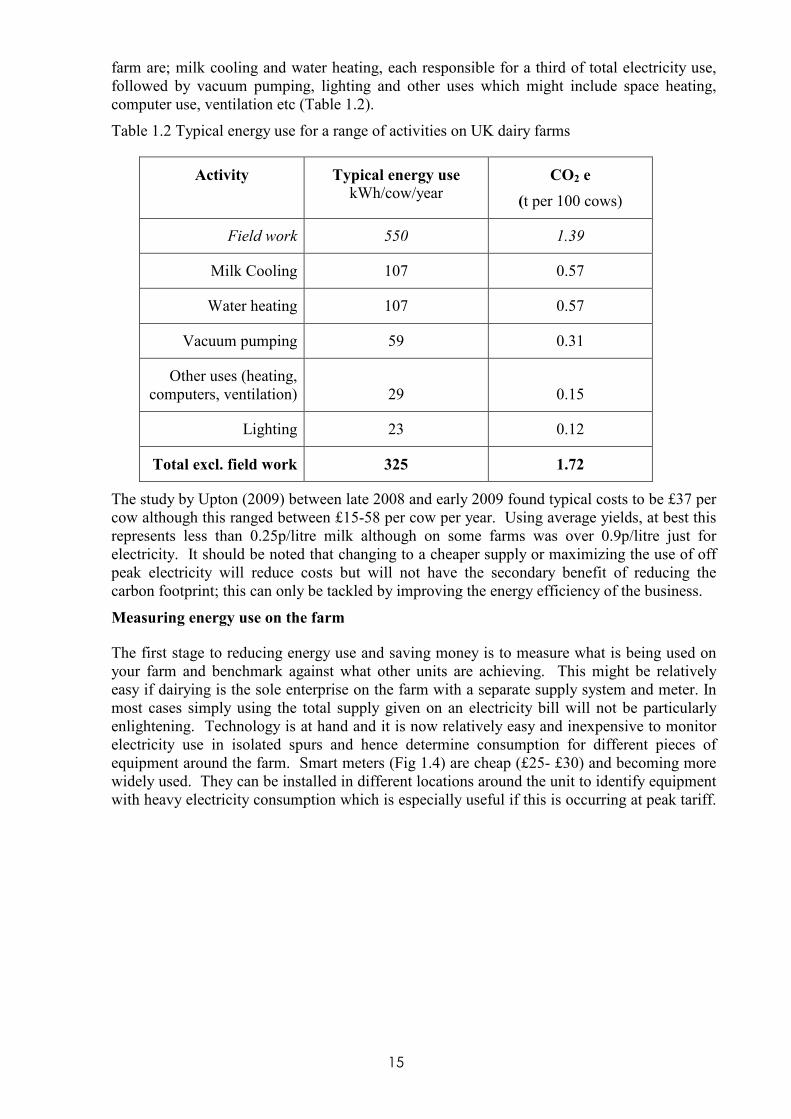
farm are; milk cooling and water heating, each responsible for a third of total electricity use, followed by vacuum pumping, lighting and other uses which might include space heating, computer use, ventilation etc (Table 1.2).
Table 1.2 Typical energy use for a range of activities on UK dairy farms
Activity Typical energy use kWh/cow/year
CO2 e
(t per 100 cows)
Field work 550 1.39
Milk Cooling 107 0.57
Water heating 107 0.57
Vacuum pumping 59 0.31
Other uses (heating, computers, ventilation) 29 0.15
Lighting 23 0.12
Total excl. field work 325 1.72
The study by Upton (2009) between late 2008 and early 2009 found typical costs to be £37 per cow although this ranged between £15-58 per cow per year. Using average yields, at best this represents less than 0.25p/litre milk although on some farms was over 0.9p/litre just for electricity. It should be noted that changing to a cheaper supply or maximizing the use of off peak electricity will reduce costs but will not have the secondary benefit of reducing the carbon footprint; this can only be tackled by improving the energy efficiency of the business.
Measuring energy use on the farm
The first stage to reducing energy use and saving money is to measure what is being used on your farm and benchmark against what other units are achieving. This might be relatively easy if dairying is the sole enterprise on the farm with a separate supply system and meter. In most cases simply using the total supply given on an electricity bill will not be particularly enlightening. Technology is at hand and it is now relatively easy and inexpensive to monitor electricity use in isolated spurs and hence determine consumption for different pieces of equipment around the farm. Smart meters (Fig 1.4) are cheap (£25- £30) and becoming more widely used. They can be installed in different locations around the unit to identify equipment with heavy electricity consumption which is especially useful if this is occurring at peak tariff.

16
Fig 1.4 Energy meter
Farm energy audits/ Life Cycle Assessments
Retailers are quoting the term carbon footprint for milk and other foods; but what does it actually mean and how does it relate to what you do on the farm? If farming is to reduce its environmental impact by cutting greenhouse gases emitted by production systems, we need to be able to measure or at the very least, estimate this. However, assessing the true environmental impact of any system is fraught with problems: How to estimate emissions, which GHG to include, which indirect contributions to include such as manufacture of tractors and other machinery distribution through the supply chain, impacts on the environment besides GHG etc. This comprehensive process is known as Life Cycle Assessment or (LCA) and involves a complex series of calculations and assumptions. Although it might be unnecessary to routinely assess every farm, a representative sample provides the industry with a sound benchmark to allow environmental progress to be assessed. However, a more appropriate tool that ought to be used regularly on all farms is a simple energy audit (Anon 2009) which will identify the scope for improving profitability with more efficient energy use and hence CO2 output, although it will not estimate other greenhouse gases such as methane or nitrous oxide.
A Google UK search for ‘energy audit on dairy farms’ found almost 5000 web links. Just an indication of the wide range of different methods available for both LCA and energy audits on farms; many with online access, some free and others at a cost. This variation means you can not always compare results from different methods or tools, but this is no reason to avoid using them; which ever tool is used, it is the decline in the energy use or GHG emissions that is important. However, if you want to compare results between farms say, within a discussion group or to monitor progress after making efficiency changes, the method or tools used need to be the same or at least comparable.
Saving money/saving CO2 production:
• Monitor energy used – not just overall but pinpoint what is used for milking, milk cooling, water heating, lights.
• Compare your results with comparable standards from other farms.
• Carry out an energy audit and identify hot spots with high energy use offering scope for reductions.
Most dairy farms which have not yet had an energy audit done are likely to be able to identify savings of at least 10% if not 40% in electricity use.

17
2 ENERGY EFFICIENCY
2.1 Vacuum Pumping
2.1.1 Background
Vacuum pumping remains a key use of energy on UK dairy units and can account for up to 30% of annual electricity consumption (DairyCo, 2009a). The vacuum pump is at the heart of any milking system, therefore understanding its role is crucial before attempting to economise on energy use. A conventional vacuum pump removes air from the system to create a partial vacuum to extract milk from the cow. Conventional pumps use a vacuum regulator to admit air into the system at the same time as to maintain a constant and stable vacuum (Figure 2.1).
Fig 2.1 The flow of air and milk through a milking system
The key aim of any vacuum system is to maintain a constant vacuum level at the teat end. Whilst certain parlours will work at slightly different vacuum levels according to their pipe-work height, most will have a working vacuum between -40KPa and -50KPa (kilopascals) to produce a claw vacuum in the range of -38 kPa to -42kPa (ISO 5707). The operating vacuum at the receiver should not fluctuate in excess of +/- 2kPa if teat end damage is to be avoided.
2.1.2 Vacuum pump sizing
Vacuum pump sizing and selection is an area not often considered by producers looking to upgrade their milking system. Often the choice of vacuum pump and its capacity is simply the default selection of equipment suppliers. However, both vacuum pump type and vacuum level recommendations have been updated extensively in the past two decades, so it is worthwhile for producers to liaise with equipment suppliers and consider the options available in order to improve the energy efficiency of the vacuum system.

18
Traditionally most conventional vacuum pumps have been intentionally oversized to ensure that they are capable of delivering a theoretical maximum vacuum demand (Geronimo, 2008a). Past recommendations for vacuum pump size have often been made on the basis that ‘biggest is best’. In addition to this, there has been a commonly held view amongst producers that a significantly higher vacuum capacity is required for cleaning compared with milking. In many cases this has led to a situation where the vacuum pump in operation on a farm is over-capacity and thus relatively inefficient.
Throughout the 1990s however, studies have revealed that large vacuum pumps are not required as long as the vacuum regulator is correctly placed in the milking system (Mullinax, 2002). For maximum efficiency, the regulator should be placed as close to the sanitary trap as possible (Fig 2.1). With appropriately placed vacuum regulators, a much reduced vacuum pump capacity is required to maintain the same vacuum level for milking. Whilst more recent milking installations will have taken advantage of these improved guidelines, there is still likely to be many older units that are running over-capacity and thus wasting energy.
Vacuum pump capacity is usually expressed in terms of the amount of air removed from the system per minute (litres or cubic feet/minute). When sizing a vacuum pump, consideration must be given to all components in the system which introduce air during the operation, such as milking clusters and milk meters (Milking Management, 2002). A reserve is then added to this figure to provide for incidents of accidental air admittance such as cluster kick-offs. As stated previously, the latest ISO 5707 vacuum guidelines for normal milking operation are much reduced compared with previous recommendations. Therefore producers upgrading older vacuum systems can expect much higher efficiency and lower running costs simply due to improved technical knowledge in the industry.
For producers wishing to replace vacuum pumps, a number of alternative types exist, each with varying degrees of energy efficiency. In general, it is not economical to change to a more energy efficient vacuum pump if the current pump is still in good operational condition. However, where existing pumps fail or new dairy units are being considered, it is an ideal opportunity for producers to liaise with equipment manufacturers and select the most energy efficient pump type available. In these instances, the higher initial purchase cost of alternative pump types can be recouped over time due to the electricity savings they offer. There are three main types of vacuum pump that are in common use:
• The sliding vane rotary pump (oil vane)
• The water ring pump
• The rotary lobe (blower) pump

19
Sliding Vane Rotary Although the sliding vane vacuum pump is one of the oldest designs in use, it is still one of the most energy efficient (Table 2.1). This design comprises sliding vanes that are set in slots in a rotating shaft (Ludington et al, 2004). Whilst the sliding vane design is relatively energy efficient, it is disadvantaged by the fact that it is not particularly suited to variable speed control when operating under a single phase electricity supply (Section 2.2.3). The rotary design also requires oil lubrication to form a seal between the housing and edge of the vanes, resulting in oil discharge to the atmosphere. Whilst oil reclaimers can be fitted to oil ring pumps, they will not be 100% effective at removing all of the oil particles from the discharged air (Kutz, 2007).
Water Ring
The water ring pump differs from the rotary vane in that the rotor has rigid blades rather than sliding vanes (Ludington et al, 2004). As the name suggests, the system relies upon a ring of water to form the outer seal between the edge of the blades and the inside of the rotor housing. Due to the water seal, no oil lubrication is required and the pump has much lower noise levels than other pump designs of equivalent output. However, despite these advantages, the water ring design remains one of the least energy efficient (Table 2.1) and is not suitable for variable speed control. For these reasons the design is not in common use.
Rotary Lobe (Blower) Pump
Although rotary lobe pumps have been used in other industries for some time, it is this design that represents the latest in vacuum pump technology on dairy farms. Rather than employing a system of vanes, this design simply consists of two rotating iron shafts, with several lobes on each shaft (Ludington et al, 2004). This is known as a dry pump as there is no requirement for oil or water (apart from lubrication of timing gears). The principal advantages of this design however relate to its high efficiency (Table 2.1) and extremely high suitability for accommodating variable speed control devices (Section 2.2.3).

20
Table 2.1 Typical vacuum pump performance
Source: Morison et al. (2007) When selecting a replacement vacuum pump producers must also take account of ancillary factors such as the initial investment requirement, noise levels, maintenance requirements, cleanliness and perhaps most importantly the suitability of the pump for variable speed control (Section 2.1.3).
2.1.3 Variable speed vacuum pumps
Conventional (fixed speed) vacuum pumps operate at a constant speed to remove air from the system and create a partial vacuum. Conventional pumps also use a vacuum regulator to admit air into the system to maintain a constant vacuum level. Fixed speed vacuum pumps must operate at the level required to create the theoretical maximum vacuum demand, which is often in excess of the normal operating requirements of the milking parlour. This excess capacity is known as the reserve and is required to cater for unexpected operating conditions such as multiple cluster kick-offs (Dairying for Tomorrow, 2008). However, this reserve vacuum is rarely called upon during a normal milking routine. As a result, the vacuum pump is unnecessarily operating at full capacity for all of the milking routine when in fact a much lower operating speed would suffice for most of the milking period.
Running a fixed speed vacuum pump represents a large waste of energy, but thankfully variable speed pump technology can now be economically applied on farm to reduce this waste. This technology is most suited to lobe type and sliding vane pumps operating on three phase supply (Section 2.1.2), although much work is currently being carried out to assess the potential for retro-fitting existing oil vane pumps that are running on single phase supply. A variable speed vacuum pump regulates the level of vacuum in a system by adjusting the speed of the pump motor rather than admitting air through a regulator. Producers have the option of purchasing either a custom built variable speed vacuum pump or alternatively retrofitting existing pumps with variable speed controllers, sometimes referred to as Variable Speed Drives (VSDs) or Variable Frequency Drives (VFDs).
Under variable control systems the computerised VSD controller is electrically installed between the vacuum pump motor and the motor control switch (Ludington et al, 2004). The regulator is replaced with a pressure sensor fitted in the vacuum line close to the receiver. This pressure sensor is connected to the VSD controller which constantly monitors the vacuum level and alters the
Vacuum pump type Flow performance
(l/min per kW) Power for 4000 L/min
(kW)
Water ring 300 13.3
Rotary Lobe 390 10.3
Sliding Vane 420 9.5

21
motor speed if necessary (Wisconsin Public Service, 2009). Where there is an increased demand for more capacity (e.g. due to initiation of the cleaning phase or a cluster kick-off) then the VSD increases pump speed accordingly.
Table 2.2 Annual savings from installation of VSD unit into vacuum pump (at
annual cost of running a pump of £955.)
Percentage
saving from
VSD
Energy
saving
(kWh)
CO2 saving
(tonnes)
Financial
saving (£)
30 3,285 1.73 287
40 4,380 2.31 382
50 5,475 2.89 478
60 6,570 3.46 573
70 7,665 4.04 669
Similarly, if vacuum demand falls the VSD will reduce the speed of the vacuum pump motor accordingly. The net result of this technology is that the output of the vacuum pump can be tailored to the demand of the milking system, resulting in significant electricity savings.
Variable speed vacuum pump technology will usually yield electricity savings of 40-50%, although trials have shown a range of 30-80%. This large range of variation is attributable to factors such as the size and type of vacuum pump, motor size and the size and type of milking system (Dairying for Tomorrow, 2008). As well as yielding extremely high energy savings, VSD controllers also represent an excellent investment proposition for producers wishing to cut their long term electricity costs. The electricity saving potential of VSD combined with the modest investment requirement, means that this technology offers a relatively short payback period (Example 1).
Example 1
System details:
• 7.5 kW oil vane vacuum pump operated on three phase supply twice daily for 2 hour milking (including wash cycle).
• Morning milking 5am-7am (off peak @ 6.6p/kWh).
• Evening milking 4pm-6pm (normal rate @ 10.85p/kWh).
• Total Energy Usage per Day = 7.5 kW x 4hrs = 30 kWh per day.
Assumes a CO2 emission factor of 0.527 kg/kWh (Defra, 2007).
The capital cost of a VSD unit for a vacuum pump varies widely according to the pump type, size and electricity supply that it operates on. Based on information from several manufacturers, the capital cost for a VSD to suit the 7.5kW three phase motor in example one is estimated at £2,800, with typical

22
installation costs of £350-£500. If one assumes a total installed cost of £3,200 and conservative energy savings of 50%, the payback period for the equipment is just over 6.5 years. Whilst this does not offer a payback period within five years, it is important to note that in many regions there are 40% grants available through Regional Development Agencies to assist with the purchase of energy saving equipment. Where this grant aid is available, the installation of VSD units can comfortably generate a return on investment within five years, as well as substantially reducing energy use. If the VSD controller is capable of producing energy savings in excess of the 50% estimate used in Example 1, the payback time will be even shorter. On a similar level, Example 1 assumes an average milking time of only two hours, which may be much shorter than what is achieved on many units. The savings and payback time quoted in Example 1 have been calculated using an average electricity price of 8.725p/kWh, since this is the current (Nov 2009) average of standard and off-peak electricity prices (FWi Inputs Price Monitor, 2009). If electricity prices were to rise in excess of this (as most industry pundits predict), then the increased annual savings mean that the investment could be recouped within several years (Fig 2.2).
0
300
600
900
1200
1500
1800
5 10 15 20 25 30
Average electricity price (p/kWh)
An
nu
al
sav
ing
(£
)
60% saving
50% saving
40% saving
Fig 2.2 Potential annual savings from fitting a variable speed vacuum pump The scenario described relates to a single sliding vane pump run on a three phase electric supply. Where producers have more than one vacuum pump in the dairy, investment in multiple controllers will not be required, as a single VSD unit can control up to three or four pumps. It should be noted however that extra equipment will be required to link multiple pumps, with a tandem kit typically costing in the region of £500 to control two motors for example.
The situation is less clear where producers wish to retrofit VSD units to sliding vane pumps but only have access to a single phase electricity supply, with contrasting recommendations between different equipment suppliers. It is possible to operate VSD-equipped three phase motors on a single phase supply via the use of inverters. This typically adds around £400 to the capital cost of a VSD unit fitted to an existing sliding vane pump. In addition, producers must remember that the existing single phase motors will need replacing with three

23
phase counterparts, with a 4kW motor costing approximately £250 for example. Rather than removing the old single phase motors completely, most technicians choose to keep them wired in on single phase supply so that the pump is still able to operate in the event of the VSD unit failing.
However, it is important to note that several manufacturers do not recommend the installation of VSD units for sliding vane pumps run on single phase electricity supply. It is claimed that the inverters require regular replacement and that the sliding vane pump is unable to operate effectively at low speeds. While much research is currently being carried out on this subject area, it is still an area of debate amongst dairy engineers. Because of this, it is important that producers liaise with several companies before investing in a VSD unit.
As stated previously, the rotary lobe pump type is very suited to VSD technology. However, with a new rotary lobe vacuum pump typically costing in the region of £6,500-7,000, it is generally not economical (in terms of payback period) for producers to upgrade to a rotary lobe pump to take advantage of VSD technology alone. The exception to this is where the current vacuum pump is in need of replacement or a new milking system is being considered. In such circumstances, it may be wise for producers to choose a rotary lobe type pump that is suited to VSD technology and offers long term efficiency gains.
2.1.4 Non energy benefits of variable speed vacuum pumps
• Longer pump life – Variable Speed Drive units manipulate the vacuum levels in a milking plant by reducing the speed of the pump motor accordingly. It would therefore seem logical that a vacuum pump operating at full speed for the entire milking period will have a shorter life span than a pump that is operating at a much lower speed for most of the milking period. Although the longer life expectancy of variable speed pumps is difficult to quantify due to the relatively new nature of the technology, it is definitely an additional factor to consider.
• Reduced noise levels – For many producers that have spent years trying to hold a conversation in a noisy milking parlour the reduced noise levels of a variable speed pump can often be more attractive than the energy savings available. Since a vacuum pump equipped with VSD is operating at only half of its rated speed for much of the milking period, the lower rpm of the pump results in much reduced noise levels.
• Maintenance of stable vacuum - The maintenance of a stable vacuum level is the key aim for any milking system. Vacuum pumps equipped with VSD are able to respond very quickly to changes in vacuum level by altering the speed of the motor instantly. It has therefore been suggested by a number of sources that the level of vacuum regulation achieved by a VSD is actually better than that under a conventional system. By creating a stable vacuum, VSD controllers should minimise teat-end impacts and thus help to

24
reduce the herd Somatic Cell Count (SCC). Although it is early days, a number of herds in the US using VSD technology have witnessed a noticeably lower SCC in the period since installation. There is currently a lack of research on this area under UK conditions to verify the claims made in other countries, however.
2.1.5 Vacuum system maintenance
Expected energy savings will not be delivered if the vacuum system is in poor operational condition. Several maintenance guidelines are listed below to ensure that the system is working at peak efficiency:
• Regularly clean the regulator filter to ensure that it is free of dust and debris. A blocked filter will not admit the correct volume of air into the system, reducing efficiency.
• Consider an annual maintenance programme for the vacuum system, checking the pump oil level, airflow/leakage in pipes and the condition/tension of the belts from the motor to the pump (not applicable for direct drive pumps).
• Rotary lobe pumps should be periodically cleaned to remove accumulated chemical residue from the rotors.

25
2.2 Milk cooling
With milk leaving the cow at approximately 35-37˚C and requiring cooling to a storage temperature of 4.5°C within 30 minutes of milking completion, it is easy to see why milk cooling represents approximately one third of total electricity usage on a dairy unit. Unfortunately, whilst milk cooling accounts for such a large proportion of energy use, it is also an area where there are limited opportunities for further rationalisation of energy use (Morison et al, 2007).
2.2.1 Bulk tank systems
Traditionally the main form of milk cooling equipment found on dairy farms has been the ice-bank (IB) tank. Although largely superseded by Direct Expansion (DX) tanks, there are still many examples of IB tanks being successfully used on UK dairy farms. IB tanks have an ‘outer jacket’ containing copper piping surrounded by water. Refrigerant is pumped through this piping to reduce the temperature of the water within the jacket to approximately 1˚C (Collings, 2008b). This water is then circulated around the sides of the bulk tank to remove heat from the milk via a simple heat exchange process. The key advantage of the IB tank has been its ability to store the ‘cold’ energy as an ice covering of the copper tubes before milk cooling is required, allowing producers to take advantage of off-peak electricity rates to build up the cooling capacity/reserve.
However, despite this advantage, the popularity of IB tanks has waned over the past 20 years due to several factors. Firstly, it is a widely held view that the IB system is not suitable for tank capacities in excess of 4,250 litres (Collings, 2008b), which poses obvious limitations given the increases in average UK herd size and milk yield in recent years. Secondly, and most importantly in terms of this study, IB tanks exhibit much lower energy efficiency than equivalent Direct Expansion tanks. This is because IB tanks feature an extra heat transfer process, as water in the outer jacket must firstly be cooled before the milk in the tank is cooled.
For the larger scale and energy conscious farmer, Direct Expansion (DX) tanks represent the system of choice, accounting for over 75% of cooling systems (Collings, 2008b). DE tanks differ from IB tanks in that the refrigerant gas used to cool the milk is in direct thermal contact with the tank wall. DairyCo (2009b) estimates that because of this, a DX tank can be up to 50% more energy efficient than an IB tank. These claims are backed up by FEC Services (2006a), who estimate that an IB tank is capable of cooling 45-50 litres of milk per kWh, compared with 75 litres of milk per kWh for a DX tank. However, producers must be aware that larger compressor units will be required compared with an equivalent IB tank, since cooling can only take place when there is warm milk in the tank.

26
2.2.2 Milk pre-cooling systems
One relatively easy way to reduce the cooling requirement and energy consumption of the bulk tank is to pre-cool milk before it enters the bulk tank. Milk pre-cooling systems have long been practised by the vast majority of producers, be it in the form of the simple plate cooler or more complex two-stage pre-coolers. However, on many units the pre-cooling system in place is often failing to meet its full potential. By maximising the efficiency of the pre-cooling system, producers can significantly cut the amount of in-tank cooling and thus significantly reduce energy usage. The Northern Ireland Department of Agriculture and Rural Development (DARD) (2008) estimates that a suitably sized plate cooler typically has the potential to save between 30 - 40% of milk cooling costs compared with a situation where a pre-cooler is absent. On many units however, it will be questionable whether these savings are being made. It may therefore be necessary for producers to review the design of their pre-cooling systems and make tweaks where required.
Fig 2.3 A single pass plate heat exchanger (Ludington et al, 2004)
A plate cooler or plate heat exchanger (PHE) consists of a series of very thin metal plates held closely together (Fig 2.3). Water flows along one side of each plate whilst milk flows along the other side in the opposite direction, transferring heat from the milk to the water via the plate. The capacity of a PHE is manipulated by the addition or subtraction of plates. As a minimum the plate cooler should be capable of reducing the temperature of the milk by 10˚C. However, with a larger PHE and higher water flow rates it is possible to achieve as much as 20˚C of pre-cooling according to DairyCo (2009c). The recently launched online energy savings calculator from the same source can be used to demonstrate how annual cooling costs differ in relation to different plate cooler efficiency (Table 2.3).

27
Table 2.3 The effect of plate cooler efficiency on the annual cost of cooling milk
Cooling
provided by
water source
(°C)
kWh/100 litres p/100litres Cooling cost per
annum (£)
No pre-cooling 1.4 13.44 1,343 10 0.95 8.68 867 15 0.73 6.80 679 20 0.50 4.67 467
Assumptions: Day Rate 10.85p/kWh, Night Rate 6.6p/kWh, 1m litre production per annum, DX tank less than 10 years old with no ice builder.
2.2.3 Factors affecting the performance of plate coolers
Water flow rate: In order to maximise the benefits of the pre-cooler the ratio of flow rates between water and milk is crucial. Manufacturers recommend a ratio of 2:1, and as long as water is not being wasted, it can generally be said that the higher the ratio the better (DairyCo 2009d). In practise the ratio on most farms will only be in the region of 1:1. The exact ratio will depend on the specific design and size of the plate cooler, so it is best to refer to manufacturer recommendations if you feel the ratio is inadequate. The plate cooler design effectively relies upon an even flow of milk. However, in the absence of a variable speed milk pump (Section 2.2.6), milk transfer from the receiver tank to the plate cooler will only be intermittent. Section 2.2.6 explains in detail how a variable speed milk pump can be used to further improve plate cooler efficiency.
Time delay solenoid valve: These should be fitted to the water supply to ensure that the water flow commences at the same time as the milk pump and continues to flow for a short period after the milk pump has stopped. This will optimise the water: milk ratio in the plate cooler and avoid excessive water use. The time delay on the valves should be no longer than approximately 20 seconds (FEC Services, 2005).
Correct sizing: The size of a plate cooler is altered by changing the number of metal plates. The number of plates must be matched to the maximum flow rate expected from the milk pump. As herd sizes have risen over the years, the amount of milk flowing in milking systems has increased, but the size of plate cooler has often remained an afterthought. Similarly, where milk pump upgrades have taken place recently, the size of the plate cooler must take account of the higher flow rate of milk. Plate spacing/compression: Plates that are too tight will restrict the flow of liquids in the plate cooler, impeding performance. Industry guidelines specify a gap of approximately 3mm between plates, and no less than 2.3mm (Dairy Industry SA, 2008).

28
Plate cleanliness: The adherence of contaminants from either water or milk will reduce the heat exchange capacity of the plates. The plant cleaning regime must therefore be considered to maximise plate cooler efficiency.
Temperature of water source: To maximise efficiency the plate cooler should use the coldest possible water on the farm (ideally borehole water if available). Throughout the summer months the temperature of incoming mains water will increase considerably, thus reducing the amount of heat exchange that takes place. Farms considering drilling a borehole should therefore remember that not only will the borehole reduce water costs, but it should also have a significant impact on milk cooling costs, helping to further justify the expenditure of a borehole.
Correct plumbing: The water should flow in the opposite direction to the milk to create a counter-flow which maximises heat exchange between the two liquids.
Whilst the exact capital cost of a plate-cooler will vary widely according to capacity, DairyCo (2009c) estimates the typical capital cost of a pre-cooler to be around £800 plus installation costs (£300-£350) and fittings (e.g. solenoid valve £100). However, the pay-back time of such a system is largely dependent on the water used in the process being adequately recycled/re-used. If this is not realised, the cost savings gained from pre-cooling will be offset by the additional costs of the water used in the process (DairyCo, 2009c). This is an area that producers are well aware of, with the vast majority choosing to use the warm waste water for washing purposes or for drinking troughs. The former use of plate cooler water can be used to reduce water heating costs, whilst the latter use can potentially be used to benefit milk production, as cows show a distinct preference for warm water over cold in winter.
DairyCo (2009c) estimates that providing the water can be reused appropriately, the cost of a plate cooler will be repaid within three years on most dairy farms. Even on farms that have an existing plate cooler, replacing this unit could generate a return on investment relatively quickly through improved pre-cooling. If a new plate cooler installation were to result in a 5˚C improvement in pre-cooling, this would be worth approximately £200 per annum at current energy prices based on the DairyCo online energy calculator. Assuming an installed cost of £1,200 for a typical 3000 litre/hr plate cooler, this would generate a return on investment after 6 years.
2.2.4 Dual-pass plate cooler
Most plate coolers in operation today are single pass units, meaning fluids pass through the system only once. An alternative to this is a dual-pass unit, in which the liquids make two passes through the system, resulting in the milk being in contact with the water for twice as long. The disadvantage of this system is that there needs to be pipe connections at both ends of the plate stack, making maintenance more difficult (Morison et al, 2007).

29
2.2.5 Two stage pre-cooling
A third plate cooler configuration exists that is known as a two-stage plate cooler. These units are used to provide what is known as instant cooling. Under such systems, the milk temperature is brought down to the storage temperature before it enters the tank. All the tank must do from this point forward is maintain the temperature of the milk. This system is known as two-stage pre-cooling as one section of the plate cooler is used to initially cool the milk using mains water, whilst a second section of the plate cooler cools the milk further using chilled water or a glycol-water solution, which can be produced via an ice builder utilising off-peak electricity. Such systems therefore have the potential to cut energy costs on dairy farms. However, in terms of actual energy use, instant cooling systems can be less efficient than conventional Direct Expansion systems due to the energy used for chilling water. Therefore, despite lower bulk tank energy usage, producers must be aware that energy usage as a whole will not decline due to the extra chilling stage involved.
2.2.6 Variable speed milk pumps
As identified (Section 2.2.3), the main way to improve plate cooler efficiency is to optimise the water: milk ratio, with the ideal aim being a 2:1 ratio. However, where conventional milk pumps are used this is almost impossible to achieve in practice. This is because a conventional milk pump only transfers milk from the receiver tank to the plate cooler when a set level is reached. Milk flow from the receiver to the plate cooler is therefore not particularly uniform at all, and because of this there will be a significant amount of the milking period where there is no milk flowing through the plate cooler at all, representing huge wasted potential. When the milk is eventually transferred to the plate cooler, it is often flowing at a rate that is much too fast for normal water supplies to keep up with. This problem occurs on farms that feature high capacity milk pumps and/or limited water supply capacity. One solution to this problem is for producers to increase the capacity of the water system via enlarged motors and pipe diameters.
The other solution to this problem is for producers to fit a Variable Speed Drive (VSD) unit to the milk pump. A VSD unit on a milk pump works in much the same way as a VSD fitted to a vacuum pump (Section 2.1.3). A variable speed milk pump will operate on more occasions than a conventional pump during milking, but at a lower rate. The VSD lowers the average rate of milk flow to the plate cooler and provides a more continuous flow (Ludington et al, 2004). Reducing the flow rate of milk to the plate cooler increases the water: milk ratio and provides more opportunity for heat exchange to occur.
There is little difference in energy usage between conventional and variable speed milk pumps. Instead, the energy saving benefits of variable speed milk pumps are associated with improved pre-cooling of the milk and reduced requirement for bulk-tank cooling. The average improvement in pre-cooling that variable milk pumps can bring is difficult to quantify, as different plate
30
cooler designs will differ in efficiency. However, US studies have claimed that a typical VSD milk pump can improve pre-cooling by 5-8°C (Focus on Energy, 2007b). These claims are in part backed up by a NZ study in which Morison et al. (2007) estimated that the installation of a variable speed drive on a milk pump resulted in a 5°C improvement in the pre-cooled milk temperature.
The cost of VSD units for milk pumps will vary according to motor size, but as a guide producers can expect to pay around £1,500 for a VSD to fit a 1.1kW motor, with typical installation costs of approximately £250. If the average 5˚C improvement in pre-cooling is taken to be worth approximately £200 per annum at current energy costs (Section 2.2.3) then it can be seen that it will take nearly nine years to generate a return on the investment. It must be remembered however that each farm is different. For farms with very poor water pressure/supply, the installation of a VSD unit may result in improvements in pre-cooling well in excess of 5˚C. In such cases, the VSD unit may comfortably generate a return on investment within a five year period. Similarly, if energy prices were to rise dramatically, the higher annual savings through improved pre-cooling would further reduce the payback period of a variable speed milk pump. Quantifying the savings and payback time of variable speed milk pumps is often difficult as they do not result in direct energy savings. The energy savings are a result of reducing the burden on the bulk tank cooling system, and these savings can often be difficult to estimate. For these reasons, producers need to evaluate the entire cooling system before investing in a variable speed milk pump.
Because of the cost of VSD units, it is essential that all other options have been considered before a decision is made. If the water supply to the plate cooler could be improved quite easily for example, then this would represent the better option. Similarly, it may be possible to fit a manual throttle/valve to regulate milk flow to the pre-cooler at minimal cost. Producers must be certain that it is definitely the plate-cooler that is the weak-link in the cooling operation before spending money on VSD units. If a plate cooler is operating efficiently, the temperature of the milk exiting the plate cooler should be within 2-4°C of the water entering (Delaval, 2006). If the plate cooler on your farm is managing to achieve this already, investing in a VSD unit is probably questionable.
2.2.7 Scroll compressors
The bulk tank compressor units are required to pump and cycle refrigerant through the cooling system. Traditionally tank compressors have been of the reciprocating design, with most tank compressors over ten years old being of this type (Focus on Energy, 2007b). Despite their widespread use, this type of tank compressor is not particularly energy efficient.
However, in the past 10 years a new design of compressor unit has been used in the dairy industry, known as a scroll compressor. Scroll compressors are estimated to be 15-25% more energy efficient than traditional reciprocating compressors (Efficiency Maine, 2008). Scroll compressors operate in a circular motion and feature fewer moving parts than a conventional compressor so have
31
the added benefit of reduced noise and vibration levels (Geronimo, 2008b). Scroll compressors are also said to be more reliable and live longer than conventional compressors.
Wherever a new bulk tank is planned or where existing compressor units fail, producers should specify that scroll compressors are used. Whilst slightly more expensive than reciprocating compressors, the investment will soon be returned when the energy savings and longer life expectancy are considered.
2.2.8 Refrigerant types
The majority of dairy refrigeration systems use a refrigerant known as R22. Since this refrigerant is ozone depleting, its production will be phased out by 2015 and most likely replaced with a refrigerant known as R407c (FEC Services, 2005). For existing installations, R22 can continue to be used beyond 2015. The phase-out of R22 will improve the environmental footprint of UK milk production on its own, but it is also stimulating the development of refrigerants that exhibit improved energy efficiency. Traditionally, most refrigerants have been glycol-based products, but there is currently work being carried out to develop new products with improved freezing characteristics which require less pumping and achieve increased flow rates. Such products will have major benefits in Ice-Bank tank systems, reducing the amount of time it takes to build ice reserves and reducing the energy required for pumping the refrigerant around the system. Since these products are still in the development stages, producers should watch the market closely to take advantage of the products as and when they become commercially available.
2.2.9 Condenser unit maintenance and location
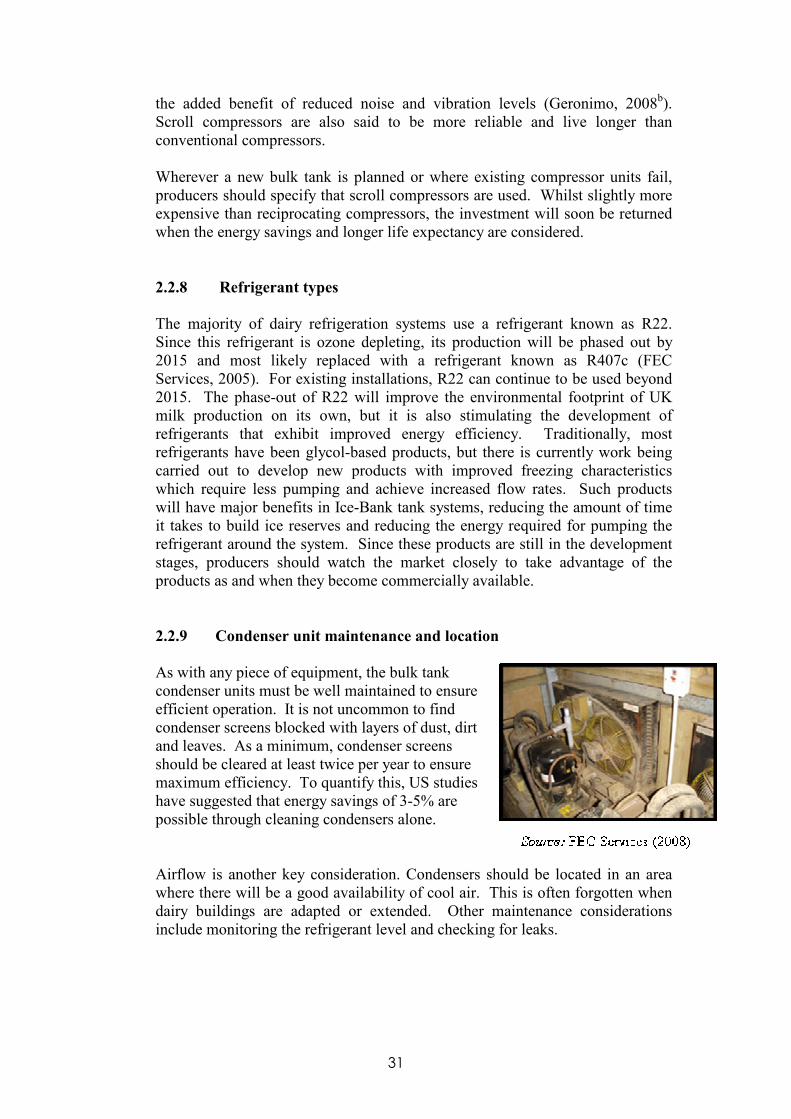
As with any piece of equipment, the bulk tank condenser units must be well maintained to ensure efficient operation. It is not uncommon to find condenser screens blocked with layers of dust, dirt and leaves. As a minimum, condenser screens should be cleared at least twice per year to ensure maximum efficiency. To quantify this, US studies have suggested that energy savings of 3-5% are possible through cleaning condensers alone.
Airflow is another key consideration. Condensers should be located in an area where there will be a good availability of cool air. This is often forgotten when dairy buildings are adapted or extended. Other maintenance considerations include monitoring the refrigerant level and checking for leaks.

32
2.3 Water heating Along with milk cooling, water heating can represent a large proportion of energy use on a dairy unit. Thankfully however, the options for improving energy efficiency are not as limited as those for milk cooling. Very simplistically, there are two main ways in which water heating energy use can be reduced, these being a reduction in the volume of hot water required on the farm and the fitting of heat recovery units (HRU) to milk cooling equipment. Reducing hot water requirements on the farm is the best place to start when trying to reduce water heating energy use. Often the implementation of very simple changes can yield significant benefits with little expenditure required. However, before attempting to reduce hot water use, it is important that producers are aware of the recommended temperature and volumes of hot water required for different operations on the farm (Table 2.4.). Table 2.4. Dairy farm water heating requirements
Use Temperature
Parlour Wash (Acidified Boiling Water Cleaning)
96˚C
Parlour Wash (Circulation Cleaning) 85˚C
Bulk Tank Wash 85˚C
Hand Wash 50˚C
Calf Feeding 40˚C
2.3.1 Cleaning procedure
On many farms there is often the potential to reduce the amount of hot water washing that takes place through manipulation of the cleaning procedure. However, it goes without saying that this must not be done at the expense of milk hygiene. As a guideline, parlours that use circulation cleaning (the majority of parlours in the UK) will generally require 10-15 litres of hot water per milking unit, with a start temperature of 85˚C and a circulation time of 5-8 minutes at 60-70˚C. By comparison, producers that carry out Acidified Boiling Water cleaning will generally require 14-18 litres of hot water per milking unit, with a start temperature of 96˚C and all milk contact parts of the equipment reaching 77˚C for at least two minutes (Food Standards Agency, 2006).
It is against this backdrop that producers can now begin to consider where savings can be made. For example, many farms continue to practice hot parlour washing after each milking during the day. However, with careful choice of cleaning product, it is possible to carry out a single hot wash each day with no effect on milk hygiene. Taking circulation cleaning as an example, a typical regime could involve a hot morning wash with an alkaline detergent solution, followed by a cold wash with peracetic acid or similar product in the evening. Such regimes have the potential to halve water heating energy, but it must be remembered that in such situations chemical costs are likely to be higher,

33
reducing some of the financial benefits. Nevertheless, it is worthwhile for producers to work with their dairy chemical suppliers to select a cleaning product that provides maximum hygiene and energy efficiency benefits.
This idea has certainly not been lost upon certain dairy chemical manufacturers. For example, the recently launched Lactivate product from Ecolab promises to cut both water and energy usage on dairy units compared with traditional circulation cleaning regimes. The Lactivate product contains a substance that activates Lactoperoxidase, an enzyme naturally present in milk. In certain circumstances, this enzyme can act to purify milk. Because Lactoperoxidase is required for the cleaning process to operate, there must be residual levels of milk left in the system, meaning that the pre-rinse phase must be eliminated. Eliminating this phase not only saves approximately one third of the water used for cleaning, but also saves the energy that would be used to heat the pre-rinse water. Indeed, the manufacturer claims that this product has the potential to achieve combined annual savings of £1,000 in energy and water for a 200 cow herd.
2.3.2 Tuning the milking system for optimum performance
With all parlours requiring an annual test as part of ADF requirements, this presents an ideal opportunity for dairy engineers to tune-up the performance of the plant washing system at the same time. Doing this will ensure that the system is operating as efficiently as possible and not using more hot water than is necessary. An example of this is to ensure that the parlour air injection system is working correctly, as this affects the speed and distance with which ‘slugs’ of water move around the system. Similarly, a poorly functioning vacuum regulator will affect the amount of air admitted into the system, reducing the efficacy of cleaning.
2.3.3 Eliminating system losses
Most water heating systems on UK dairy farms feature electric immersion heaters fitted into insulated copper tanks. However, with many heating systems being installed some time ago, producers could be unknowingly losing valuable heat energy as a result of poor maintenance and design of key equipment. The first area to consider is whether the water cylinder features an adequate level of thermal insulation. Work carried out by FEC Services has shown that a well insulated, modern water heater will lose approximately 5% of its heat over a 17 hour period, compared with approximately 50% for an uninsulated copper cylinder. To avoid this energy loss, FEC Services (2006b) recommend that water heaters should be insulated to a level better than 0.45 W/m2˚C, which is equivalent to 50mm of sprayed polyurethane foam or 85mm of glass fibre quilt.

34
Recent milking system installations will without doubt feature such levels of insulation, but for many older units the situation is doubtful, especially given the levels of insulation damage that are seen on many cylinders. Damaged insulation must be repaired immediately as moisture ingress will reduce the efficacy of the insulation covering. If the cylinder features no insulation at all, a glass fibre jacket will provide satisfactory insulation at a minimal cost. However, for maximum efficiency and long term savings a pre-insulated water cylinder remains the best option. The recently launched DairyCo online energy calculator can be used to quantify the potential gains from improved insulation (Table 2.5). Table 2.5 Estimation of the potential gains from improved hot water tank insulation
Cylinder
Condition
Energy Use/Day
(kWh)
Electricity
cost/day £
Electricity
cost/year £
No insulation 31.63 2.09 762
Quilted jacket 28.47 1.88 686
Insulation deteriorated
26.36 1.74 635
<5yr old, >50mm Rockwool insulation
23.19 1.53 559
Spray foam insulated
22.14 1.46 533
Assumptions: 227 litre tank heated once daily to 90˚C using 100% off peak energy @ 6.6p/kWh.
Insulation should not just be limited to the hot water tank either. Heat losses from associated pipe work can be considerable. FEC Services (2006b) therefore recommends that all pipes and joints should receive a minimum 12mm (1/2”) of insulation, with 19mm (3/4”) being preferable. On a similar level, producers should ensure that the hot water tank is located very close to its point of use to minimise the length of pipes (i.e. above the wash trough). When considering location of the hot water tank, producers must also ensure that it is not exposed to any draughts or considerable air movement. It is still surprising how many hot water cylinders are located just through doorways into the dairy. Other low cost energy conservation measures in this area include checking and repairing all leaking taps and valves, as the losses can add up over the course of a year. Not only do leaking taps waste water, but they also increase energy consumption as cold water replaces the water lost from the tank. For producers who operate in hard water areas, another consideration should be preventing the build up of scale on heating equipment. During the heating of water, minerals such as calcium carbonate (lime) are forced out of the solution and accumulate on the surface of the heating element in the form of scale. This scale has an insulating effect which reduces heat transfer to the water inside the heater. As a result, it is important that heating equipment is regularly de-scaled using a suitable acid product, or alternatively producers could consider fitting an

35
electronic scale preventer. Such products typically cost around £150+VAT to purchase, with estimated running costs of £4 per annum. An alternative method of reducing heat loss from the hot water cylinder is to minimise the amount of time that the water is maintained at working temperature. Nearly all farms do this by having a time switch fitted to the heater which enables water heating to be completed just prior to use, whilst also taking advantage of the cheaper off-peak electricity rates. Whilst this approach is certainly nothing new to producers, it is important that these time switches are regularly inspected to ensure that they are operating as expected. For example, it is common for most time switches to stop working in the event of a power cut. If the time switch is not reset, the incorrect time will be registered on the switch and the water heater will operate at the incorrect hours, potentially increasing the use of peak-rate electricity. Similar arguments exist for when clocks are altered to take account of British Summer Time.
Whilst producers have been using off-peak rates for water heating for many years, there are still many cases where the benefits could be further maximised and costs saved. For example, where parlours receive a hot wash after each milking, it is common for the water heater to be only sufficient for one wash. As a result, it is only the water for the morning wash that takes advantage of the off peak rates, with the cylinder having to be reheated on peak electricity rates for the afternoon wash. With industry figures estimating that 21 kWh of electrical energy is required to heat a 227 litre (50gal) hot water cylinder to 85˚C, the costs of this policy can be considerable. At current electricity prices (10.85p/kWh peak, 6.6p/kWh off peak) the differential between tariffs amounts to approximately £325 per annum. In light of this, it usually makes financial sense to install a second immersion heater to allow all water to be heated on the cheaper tariff. This water will require a short heating boost just prior to use, which slightly reduces some of the earlier financial benefits. However, provided the water heater is well insulated, the cost of this is minimal in comparison to the potential cost savings available through heating the water off-peak. As a result, the capital expenditure on an extra water heater is normally recouped within a three year period under such circumstances.
To date, water heating has been considered in terms of the typical electric immersion heater systems that are in place on the majority of UK dairy farms. However, it is noteworthy that alternatives do exist, such as oil or gas systems. These options are popular overseas, but once the additional installation and maintenance costs are taken into account there is little benefit of switching to these alternative fuel sources under UK conditions. In addition a number of renewable sources of energy exist as alternatives to the traditional electric heater. These options are discussed in detail later in this document.
2.3.4 Heat recovery units
Having minimised hot water usage and eliminated system losses, the next step for producers is to consider the installation of a heat recovery unit (HRU) to the

36
cooling system. During the milk cooling process, heat is expelled from the condenser of the refrigeration system. This heat is simply transferred to the surrounding air and in effect wasted. Given that the refrigerant leaving a milk cooling compressor can be 70-80˚C, it makes sense to try and utilise some of this heat for water heating purposes.
An HRU aims to transfer a proportion of this waste heat (the superheat) to the water destined for the water heater, where the temperature can be topped up to 85˚C by the existing immersion heater. Such systems are also commonly referred to as ‘de-superheaters’. In order to maximise heat transfer, the HRU is installed between the compressor and condensing unit of the refrigeration system. A HRU works by placing a heat exchanger in the water destined for the water heater and passing the hot refrigerant gas through it. Using this approach an HRU is typically able to pre-heat water to 45-60˚C, although temperatures in excess of 60˚C have been recorded in trials. With temperatures of this magnitude being achieved, such systems have the potential to half water heating costs on dairy units.
Although installations will differ slightly between manufacturers, producers should be aware that there are two basic types of HRU that are available in the marketplace today, these being a ‘flow based’ HRU and a ‘storage based’ HRU (FEC Services, 2000).
Flow Based HRU
A flow based HRU is designed to work in much the same way as a plate cooler, whereby heat is recovered via a flow of water passing over the refrigerant pipe work (Fig 2.4). With this type of HRU, heat will only be recovered if water is running at the same time as the compressor unit.
Fig 2.4 A flow-based Heat Recovery Unit (Source: GEA Farm Technologies, 2009).

37
Storage Based HRU
This design effectively comprises an insulated water storage tank into which a heat exchanger is incorporated (Fig 2.5). This heat exchanger may take the form of a refrigerant plate around the outside of the tank or alternatively as copper refrigerant coils within the tank. The water tank into which the HRU is incorporated acts as the header tank for the main immersion heater, thus eliminating any alterations to the water inlet on the immersion heater. Unlike a flow-based HRU, there is no need for water flow to be synchronised with refrigerant flow.
evaporatorcompressor
hot gas
How SMART-HEAT fits into the refrigeration circuit
Hot water
condenser
receiver
Cold water
evaporatorevaporatorcompressorcompressor
hot gashot gashot gas
How SMART-HEAT fits into the refrigeration circuit
Hot waterHot water
condenser condenser
receiver
Cold water
Fig 2.5 A storage-based Heat Recovery Unit (Source: Fabdec Ltd, 2006)
Economics of HRU
The cost of an HRU varies greatly between manufacturers and the specific design. However, as a guide, flow-based heat recovery units have been fitted into existing systems for approximately £3500, including installation. Working on this cost, the HRU will have a pay-back period of between three and five years depending on the actual energy savings achieved. This pay-back period, coupled with the availability of 0% finance schemes, makes the installation of an HRU a very suitable investment.
The following example (Table 2.6) attempts to quantify the potential savings available from installing an HRU, based on the assumptions of a 365 litre (80gal) water cylinder requiring heating to 85˚C twice daily from an ambient temperature of 15˚C.

38
Table 2.6 Potential annual savings through installation of an HRU.
Ambient
Temp
(˚C)
Temp
achieved
by HRU
(˚C)
Uplift
(˚C)
%
Contrib.
to heating
Annual
kWh
saving1
Annual
CO2
saving2
(tonnes)
Annual
Savings3 (£)
15 45 30 43 9,296 4.90 744
15 50 35 50 10,846 5.72 868
15 55 40 57 12,395 6.53 992
15 60 45 64 13,945 7.06 1,116
1 Assumes 0.001163 kWh required to raise one litre of water 1˚C
2 Assumes a CO2 emissions factor for electricity to be 0.527 kg/kWh
3 Assumes an average electricity price of 8.725p/kWh (one heating taking place off-peak, the other on peak). Also assumes minimal heat loss from the water cylinder. If the tank features inadequate insulation the pre-heated water will require a greater boost from the immersion heater, thus reducing the financial benefits.
It must also be remembered that the above example considers a 365 litre (80gal) water cylinder. Many larger farms will be heating much larger quantities of water than this, so the payback periods are potentially even shorter (although the cost of a larger HRU must be factored in). In addition to this, the above example assumes an average electricity price of 8.725p/kWh. If energy prices continue to rise as predicted, it is clear to see that the pay-back period for heat recovery systems will be shortened further. The price quoted for installing the HRU assumes that it is being retrofitted to an existing system. Nearly all new bulk tanks now come with the option of an integrated HRU, which typically increases the tank cost by the same amount as the retrofit cost quoted above. Since prices will vary between manufacturers, it is best to consult your local equipment dealer. However, where new tanks or milking systems are being considered, choosing the HRU optional extra is likely to very prudent given the potential savings available.
Interactions between HRU and pre-coolers
It is noteworthy that there is an important interaction between a HRU and pre-cooler, as these systems are effectively competing against each other. Quite simply, as more heat is taken out of the milk by a plate heat exchanger, there is less cooling required from the compressor units and so there is less heat available for recovery as a result. A standard plate cooler and HRU represent compatible technologies, but where more efficient pre-cooling systems are in place such as chilled water pre-coolers, the benefits of a HRU are likely to be marginal. In short, an HRU may not be applicable to all systems and this must be remembered when planning an overall strategy to reduce energy use in the dairy.

39
Alternative sources of heat for heat recovery
Whilst heat recovery units are most commonly integrated into milk cooling systems, it is noteworthy that heat can be recovered from other sources on a dairy unit. For example, it is possible to recover heat from the vacuum pumping system via the installation of a heat pump. Although vacuum pumps can potentially generate large amounts of heat energy, it is generally accepted that this system is not economically viable. This is due to the low density of air and the subsequently low level of heat transfer that takes place. Currently the cooling system remains the most economic source of heat for heat recovery systems.
2.4 Lighting Whilst lighting only comprises a small proportion of total energy use on a dairy unit, it is an area where usage can be cut almost immediately and at little cost. Energy usage associated with lighting can be reduced through a combination of minimising running hours and selecting the most appropriate lamp types for the task in hand. However, before analysing these considerations in detail, it is worthwhile to consider the actual lighting requirements of an average dairy farm.
2.4.1 Illumination requirements for efficient milk production
Reducing energy use associated with lighting is not as simple as just turning the lights off. This is because minimum illumination levels are recommended across various parts of a dairy farm in order to maximise milk production and welfare (Table 2.7). Table 2.7 Recommended Illumination Levels for Dairy Farms
Area
Target
light level
(Lux)
Comments
Parlour pit 500 Light level must enable udder problems to be spotted.
Parlour
standings 200
Light level must allow cows to move confidently and encourage cows into the milking parlour.
Collecting
yard
100 Illumination level least critical.
Cubicles 100 Activity will be encouraged by greater lighting levels, but cows need eight hours of low light levels for resting purposes.
Feed area 200 Greater light levels in feed passages can encourage feed intake.
Source: Clarke (2006).
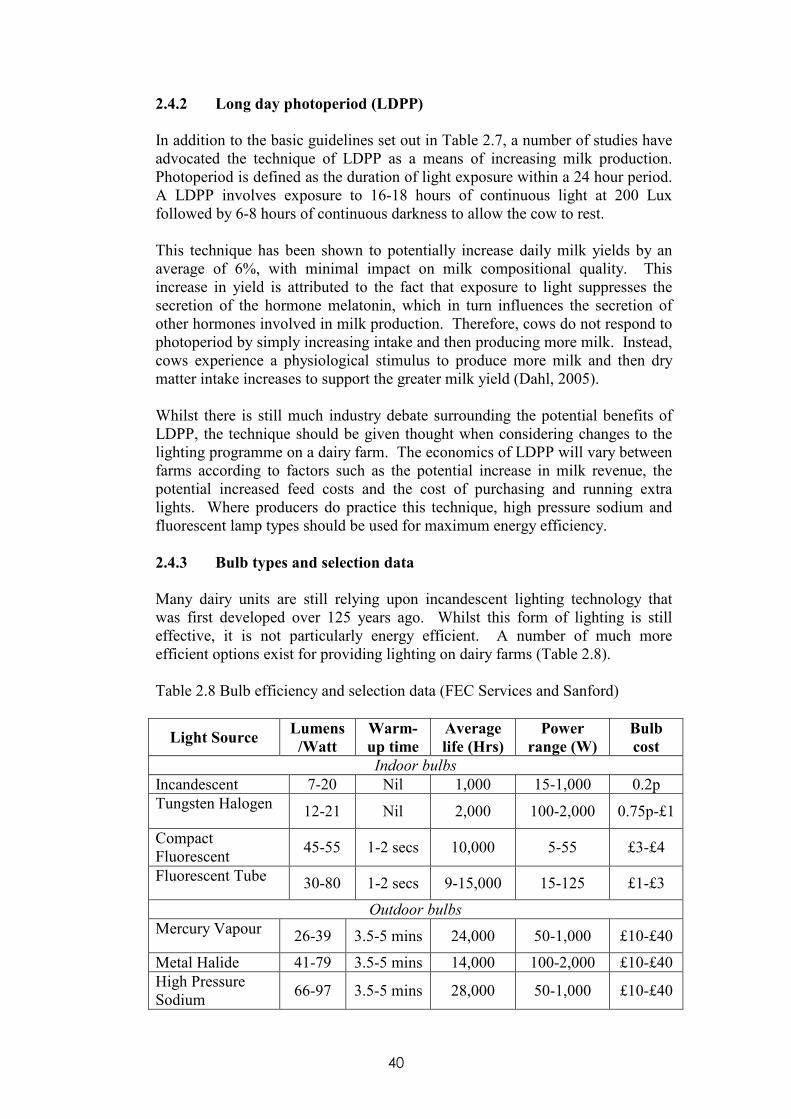
40
2.4.2 Long day photoperiod (LDPP)
In addition to the basic guidelines set out in Table 2.7, a number of studies have advocated the technique of LDPP as a means of increasing milk production. Photoperiod is defined as the duration of light exposure within a 24 hour period. A LDPP involves exposure to 16-18 hours of continuous light at 200 Lux followed by 6-8 hours of continuous darkness to allow the cow to rest. This technique has been shown to potentially increase daily milk yields by an average of 6%, with minimal impact on milk compositional quality. This increase in yield is attributed to the fact that exposure to light suppresses the secretion of the hormone melatonin, which in turn influences the secretion of other hormones involved in milk production. Therefore, cows do not respond to photoperiod by simply increasing intake and then producing more milk. Instead, cows experience a physiological stimulus to produce more milk and then dry matter intake increases to support the greater milk yield (Dahl, 2005). Whilst there is still much industry debate surrounding the potential benefits of LDPP, the technique should be given thought when considering changes to the lighting programme on a dairy farm. The economics of LDPP will vary between farms according to factors such as the potential increase in milk revenue, the potential increased feed costs and the cost of purchasing and running extra lights. Where producers do practice this technique, high pressure sodium and fluorescent lamp types should be used for maximum energy efficiency.
2.4.3 Bulb types and selection data Many dairy units are still relying upon incandescent lighting technology that was first developed over 125 years ago. Whilst this form of lighting is still effective, it is not particularly energy efficient. A number of much more efficient options exist for providing lighting on dairy farms (Table 2.8).
Table 2.8 Bulb efficiency and selection data (FEC Services and Sanford)
Light Source Lumens
/Watt
Warm-
up time
Average
life (Hrs)
Power
range (W)
Bulb
cost
Indoor bulbs
Incandescent 7-20 Nil 1,000 15-1,000 0.2p
Tungsten Halogen 12-21 Nil 2,000 100-2,000 0.75p-£1
Compact Fluorescent
45-55 1-2 secs 10,000 5-55 £3-£4
Fluorescent Tube 30-80 1-2 secs 9-15,000 15-125 £1-£3
Outdoor bulbs
Mercury Vapour 26-39 3.5-5 mins 24,000 50-1,000 £10-£40
Metal Halide 41-79 3.5-5 mins 14,000 100-2,000 £10-£40
High Pressure Sodium
66-97 3.5-5 mins 28,000 50-1,000 £10-£40

41
• Incandescent – Whilst the traditional light bulb is the cheapest option for farm lighting, it is only around 5% efficient at converting energy into light, with the remainder being wasted as heat energy. Incandescent/tungsten filament bulbs also feature the shortest life expectancy of all the options
• Tungsten Halogen – Although the efficiency of this bulb type is slightly higher than the traditional incandescent bulb, it is still relatively inefficient in comparison with other available types (Table 2.8). As a result this bulb type should only be used in situations where lighting is required for very short, intermittent periods only e.g. security lighting.
• Compact Fluorescent (CFL) – These lamps are designed to be a direct ‘plug-in’ replacement for traditional incandescent bulbs. Replacing traditional light bulbs with CFLs will yield energy and cost savings very easily, with CFLs typically using 25% of the power of incandescent lamps and lasting up to 10 times longer.
• Fluorescent Tube – Whilst most farms will feature fluorescent lighting of some kind, it is important to note that many types of fluorescent tube exist, each with differing efficiencies. Older tubes use a T12 (38mm diameter) design. These should be replaced with newer T8 (26mm diameter) tubes. T8 tubes incorporate a triphosphor coating on the inside of the tube and are 10-20% more efficient, with 50% greater life span.
• Mercury Vapour – Traditionally, high intensity discharge outdoor lights have featured mercury vapour bulbs. However, energy efficiency can be vastly improved by replacing these with newer metal halide and high pressure sodium lights.
• Metal Halide – These lamp types offer similar levels of efficiency to high pressure sodium types, but feature a lower average lifespan. However, metal halide lights produce a very high quality white light which is ideal for locations such as workshops and veterinary inspection areas.
• High Pressure Sodium – Although these lamps exhibit the highest bulb purchase cost, they offer the highest efficiency of all types. These bulbs act as direct replacements for tungsten halogen bulbs and can offer significant cost savings across their lifetime.
Source: www.lightbulbs-direct.com
The various energy saving lighting options are summarised in Table 2.9. As can be seen, even small changes to farm lighting can yield surprisingly high savings.

42
Table 2.9 Lighting Energy Conservation Measures and Savings
Light source Energy conservation measure % Energy savings
Incandescent Convert to halogen bulbs 20-38%
Incandescent Convert to compact fluorescent 75%
Incandescent Convert to fluorescent tubes 80-85%
Fluorescent T12 tube
Convert to fluorescent T8 tube 10-20%
Mercury Vapour
Convert to metal halide 43-54%
Mercury Vapour
Convert to High Pressure Sodium 44-59%
Source: Ludington et al (2004)
The following example demonstrates the potential financial benefits of changing bulb type where an intensive lighting policy is in operation (Table 2.10). Whilst the conversion of bulb types has the potential for significant savings across the farm, producers must also consider the cost of replacement bulbs and fittings when changing lamp type. For ‘plug-in’ replacements such as CFLs this is not a large issue, but may be more significant if changing to high pressure sodium lights for example. Table 2.10 Example of potential annual savings through improved lighting efficiency
Bulb type
Bulb
size
No.
bulbs
Running
time1
kWh £ 2
CO2
(t)3
Existing Incandescent 100W 10 16 h/day 5,840 571 3.07
Proposed CFL 25W 10 16 h/day 1,460 142 0.77
Annual Savings
4,380 428 2.30
1 Assumes all year round housing with intensive lighting regime 2 Assumes electricity price of 10.85p/kWh (standard) and 6.6p/kWh (off-peak), with 75% of usage occurring on the standard rate and 25% of usage occurring on the off-peak rate. 3 Based upon a CO2 conversion factor of 0.527kg/kWh (Defra, 2007).
2.4.4 Minimising lighting running times
Reducing lighting energy requirements on a dairy unit requires a two level approach, with the first level involving selection of the most appropriate lighting sources as discussed. The second aspect of this approach involves minimising the running times of lighting equipment. This can be done very easily and inexpensively and can often yield surprising results.
To avoid lights being left on when not needed, it is possible to fit timers and sensing devices. These can cost as little as £10, but cost will obviously increase in line with complexity. The simplest option is to fit a timing device which

43
switches the lights on and off at pre-set timings. Going one step further, it is possible to fit light or ‘dawn to dusk’ sensors which will ensure that lights are only switched on during periods of darkness. Another alternative is to fit motion sensors to the lighting devices, which are commonly applied to large outdoor lights such as security lights.
Another key area worth considering is maximizing the natural light. This can be achieved mainly through building design. For existing buildings, surprising results can be gained just from cleaning dirty roof panels, taking account of all necessary safety precautions. On a similar level, it is possible for light levels to fall by 30% in 2-3 years if lights are not kept adequately clean. Where new buildings are being considered, particular attention should be given to the orientation, height and roofing materials.
2.5 Water and effluent pumping The operation of any dairy farm is dependent on the availability of a large water supply. To deliver this supply, pumps with electrical motors are used extensively across farms for an array of uses which may include:
• Pumping water to drinking troughs
• Pumping water to wash troughs and water cylinders for circulation cleaning
• Pumping water to plate heat exchangers
• Supplying water to parlour volume wash hoses
• Supplying flood wash systems for cubicle shed passageways
• Pumping effluent to low-rate irrigators and other slurry management systems
Despite their extensive use across dairy units, pumping and piping systems are rarely designed with energy efficiency in mind. The energy efficiency of a water pumping system can be maximised through selection of an appropriately sized pump, high efficiency motor, optimum sizing of pipe work and adequate maintenance of all the system components.
2.5.1 Pump and motor selection
To maximise the efficiency of pumping equipment, producers must consider both the actual pump as well as the motor that is attached to it. Most pumps in operation on dairy units are of the centrifugal type, with typical pumping efficiencies of 50-70%. This means that 50-70% of the power inputted into the pump is converted into useful energy, with the remaining 30-50% converted to heat energy and wasted. Whilst newer pumps will feature slightly higher levels of efficiency than older designs, in most cases it is not economically viable to

44
replace existing pumps based on energy savings alone. However, in situations where existing pumps fail or extra pumps are required, the addition of a newer pump is likely to yield some energy savings. Motor efficiency has also seen advances in recent years. Since the introduction of Minimum Energy Performance Standards (MEPS) over 10 years ago, electrical motors are now classified as either EFF1 (High Efficiency), EFF2 (Standard Efficiency) or EFF3 (Low Efficiency) standard. Most new equipment is now supplied with EFF2 motors as standard. However, for the long term it may be worthwhile for producers to consider choosing an EFF1 standard motor instead, as these are typically 3-5% more efficient than the EFF2 specification. An EFF1 labelled motor currently commands a price premium of between 10 and 30% above that of an EFF2 labelled motor, although it is anticipated that this premium will reduce as sales of EFF1 motors increase in the future. As with the actual pump, it is often not economic to replace existing motors with higher efficiency types based on electricity savings alone. EFF1 specification motors should be considered however where replacements are required. As with vacuum and milk pumps, it is also possible to apply Variable Speed Drive (VSD) units to water pumps. The economics of this will be marginal unless the pumps are run for long periods of time and full capacity is not needed for much of this duration.
2.5.2 Pipe sizing and maintenance
In general, the energy required to move water through a pipe decreases as the diameter of the pipe increases. However, larger diameter pipes are typically more expensive than pipes with smaller diameters. When fitting pipelines, producers must therefore think about both the initial purchase cost of the pipe and also the long term running costs and strike a balance between these two factors. For the majority of situations on dairy farms, a water velocity of 1-2 metres per second (m/s) is likely to be the optimum (Morison et al, 2007). Research has shown that energy use does not vary significantly if the water velocity through the pipe is maintained in this range. At higher velocities however, there is likely to be a significant increase in the energy consumed by the pump motor. With these figures in mind, it should be possible for producers to consult their suppliers and calculate the required pipe diameter.
The following considerations should be made when installing a new water pumping system:
• Ensure that the pump is not oversized for the task in hand.
• Ensure that the pipe diameter matches the output of the pump.
• Eliminate all unnecessary sharp bends and elbows to reduce pressure loss
• Regularly check belt tension and alignment between pump and motor.
• Repair any leaking pipes or valves to maintain high pressure.

45
2.6 Other considerations
2.6.1 Ventilation
Effective ventilation is necessary to remove moisture and gases from animal housing to prevent disease, as well as minimising the risk of heat stress during the summer months. With an increasing number of herds housed all year round, the issue of ventilation is only set to increase in importance in the future. Heat stress in dairy cattle results in reduced dry matter intakes (DMI) as a result of reduced feeding times. With every 1kg reduction in DMI potentially reducing milk yield by two litres (Evans, 2007), it is essential that producers actively take steps to negate the risk of heat stress. Table 2.11 General operating efficiency of different fan types
Fan Type General operating
efficiency
Example
Basket Fan Low
Funnel Fan Moderate
Box Fan Moderate to High
High Volume Low Speed (HVLS)
High
Sources: www.jdmfg.com; www.hydor.co.uk; www.megafans.co.uk

46
Often very little thought is given to the energy efficiency of a ventilation system. However, for all-year-round housed herds ventilation systems may potentially be operating for large periods of time, using significant levels of energy. Different fan types can differ significantly in their general operating efficiency (Table 2.11). High volume low speed (HVLS) fans provide extremely efficient ventilation, but their design limits their use on UK dairy farms. Since HVLS fans range in diameter from eight to 20 feet, they are only suitable for large clear-span buildings with high roof pitches and wide bays. High volume low speed fans are therefore commonly seen in regions such as the USA rather than the UK. However, with increasing herd sizes and scale of buildings used on UK dairy units, it is likely that HVLS may become a consideration for some UK producers in the near future. Where HVLS fans can be incorporated into a building, they are typically located down the centre of the building approximately 50ft apart. To provide some context, it is estimated that when compared with High Speed fans, HVLS fans can move the same volume of air for around 30% of the energy cost.
The energy efficiency of any ventilation system can be affected by a multitude of factors, including: (Adapted from: Ludington et al, 2004)
• Motor efficiency. Producers may consider specifying high efficiency EFF1 motors which are typically 3-5% more efficient than standard fan motors.
• Blade design/shape. Straight blade designs tend to be more efficient than cloverleaf shaped blades and accumulate less dust.
• Fan diameter. A large diameter fan tends to have higher efficiency than a smaller diameter fan, since larger blades move more air per unit of energy. Subsequently, it is usually more efficient to operate one large fan rather than several smaller fans.
• Blade-to-housing clearance. Higher efficiency is usually seen where the gap between the blades and housing is small.
• Obstructions to airflow such as guards, motor drive etc.
• Level of natural ventilation, as determined by building height, location and cladding.
• Fan maintenance. Regular cleaning should be carried out, since it is estimated that the accumulation of as little as 3mm of dust on the fan blades can significantly reduce fan performance and efficiency. In addition, producers should ensure that damaged or misaligned blades are replaced and maintain adequate lubrication of bearings and other moving parts.
2.6.2 Compressed air systems
The use of compressed air in milking systems has increased dramatically in recent years due to the increased use of parlour automation devices such as automatic cluster removers, entry/exit gates and automatic sorting gates. Since electricity is used as the power source to produce compressed air, it is worthwhile considering the following measures to maximise system efficiency:

47
• Use a rotary screw type compressor as opposed to a reciprocating type.
• Where possible select the most efficient motor available according to EFF rating.
• Where compressed air systems have variable loads, consider fitting a VSD unit to the compressor motor to reduce motor running speed and prolong motor life. This option tends not to be economically viable unless very large air systems are in place.
• When installing new systems, pay close attention to the efficiency rating of the compressor in terms of output of air delivered at a specific pressure per input of electrical power to the motor.
• Eliminate system leaks. The most common sources of leaks include pipe joints, couplings, hoses and pressure regulators.
2.6.3 Parlour heating
Achieving adequate frost protection during the winter period is a major concern for any producer. However, rather than heating the entire parlour area to achieve frost protection, it is typically more efficient to install a low wattage trace heating system. These systems use small heating cables to raise the temperature of pipes by several degrees and are very efficient, typically using around three watts of electricity per foot run of pipe. In addition, self regulating trace heating systems can automatically adjust output according to the ambient temperature, thus reducing energy consumption further. Depending on the length of the pipelines, trace heating systems typically cost from £200 plus installation.
In addition to frost protection, many producers also employ heating systems to provide a comfortable working environment for the herdsman. Generally speaking, radiant heaters are much more efficient than space heating systems (DairyCo, 2009c) due to the open, draughty and un-insulated nature of milking parlours. Short-wave infrared heaters represent a good alternative, offering low running costs and immediate heat production on cold mornings.
2.6.4 Automatic scraping systems
Generally speaking, automatic scraping systems are relatively energy efficient, with drive units rarely having an electric motor in excess of 2.2kW (2.95hp). However, the length of time taken to remove slurry from the passage and the motor requirements can vary considerably depending on the system used. For example, hydraulic systems typically feature longer operating times and larger motors than comparable rope/chain/cable systems. Whilst the annual energy consumption of scraping systems is likely to pale into insignificance when compared with vacuum pumping and milk cooling, it is another consideration that should be made when contemplating a new system.

48
2.6.5 Farmhouse energy efficiency On a large proportion of dairy farms, it is not uncommon for the farmhouse to share the same electricity meter as the dairy buildings. This obviously makes it difficult to assess the efficiency of the dairy unit as a stand-alone unit and high household energy usage can cover-up what is actually an efficient dairy business. To accurately ascertain the energy consumption of the dairy enterprise, it is worthwhile fitting separate electricity meters for the farmhouse and dairy buildings, as well as any other enterprises on the farm. Because farmhouses tend to be much older than other domestic properties they tend to be relatively inefficient. Efficiency can be improved drastically via measures such as roof insulation, draught proofing, insulation of hot water cylinders and the installation of modern thermostats. More detailed information on this subject can be found by visiting the Energy Saving Trust website on www.energysavingtrust.org.uk.

49
3 RENEWABLE ENERGY TECHNOLOGIES WITH
POTENTIAL FOR DAIRY UNITS
3.1 Background
Concern about climate change, fossil fuel reserves and energy security is driving the development and uptake of renewable energy technologies to generate electricity, heat and transport fuel. Renewable energy offers a significant opportunity for farms to diversify their production while at the same time reducing their own energy costs and improving their environmental performance. For individual businesses the rising and unstable costs of energy means that the exploration of cheaper but reliable, alternatives becomes more attractive. This particularly applies in more remote rural areas where often mains gas and occasionally mains electricity are less available and where transport and connection costs are prohibitive and can undermine business competitiveness.
Farms are uniquely placed to make the most of renewable energy sources e.g. wind, solar radiation, biomass, micro-hydro etc. There are a number of examples where famers in the UK have successfully installed renewable energy equipment with the benefit of reducing their reliance on fossil fuels and reducing their energy bills. In addition, income can be gained from the sale of electricity to the grid but also under future government proposals from the production of both renewable electricity and heat.
The installation of renewable energy equipment can have the following benefits:
•••• Contribute to the achievement of regional and national targets for the generation of energy from renewable resources, and reductions in CO2 emissions.
•••• Maximise economic benefits from the exploitation of commercial opportunities arising from renewable energy.
•••• Helping dairy farms and businesses to benefit from schemes that provide sustainable, affordable and reliable energy from locally available resources.
There is generally a lack of awareness of the range of renewable energy
technologies available and of the economic and environmental benefits associated with these. In addition to which many technologies are associated with perceived high capital and running costs. The most important considerations for renewable energy technologies are the capital and operational costs. Dairy farms have considerable advantages in that they are high energy users with a relatively constant demand for electricity and heat throughout the year.

50
3.2 Anaerobic Digestion (AD)
Summary
Anaerobic Digestion is the fermentation of biomass with relatively high moisture content under controlled anaerobic conditions to produce biogas which can be used for heat and power production. It is a technology with particular value for a dairy farmer as it can assist with manure management in addition to generating energy. The liquid digestate has considerable value as a fertiliser thereby reducing reliance on inorganic fertilisers. There are only a small number of on-farm AD systems in the UK but this will increase rapidly in the near future with changes to the financial support mechanism and the development of a UK AD supply chain. Dairy slurry has a low biogas yield so there is considerable value in utilising a range of other feedstocks which can in some cases attract a gate fee and significantly improve the economics of the system and reduce the payback period. There are a number of manufacturers and installers helping develop the market in the UK but a major limitation is the very high capital costs for such a system
3.2.1 The process and equipment
Anaerobic Digestion is a microbial process which breaks down organic matter into simpler chemical components in the absence of oxygen, resulting in the production of biogas together with liquid and solid digestate (Fig 3.1). It is essentially a fermentation process and produces a product biogas which is a mixture of CH4 (~60%) and CO2 (~40%) with traces of hydrogen sulphide (0-1.5%) and ammonia (0-0.5%). It is the same biological process that occurs in a landfill site but under controlled conditions in a digester whereby the biogas is contained rather than released into the atmosphere. It is a simple process to obtain CH4 from decomposing organic matter but the complexity arises in optimising and maintaining microbial activity in a controlled environment over a long period of time.
Fig 3.1 Schematic diagram of anaerobic digestion process (Source: NNFCC).

51
Anaerobic Digestion is a four-stage process i.e. hydrolysis, acidification, acetogenesis and methanogenesis (Fig 3.2). In the first phase anaerobic bacteria break down organic substrates such as proteins, carbohydrates, cellulose and fats into low molecular compounds. During the second phase acid forming bacteria continue the decomposition process into volatile fatty acids (VFAs), organic acids, CO2, hydrogen sulphide and ammonia, the formation of the various acids results in a lowering of the pH (which can limit the final methanogenesis stage). During the acetogenesis phase acid bacteria form acetate, CO2 and hydrogen from the VFAs. The methanogenesis phase involves CH4 forming bacteria producing CH4, CO2 and alkaline water and has an optimum pH range of 6.5-7.5. Several compounds exhibit a toxic effect and adversely affect methanogenesis e.g. VFAs, ammonia, heavy metals, sulphide and cations such as Na+, K+ and Ca++.
Fig 3.2 The key stages of anaerobic digestion
Types of system The digestion process can be classified in relation to the temperature (mesophilic or thermophilic), rate, process (batch or continuous), design, and by the number of stages (single or multi-stage).
Mesophilic and thermophilic systems In mesophilic digestion the digester is heated to 30-35oC and the feedstock remains in the digester for typically 15-30 days residence time (the time needed to achieve complete degradation of the organic matter). This tends to be more robust and tolerant than the thermophilic process but gas production is less, larger digestion tanks are required and sanitisation (to remove bugs) if required is a separate process. Mesophilic digestion is the most common approach since it is more reliable and plant management is easier.
By contrast in thermophilic digestion the digester is heated to 50-600C and the residence time is typically 12-14 days. Thermophilic digestion offers higher methane production (via higher substrate utilisation and growth rates), faster throughput, better pathogen kill but requires more expensive technology, greater energy input and a higher degree of sensitivity to operating and environmental variables. In addition thermophilic systems result in higher volatile fatty acid concentrations especially propionate.

52
Low and high rate systems Anaerobic Digestion is divided into ‘low rate’ systems in which long hydraulic retention times are applied and ‘high rate’ systems in which hydraulic retention time is relatively short. Low rate systems are mainly used for waste streams such as slurries and solid waste which require a long retention time for sufficient anaerobic degradation. High rate systems are mainly used where feedstocks are very dilute e.g. for waste water treatment with <1% solids. Examples of low rate systems are Batch, Accumulation, Plug flow and Continuously Stirred Tank Reactor (CSTR) systems. Examples of high rate systems are: Contact Process, Anaerobic Filter, Fluidised Bed and Upflow Anaerobic Sludge Bed (UASB)/ Expanded Granular Sludge Bed (EGSB). The most common form of ‘low rate’ system is the Continuously Stirred Tank Reactor (CSTR) system (basically a heated tank with a stirrer). Feed is introduced into the reactor which is stirred continuously to ensure complete mixing of the contents and at the same time an equal quantity of effluent is removed from the reactor. Mixing creates a homogenous substrate ensuring that the solids remain in suspension and preventing the stratification and formation of a surface crust. Mixing within the digester improves the contact between the micro-organisms and substrate and also prevents the formation of scum and temperature gradients within the digester. However, excessive mixing can disrupt the micro-organisms and therefore slow and intermittent mixing is preferred. Digester volumes can range from 100m3 to several thousand cubic metres.
Batch and continuous systems In a Batch System the digester is filled at the start of the process with a disadvantage being that separate influent and effluent tanks are required. Generally, approximately 15% of the contents are left in the digester to enhance the start-up process for the next batch. Batch-type digesters are the simplest to build and their operation consists of loading the digester with organic materials, allowing it to digest, then removing the effluent and repeating the process. In a continuous digester, organic material is regularly fed into the digester and the material moves through the digester. Continuous digesters produce biogas without the interruption of loading material and unloading effluent. The majority of digesters are continuous flow systems rather than batch systems, as they have a higher gas yield, lower operating costs and lower management requirements with the only downside being a higher capital cost (Redman, 2008).
System Designs The three main designs for farm-based digesters are the Covered Anaerobic Lagoon, Plug-flow, and Continually Stirred Tank Reactor (CSTR), (Lazarus, 2009). Plug-flow digesters are unmixed systems in which undiluted manure flows semi-continuously as a plug through a horizontal reactor (Giesy et al, 2005). Plug-flow digesters are technically simple and work best for total solids (TS) of 10–14 %, and they are good for cattle manure that does not have much

53
additional water, i.e. from scraped manure operations. Continually Stirred Tank Reactors where the contents are mixed by mechanical agitation, are better for TS of 2-10%, which includes feedstocks such as swine manure, processing wastes as well as dairy manure. A CSTR-system is characterized by a constant supply of fresh manure as well as by a constant removal of digested material. A Covered Lagoon Digester is simply a manure lagoon with an impermeable cover, which traps gas produced during decomposition of the manure. Covered lagoons typically handle a solids content of < 2%, and therefore are more suited to flushed manure operations. There are many variations to these basic designs, developed in order to enhance biogas output and deal with varying moisture levels and other digestate characteristics.
Single and Multi Stage Systems Anaerobic Digestion systems can also be classified into single-stage (single reactor vessel), and multi-stage systems. Multi-stage processes aim to improve the control of the process, with each stage of digestion separated so that optimum conditions can be achieved. Multi-stage systems are now becoming more common on farms in Germany because of the increased efficiency of the digestion process. Multi-stage systems work on the basis that AD involves a number of individual processes with differing optimal conditions, and a single reactor vessel does not provide the optimum conditions for the different processes. In single stage digesters, the entire process occurs in one reactor but the stages in the process are separated in time, while multi-stage digesters separate the acetogenesis and methanogenesis stages in space by using two or more reactors (Verma, 2002). A multiple digester has a higher biogas yield as it is likely to be more fully digested. However, it takes up more space on the farm, requires more maintenance and more management time, and has more expensive capital and operating costs (Redman, 2008). Most systems operating on farms in Germany are single or two-stage systems.
3.2.2 Feedstocks The process is particularly useful for wet biomass and residues which are less suited to thermal conversion processes because transport and drying would require large energy inputs. The following feedstocks are particularly suited to anaerobic digestion:
• Cattle and pig (manure and slurry)
• Poultry manure
• Silage effluent
• Industrial waste from: food, brewing and soft drinks, distillery, pulp and paper, chemical industries etc
• Sewage sludge
• Organic fraction of MSW (Municipal Solid Waste)
The feedstocks most commonly used are agricultural manures, residues, food processing wastes and increasingly specifically grown energy crops. Additional organic waste streams like industrial, food and municipal wastes are

54
increasingly being co-digested in centralised anaerobic digestion (CAD) systems. Before being digested, the feedstock has to undergo pre-treatment and there are a range of options depending on the feedstock. The purpose of such pre-treatment is to mix different feedstocks, to add water if required to produce a better digestate quality and increase the surface area of materials therefore enabling a more efficient digestion process. Digestion is more efficient if there is a uniform particle size of feedstock (IEA, 2001). Particle size must be below 12mm as part of the EU Animal By-Products Regulation (ABP) EC1774/2002 for plants that use ABP category II and III as a feedstock. This can be achieved via mechanical shredding, drumming or pulping (IEA, 2001). Some feedstocks require sterilization which is the case for AD of animal by-products (ABP) where substrates will need to be heated to 70°C for one hour as pre-treatment (Kirchmayr et al, 2003). Manure needs no pre-treatment before digestion according to ABP regulations.
Biogas yield Biogas yield depends on:
• Digestability of the organic matter
• Rate of breakdown
• Retention time in the digester
• Digestion temperature
A useful parameter to evaluate substrates for anaerobic digestion is the anaerobic biodegradability which is measured by the total amount of methane produced during a retention time of at least 50 days. Biogas production from organic substrates mainly depends on their content of substances that can be degraded to CH4 and CO2. Composition e.g. crude protein, crude fat, cellulose and hemi-cellulose and degradability are key factors for methane yield. The nature of the feedstocks used influences the retention time of the material in the digester as the lower the degradation rate of the feedstock the longer the retention time. The degradation rate of the main organic compounds increases in the following order:
cellulose >hemicellulose >protein >fat >carbohydrate
Feedstocks containing higher concentrations of fats therefore require lower retention times than those that contain larger amounts of cellulose and hemicellulose.
To ensure good levels of gas production it is important to maintain a carbon to nitrogen ratio of 20-30:1. When the C:N ratio is too wide, carbon can not optimally be converted to CH4 and the methane production potential is not fully achieved. A higher than 30:1 C:N ratio results in lower gas production whilst a lower than 20:1 ratio results in ammonia (NH3) build up and a high pH (>8.5) sufficient to kill the methane producing bacteria (methanogens).

55
Animal slurries have a very low biogas yield when compared with solid animal manures and biomass crops/vegetable matter (Table 3.1) due to their lower dry matter content. Animal slurries have lower dry matter content than animal manure with resulting lower biogas potential. In order to increase biogas yields vegetative plant material needs to be co-digested with the animal slurry, which is what is happening on many German farms at present. Biogas yield from silage e.g. maize and grass is very high because they contain large quantities of volatile fatty acids which are precursors of methane production.
Table 3.1 Biogas production and energy outputs from various feedstocks (adapted from Kottner 2004)
Dry
matter% Organic
matter % Biogas yield
M3/t substrate
CH4
%
Dairy cow slurry* 8 85 20 55
Fattening cattle slurry 10 85 34 55
Pig slurry 5 85 18 60
Chicken manure 25 75 93 65
Vegetable residues 6 87 35 56
Potato trimmings 10 - 70 -
Rapeseed meal 91 93 612 63
Whole crop silage 40 94 195 53
Maize silage 33 - 210 54
Grass silage 35 89 183 54
Food processing waste 15 - 45 -
Glycerol 80 - 580 -
* One dairy cow taken to produce 1.59 m3 per month of slurry (1m3 = approx.1t)
3.2.3 Applications and technology development
In the past AD has in the UK primarily been regarded as a waste management rather than an energy generating technology. The technology for AD is most advanced with liquid and semi-liquid slurries although there is considerable potential and some experience with MSW. Anaerobic digestion is well suited to decentralised energy production in small-scale installations where biomass or wastes are available. Both capital costs and operating costs are high and when just used for the purpose of manure management the technology has not proved to be economically viable. An AD project is more likely to be financially viable when treated as part of an integrated system where income can be generated from the sale of electricity, heat (via the proposed Renewable Heat Incentive) liquor and fibre products. Equally, financial savings can be made through the use of products on-site and hence reducing the costs of synthetic fertilisers, soil conditioners and energy from other sources. Since 1990 the number of biogas installations in German agriculture has increased rapidly so that by the end of 2007 the number of installations had increased to in excess of 3700 systems producing in excess of 500MW of electricity per annum ( Table 3.3). This is mainly attributed to the feed-in tariff bonus for generation from energy crops (German Renewable Energy Act of

56
2004 which is designed to encourage farmers to generate electricity from animal wastes and energy crops that they produce themselves). Although the UK has significant biogas generation capacity reflecting the long history of sewage sludge digestion and landfill gas production there is limited biogas production from agriculture (Table 3.2). The UK Government aims to establish 100 commercial and 1,000 on-farm digesters by 2020 (DEFRA 2009). AD plants have considerable potential to reduce GHG emissions but the scale of this reduction is variable depending on type of feedstock, system, use of outputs, digestate application system, manure storage systems employed on farm etc.
Table 3.2: Numbers of biogas plants globally (Kıttner, 2005)
Country Agricultural AD
plants
Installed
Capacity (MWe)
Austria 309 69
Belgium 6 12.3
Denmark 60 on farm, 20 CAD 40
France 3 n/a
Germany 3,700 550
Great Britain <20 <2
Ireland 5 0.2
Italy 80 62
Netherlands 12 3.8
Switzerland 71 n/a
Sweden 7 n/a
TOTAL Europe 4,360 ~750
China* >15million ???
India* >4million ???
* The majority of AD plants in China and India are small scale units which are not used to produce electricity but in which the biogas is used for heating and cooking.
Scale of plant There are a range of scales of AD plants used on farms which can range from a single unit on a farm where the feedstocks are entirely supplied by that farm to a CAD. For small units a minimum number of livestock units (LSU) will be required in order for the capital costs of the system to benefit from economies of scale (Section 3.2.5). There is considerably more potential for co-operative enterprises between a small number e.g. four to five farmers within a close geographical proximity who all contribute materials to the plant and in return

57
use the digestate on their land while sharing costs and revenues. The final scale of system is that of Centralised Anaerobic Digestion (CAD) which uses a central location to handle a number of wastes from different sources. A CAD plant is very much dependant on the availability of nearby food wastes but benefits from the potential of attracting gate fees for wastes utilised.
3.2.4 Outputs
Heat and electricity
The amount of biogas produced is very much limited by the size and operating conditions of the digester as discussed previously. Up to one third of the biogas generated by an AD system will be needed to maintain the heat of the digester (depending on climate and technical specifications) with the remaining two-thirds being surplus and therefore available for different uses. The biogas can be burnt in a gas turbine or an internal combustion engine to generate electricity (Anaerobic Digestion Systems, 2009). As the biogas is burnt, it converts the chemical energy stored in the methane into mechanical energy, spins a turbine, and produces electricity. Waste heat from these engines can be recovered to provide heating or hot water for use on farm. Alternatively, a Combined Heat and Power (CHP) system can be installed to gain better efficiency of power use. Such a system uses the heat generated in the form of a district heating scheme to provide both hot water and space heating.
Dairy units generally have a limited demand for heat but integration within a farming enterprise where heat can be utilised in grain drying, space heating for domestic and office units etc are important considerations as is the limited demand for heat during the summer months. There is considerable potential for electricity generation in the UK through gas turbines which are more efficient in larger scale plants. There are however inherent limitations in the size of the equipment required compared with the amount of gas produced on farm and it is therefore unlikely that sufficient gas will be produced to warrant power generation by gas turbines on farm. The greatest potential for growth seems to be on a smaller scale using small reciprocating engines which have a high maintenance requirement with the most likely use on isolated farms and homesteads. The efficiency of conversion into electricity is only in the order of 35-40% of input energy for large biogas plants while for small on-farm biogas plants with an engine in the range of 10-50 kWe these operate at lower engine efficiencies in the order of 25%. 1m3 of biogas (at an assumed 20MJ/m3) would typically give:
M3 Biogas Net Electricity Gross Heat Net Heat Heat Only
1m3 1.7kWh 3.0kWh 2.0kWh 2.5kWh
Assumes: Electricity conversion efficiency = 30%
Heat only conversion efficiency = 70%
58
Note: These figures are for fresh wastes and storing wastes for a long period of time will reduce the efficiency of biogas production.
Other biogas applications The hydrogen sulphide content in biogas is 300-500ppm and in some engines must be reduced to 100ppm or lower, as it is corrosive and damages the energy generation equipment (Holm-Nielsen et al 2009). Biogas when used instead of compressed natural gas to power gas vehicles, offers excellent air quality benefits as well as carbon savings. Water scrubbing, chemical absorption and Pressure Swing Adsorption are the most widely used techniques for upgrading biogas to vehicle fuel quality (the gas must also be pressurised to ~200 bars before it can be used). The energy content of biogas is lower than that of natural gas due to the high carbon dioxide content of the biogas. The energy content of biogas containing 55-75 vol % methane is about 25MJ/Nm3 and ranges from 22-30 MJ/Nm3 (Nm3 represents the volume under normal conditions i.e. 0oC and atmospheric pressure). There is also considerable interest in many countries in supplying biogas into the Natural Gas Grid. For this the biogas needs most of the CO2 removed as Natural Gas has a methane content of about 97% and a calorific value higher than biogas at about 40 MJ/m3. Currently two technologies are being used for CO2 removal in large-scale applications; pressure swing adsorption (PSA) and water scrubbing. The PSA process employs carbon molecular sieves while water scrubbing makes use of the different solubilities of carbon dioxide and methane in water. Both technologies yield a gas stream with >96% methane which may be fed into the natural gas grid. Additional options for biogas upgrading currently under development are membrane and absorption processes which use physical or chemical absorbents like ethylene glycol or dimethylamine for the removal of carbon dioxide. Biogas is already being injected into the gas grid in France, Germany, Austria and in the U.S.A in New York.
Digestates
The digestates produced by the AD process represent potentially valuable by-products i.e. nutrient-rich liquid (liquor) and solid fibrous material (fibre). The residual digestate can be stored and then applied to the land without further treatment or separated to produce fibre and liquor. The fibre can be used as a soil conditioner or compost and the nutrient-rich liquid as a fertiliser. The liquor has a low level but diverse range of nutrients and can be used as a liquid fertiliser in a planned fertiliser regime. A comparison of the nutrient value of both pig and cattle slurries and their respective digestates (Chadwick 2007) showed that total N and phosphate (P2O5) were similar but that pH and NH4-N were both higher following digestion thereby enhancing nutritional value (Table 3.3). The P2O5 values remain the

59
same pre- and post-digestion at 1.2 mg/l and 2.0 mg/l for dairy and pig slurry respectively. Table 3.3 Comparison of nutrient values of slurries and the associated digestates (Chadwick 2007)
DM%
Total N
Kg/m3
NH4-N
Kg/m3
pH BOD
Dairy slurry
6.0 3.0 1.5 7.5 10000
Digestate 4.5 3.0 1.9 8.0 7000
Pig slurry 4.0 4.0 2.4 7.5 20000
Digestate 3.0 4.0 3.0 8.0 14000
The trend towards higher fertiliser prices as a result of increased gas and oil prices (basic raw material for ammonia production) means that to maintain productivity on farm more effort needs to be taken to utilise nutrients from animal waste as part of a crop nutrient management plan. Anaerobic digestion enables energy production and improved utilisation of nutrients. Nutrient value of the bio-fertiliser can be enhanced by co-digestion with other waste materials such as food waste and blood. Table 3.4 – Plant Nutrient content of an average digestate (modified from
Redman, 2008)
Fertiliser £/kg nutrient Kg nutrient/t of
digestate
Value per tonne
digestate (£)
Nitrogen 1.591 4.0 6.36
Phosphate 0.982 1.0 0.98
Potassium 1.003 0.2 0.20
Total Fertiliser Value per tonne of digestate 7.54
Assumes: 1 UK AN at 55p/kg @ 34.5% content 2 P205 at 45p/kg @ 46% content 3 MOP at 60p/kg @ 60% content
The solid digestate when separated has a low nutrient content and therefore can be used as a soil conditioner. In some cases it can be used as an alternative to peat. The value of the solid digestate can be increased by aerobic composting following AD to produce a potting compost/growing medium but needs access to local markets if it is to generate income.
3.2.5 Costs The main barriers to the uptake of AD plants in the UK are the large capital and operational costs. The AD plant can become more financially viable if it

60
generates several income and cost saving streams and is part of an integrated waste management system. The location of the plant is important to minimise transport costs of feedstocks and digestates. The specific location of the plant within a site can also have a significant bearing on civil engineering costs for the plant installation. The type, design and size of the digesters will vary according to the specific needs of the installation, therefore it is difficult to accurately estimate the capital cost of a plant. The design of the plant will be specific to each installation and it is recommended to obtain quotes from experienced AD engineering companies, most of which are European but operate through UK appointed agents or recently established subsidiaries. The capital cost of an anaerobic digester plant is estimated by British Biogen’s Good Practice Guidelines at between £3,000 and £7,000 per kW of electricity generating capacity, depending on the size of the plant (the larger the plant the lower the cost per kW). The labour required to operate and control the digester in a plant of less than 100kW will be minimal, about one hour per day, and the farmer will do this himself. Maintenance costs for a digester are currently budgeted at 1-2% of the capital cost of the digester, for a well-constructed AD plant (Redman, 2008). Maintenance costs for CHP equipment are currently estimated at 0.6p/kWh (CHP Focus, 2008). Indicative costs and returns for an AD system can be derived by inputting feedstock provision into the NNFCC AD calculator (www.nnfcc.co.uk). In this study a range of options for small, medium and large dairy units (100, 250 and 500 cows) together with varying inputs of grass silage (30, 50 and 100 ha) are considered. Table 3.5 Costs and returns from 3 different AD scenarios (£’000s)
3.2.6 Legislative requirements.
There are a number of legislative requirements that need to be considered with respect to AD. Planning will be considered later in this document in Section 4.4.
Feedstock
input
Biogas
yield
M3
Capaci
ty
kW
Capital
cost
Cost p.a.
Income
p.a.
Profi
t/
(Los
s)
Years
payback
100 cows 30ha
243,570
60
758
123
119
(4)
-
250 cows 50ha
438,925
110
1,058
166
190
23
45.5
500 cows 100ha
877,849
210
1,308
234
348
113
11.5

61
3.2.6.1 Animal by-product regulations
The main regulations impacting upon plant design are the Animal By-Product or Category 3 Waste Regulation 1774/2002 and the Environmental Permit which replaces the IPPC Regulation of 2000. If animal by-products (abbatoir waste, catering waste or out of date food) are used as a feedstock for AD then an Animal By-Product Regulation (ABPR) licence is required. There are three categories of material covered under ABPR regulations: Category 1 (animals infected or at high risk from hazardous diseases such as BSE) which cannot be used in an AD plant under any circumstances, Category 2 (high risk parts of a carcass such as spinal column and brain tissues) which can only be used after rendering at 133oC for 20 minutes and low risk Category 3 material which needs to be pasteurised (70oC for 1 hour or 57oC for 5 hours) prior to use.
3.2.6.2 Environmental Permitting Regulations
The environmental performance of the plant is covered by the Environmental Permitting Regulations (EPR) which covers emissions (air, land and water), energy efficiency, noise, prevention of accidents, Health and Safety and final restoration of the site upon closure. The Environmental Permit Regulations came into force on April 6th 2008 and combined the previously required PPC (Pollution Prevention and Control) and WML (Waste Management Licence) applications. Completing an Environmental Permit is done via the Environment Agency website. The application is assessed in terms of a number of criteria and a ‘Low Impact installation’ has a lower monitoring and regulation requirement together with attracting lower application and subsistence fees.
3.2.6.3 Digestate application to land
The Environment Agency, in conjunction with WRAP, has developed a specific Quality Protocol (PAS110) for the use of digestate from the Anaerobic Digestion of bio-waste. The Quality Protocol is designed to protect human health and the environment by describing acceptable good practice for the use of quality digestate in agriculture, horticulture, forestry and land restoration. It enables the application of digestate of approved quality to agricultural land without the requirement for an environmental permit.
3.2.6.4 European Nitrates Directive The Nitrates Directive was adopted by the European Union in 1991 and requires all Member States to designate as Nitrate Vulnerable Zones (NVZs) all land draining to waters that are affected by nitrate pollution. The aim is to reduce water pollution caused by nitrogen from agricultural sources and to prevent such pollution in the future. The Nitrate Vulnerable Zone scheme is in effect a voluntary code of good agricultural practice followed by farmers but in the UK is a Statutory Management Requirement (SMR) for cross compliance under the Single Farm Payment Scheme. Initially 8% of land area covering some 600,000 hectares in England was designated as NVZ in 1996 and this was

62
increased by a further 47% in December 2002. This was again further increased to about 70% of land area in England as of 1st January 2009. The new NVZ guidelines (SI2008/2349) require farms to provide sufficient storage facilities to store all slurry produced by livestock for a period of six months for pigs and poultry and five months for cattle. This represents additional storage required by many farmers where an AD plant can help in providing this additional storage capacity. The additional manure storage capacity requirement comes into force from 1 January 2012.
3.3 Biomass heat and CHP
Summary A wide range of feedstocks are available from a variety of sources for the generation of energy via the thermal combustion of biomass: - On-farm woodland; - purposely grown energy crops; - bought in wood chip/pellet. Biomass boilers are becoming more common on farms in the UK as the potential of such systems becomes realised and also as a result of rapidly increasing fossil fuel prices in recent years. Biomass boilers are more expensive than gas or oil boilers but the reduced fuel cost means that payback period in many cases is less than five years. Biomass boilers are of limited value within a dairy unit due to the low heat requirement but of considerable value within a wider farm context where additional space heating is required and access to the Natural Gas Grid is limited. Combined Heat and Power (CHP) has the potential to be of value within dairy units but at present systems are not proven at the scale of operation unless there is the potential to supply surplus electricity to the grid and to efficiently utilise the heat output.
3.3.1 The process and equipment
In a biomass boiler wood chips or pellets are burned with air in a combustion chamber. The hot gases produced by combustion pass into a heat exchanger (Fig 3.3), where they cool and transfer heat to another fluid. In the case of a heating plant, such as for district heating, this fluid is water that is pumped through the heat exchanger and circulated to distribute the heat. The cooled gases are then cleaned to remove particulates and other pollutants before being emitted to the atmosphere through a chimney or stack.

63
Fig 3.3 Heat only combustion plant Typically up to 90% of the Net Calorific Value of the fuel can be recovered as heat; the proportion is higher if a condensing heat exchanger is used. Most of the non-combustible part of the fuel (primarily minerals) leaves the combustion chamber as bottom ash. Finer particles are removed in the gas cleaning stage, along with any material injected to clean the gases, as fly ash. Bottom ash and fly ash are commonly handled and disposed of separately. More information on combustion technology and design can be obtained from the Carbon Trust report on Biomass Heating (2009) which is available at www.carbontrust.co.uk. Biomass boilers are robust and highly engineered but wood fuel delivery and storage systems are large and costly. Set up basically involves a combustion zone, heat transfer section (hot gas to hot water heat exchanger), a fuel conveyor system and a control panel (Fig 3.4).
Fig 3.4 Biomass boiler set up

64
3.3.2 Feedstocks Biomass can be differentiated in terms of woody and non-woody. Woody biomass can consist of the following:
• Forestry residues e.g. small branches and tree tops that are usually left on the ground when trees are felled and can provide an alternative source of income from forestry.
• Small round wood – as a result of its size the wood is unsuitable for traditional uses (such as structural timber, furniture or pallet making). Offers great potential as a feedstock for heat and power generation. At present used for making paper and various kinds of board.
• Industrial wood e.g. sawmill residues, furniture manufacturing waste etc (much of which at present is sent to landfill). The use of sawmill residues would be in direct competition with its already existing use in chipboard manufacture.
• Energy crops which are specifically grown for heat and electricity production e.g. short-rotation coppice (SRC) species like willow and poplar.
• Municipal arisings of a woody nature (from local councils) of which generally 70% will be unsuitable for energy use but can be composted while the other 30% could be used to produce energy.
At present only 40% of the annual increment in England’s woodlands is harvested and utilised within existing markets. There exists considerable potential to increase the supply of biomass from woodland. In their report A Woodfuel Strategy for England by the Forestry Commission (2007) a target was set to bring an additional two million tonnes of material to market by 2020 which represents 50% of the estimated non harvested material available in English woodlands. Generally a biomass boiler will handle fuel with up to 50% moisture content but to maximise the efficiency of the fuel, then a moisture content of 20% is recommended. Fuel with a high moisture content e.g. 50% has a Net Calorific Value about half that of fuel at 25% moisture content (Fig 3.5). Water content strongly influences the efficiency of energy transformation. If water content is high then a large share of the released thermal energy is needed to vaporise water during combustion thus reducing the net energy gain. Energy used to vaporise water can only be recovered in combustion installations equipped with a flue gas condensation unit.

65
0
5
10
15
20
0 20 40 60 80
Moisture content (%)
Cal
ori
fic
val
ue
(GJ/
t o
r M
J/k
g)
Fig 3.5 Effect of moisture content on the heating value of wood To get the maximum energy, materials need to be dried as the amount of energy varies with the moisture content of the material. The fuel used in a biomass boiler can either be wood chips or wood pellets where the latter offer a higher density and more uniform fuel type but with the disadvantage of additional processing and energy requirements. Freshly cut wood chips have a moisture content of between 50 and 60% and if stored without ventilation or active drying, rapidly decompose losing dry matter at rates of up to 3% per month (Mitchell 1995). Fungal development also creates health and safety problems for workers when handling older chip piles. Systems need to be found which minimise dry-matter loss and reduce the incidence of fungal spores whilst remaining cost-effective. Safe storage of chips is possible using carefully constructed, ventilated and covered piles or by actively drying the wood chips with either hot or cold air.
The use of wood pellets (Fig 3.6) provides a standardised fuel source which is more compact (less storage space and transport requirements) and flows more easily avoiding problems associated with the delivery of woodchip into some biomass boilers. Compacting sawdust at high pressure increases the temperature of the wood and the lignin melts slightly forming a natural 'glue' that holds the pellet together as it cools. Wood pellets (4.7 kWh/kg) are high calorific value when compared with woodchip (2-4 kWh/kg), coal (8.1 kWh/kg) and oil (11.5 kWh/kg) and therefore require less storage space. Despite the greater cost and energy content of wood pellets compared with chips, if biomass is to have a significant penetration into the domestic market the convenience of pellets is likely to make this the dominant technology in the UK. The energy density of woodchips (high volume, low density material requiring large storage facility for large installations) renders extended transportation inappropriate, which would impose size restrictions on installations (in Austria and Denmark installations all use supplies from within 10-15km). Although there is an energy cost in pellet production they are said to give better combustion and handling properties with the major advantage that a quality labelling and tracking system i.e. a European standard (DIN 51731) guarantees quality.

66
Fig 3.6 Wood pellets
Wood fuel heating systems can achieve significant reductions in total emissions of greenhouse gases principally CO2, CH4 and N2O. Life-cycle assessment analysis (which looks at the entire production and usage chain i.e. cradle-to-grave) shows that in comparison with LPG and oil-fired heating, wood fuel heating systems can deliver savings of between 80 and 96% in greenhouse gases (Table 3.6). Largest savings of 89 to 96% are made with the replacement of electric heating systems with smaller savings of 73 to 90% when replacing gas heating systems. Even when very large transportation distances are involved positive and significant reductions can be made. Table 3.6: Comparison of CO2 emissions from a range of fuel types for heat generation (Source: Woodfuel Meets the Challenge www.forestresearch.gov.uk)
Fuel type Percentage
efficiency Emissions
kg CO2 /
kWh
Wood chips 85+ 0.025
Wood pellets 90+ 0.025
Coal – central heating boilers 60 0.291
Mains gas – condensing boilers 90 0.194
Oil – condensing boilers 90+ 0.265
3.3.3 Applications and technology development
Biomass energy is well established in several European countries as the technology is proven and the benefits demonstrated; but so far uptake in the UK has been extremely limited. Austria has successfully used capital grants to support installation of biomass heating systems with an emphasis on local sustainability in energy infrastructure. The use of wood-fired domestic heating was significantly boosted after wood pellets were introduced in 1994. Austria produces 70% of its electricity from renewable sources with biomass accounting for over 11% of the total energy supply and 21% of heat production. In Sweden district heating is extensive and the use of wood pellets in homes is growing significantly. A carbon dioxide tax in place since 1991 has helped to make bio-energy very competitive in heat production. The carbon dioxide tax is
67
not levied on the production of electricity. Building on the experience in Europe biomass energy has the potential to provide a growing proportion of UK energy needs, especially in rural and semi-rural locations.
Heat only applications Heat-only applications of biomass are constrained to locations where biomass fuel is available and a market for the heat exists which makes them suited to many farms without access to the natural gas grid. As with the use of heat from AD many dairy farms may have a limited demand for heat (with the exception of pasteurisation and sterilisation of equipment) and therefore installation of a biomass boiler needs to be considered with respect to integration within the wider farm enterprise, where demand for space heating and hot water in offices and residential properties can be utilised. The technology for biomass boilers is well developed with many EU countries having viable biomass industries (boilers used in the UK are generally either manufactured in Austria or Sweden). Despite these advantages, together with the lower fuel costs, the potential of wood fuel energy systems is not being realised in the UK especially when compared with the situation in many European countries where capital grants have been used to support installation. There are perceived risks and uncertainties together with perceived prohibitively expensive capital and operating costs. The provision of working examples with economic models will provide independent authoritative and objective analysis of costs, benefits etc.
CHP Instead of just using a biomass boiler to produce heat there is considerable potential in the use of a CHP system which produces both heat and power. The advantage in using CHP is in the efficiency of the plant is of the order of 80% when compared with only ~30% for an inefficient power plant and 50% for a modern conventional plant (Royal Commission on Environmental Pollution 2004). Conventional power stations emit the heat generated from power generation into the atmosphere via cooling towers. The heat output from a CHP system is obtained by cooling the exit gases thereby exchanging heat into water that is circulated as the heat supply. Japan, Germany and USA have considerable CHP capacity providing four, 13 and eight per cent respectively of each country’s power generation and the UK Government has a commitment towards CHP as part of its future energy provision. There is considerable potential for CHP but it is difficult to match heat and power demands; it is inefficient to transport heat long distances and currently there is lack of financial support for renewable heat. Biomass CHP plants are typically smaller than fossil fuel plants, produce combustion gases at lower temperatures so that very high steam temperatures cannot be achieved. Consequently while overall efficiency (heat + power) can be very high, of the order of 80%, the electrical conversion efficiency is low. A

68
Stirling engine has high potential for small scale i.e. less than 500kWe with higher efficiency of ~ 40% but their long term performance when used in biomass fired boilers is not yet proven. Higher electrical efficiency can be achieved by burning the biomass at very high temperatures ~1000 oC via gasification but again this technology is in development at small scale. The same issue exists with CHP as with AD and a biomass boiler requires sufficient demand for heat all year round to improve the economic efficiency of the system. It is likely that tri-generation systems which produce heat, power and cooling will have significant potential for dairy units where there is a considerable demand for cooling of milk. This technology is still in its infancy but dairy units offer considerable potential for utilisation of this technology and Newcastle University with considerable expertise in this technology is looking at the feasibility of installing such a system at its Cockle Park Farm in central Northumberland.
3.3.4 Costs
Heat is currently the most viable biomass option but the potential for biomass use in heat production has suffered from the lack of mechanisms for supporting the generation of renewable heat (unlike electricity). Although a Renewable Heat Incentive (RHI) is proposed for introduction to the UK in 2011 the high capital costs of equipment is usually a major factor in limiting the uptake of biomass heating schemes (Table 3.7).
Table 3.7: Comparative capital costs for biomass and oil based heating systems (source: www.ruralenergy.co.uk)
100kW biomass boiler and feed system 14,500 District heating pipes and fittings 3,200 Pipes, pumps, valves etc 2,850 Electrics 1,120 Boiler house and chip store 3,800 Installation 3,460 Total capital costs 28,930 Replacement 100kW oil boiler for Manor House Installed boiler for Manor House 3,450 Boiler + house + tank for barn conversion 5,600 Boiler + house + tank for offices 3,400 Boiler + house + tank for adjoining barn 4,400 Total Capital costs 16,850
At current prices biomass fuel is competitive with all other heating fuels but the high capital costs of biomass compared with oil and gas boilers means that capital support is needed. A range of prices for conventional heating fuels and

69
for wood chip (Table 3.8) shows that the latter are the cheapest heating fuel available. At a price of about £80 per tonne for wood chip this equates at a current heating price of 2.3p per kWh. Wood pellets at £185 per tonne compares favourably with natural gas at about 4.1 p per kWh.
Table 3.8 Typical domestic fuel prices (source
www.biomassenergycentre.org.uk)
Fuel Price per unit pence per
kWh
Wood chips (30% MC) £80 per tonne 2.3
Wood pellets (30% MC) £185 per tonne 3.9
Natural gas 4.1p/kWh 4.1
Heating oil 44p per litre 4.4
LPG (bulk) 40p per litre 6.1
Electricity * 8.725p/kWh 8.7
* Based on an average of off-peak and normal tariffs
3.4 Wind
Summary The UK has considerable potential for generating electricity from wind with relatively high average wind speeds. The output of a modern wind turbine is very sensitive to variations in wind speed such that the output is only 26% of rated output at 7.5 m/s. Small-scale wind turbines are ideally suited to rural locations particularly off-grid but need to be cited away from buildings to maximise output. Turbines up to 500 kW offer an attractive return from the proposed FIT scheme (Section 4.1) with the potential to increase this further with a grid connection for electricity surplus to requirements.
3.4.1 The process and equipment
A wind turbine captures wind energy and converts it into electrical energy. As the wind passes over the blades it causes them to rotate which turns a generator to produce electricity which is fed into an inverter which converts the power to mains power. Any surplus power can be used to charge up a battery bank which can be used when there is little wind. A wind turbine can be used in isolation or multiple units can be installed to make a "wind farm" and produce more electricity. The more towers, the more wind, and the larger the propellers, the more electricity can be made. It's only worth building wind farms in places that have strong, steady winds, although boats and caravans increasingly have small wind generators to help keep their batteries charged.

70
Individual turbines vary in size and power output from a few hundred watts to two or three megawatts. Uses can vary from a small turbine supplying energy for battery charging systems (Fig 3.7) to turbines grouped in wind farms supplying electricity to the grid. In the latter, a landowner/farmer will receive a rental income from the developer and also sometimes a share of the income. Wind farms will not be considered in this report as the generated electricity will not be utilised on site. As a carbon free source of energy, wind power contributes positively to the UK’s effort to reduce our carbon emissions to tackle the threat of climate change. The visual impact of a wind turbine or development must be considered in this context. To some, wind turbines are a blot on the landscape whereas to others they are elegant workhorses, but this reaction is highly subjective and can significantly compromise planning consent.
Fig 3.7 On-farm wind turbine
Wind turbines can rotate about either a horizontal or vertical axis, the former being more common (Fig 3.8). Horizontal-axis wind turbines have the main rotor shaft and electrical generator at the top of a tower. To ensure the blades are always in the optimal position to produce maximum electricity small turbines are orientated by a simple wind vane while large turbines generally use a wind sensor to ensure that the turbine is optimally orientated. Most have a gearbox which turns the slow rotation of the blades into a quicker rotation that is more suitable to drive an electrical generator.
Vertical–axis wind turbines have the main rotor shaft arranged vertically which means that the turbine does not need to be pointed into the wind to be effective. This is an advantage on sites where the wind direction is highly variable. With this type of turbine the generator and gearbox can be placed near the ground, so the tower doesn't need to support it, and it is more accessible for maintenance. A number of these types of turbine have been launched in the UK with the claim of increasing energy output in turbulent winds and eliminating vibrations.

71
Fig 3.8 Schematic diagram of both Horizontal- and Vertical-axis wind turbines.
3.4.2 Energy source The UK has considerable potential (Fig 3.9) for the generation of energy from wind (EAA 2009). Wind power is proportional to the cube of the wind's speed, so relatively minor increases in speed result in large changes in potential output e.g. if the wind speed is twice as high then it contains eight times as much energy.
Fig 3.9 European wind speed data taken at a 10 m hub height after correction for topography and local roughness (source: EEA, 2008)

72
Wind turbines extract energy from the wind using a rotor which usually comprises of two or three blades. If the diameter of the rotor is doubled then the power output of the turbine is quadrupled at a given wind speed. For a given wind speed, the power available from the wind is given by the equation: P( watts) = 0.5 x p x A x V3 where: p = Density of air ( kg/m3) A = Swept area (m2) V = Wind speed (m/s)
Wind speed increases with height so it's best to have the turbine high on a mast or tower and to be sited away from potential obstructions e.g. buildings, trees etc which would reduce the available resource. Wind turbines generally operate between wind speeds of about four and 25 m/s below which there is not sufficient wind to turn the blades and above which (25 m/s equates to above gale force 9) the system shuts down to protect the drive train and gearbox. The output of a modern wind turbine is very sensitive to wind speed (Fig 3.10) such that the output is only 26% of rated output at 7.5 m/s, 46% at 9m/s and 69% at 10.5 m/s (Sharman 2005). Before installation a site needs to be assessed to determine the available wind resource. Location needs to consider these issues in addition to suitability with respect to construction traffic and cabling for power delivery to where it is going to be used, grid connection etc. The ideal location of the turbine in terms of wind speed may be some distance from the site where the power is being utilised which will increase the installation costs for the system in terms of cable, trenching etc.
The national wind-speed database (NOABL) is a UK government web tool used to predict on-site wind resource (available at http://www.bwea.com/noabl) which will provide a useful indication of the wind resource in a particular area of the UK. In addition, meteorological data from a nearby site can provide a useful back up to this.
Fig 3.10 Power curve of a typical modern wind turbine (Sharman 2005)

73
3.4.3 Applications and technology development Large scale wind turbines of 1MW and greater together with wind farms will not be discussed in this report as the electricity will be connected directly into the National Grid rather than being used on farm. Small-scale wind turbines are ideally suited to rural locations particularly off-grid where conventional methods of supply are expensive or impractical. Most small wind turbines generate direct current (DC) electricity and off-grid systems require battery storage and an inverter to convert the DC electricity generated to AC (alternating current) which is mains electricity. Ideally a controller is also beneficial to divert power to another useful source (e.g. space and/or water heaters) when the battery is fully charged. Within the controller will be a meter recording the amount of electricity produced and another to record how much electricity is exported to the grid. The grid connection means that no battery storage is required as surplus can be exported to the grid and sold to an electricity supply company. New designs e.g. vertical-axis are constantly coming to the market with particular emphasis on improving efficiency, reducing noise and introducing additional safety elements.
3.4.4 Costs The total costs of installation of wind turbine generation facilities are highly variable and depend on a number of site specific factors which will themselves vary depending on the kW output. These factors include access, ground conditions for foundations, topography and hence wind speeds, grid connection requirements or energy storage requirements, system design requirements, and costs of securing planning permission (particularly for larger installations). In all instances quotes should be obtained from a number of wind turbine suppliers, but care should be taken to ensure that quotes can be compared on a like for like basis. Some suppliers will quote prices for supply of equipment, others for supply, installation and commissioning. Some will include maintenance or service agreements of different levels, others will not, while again aspects like provision of access roads for construction may or may not be included. The new proposed FIT scheme is particularly attractive to small scale wind generation (Section 4.1) and will greatly reduce payback times. The proposed FIT scheme makes small scale wind a very attractive proposition with a rate of 26.7p/kWh proposed for the range from 1.5 to 15kW systems. This is irrespective of whether the electricity is used on site or not. In addition, as for other renewable electricity generation, a bonus of 3p/kWh will be paid for each unit surplus to own use requirements which is exported to the grid. Again, as with other renewable electricity generation there is potential to sell on renewable electricity at a further premium to businesses looking to purchase green electricity and in particular those covered by the Emissions Trading Scheme. Maintenance costs for the turbines must also be taken into consideration which equate to about 10% of the revenue each year. A visual and audible inspection

74
will be carried out once per year to check for blade condition and signs of component fatigue. For farmers looking to install a wind turbine, care is needed when interpreting information provided by many manufacturers as data often considers output at a set wind speed and therefore stated output is often higher than that achievable in a particular location. Installed capital costs for wind turbines can range from around £3,000 - £4,000 /kW for installations of between 1-6kW and from £1,000 - £2,000 /kW for installations above 20kW. These figures are purely indicative and can vary significantly depending on site specific conditions stated above. This can mean that there may be significant variation in capital cost for the same kW output between neighbouring farms or even between different locations within the same farm. Table 3.9 provides guidelines for consideration of quoted costs for a specific site by indicating potential revenues and hence an approximation of the amount of capital cost which could be paid back in a five year period. Table 3.9 Indication of the potential revenue from wind turbines
Turbine
size
Annual
output
kWh
Annual
revenue
100% own
use
Annual
revenue
50%
exported
Revenue
over five
years
100% own
use
Revenue
over five
years
50%
exported
1kW 2,278 984 919 4,922 4,596
5kW 11,388 4,034 3,708 20,171 18,541
20kW 45,552 14,952 13,648 74,762 68,243
50kW 227,760 62,691 56,171 313,455 280,857
Assumptions for table 3.9: 1. Efficiency of each turbine = 26% based on average wind speed of 7.5m/s 2. Annual revenue based on anticipated FIT values and export bonus values (Table 4.1), and
assumed electricity savings at average rate of 8.725p/kWh (average of normal rate of 10.85p and off-peak rate of 6.6p)
3. The maximum capital costs for five year payback do not include financing or maintenance costs

75
3.5 Solar thermal and PV
Summary
Both solar thermal and photovoltaic systems utilise the energy of the sun to generate heat and electricity respectively. An ideal location is on a building as close to due south as possible to maximise radiation capture. Both solar thermal and PV systems are ideally suited to dairy units where large roof space is generally not a limiting factor. Solar thermal can be used to pre-heat the water before it enters the main tank for final heating by a back-up system to achieve the temperature of >85oC generally required for parlour washing. A PV system can act in isolation mode where a battery system can provide a storage facility or can be connected to the grid with the potential to export electricity when not required on site. Attractive rates for PV systems are proposed with the new FIT scheme with 36.1p/kWh for systems up to 10kW which significantly reduces the payback period.
3.5.1 The process and equipment
Solar energy systems either make use of the thermal energy of solar radiation to heat water (solar thermal) or to convert into electricity (photovoltaic system).
Solar thermal There are three main components of a solar hot water system i.e. solar panel, a heat transfer system (requires electricity to move the fluid which is a mixture of water and anti-freeze) and a hot water cylinder/ storage system. Solar panels are fitted to a roof ideally in a south-east to south-west orientation to maximise the capture of direct sunlight. They collect heat from the sun's radiation and then transfer this to a hot water storage system (Fig 3.11). Space may also be required to locate an additional hot water cylinder if required. Solar thermal installations can be sub-divided into passive and active systems. An active system uses a pump to circulate the heat transfer fluid while a passive system relies on natural convection or water pressure to circulate the fluid to the point of use. The active systems are generally more efficient but are more expensive to buy and install. Both typically include an auxiliary energy source (electric heating element or connection to a gas or fuel oil central heating system) that is activated when the water in the tank falls below a minimum temperature setting such as 60°C. This is to ensure that hot water is always available.

76
Fig 3.11 Solar thermal system There are two types of collectors in solar systems, flat-plate collectors and evacuated tubes. Flat plate collectors are glazed insulated panels containing a radiation absorption surface. The collector is connected via a flow and return pipe to a heat exchanger in the hot water cylinder. A typical well lagged domestic hot water cylinder may achieve a temperature of 50-60oC during the day when heated by a flat-plate system but even with no water use the temperature will fall between dusk and dawn. The evacuated tube collector consists of a series of tubes each containing an absorber and a pipe surrounded by a vacuum. The vacuum greatly reduces heat losses from the system because there is no air to conduct the heat away. Whilst more efficient and capable of achieving higher water temperatures than the flat-plate type, evacuated tube collectors are inherently more expensive due to the complexity of their design and manufacture.
Photovoltaic
Photovoltaic (PV) means electricity from light. Photovoltaic systems use daylight to power a range of equipment from calculators and watches, to garden lighting through to domestic scale roof top systems of 2-3kW and also including larger commercial buildings supplying several hundred kW. About 10% of PV currently installed in the UK is off grid stand-alone systems providing power for road signs, parking meters, street lighting etc. A PV cell consists of two or more thin layers of semi-conducting material (conducts electricity when sunlight falls on it) most commonly silicon encased

77
between sheets of glass or plastic. When the silicon is exposed to light, electrical charges are generated and this can be conducted away by metal contacts as direct current (DC). This DC is carried through wiring to an inverter which converts the current to alternating current (AC) so that it can be connected into an electricity distribution board for on-site use or can be exported to the grid (Fig 3.12). It may include a storage facility (e.g. battery bank) to allow electricity to be provided during the night or at times of poor sunlight levels. The electrical output from a single cell is small, so multiple cells are connected together and encapsulated (usually behind glass) to form an array of generally about 1m x 1m. The PV array is the principle building block of a PV system and any number of arrays can be connected together to give the desired electrical output.
The equipment in a PV system has no moving parts and as a result requires minimal maintenance. It generates electricity without producing emissions of greenhouse or any other gases, and its operation is virtually silent.
Fig 3.12 Typical photovoltaic system configuration
Types of PV cell
• Monocrystalline Silicon Cells: Made using cells saw-cut from a single cylindrical crystal of silicon, this is the most efficient of the photovoltaic (PV) cells. The principal advantage of monocrystalline cells are their high efficiencies, typically around 15%, although the manufacturing process required to produce monocrystalline silicon is complicated, resulting in slightly higher costs than other conductor materials.
• Polycrystalline Silicon Cells: Similar to monocrystalline but instead uses several different crystals. Polycrystalline cells are cheaper to produce than monocrystalline ones, due to the simpler manufacturing process. However, they tend to be slightly less efficient, with average efficiencies of around 12% creating a granular texture.
78
• Thick-film Silicon: Another polycrystalline technology where the silicon is deposited in a continuous process onto a base material giving a fine grained, sparkling appearance. Like all crystalline PV, this is encapsulated in a transparent insulating polymer with a glass cover and usually bound into a strong aluminium frame.
• Amorphous Silicon: Amorphous silicon cells are composed of silicon atoms in a thin homogenous layer or film rather than a crystal structure. Amorphous silicon absorbs light more effectively than crystalline silicon, so the cells can be thinner. For this reason, amorphous silicon is also known as a "thin film" PV technology. Amorphous silicon can be deposited on a wide range of substrates, both rigid and flexible, which makes it ideal for curved surfaces and "fold-away" modules. Amorphous cells are, however, less efficient than crystalline based cells, with typical efficiencies of around six per cent, but they are easier and therefore cheaper to produce. Low cost makes them ideally suited for many applications where high efficiency is not required and perform much better in diffuse sunlight than mono or crystalline modules.
• Other Thin Films: A number of other promising materials such as cadmium telluride (CdTe) and copper indium diselenide (CIS) are now being used for PV modules. The attraction of these materials is that they can be manufactured by relatively inexpensive industrial processes, certainly in comparison to crystalline silicon, yet they typically offer higher module efficiencies than amorphous silicon.
3.5.2 Energy source Most systems use collectors at a fixed angle with respect to the horizontal. Ideally both solar thermal and PV systems should be positioned as close to due south as possible to receive most solar energy during the year but there is little penalty for orienting the panel between south-east and south-west directions. Both solar thermal and PV systems can produce a reduced level of heat and electricity respectively when the sun is hidden by clouds and in winter months. As solar radiation passes through the atmosphere, it is subjected to atmospheric scattering due to dust and water vapor and to atmospheric absorption, mainly by oxygen, carbon dioxide and water vapor. Both of these reduce the intensity of sunlight that reaches the earth’s surface by an amount which is dependent on the path length through the atmosphere and on the amount of dust and water vapour present which is why solar radiation intensity is lower in winter months than in the summer.

79
Fig 3.13 Average solar radiation levels in the UK falling on one square metre surface inclined at 30 degrees to the horizontal, measured in kilowatt hours (annual total kWh/m2). In the UK on average we receive about 1,000 kWh/m2 of solar radiation each year (Fig 3.13) with the amount in the South being higher than the North. The solar resource is defined by two main quantities, the amount of sunlight falling on a surface and its spectral content (i.e. the range of wavelengths it contains). The amount of sunlight is dependent on the time of day, season, location, orientation of the surface and weather conditions. The sunlight reaching a surface is the sum of direct, diffuse (scattered in the atmosphere and so reaching from a variety of directions and albedo (reflected from the ground and/or other surfaces) radiation. A common perception is that solar water heating requires a lot of sun, in reality a solar water heating system concentrates diffused solar radiation from the sun and uses it to help heat water.
3.5.3 Applications and technology development
Domestic solar thermal systems are usually required to heat water to a temperature of 65oC whereas dairy wash water is >85oC which is a more difficult task for a solar system. In addition, within a dairy unit all of the stored water will generally be used each day and so there is limited opportunity to store extra heat just in case the following day is overcast. Solar thermal has considerable potential for use in a dairy unit where there is the requirement to heat water >85oC all year round for parlour washing. A solar thermal system can pre-heat the water before it enters the main tank for final heating by a back-up system to achieve the higher temperature required. For many days of the year a solar heating system will not meet the full temperature requirement for washing dairy equipment. It is therefore necessary to have a back-up heating

80
system which may need to provide 100% of the heat required on winter days. A large roof surface such as those present on many agricultural buildings, allows installation of a number of large panels to ensure that hot water can be generated, even on winter days. Commercial solar hot water systems are essentially the same as those used for homes (Fig. 3.14), except that the components: thermal storage, heat exchanger, and piping are larger and proportional to the size of the collector array. There is a current trend within the UK towards grid connected PV systems. These systems are connected to the local electricity network. This means that during the day, the electricity generated by the PV system can either be used immediately (which is normal for systems installed on offices and other commercial buildings), or can be sold to one of the electricity supply companies (which is more common for domestic systems where the occupier may be out during the day). In the evening, when the solar system is unable to provide the electricity required, power can be bought back from the network. In effect, the grid is acting as an energy storage system, which means the PV system does not need to include battery storage.
Fig 3.14 Photovoltaic array Photovoltaic systems can be incorporated into buildings in various ways. Sloping rooftops are an ideal site, where modules can simply be mounted using frames. Photovoltaic systems can also be incorporated into the actual building fabric, for example PV roof tiles are now available which can be fitted in the same way as standard tiles. In addition, PV can also be incorporated as building facades, canopies and skylights amongst many other applications.
Stand-alone photovoltaic systems have been used for many years in the UK to supply electricity to applications where grid power supplies are unavailable or difficult to connect to. There is also a substantial market for PV technology in the leisure industry, with battery chargers for boats and caravans, as well as for powering garden equipment such as solar fountains. These systems normally
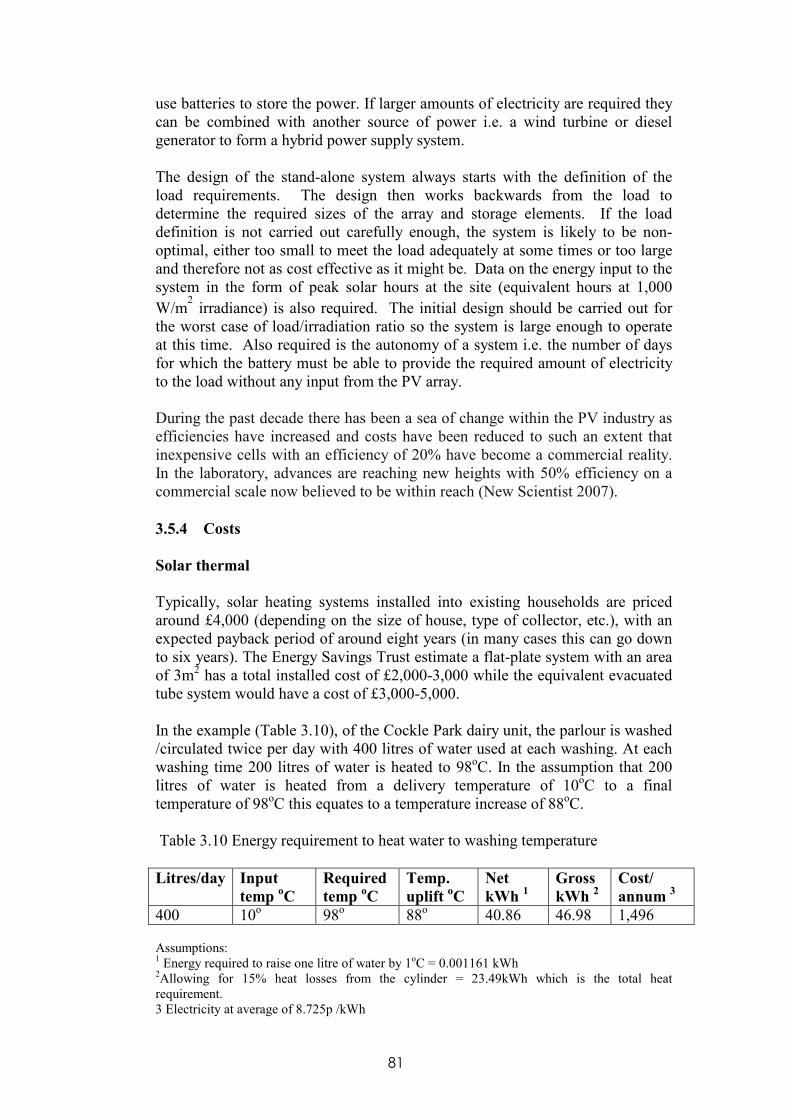
81
use batteries to store the power. If larger amounts of electricity are required they can be combined with another source of power i.e. a wind turbine or diesel generator to form a hybrid power supply system. The design of the stand-alone system always starts with the definition of the load requirements. The design then works backwards from the load to determine the required sizes of the array and storage elements. If the load definition is not carried out carefully enough, the system is likely to be non-optimal, either too small to meet the load adequately at some times or too large and therefore not as cost effective as it might be. Data on the energy input to the system in the form of peak solar hours at the site (equivalent hours at 1,000
W/m2 irradiance) is also required. The initial design should be carried out for
the worst case of load/irradiation ratio so the system is large enough to operate at this time. Also required is the autonomy of a system i.e. the number of days for which the battery must be able to provide the required amount of electricity to the load without any input from the PV array. During the past decade there has been a sea of change within the PV industry as efficiencies have increased and costs have been reduced to such an extent that inexpensive cells with an efficiency of 20% have become a commercial reality. In the laboratory, advances are reaching new heights with 50% efficiency on a commercial scale now believed to be within reach (New Scientist 2007).
3.5.4 Costs
Solar thermal
Typically, solar heating systems installed into existing households are priced around £4,000 (depending on the size of house, type of collector, etc.), with an expected payback period of around eight years (in many cases this can go down to six years). The Energy Savings Trust estimate a flat-plate system with an area of 3m2 has a total installed cost of £2,000-3,000 while the equivalent evacuated tube system would have a cost of £3,000-5,000. In the example (Table 3.10), of the Cockle Park dairy unit, the parlour is washed /circulated twice per day with 400 litres of water used at each washing. At each washing time 200 litres of water is heated to 98oC. In the assumption that 200 litres of water is heated from a delivery temperature of 10oC to a final temperature of 98oC this equates to a temperature increase of 88oC.
Table 3.10 Energy requirement to heat water to washing temperature
Litres/day Input
temp oC
Required
temp oC
Temp.
uplift oC
Net
kWh 1
Gross
kWh 2
Cost/
annum 3
400 10o 98o 88o 40.86 46.98 1,496 Assumptions: 1 Energy required to raise one litre of water by 1oC = 0.001161 kWh 2Allowing for 15% heat losses from the cylinder = 23.49kWh which is the total heat requirement. 3 Electricity at average of 8.725p /kWh

82
Putting this data into the following model (www.4elements-uk.com/Downloads/SolarWash_1.xls) indicates that a seven panel system at a cost of £7,401 would produce an annual saving of £745. Not included in this figure is the cost of retrofitting to the existing water heating and storage system which needs to be taken into consideration.
PV A typical 1kW (peak) polycrystalline array which would cover an area of 10m2 (Energy Savings Trust) would cost £4,000 to £6,000 and generally under UK conditions would produce about 1000kWh per annum. Table 3.11 provides a guide to assist in the calculation of payback of initial capital costs. Costs per kW capacity tend to be lower for larger systems ranging from around £6,000 /kW for installations of less than 5kW to around £4,000 /kW for installations above 10kW. These costs are indicative only and will vary depending on the type of PV system installed. It should be noted, however, that the FIT allowances for systems above 10kW and again above 100kW are successively lower, thus increasing payback time or, as shown below, decreasing the total capital cost which can be paid back within a five year period. Table 3.11 Photovoltaic indicative outputs and revenues
PV Array
size
Annual
output
kWh
Annual
revenue
100%
own use
Annual
revenue
50%
exported
Revenue
over 5 yrs
100%
own use
Revenue
over 5 yrs
50%
exported
2kW new build
2,278 1,021 956 5,105 4,779
2kW retro-fit
2,278 1,139 1,074 5,697 5,371
5kW 5,694 2,552 2,389 12,762 11,947
10kW 11,388 4,569 4,243 22,847 21,217 Assumptions: 1. Efficiency = 13% based on EST guidance figures 2. Annual revenue based on anticipated FIT values and export bonus values (Ttable 4.1), and
assumed electricity savings at average rate of 8.725p/kWh
3.6 Ground source heat pump
Summary A ground source heat pump (GSHP) uses heat from below the ground and a pump to deliver heat that can be used for space heating or hot water. The temperature at a depth of about one metre below the soil surface is relatively constant at about 7-130C. Systems can either be open or closed loop systems and either horizontal or vertical installations. Existing boreholes which provide

83
access to drinking and domestic water can also be used for ground source heat systems. This is of limited potential for a dairy unit due to the low and variable heat requirement but could be of greater value within a wider farm context where space heating is a requirement. It is important to consider this technology in terms of a new build rather than retrofitting an existing building which is more expensive.
3.6.1 The process and equipment Heat beneath the earth’s surface has long been considered to be a valuable source of energy. A GSHP uses that heat and functions just like other types of heat pumps, using a refrigeration cycle to move heat between the indoors and outdoors and a compressor to raise the temperature of the heat taken from the ground to a more useful temperature. These systems use the earth’s natural thermal energy to heat or cool a building but also to potentially produce hot water to supplement the output of a conventional water heater. Most GSHP systems raise temperature to ~40oC and so are ideal for under-floor heating requiring temperature of 30-35oC (compared with 60-90oC in radiators). In a typical GSHP installation fluid (typically water and antifreeze e.g. propylene glycol which is less toxic than automotive antifreeze) circulates around the ground in plastic pipes at a lower temperature than the ground. This creates a heat gradient and draws heat from the ground into the fluid in the pipe. The fluid passes through a heat exchanger in the pump and the heat extracted from the ground is absorbed by the refrigerant which circulates around the heat pump. The pressurized refrigerant then passes over another heat exchanger called a condenser where the heat is transferred to the required destination. The heat would typically be delivered via an underground heating system or as hot air. Energy is required in the form of electricity to concentrate the energy harnessed and also to circulate the heat within a building with the greatest benefit environmentally if this is renewable electricity. Energy output to input ratio is typically about 4:1 that is for every four units of heat produced one unit of electrical input energy is required. Coils of 32mm diameter polyethylene pipe (Fig 3.15) are laid in trenches which are generally 1-2 metres deep where the length of the pipe and number of trenches varies according to the heating needs of the property.
Fig 3.15 Trenching and pipe-work for a GSHP
There are two main types of GSHP: open loop and closed loop

84
Open loop
The simplest GSHP installation uses ground water as a direct source of heat. Water is pumped from a supply well, passes through a heat pump and then into a discharge area. Open loops require good quality well water at a reasonable pumping depth. The well must have enough capacity to provide a continuous flow of 1.5 gallons per minute per ton of heat pump capacity during peak operation. An approved discharge system must be available. Ditches, field tiles, ponds, streams and dry wells are the most common methods, although local regulations may limit the use of this approach. Open loop systems are usually less expensive than other configurations especially where there is a suitable source of groundwater. Restrictions on the way water is discharged and concern about the large quantity of water used make the closed loop system more attractive to many people.
Closed loop
Because of the limitations of open-loop systems the latest models are based on closed-loop systems, where the heat exchanger in the ground is made of a sealed loop of pipe that is buried vertically in boreholes 15-100 metres deep (Fig 3.16) or horizontally in trenches (Fig 3.17). The water/antifreeze liquid solution circulates in the ground loop, a small pump circulates a mixture of water and non-toxic antifreeze through the pipe and the energy is transferred to the heat pump refrigerant through a heat exchanger. The vertical system will benefit from higher ground temperatures at depth than the horizontal system but installation costs will be higher. Horizontal loops are most common. The length of loop depends on the size of the heat pump equipment, the moisture content of the soil and the climate. Many rural areas rely upon boreholes to provide access to drinking and domestic water which can also be used for ground source heat pipes. In such a system a deep borehole draws water from underground aquifers for use in a ground source heat system and a second borehole is used to return waste water to soak away underground.
Fig 3.16 Vertical GSHP system

85
Fig 3.17 Horizontal GSHP system
Water heating requires constant load all year round. Normally the required temperature of the hot water tap is 35-45oC in domestic systems (Table 3.12). Because the heat pump is unable to raise the temperature of mains incoming water to this range of temperature in an instantaneous way, there is a need for a hot water storage facility to store the hot water, in a similar way to a conventional heating system where a condensing boiler stores the hot water in a cylinder.
Table 3.12 Supply temperature requirement for several heating systems
System
Delivery
temperature oC
Under floor heating 30-45
Air 30-50
Low temperature radiators 45-55
Conventional radiators 60-90
3.6.2 Energy source
Ground temperature is constant at 7-130C about one metre below the surface. In GSHP the constant temperature of the ground helps to offset temperature variations such that the soil acts as a reservoir of heat in the winter and as a heat sink in the summer with the latter being used for cooling.
3.6.3 Applications and technology developments
There is limited scope for GSHP utilisation within a dairy unit because of the lack of demand for space heating although there is considerable potential for use within a wider farm context e.g. heating of farmhouse and other residential properties. For heating water for parlour washings a ground source heat pump may be used to provide base level water heating up to about 50oC but beyond that a back up heating unit will be required such as an immersion heater. The additional heating mechanism will then provide the additional heating required to raise the temperature to >85oC. It is much easier and more cost effective to

86
install a GSHP in a new build as trenches and pipes can be installed when foundations are being dug.
Innovations in relation to shallow “ground source heat” applications, involving the application of heat-pump technology to ground waters and soils at shallow depth are transforming the face of the geothermal energy business worldwide. It has been demonstrated (Sanner et al 2003) that more than 20 years of commercial application worldwide has now yielded a mature understanding of the concept of sustainability of this technology and sound design and installation criteria.
3.6.4 Costs
The cost of a GSHP system ranges from about £1,200 to £1,700 per kW of heat output with vertical borehole systems being more expensive than horizontal systems due to higher installation costs. The component costs of a horizontal system would be about £600 to £1,000 per kW which is lower than a vertical system which has a cost of £800 to £1,250 per kW. This cost differential is amplified by installation costs which are very much site specific.
3.7 Micro-hydro
Summary Hydropower is produced when the kinetic energy of flowing water is converted into electricity by a turbine connected to an electricity generator. Micro-hydro is the small scale (up to 100 kW) generation of electricity from water pressure converted through mechanical shaft power to drive a generator. The amount of power available is critical in any system and is proportional to the product of the head, (vertical distance the water travels between its source and the generator) and the flow rate of water measured in m3/second. The majority of farms are unlikely to have access to an adequate water resource and will therefore be unable to utilise this technology There are numerous opportunistic locations where a scheme may be possible. The presence of a water resource alone is however not sufficient to warrant the installation of a micro-hydro system. A key factor in assessing feasibility is the amount of civil engineering as well as the type of mechanical and electrical equipment required which can have a significant impact on capital costs. The costs associated with subsequent utilisation of electricity generated and in particular of connection to the National Grid can also be critical to viability. There is also a need to liaise closely with the Environment Agency (SEPA in Scotland) for any approval for civil engineering aspects of the installation, abstraction and ecological impacts. Micro-hydro schemes are however robust and reliable and will generally provide good efficiency and predictable and stable outputs. In contrast to solar and wind intallations, micro-hydro systems can run 24 hours a day seven days a week with seasonal output peaks usually coinciding with seasonal energy demands. As

87
long as schemes are appropriately designed to optimise the relationship between cost and power output, micro-hydro can prove a viable option for on-farm electricity generation.
3.7.1 The process and equipment Micro-hydro systems are often referred to in relation to their suitability to different levels and proportions of head to flow. Ranges of head are generally referred to as ‘low head’ (<10m), ‘medium head’ (10-50m) and ‘high head’ (>50m). Flow rate may be broadly defined as ‘low’ if below 0.5m3/s. The simplest form of micro-hydro utilises waterwheels which can be viable for installations of >5kW. Waterwheels are either vertical axis systems which are appropriate for high head locations or horizontal axis systems used in low head schemes. Turbine systems are however more efficient than waterwheel systems and are therefore utilised in most new schemes and all larger installations. The majority of schemes are ‘run of the river’ which operate through the diversion of water from rivers or streams. They are generally high flow/low head systems and if utilising natural topography or established civil infrastructure will require less civil engineering and costs. Run of the river schemes may be either leat systems (Fig. 3.18) or barrage systems in which the generation equipment is situated within or adjacent to a dam or weir. Low flow /high head systems may utilise either a canal and penstock i.e. a pipe that conveys water under pressure to the turbine or through a penstock only (Fig 3.19).
Fig. 3.18 Leat run of the river system (Source: British Hydro Association)
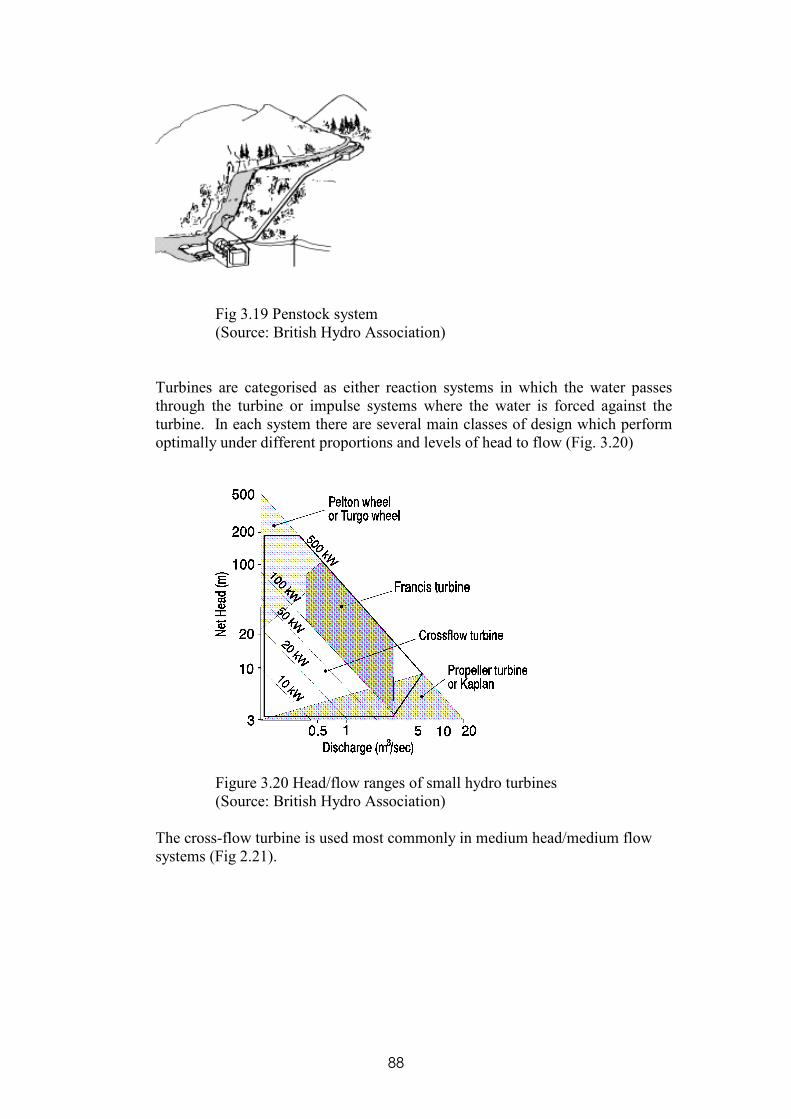
88
Fig 3.19 Penstock system (Source: British Hydro Association)
Turbines are categorised as either reaction systems in which the water passes through the turbine or impulse systems where the water is forced against the turbine. In each system there are several main classes of design which perform optimally under different proportions and levels of head to flow (Fig. 3.20)
Figure 3.20 Head/flow ranges of small hydro turbines (Source: British Hydro Association)
The cross-flow turbine is used most commonly in medium head/medium flow systems (Fig 2.21).
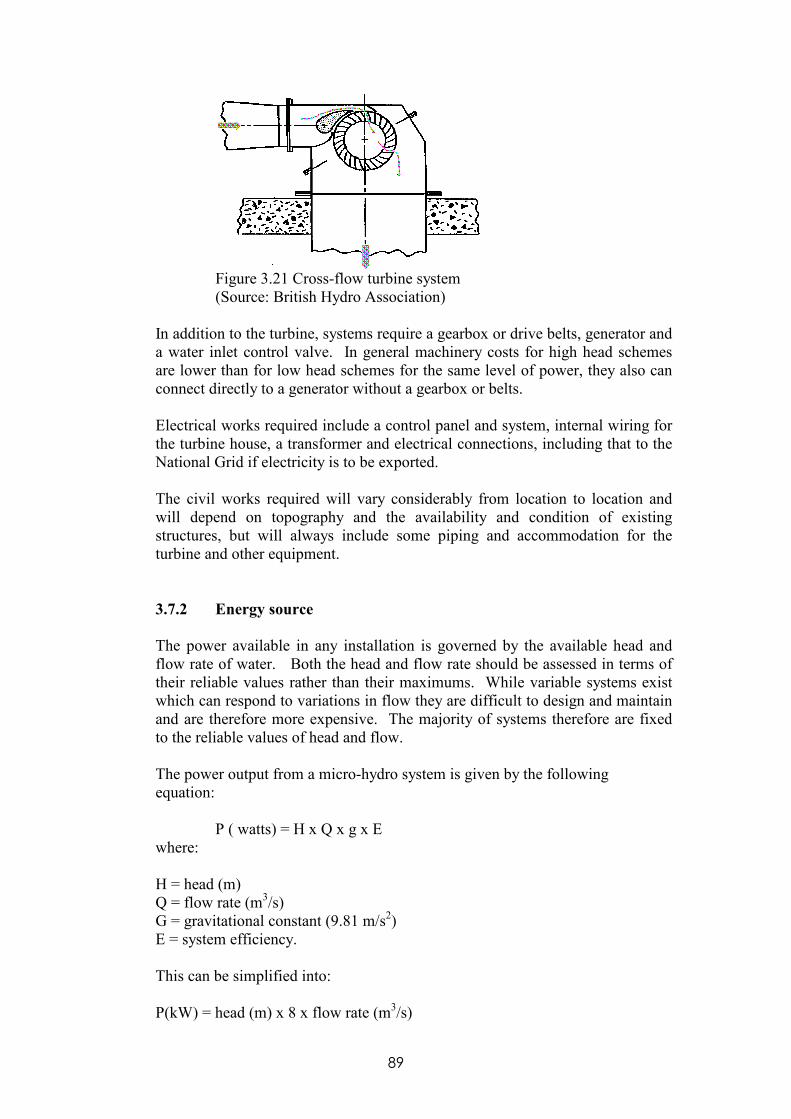
89
Figure 3.21 Cross-flow turbine system (Source: British Hydro Association)
In addition to the turbine, systems require a gearbox or drive belts, generator and a water inlet control valve. In general machinery costs for high head schemes are lower than for low head schemes for the same level of power, they also can connect directly to a generator without a gearbox or belts.
Electrical works required include a control panel and system, internal wiring for the turbine house, a transformer and electrical connections, including that to the National Grid if electricity is to be exported.
The civil works required will vary considerably from location to location and will depend on topography and the availability and condition of existing structures, but will always include some piping and accommodation for the turbine and other equipment.
3.7.2 Energy source The power available in any installation is governed by the available head and flow rate of water. Both the head and flow rate should be assessed in terms of their reliable values rather than their maximums. While variable systems exist which can respond to variations in flow they are difficult to design and maintain and are therefore more expensive. The majority of systems therefore are fixed to the reliable values of head and flow. The power output from a micro-hydro system is given by the following equation: P ( watts) = H x Q x g x E where: H = head (m) Q = flow rate (m3/s) G = gravitational constant (9.81 m/s2) E = system efficiency.
This can be simplified into:
P(kW) = head (m) x 8 x flow rate (m3/s)

90
There are a range of combinations of water head and water flow which can be combined to achieve different power outputs (Table 3.13) Table 3.13 Combinations of head and flow rate to achieve different power outputs
Water supply Water head
m Water
flow
m3/s
Power
capacity
kW
Low head / high flow 1.00 2.50 20
High head / low flow 250.00 0.01 20
Low head / high flow 6.25 1.00 5
High head / low flow 75.00 0.05 5
There are essentially three scenarios that can operate as effective micro-hydro power schemes.
1. Upland schemes on farms i.e. high head, low flow 2. Lowland schemes on farms i.e. low head, high flow 3. Those which exploit proximity to existing dams and reservoirs which
may have previously been used for producing water power.
The accurate measurement of head and flow rate are essential to determining the potential power output of a site and hence income. The key to ensuring viability is not to maximise the power output from an installation but to ensure the optimisation of power output in relation to overall cost. In very general terms those sites which require greater levels of civil engineering in order to deliver the desired head and flow are less likely to be viable than those which can exploit existing natural features or man-made structures without significant modification and cost.
3.7.3 Applications and technology developments
Micro-hydro technology is well established, proven and robust. Hydrology measurement systems are also advanced with a good level of accuracy, thus enabling the water power potential of sites to be accurately assessed. Industry understanding of the efficiencies of different designs enables system design and equipment specification to be matched to the specific water power supply. The UK currently generates about 0.8% electricity from hydroelectric schemes but most of these are large-scale schemes found in the Scottish Highlands. There is considerable potential for the development of micro-hydro schemes which can be associated with a dam and storage reservoir or can be located in a moving stream and generally have high efficiencies of 70-90%. Micro-hydro generation is environmentally benign as in most cases it is ‘run of the river’ and design features allow minimisation of adverse impacts on water ecology and fish populations.

91
In particular two types of site are worthy of consideration, historic water mills (of which there are an estimated 20,000 in the UK) and hilly areas with spring-fed streams. Government targets for renewable electricity combined with the development of modern, small-scale turbine units makes re-activation of many old mill sites for electricity generation economically worthwhile. Often at these sites it is possible to reuse some of the existing civil structures such as the weir and the leat, thereby reducing the cost of installation. These sites will generally offer high flow/low head water power resources. Considerable potential exists in many hilly areas of Britain for micro hydro power. Turbines are available which can utilise quite small spring fed streams for power generation if the fall is sufficient. In these situations low flow/high head schemes are most typical. These sites can often be developed at reasonable cost since civil structures associated with large flows of water, such as weirs are not required.
The Environment Agency (EA) and the approval process
Energy, flood schemes and ecological improvements all fall under the jurisdiction of the EA if the scheme touches the river corridor. The EA protect the environment and will act as the front door for many other concerned organisations such as the RSPB, National Trust, anglers, regional councils and tourist interests. The EA must protect ecological habitats and water resources, minimise pollution and must make future plans to constantly increase the quality of the river environment to support the delivery of the EC Water Framework Directive. The EA also has officers who consider abstraction licences, development and control, ecology, and archaeology, flood risk and farming practice as it may impact on the environment and in particular its impact on watercourses. When considering any scheme early engagement with the EA is strongly recommended.
3.7.4 Costs
The costs of installation of a micro-hydro scheme are highly dependent on the
specific civil engineering requirements of a site together with the equipment required to generate electricity from the water resource. These costs can vary considerably between sites for the same power capacity of installation.
In all instances the first cost to be incurred is that of undertaking a full feasibility study of the site, the cost of which can be between £5,000–10,000. It is nevertheless worth undertaking an initial assessment prior to committing this expenditure and this can in many cases be done by the individual with guidance from British Hydropower Association’s Guide to Mini-hydro Developments, available from their website (http://www.british-hydro.org).

92
Turbines are the least expensive component of most projects and a cost of £1,000-5,000 for 2-8kW is not uncommon. The costs of electrical equipment for the same size of installation can be roughly the same again, but the costs of connection to the National Grid will vary considerably depending on proximity to a connection point and the capacity of the local network. Costs of housing the turbine and equipment can be reduced through utilisation of existing buildings otherwise a new build must be factored in and included in the application for planning approval.
Civil engineering costs will vary but may be reduced if existing structures can be utilised although substantial rehabilitation of structures can be extremely costly. In nearly all schemes there will be costs associated with inlet works which may be between £2,000-20,000 for smaller schemes. All schemes will require the installation of sediment screens and trash screens which will add cost but they are vital to protecting turbines from damage or dysfunction due to larger object of debris.
Pipes to move the water from the inlet to the turbine are often the most expensive component and need to be carefully specified with the design and installed correctly. If there is an existing flow delivery, a leat or channel, then this can save considerable cost but even if such a feature exists some piping will be required.
Case Study: Whitfield Village Hall, Northumberland
The Whitfield Hall scheme in Northumberland had the primary purpose of providing heat for the village hall. A considerable amount of preparatory work was needed at this site including improving the sluice gates and a new access bridge. The initially proposed scheme cost £10,000 to utilise a 2.5m head from a weir to give 1kW of power. Through the involvement of the local community, an existing leat that fed a former saw mill was identified, which instead provided an 8m head over a distance of 300m (see www.youtube.com/proactivefarms). The final investment of £30,000 was secured with support from the Northumberland Blue Skies initiative and a scheme generating 4kW was created. Improvement of the inlet works cost £5k and a new pipe had to be placed within the old leat. The scheme is now complete and 3kW of power is generated for most of the year, (with occasional maintenance issues) 1kW of which is used to drive a geothermal heat pump in a 100m deep well. This gives the 3-4kW of heat energy that is needed to heat the village hall.

93
4 OTHER CONSIDERATIONS
4.1 Financial incentives e.g. ROCs, RHI, FITs As most renewable energy sources have capital or operating cost disadvantages in comparison to traditionally used fossil fuels, incentives need to be provided to encourage the growth of renewable energy. There are essentially two types of financial incentives to promote renewable energy generation:
1) Premiums which are paid for energy generated from renewable sources 2) Schemes to support initial capital investment in renewable energy
generation capacity
There are two established systems of premiums for renewable generation: the Renewable Obligation which has been used in the UK and the Feed In Tariff which is generally used in Europe. Either can work well, or they can be combined, as some American states do and as the UK is now proposing to do. While both schemes have proven effective, it is most important to ensure that there is long term stability in the support mechanism in order to promote investor and operator confidence.
In April 2002 the Renewable Obligation came into effect in the UK. It is an obligation on all electricity suppliers to supply a specific proportion of electricity from eligible renewable sources. This does not include energy from waste combustion unless the waste is first converted to fuel using advanced conversion technology (only the biodegradable fraction of waste is eligible). The Renewable Obligation provides incentives for generators to supply progressively higher levels of renewable electricity with time (set at 4.2% for 2005). The Government is committed to the Renewable Obligation and will provide the level of support as planned until 2027. Renewable Obligation Certificates (ROCs) are received by generators for every MW of green electricity generated i.e. a green premium. Electricity suppliers which cannot meet the targets for % output from renewable sources can purchase ROCs from other generators. The UK government will retain ROCs for large electricity projects >5MW and for biomass combustion projects but will introduce a Feed In Tariff (FIT) for schemes up to 5MW from April 2010. Feed In Tariffs are being introduced to make renewable energy an attractive proposition for the UK. With less than 100,000 micro-generation installations it is clear that the Renewable Obligation and stop/start grants have failed to deliver the potential for renewable energy installations. Proposals for how the FIT scheme will work were released in February 2010 and will support the generation of renewable electricity with an additional bonus of 3pkWh for export to the grid (Table 4.1). In the scheme there are clear differences in support for a number of technologies based on the output of the equipment installed. The FIT scheme will run until at least 2037 for all technologies.
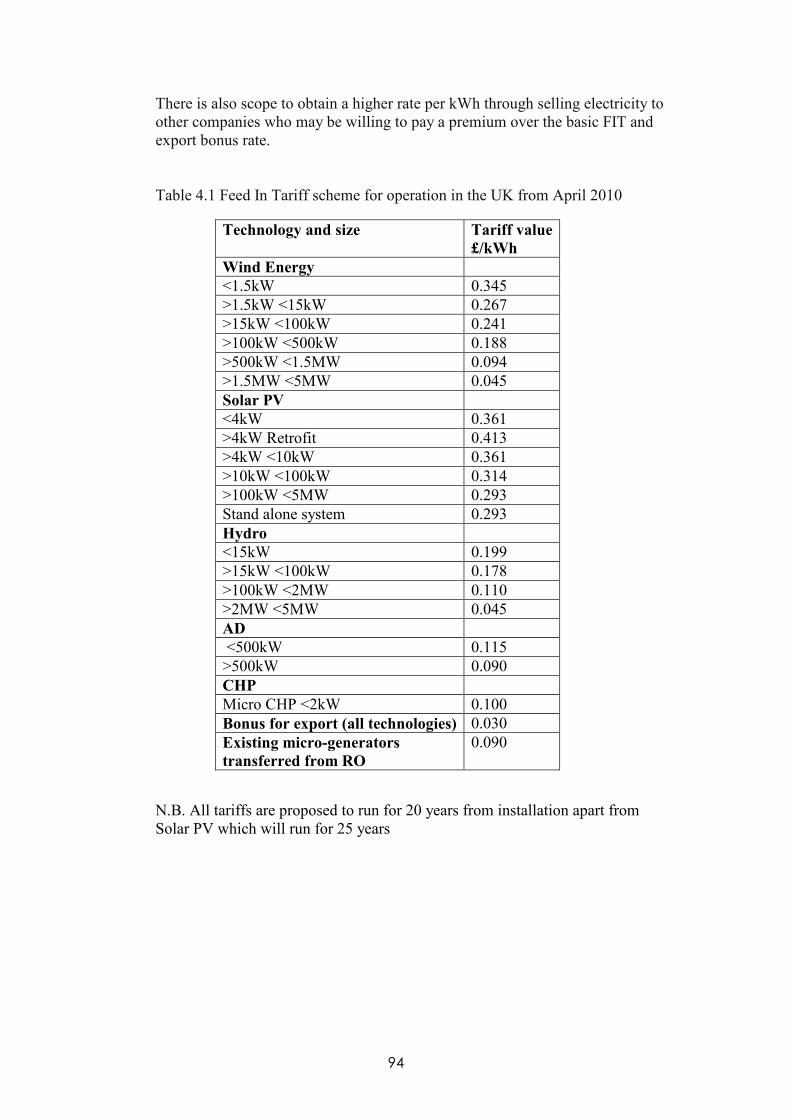
94
There is also scope to obtain a higher rate per kWh through selling electricity to other companies who may be willing to pay a premium over the basic FIT and export bonus rate. Table 4.1 Feed In Tariff scheme for operation in the UK from April 2010
Technology and size
Tariff value
£/kWh
Wind Energy
<1.5kW 0.345
>1.5kW <15kW 0.267
>15kW <100kW 0.241
>100kW <500kW 0.188
>500kW <1.5MW 0.094
>1.5MW <5MW 0.045
Solar PV
<4kW 0.361
>4kW Retrofit 0.413
>4kW <10kW 0.361
>10kW <100kW 0.314
>100kW <5MW 0.293
Stand alone system 0.293
Hydro
<15kW 0.199
>15kW <100kW 0.178
>100kW <2MW 0.110
>2MW <5MW 0.045
AD
<500kW 0.115
>500kW 0.090
CHP
Micro CHP <2kW 0.100
Bonus for export (all technologies) 0.030
Existing micro-generators
transferred from RO
0.090
N.B. All tariffs are proposed to run for 20 years from installation apart from Solar PV which will run for 25 years

95
4.2 Capital support schemes In the UK there are two main types of capital support schemes for investment in renewable energy generation: 1. Capital tax allowances which enable investment to be offset against profits
and tax liabilities 2. Grant schemes
Capital allowances The standard rate of capital allowances for plant and machinery is 20% a year on a reducing balance basis. Enhanced Capital Allowances (ECA) allow 100% of the full cost of an investment in designated energy-saving plant and machinery to be written off against the taxable profits of the period in which the investment is made. The 15 designated technologies and 54 sub-technologies that comprise the ECA scheme can be seen on the Energy Technology Product List (ETPL) at http://www.eca.gov.uk/etl/default.htm. The technologies include biomass heat, CHP, solar thermal GSHP together with a number of energy efficiency systems. It should be noted, however, that fiscal incentive schemes such as ECA tend to reflect Government policy and as such can be subject to periodic change. When considering the timing of potential capital investment in renewable energy systems a view must be taken as to the likelihood of such schemes continuing, ceasing or being enhanced in the future. It would, however, seem reasonable to expect that the currently established broad consensus between all political parties of the need to incentivise investment in renewables is likely to continue. However, the detail of such schemes can change even without changes in Government and it is therefore important to keep up to date with the current schemes when planning investment.
Capital grant schemes Across the UK there are many capital grant schemes which can support investment in renewable energy technology, reflecting current policy in local government and other public agencies. Publicly funded grant schemes vary depending on regionally determined priorities but generally favour projects which can demonstrate employment and environmental benefits, as well as fundamental viability. All such schemes will require completion of application forms and the preparation of business plans. It is important to note, however, that the majority of schemes operate only regionally or locally and what may be available for a particular farm business in a particular location may not apply to a neighbour across an administrative border. Details of grant rates, eligibility and conditions of grant are likely to vary from area to area. Similarly, grant schemes are frequently time-limited often reflecting the limitations of operating budgets. A scheme which supported one farm business in one year may not still be operating and therefore be unable to support a neighbouring farm with an identical project a year later.
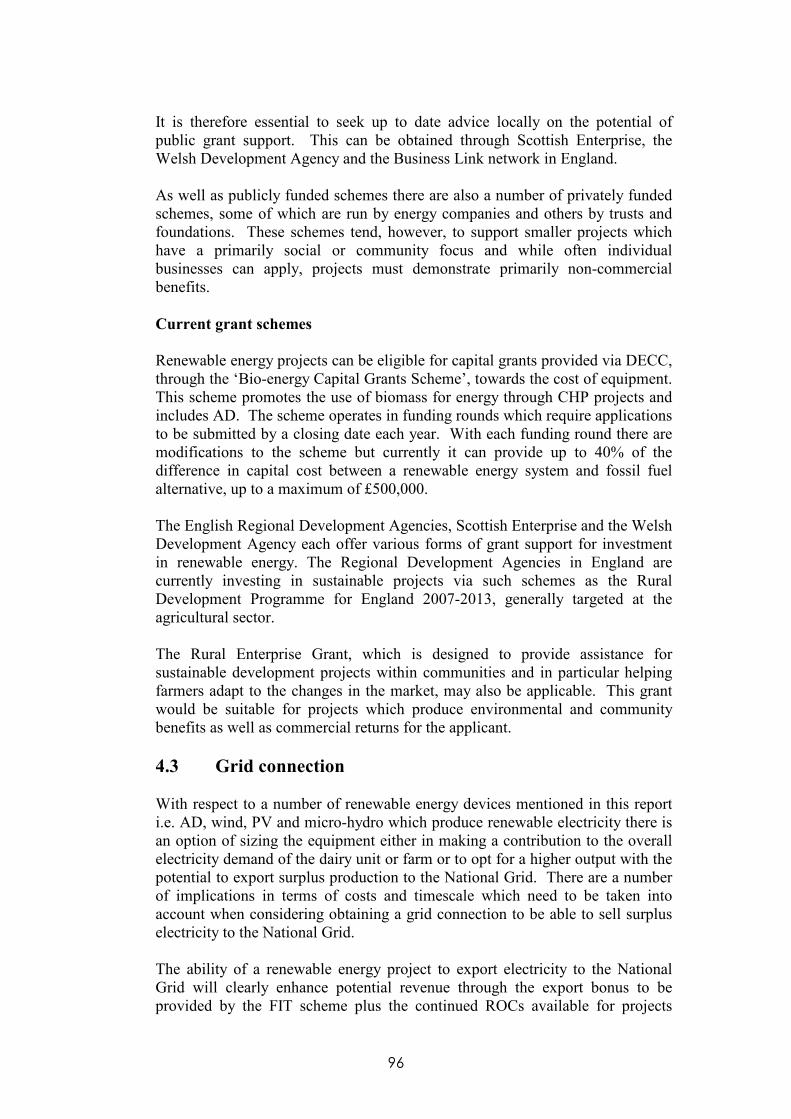
96
It is therefore essential to seek up to date advice locally on the potential of public grant support. This can be obtained through Scottish Enterprise, the Welsh Development Agency and the Business Link network in England. As well as publicly funded schemes there are also a number of privately funded schemes, some of which are run by energy companies and others by trusts and foundations. These schemes tend, however, to support smaller projects which have a primarily social or community focus and while often individual businesses can apply, projects must demonstrate primarily non-commercial benefits.
Current grant schemes Renewable energy projects can be eligible for capital grants provided via DECC, through the ‘Bio-energy Capital Grants Scheme’, towards the cost of equipment. This scheme promotes the use of biomass for energy through CHP projects and includes AD. The scheme operates in funding rounds which require applications to be submitted by a closing date each year. With each funding round there are modifications to the scheme but currently it can provide up to 40% of the difference in capital cost between a renewable energy system and fossil fuel alternative, up to a maximum of £500,000. The English Regional Development Agencies, Scottish Enterprise and the Welsh Development Agency each offer various forms of grant support for investment in renewable energy. The Regional Development Agencies in England are currently investing in sustainable projects via such schemes as the Rural Development Programme for England 2007-2013, generally targeted at the agricultural sector. The Rural Enterprise Grant, which is designed to provide assistance for sustainable development projects within communities and in particular helping farmers adapt to the changes in the market, may also be applicable. This grant would be suitable for projects which produce environmental and community benefits as well as commercial returns for the applicant.
4.3 Grid connection
With respect to a number of renewable energy devices mentioned in this report i.e. AD, wind, PV and micro-hydro which produce renewable electricity there is an option of sizing the equipment either in making a contribution to the overall electricity demand of the dairy unit or farm or to opt for a higher output with the potential to export surplus production to the National Grid. There are a number of implications in terms of costs and timescale which need to be taken into account when considering obtaining a grid connection to be able to sell surplus electricity to the National Grid. The ability of a renewable energy project to export electricity to the National Grid will clearly enhance potential revenue through the export bonus to be provided by the FIT scheme plus the continued ROCs available for projects

97
generating more than 5MW. The increased potential revenue must however be considered against the additional capital costs associated with achieving grid connection. The National Grid is managed regionally through Distribution Network Operators (DNOs). The DNO is obliged to provide connection to any business or household which requests it via a formal application process, for which a design fee is payable by the applicant. In responding to a formal application the DNO will produce a site specific connection design accompanied by a cost based on published and regulated criteria. While the DNO is obliged to provide the design and the connection, it is the applicant who must pay for the cost of the connection. These costs can vary considerably depending on the specific location of the generating plant, the proximity of power lines and of a suitable connection point. A critical aspect is also to identify the amount of electricity that can be supplied to the grid as even farms which appear to have good connection capability can be restricted in the amount of electricity that the local network can accept. It is also essential to consider whether the supply line into the farm is either single or three-phase with particular restrictions facing the amount of single phase electricity that can be exported into the National Grid. This is particularly important with technologies like AD where the proposal is to supply large amounts of electricity surplus to on-site demand to the National Grid. In addition, some AD systems may themselves require a three-phase supply in order to be able to operate effectively. An overhead electricity line is not an indication of the potential for a grid connection as a sub-station connection is needed through to a transformer. It becomes very expensive if a new sub-station/transformer is needed. If a new overhead line is needed then wayleave is required if this is to cross someone else’s property. It is therefore necessary to contact the regional arm of the relevant DNO with respect to physical connection issues and make an on-line application which can take up to 90 days to turn around. It is also advisable to contact an expert/consultant for advice on connection issues. In addition you will need to have a contract in place with an energy supplier to buy the electricity. Published costs for connection to the National Grid indicate a range of £20,000 - £60,000 for connection and £20,000 - £30,000 per km (Burgess Salmon 2008). Micro generation schemes producing less than 6kW can export to the grid without incurring costs from the DNO but any system above this level will incur design and installation costs. In nearly all instances the starting point for consideration of grid connection must be the generation capacity of the proposed installation, which will be governed by the factors specific to each technology as set out in this report. The achievable generation capacity then needs to be set against the internal site and in some instances the local network demand requirements. Only when the generation capacity of the proposed development exceeds on-site and local demand should grid connection be actively pursued. Where generation exceeds

98
on-site and local demand a calculation must be made of the additional income to be generated against the additional capital costs incurred in order to identify the potential payback period.
4.4 Planning Permission
Permitted development Most developments within agricultural enterprises can be undertaken without planning permission through Permitted Development regulations, as long as the purpose of the proposed development is primarily agricultural. Whether the installation of renewable energy generation systems would constitute an agricultural purpose is open to interpretation, which is likely to be influenced by whether the energy generated is primarily for on-site farm use or for export. There are however certain limitations within the regulations which relate to proximity of proposed development to public highways, domestic residences and other designated features and also to specific activities or uses of a development such as housing of livestock. Even if the development was determined to be for primarily agricultural use, it remains a requirement to apply to the Local Planning Authority for a decision on whether the proposed project would be within Permitted Development regulations or would require planning approval. It is essential to comply with this requirement because to commence a development without having done so could result in planning approval being required even if the proposal fell within permitted development.
Planning policy Planning policy in respect of renewable energy is contained in PPS22(2004) for England, MIPPS(2005) for Wales and in SPP6 for Scotland. These policy statements seek to facilitate renewable energy developments as long as the environmental, social and economic impacts are satisfactorily addressed. The policies apply equally to micro renewable developments as to larger commercial scale developments. The policies do however specify the need for consideration of proximity of proposed developments to designated environmental or heritage sites and designated buildings as well as their visual impact on green belts and the wider landscape. Development is required to demonstrate that it has sought to minimise adverse impact on these features, through design and specific location of proposed installations, and that appropriate local consultation has been undertaken. Other potentially adverse impacts of development such as noise, odours and increases in local traffic movements are also important considerations.
Pre-application principles In all instances it is advisable to seek advice on planning early in the process of considering development of renewable energy installations and well before major costs in time and money have been incurred. Local Planning Authorities

99
will give pre-application advice, although their capacity to do so varies considerably. The level of the advice they can provide is proportionate to the amount of detail you can provide on your proposal, so some degree of cost at least in terms of time and project planning is required up front. As a minimum you should be able to set out:
• the type of system you are proposing to install.
• its proposed location.
• its size and dimensions (in particular its height).
• the levels of noise and odour it may produce.
• anticipated impacts on traffic levels both during construction and in its subsequent operation.
In locations where there are specific material considerations which may impact on the determination of planning permission, and for larger and commercial scale installations it may be worthwhile engaging the professional services of a planning consultant. In these circumstances a consultant can ultimately save you both time and money. Before employing a professional planning service however it is sensible to have found out as much as you can about how your proposed development may be viewed by the Local Planning Authority, as this will enable you to define more clearly what you require from your consultant, and thereby control the costs of their engagement. In all cases where objections may be anticipated it is beneficial to undertake local consultation with residents and any special interest groups and to do so early in the development of proposals so that if technically and commercially possible, adjustments can be made to mitigate those objections. Planning Authorities are more likely to look favourably on applications which can demonstrate that local consultation has been undertaken and that they have sought to accommodate local concerns within their proposals, than those which can not. As stated above, in all cases it will be necessary for an application to be made to the Local Planning Authority to determine whether your proposal falls within Permitted Development regulations.
Technology specific considerations For each renewable energy technology there are some particular aspects which need to be considered and which can impact on the requirement for planning approval and on its likelihood of being granted. In each instance it is important to consider what may be done to mitigate any adverse impacts of your proposed development in terms of specific location, system design details and planned operational management of the system.

100
Anaerobic Digestion In addition to the Environment Agency Regulations set out in Section 3.2, proposals to install an AD plant will be considered in terms of their anticipated impacts through:
• odours from storage and handling of feedstock, the functioning of the bioreactor itself, emissions from biogas combustion, management of solid and liquid digestates.
• noise from feedstock handling and maceration, agitation of digestor, biogas combustion, digestate handling (this may be a significant consideration for some continuous feed systems).
• traffic movements both during construction phase and subsequent plant operation (this may be particularly significant where feedstocks from, and uses of digestates are off-farm).
Wind Wind generation developments are arguably the most contentious in terms of gaining planning approval. Their features which are most likely to raise objections and which require particular consideration are:
• visual impact, as determined by the topography of the precise location proposed for the turbines and their height.
• the turbine’s proximity to dwellings, public highways and to designated sites, landscapes and buildings. This could have both noise and visual impacts.
• the turbulence generated by the turbines. In some locations this can raise objections due to potential adverse impacts on aviation and radar systems as well as to protected species (* see below).
• traffic impact, primarily during the construction phase which may also necessitate the construction of new access roads.
Early consultation with local residents, interest groups and statutory bodies is strongly advised when considering the installation of wind turbines, as otherwise determination of Planning permission can be significantly delayed and potentially jeopardised. * Research is currently being undertaken into the impact of wind turbines on bat populations. Natural England’s Guidance Note (2009) currently recommends that wind turbines should be situated a minimum of 50m from woodland where bats are present. Where turbines are proposed to be located closer to woodland it will be necessary to establish whether there is a local bat population. This is done through conducting a bat survey which should be conducted monthly between April and October in the same calendar year. Failure to have conducted an adequate survey prior to the submission of an application for Planning permission could therefore significantly delay its determination. Bat surveys may also be required for proposed developments which effect the external fabric of existing buildings (such as the installation of solar panels) and the presence of bats can require mitigation through adjustment to design proposals and

101
scheduling of construction work to avoid disturbance to breeding or hibernation roosts.
Biomass/CHP Proposals to install biomass CHP systems will often face minimal hurdles in terms of Planning as they are frequently housed within existing farm buildings. Whether existing or new buildings are intended to be used, it remains necessary to apply for a Permitted Development determination from the Local Planning Authority as permission for change of use may be required. In some cases, depending on the specific location it may be necessary to consider vehicle movements and access requirements, primarily in terms of supply of feedstock.
Solar PV As with Biomass, CHP the installation of Solar PV systems is generally unlikely to be prohibited through Planning. The same requirements apply for application to the Local Planning Authority in respect of Permitted Development regulations. The most likely exceptions to this will occur when the building on which the panels are proposed to be installed is:
• Listed, within the setting of another Listed building or within a Conservation Area.
• within a designated site or landscape.
• when protected species such as bats (see above) or barn owls are present within the building.
GSHP As most of the fabric of a GSHP is by definition underground the potential for their installation to be prevented through Planning is limited. The same considerations will however apply to particular buildings as stated for Solar PV above. In addition there may be particular requirements which need to be addressed in relation to:
• impact on surface water drainage and the water table as a result of excavation.
• impact on protected environments depending on the exact location of the GSHP system.
Micro-hydro Systems which require new construction or change of use of existing buildings will have to go through the same application processes with the Planning Authority as laid out above and the same general considerations will apply. Micro-hydro systems will also require an abstraction licence and an

102
impoundment licence to allow water to be taken out of or diverted from a water course or for a water course to be dammed. These licences together with the required land drainage consent require an application to be made to the Environment Agency, and will be considered in terms of the project proposal’s impact on:
• flood risk.
• river ecology.
• fish populations (including potential impacts on migratory fish).

103
5.0
Su
mm
ary
ta
ble
s 5.1
Su
mm
ary
ass
essm
ent
of
ren
ewab
le e
ner
gy t
ech
nolo
gie
s T
he
foll
ow
ing m
atri
x i
s in
tended
to g
ive
an o
ver
all
asse
ssm
ent
of
the
rela
tive
attr
acti
ven
ess
of
dif
fere
nt
renew
able
ener
gy t
echnolo
gie
s ag
ainst
a
num
ber
of
consi
der
atio
ns.
T
he
colo
ur
codin
g f
or
each
tec
hnolo
gy a
gai
nst
eac
h c
onsi
der
atio
n i
s m
eant
to i
ndic
ate
deg
ree
of
attr
acti
ven
ess
to
dai
ry f
arm
ing o
per
atio
ns,
wit
h g
reen
sig
nif
yin
g t
he
most
posi
tive
level
and r
ed t
he
leas
t posi
tive
level
. T
ech
nolo
gy
Ben
efit
s to
d
air
y
op
erati
on
s
En
ergy
ou
tpu
t In
com
e/
savin
gs
pote
nti
al
Cap
ital
Cost
s/
kW
CO
2
savin
gs
Reg
ula
tory
re
qu
irem
ents
S
ite
req
uir
emen
ts
Sou
rce/
fe
edst
ock
sup
ply
Volu
me/
ca
paci
ty
crit
icali
ty
Lea
d
tim
e
Gre
en R
ati
ng
Hig
h
CH
P
Hig
h
Low
H
igh
Low
L
ow
N
egli
gib
le
Low
S
hort
Yel
low
Rati
ng
Med
ium
P
ow
er o
nly
M
ediu
m
Med
ium
M
ediu
m
Med
ium
M
ediu
m
Sig
nif
ican
t M
ediu
m
Med
ium
Red
Rati
ng
Low
H
eat
only
L
ow
H
igh
Low
H
igh
Hig
h
Cri
tica
l H
igh
Long
AD
Bio
mas
s hea
t
Bio
mas
s C
HP
Win
d
Sola
r th
erm
al
Sola
r P
V
GS
HP
Mic
ro–hydro

104
5.2
Su
mm
ary
ass
essm
ent
an
d c
om
men
tary
of
ren
ewab
le t
ech
nolo
gie
s 5.2
.1 A
naer
ob
ic D
iges
tion
Fa
cto
r R
ati
ng
C
om
men
tary
Ben
efit
s to
Da
iry
Op
era
tio
ns
C
an
pro
vid
e th
erm
al
an
d e
lect
rici
ty r
equ
irem
ents
fo
r d
air
y o
per
ati
on
, u
tili
ses
da
iry
wa
stes
, im
pro
ves
nu
trie
nt
ma
na
gem
ent,
uti
lise
s d
iges
tate
as
fert
ilis
er
En
ergy O
utp
ut
H
eat
for
pote
nti
al a
pp
lica
tion
in
to d
airy
an
d o
ther
far
min
g p
roce
sses
an
d b
uil
din
gs;
ele
ctri
city
can
be
use
d o
n s
ite
and
/or
exp
ort
ed t
o N
atio
nal
Gri
d;
gas
may
als
o
be
use
d o
n s
ite
for
hot
wat
er o
r sp
ace
hea
tin
g
Inco
me
/ S
avin
gs
Pote
nti
al
E
lect
rici
ty e
xp
ort
to g
rid
; p
oss
ible
gat
e fe
e in
com
e; s
avin
gs
in e
ner
gy c
ost
s of
dai
ry a
nd
oth
er f
arm
op
erat
ion
s an
d f
rom
dis
pla
cem
ent
of
inorg
anic
fer
tili
sers
Cap
ital
Cost
s /
KW
e /
KW
t
Hig
h c
apit
al c
ost
s of
pla
nt
and
of
civil
en
gin
eeri
ng d
epen
din
g o
n s
ite
layou
t; c
ost
s p
er k
W o
utp
ut
red
uce
d s
ign
ific
antl
y a
t th
resh
old
s of
> 2
50
kW
.
CO
2 P
erfo
rman
ce
Red
uce
s em
issi
on
s fr
om
an
imal
was
tes;
low
er e
mis
sion
s fr
om
bio
gas
th
an f
rom
foss
il f
uel
s; r
enew
able
en
ergy s
ou
rce;
sav
ings
from
rep
lace
men
t of
inorg
anic
fe
rtil
iser
s b
y d
iges
tate
s
Reg
ula
tory
Req
uir
emen
ts
P
lan
nin
g p
erm
issi
on
req
uir
ed a
nd
dep
end
ent
on
sit
e d
esig
n,
vis
ual
im
pac
t, v
ehic
le m
ovem
ents
for
feed
stock
s et
c; E
nvir
on
men
t A
gen
cy l
icen
ce r
equ
ired
Sit
e R
equ
irem
ents
Rel
atio
nsh
ip t
o f
eed
stock
su
pp
ly,
on
-sit
e en
ergy u
sage
and
to c
on
nec
tion
to G
rid
cri
tica
l to
cap
ital
cost
s
Sou
rce
/ F
eed
stock
Su
pp
lies
Loca
l geo
gra
ph
y o
f fe
edst
ock
su
pp
lies
cri
tica
l to
over
all
econ
om
ics
of
op
erat
ion
(tr
ansp
ort
atio
n a
nd
mat
eria
ls h
and
lin
g).
Volu
mes
an
d s
easo
nal
ity o
f fe
edst
ock
su
pp
ly a
lso c
riti
cal
to v
iab
ilit
y
Volu
me
/ C
apac
ity C
riti
cali
ty
U
nit
cost
per
kW
cap
acit
y s
ensi
tive
to s
cale
red
uci
ng v
iab
ilit
y a
t sm
alle
r volu
mes
; te
chn
olo
gy s
up
ply
in
du
stry
pri
ori
tise
lar
ger
sca
le p
roje
cts
Lea
d T
ime
to I
nst
alla
tion
Pla
nn
ing p
roce
ss r
elat
ivel
y s
hort
, p
rocu
rem
ent
and
des
ign
pro
cess
may
tak
e so
me
tim
e, g
iven
rel
ativ
ely u
nd
erd
evel
op
ed A
D s
up
ply
ch
ain
in
UK
5.2
.2 B
iom
ass
Hea
t F
act
or
Ra
tin
g
Co
mm
enta
ry
Ben
efit
s to
Da
iry
Op
era
tio
ns
M
od
est
ben
efit
to
da
iry
fa
rms
bec
au
se o
f th
erm
al
on
ly e
ner
gy
ou
tpu
t.
En
ergy O
utp
ut
T
her
mal
ou
tpu
t on
ly,
sever
ely l
imit
s b
enef
its
to d
airy
pro
du
ctio
n.
Inco
me
/ S
avin
gs
Pote
nti
al
L
ow
in
com
e an
d s
avin
gs
pote
nti
al f
or
dai
ry f
arm
s, d
epen
den
t on
loca
l n
on
-dai
ry d
eman
d f
or
hea
t p
rod
uce
d.
Cap
ital
Cost
s /
KW
e /
KW
t
Com
pet
itiv
e su
pp
ly i
nd
ust
ry r
edu
ces
cost
s of
boil
er s
yst
em;
dis
tric
t or
dis
trib
ute
d h
eati
ng s
yst
ems
cost
s ca
n b
e h
igh
dep
end
ing o
n n
etw
ork
siz
e an
d l
ayou
t; b
oil
er
syst
ems
can
oft
en b
e ac
com
mod
ated
in
exis
tin
g b
uil
din
gs
CO
2 P
erfo
rman
ce
R
ated
car
bon
neu
tral
du
e to
bal
anci
ng o
f em
issi
on
s w
ith
car
bon
con
sum
ed i
n g
row
ing o
f b
iom
ass.
Reg
ula
tory
Req
uir
emen
ts
R
elat
ivel
y m
inim
al r
equ
irem
ents
; w
ill
gen
eral
ly b
e co
nsi
der
ed t
o b
e w
ith
in P
erm
itte
d D
evel
op
men
t re
gu
lati
on
s.
Sit
e R
equ
irem
ents
Ver
y f
ew r
equ
irem
ents
oth
er t
han
low
sp
ecif
icat
ion
bu
ild
ing a
ccom
mod
atio
n a
nd
ad
equ
ate
acce
ss a
nd
fu
el s
tora
ge
area
s
Sou
rce
/ F
eed
stock
Su
pp
lies
Req
uir
es l
oca
l su
pp
ly o
f w
ood
chip
or
pel
lets
wh
ich
are
bec
om
ing a
vai
lab
le i
n m
ost
reg
ion
s of
the
UK
Volu
me
/ C
apac
ity C
riti
cali
ty
S
yst
em e
ffic
ien
cy n
ot
dep
end
ent
on
siz
e of
inst
alla
tion
Lea
d T
ime
to I
nst
alla
tion
Syst
ems
gen
eral
ly r
ead
ily a
vai
lab
le;
rela
tivel
y s
hort
pro
cure
men
t an
d P
lan
nin
g a
nd
cap
ital
bu
ild
lea
d t
imes
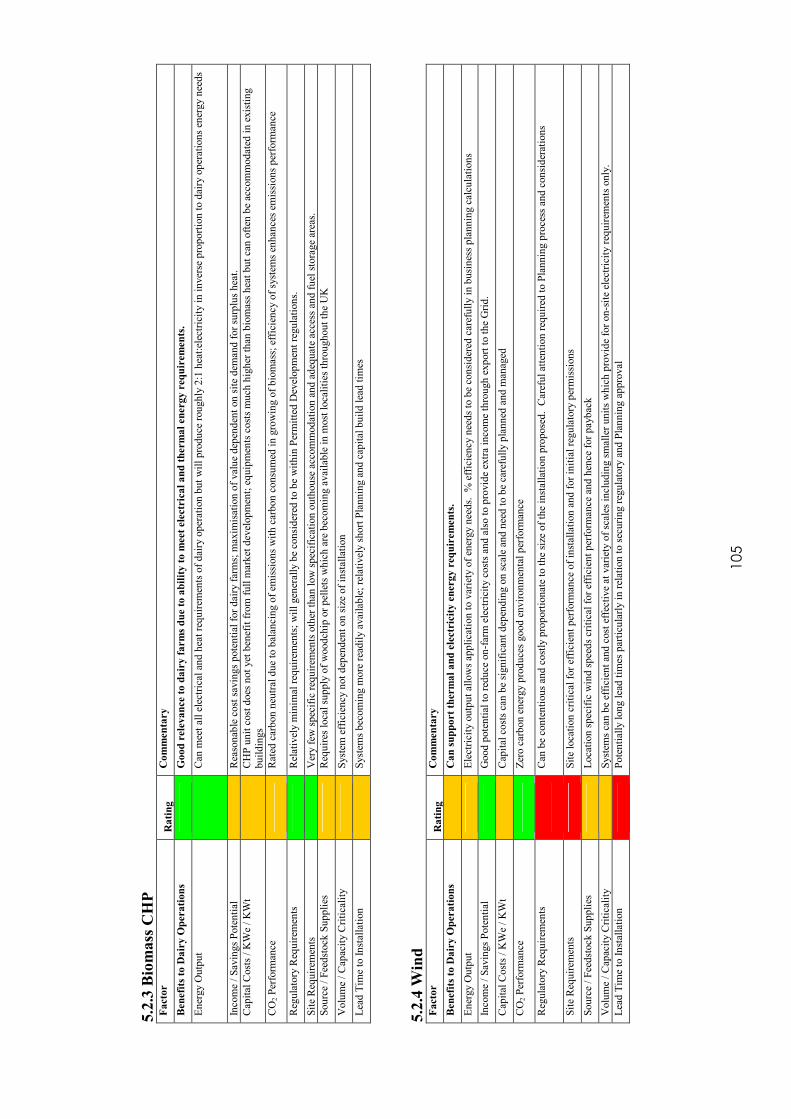
105
5.2
.3 B
iom
ass
CH
P
Fa
cto
r R
ati
ng
C
om
men
tary
Ben
efit
s to
Da
iry
Op
era
tio
ns
G
oo
d r
elev
an
ce t
o d
air
y f
arm
s d
ue
to a
bil
ity
to
mee
t el
ectr
ica
l a
nd
th
erm
al
ener
gy
req
uir
emen
ts.
En
ergy O
utp
ut
Can
mee
t al
l el
ectr
ical
an
d h
eat
req
uir
emen
ts o
f d
airy
op
erat
ion
bu
t w
ill
pro
du
ce r
ou
gh
ly 2
:1 h
eat:
elec
tric
ity i
n i
nver
se p
rop
ort
ion
to d
airy
op
erat
ion
s en
ergy n
eed
s
Inco
me
/ S
avin
gs
Pote
nti
al
R
easo
nab
le c
ost
sav
ings
pote
nti
al f
or
dai
ry f
arm
s; m
axim
isat
ion
of
val
ue
dep
end
ent
on
sit
e d
eman
d f
or
surp
lus
hea
t.
Cap
ital
Cost
s /
KW
e /
KW
t
CH
P u
nit
cost
does
not
yet
ben
efit
fro
m f
ull
mar
ket
dev
elop
men
t; e
qu
ipm
ents
cost
s m
uch
hig
her
th
an b
iom
ass
hea
t b
ut
can
oft
en b
e ac
com
mod
ated
in
exis
tin
g
bu
ild
ings
CO
2 P
erfo
rman
ce
R
ated
car
bon
neu
tral
du
e to
bal
anci
ng o
f em
issi
on
s w
ith
car
bon
con
sum
ed i
n g
row
ing o
f b
iom
ass;
eff
icie
ncy
of
syst
ems
enh
ance
s em
issi
on
s p
erfo
rman
ce
Reg
ula
tory
Req
uir
emen
ts
R
elat
ivel
y m
inim
al r
equ
irem
ents
; w
ill
gen
eral
ly b
e co
nsi
der
ed t
o b
e w
ith
in P
erm
itte
d D
evel
op
men
t re
gu
lati
on
s.
Sit
e R
equ
irem
ents
Ver
y f
ew s
pec
ific
req
uir
emen
ts o
ther
th
an l
ow
sp
ecif
icat
ion
ou
thou
se a
ccom
mod
atio
n a
nd
ad
equ
ate
acce
ss a
nd
fu
el s
tora
ge
area
s.
Sou
rce
/ F
eed
stock
Su
pp
lies
Req
uir
es l
oca
l su
pp
ly o
f w
ood
chip
or
pel
lets
wh
ich
are
bec
om
ing a
vai
lab
le i
n m
ost
loca
liti
es t
hro
ugh
ou
t th
e U
K
Volu
me
/ C
apac
ity C
riti
cali
ty
S
yst
em e
ffic
ien
cy n
ot
dep
end
ent
on
siz
e of
inst
alla
tion
Lea
d T
ime
to I
nst
alla
tion
Syst
ems
bec
om
ing m
ore
rea
dil
y a
vai
lab
le;
rela
tivel
y s
hort
Pla
nn
ing a
nd
cap
ital
bu
ild
lea
d t
imes
5.2
.4 W
ind
Fa
cto
r R
ati
ng
C
om
men
tary
Ben
efit
s to
Da
iry
Op
era
tio
ns
C
an
su
pp
ort
th
erm
al
an
d e
lect
rici
ty e
ner
gy
req
uir
emen
ts.
En
ergy O
utp
ut
E
lect
rici
ty o
utp
ut
allo
ws
app
lica
tion
to v
arie
ty o
f en
ergy n
eed
s.
% e
ffic
ien
cy n
eed
s to
be
con
sid
ered
car
efu
lly i
n b
usi
nes
s p
lan
nin
g c
alcu
lati
on
s
Inco
me
/ S
avin
gs
Pote
nti
al
G
ood
pote
nti
al t
o r
edu
ce o
n-f
arm
ele
ctri
city
cost
s an
d a
lso t
o p
rovid
e ex
tra
inco
me
thro
ugh
exp
ort
to t
he
Gri
d.
Cap
ital
Cost
s /
KW
e /
KW
t
Cap
ital
cost
s ca
n b
e si
gn
ific
ant
dep
end
ing o
n s
cale
an
d n
eed
to b
e ca
refu
lly p
lan
ned
an
d m
anag
ed
CO
2 P
erfo
rman
ce
Z
ero c
arb
on
en
ergy p
rod
uce
s good
en
vir
on
men
tal
per
form
ance
Reg
ula
tory
Req
uir
emen
ts
Can
be
con
ten
tiou
s an
d c
ost
ly p
rop
ort
ion
ate
to t
he
size
of
the
inst
alla
tion
pro
pose
d.
Car
efu
l at
ten
tion
req
uir
ed t
o P
lan
nin
g p
roce
ss a
nd
con
sid
erat
ion
s
Sit
e R
equ
irem
ents
Sit
e lo
cati
on
cri
tica
l fo
r ef
fici
ent
per
form
ance
of
inst
alla
tion
an
d f
or
init
ial
regu
lato
ry p
erm
issi
on
s
Sou
rce
/ F
eed
stock
Su
pp
lies
Loca
tion
sp
ecif
ic w
ind
sp
eed
s cr
itic
al f
or
effi
cien
t p
erfo
rman
ce a
nd
hen
ce f
or
pay
bac
k
Volu
me
/ C
apac
ity C
riti
cali
ty
S
yst
ems
can
be
effi
cien
t an
d c
ost
eff
ecti
ve
at v
arie
ty o
f sc
ales
in
clu
din
g s
mal
ler
un
its
wh
ich
pro
vid
e fo
r on
-sit
e el
ectr
icit
y r
equ
irem
ents
on
ly.
Lea
d T
ime
to I
nst
alla
tion
Pote
nti
ally
lon
g l
ead
tim
es p
arti
cula
rly i
n r
elat
ion
to s
ecu
rin
g r
egu
lato
ry a
nd
Pla
nn
ing a
pp
roval

106
5.2
.5 S
ola
r th
erm
al
Fa
cto
r R
ati
ng
C
om
men
tary
Ben
efit
s to
Da
iry
Op
era
tio
ns
M
od
est
ben
efit
to
da
iry
fa
rms
bec
au
se o
f th
erm
al
ou
tpu
t o
nly
.
En
ergy O
utp
ut
R
easo
nab
ly e
ffic
ien
t en
ergy o
utp
ut
bu
t re
stri
cted
to t
her
mal
on
ly
Inco
me
/ S
avin
gs
Pote
nti
al
M
od
erat
e in
com
e an
d s
avin
gs
pote
nti
al f
or
dai
ry f
arm
s.
Cap
ital
Cost
s /
KW
e /
KW
t
Com
pet
itiv
e su
pp
ly i
nd
ust
ry i
s re
du
cin
g s
yst
em c
ost
s; r
elat
ivel
y c
hea
p i
nst
alla
tion
cost
s w
ith
lit
tle
asso
ciat
ed c
on
stru
ctio
n w
ork
.
CO
2 P
erfo
rman
ce
C
arb
on
zer
o t
ech
nolo
gy s
o h
igh
em
issi
on
s p
erfo
rman
ce.
Reg
ula
tory
Req
uir
emen
ts
R
elat
ivel
y m
inim
al r
equ
irem
ents
; w
ill
gen
eral
ly b
e co
nsi
der
ed t
o b
e w
ith
in P
erm
itte
d D
evel
op
men
t re
gu
lati
on
s.
Sit
e R
equ
irem
ents
Sp
ecif
ic r
equ
irem
ents
bu
t re
lati
vel
y f
req
uen
tly a
vai
lab
le w
ith
in e
xis
tin
g f
arm
op
erat
ion
s.
Sou
rce
/ F
eed
stock
Su
pp
lies
Rea
son
able
gen
erat
ion
can
be
ach
ieved
th
rou
gh
ou
t U
K a
s d
epen
den
t on
lig
ht
rath
er t
han
hea
t al
thou
gh
su
bje
ct t
o r
egio
nal
var
iati
on
Volu
me
/ C
apac
ity C
riti
cali
ty
S
yst
em e
ffic
ien
cy n
ot
dep
end
ent
on
siz
e of
inst
alla
tion
bu
t m
ust
be
scal
ed t
o m
eet
on
-sit
e re
qu
irem
ents
Lea
d T
ime
to I
nst
alla
tion
Syst
ems
gen
eral
ly r
ead
ily a
vai
lab
le;
rela
tivel
y s
hort
pro
cure
men
t an
d P
lan
nin
g a
nd
cap
ital
bu
ild
lea
d t
imes
5.2
.6 S
ola
r P
V
Fa
cto
r R
ati
ng
C
om
men
tary
Ben
efit
s to
Da
iry
Op
era
tio
ns
M
od
est
ben
efit
to
da
iry
fa
rms
in r
edu
ctio
n o
f en
erg
y c
ost
s.
En
ergy O
utp
ut
L
ow
eff
icie
ncy
of
elec
tric
ity p
rod
uct
ion
Inco
me
/ S
avin
gs
Pote
nti
al
M
od
erat
e sa
vin
gs
pote
nti
al f
or
dai
ry f
arm
s d
epen
den
t on
sca
lin
g o
f in
stal
lati
on
to m
eet
on
-sit
e el
ectr
ical
nee
ds
Cap
ital
Cost
s /
KW
e /
KW
t
Com
pet
itiv
e su
pp
ly i
nd
ust
ry i
s re
du
cin
g s
yst
ems
cost
s; r
elat
ivel
y c
hea
p i
nst
alla
tion
cost
s w
ith
lit
tle
asso
ciat
ed c
on
stru
ctio
n w
ork
, b
ut
un
it c
ost
of
PV
arr
ays
rem
ain
h
igh
CO
2 P
erfo
rman
ce
C
arb
on
zer
o t
ech
nolo
gy s
o h
igh
em
issi
on
s p
erfo
rman
ce.
Reg
ula
tory
Req
uir
emen
ts
R
elat
ivel
y m
inim
al r
equ
irem
ents
; w
ill
gen
eral
ly b
e co
nsi
der
ed t
o b
e w
ith
in P
erm
itte
d D
evel
op
men
t re
gu
lati
on
s.
Sit
e R
equ
irem
ents
Sp
ecif
ic r
equ
irem
ents
bu
t re
lati
vel
y f
req
uen
tly a
vai
lab
le w
ith
in e
xis
tin
g f
arm
op
erat
ion
s.
Sou
rce
/ F
eed
stock
Su
pp
lies
Rea
son
able
th
erm
al g
ener
atio
n c
an b
e ac
hie
ved
un
der
UK
con
dit
ion
s as
dep
end
ent
on
lig
ht
rath
er t
han
hea
t.
Volu
me
/ C
apac
ity C
riti
cali
ty
S
yst
em e
ffic
ien
cy n
ot
dep
end
ent
on
siz
e of
inst
alla
tion
bu
t m
ust
be
scal
ed t
o m
eet
on
-sit
e re
qu
irem
ents
Lea
d T
ime
to I
nst
alla
tion
Syst
ems
gen
eral
ly r
ead
ily a
vai
lab
le;
rela
tivel
y l
ow
Pla
nn
ing a
nd
reg
ula
tory
req
uir
emen
ts a
nd
gen
eral
ly l
ow
cap
ital
bu
ild
cost
s m
ake
inst
alla
tion
lea
d t
ime
rela
tivel
y s
hort

107
5.2
.7 G
SH
P
Fa
cto
r R
ati
ng
C
om
men
tary
Ben
efit
s to
Da
iry
Op
era
tio
ns
M
od
est
ben
efit
to
da
iry
fa
rms
bec
au
se o
f th
erm
al
ou
tpu
t o
nly
.
En
ergy O
utp
ut
R
easo
nab
ly e
ffic
ien
t en
ergy o
utp
ut
bu
t re
stri
cted
to t
her
mal
on
ly
Inco
me
/ S
avin
gs
Pote
nti
al
M
od
erat
e in
com
e an
d s
avin
gs
pote
nti
al f
or
dai
ry f
arm
s, d
epen
den
t on
loca
l n
on
-dai
ry d
eman
d f
or
hea
t p
rod
uce
d.
Cap
ital
Cost
s /
KW
e /
KW
t
Com
pet
itiv
e su
pp
ly i
nd
ust
ry i
s re
du
cin
g s
yst
ems
cost
s; r
elat
ivel
y c
hea
p i
nst
alla
tion
cost
s w
ith
lit
tle
asso
ciat
ed c
on
stru
ctio
n w
ork
.
CO
2 P
erfo
rman
ce
C
arb
on
zer
o t
ech
nolo
gy s
o h
igh
em
issi
on
s p
erfo
rman
ce.
Reg
ula
tory
Req
uir
emen
ts
R
elat
ivel
y m
inim
al r
equ
irem
ents
; w
ill
gen
eral
ly b
e co
nsi
der
ed t
o b
e w
ith
in P
erm
itte
d D
evel
op
men
t re
gu
lati
on
s.
Sit
e R
equ
irem
ents
Req
uir
emen
ts c
an g
ener
ally
be
met
in
most
cir
cum
stan
ces,
bu
t sp
ecif
ic g
rou
nd
con
dit
ion
s sh
ou
ld b
e as
cert
ain
ed.
Sou
rce
/ F
eed
stock
Su
pp
lies
Rea
son
able
th
erm
al g
ener
atio
n c
an b
e ac
hie
ved
th
rou
gh
ou
t U
K.
Volu
me
/ C
apac
ity C
riti
cali
ty
S
yst
em e
ffic
ien
cy n
ot
dep
end
ent
on
siz
e of
inst
alla
tion
bu
t m
ust
be
scal
ed t
o m
eet
on
-sit
e re
qu
irem
ents
Lea
d T
ime
to I
nst
alla
tion
Syst
ems
gen
eral
ly r
ead
ily a
vai
lab
le;
rela
tivel
y l
ow
Pla
nn
ing a
nd
reg
ula
tory
req
uir
emen
ts a
nd
gen
eral
ly l
ow
cap
ital
bu
ild
cost
s m
ake
inst
alla
tion
lea
d t
ime
rela
tivel
y s
hort
5.2
.8 M
icro
-hyd
ro
Fa
cto
r R
ati
ng
C
om
men
tary
Ben
efit
s to
Da
iry
Op
era
tio
ns
Go
od
ap
pli
cab
ilit
y t
o d
air
y o
per
ati
on
s th
rou
gh
red
uct
ion
of
elec
tric
ity
co
sts
an
d p
ote
nti
al
ad
dit
ion
al
inco
me
bu
t w
ho
lly
dep
end
ent
on
ava
ila
bil
ity
of
suff
icie
nt
ead
an
d f
low
En
ergy O
utp
ut
G
ener
ally
low
lev
els
of
ener
gy o
utp
ut
bu
t ca
n p
rod
uce
con
stan
t su
pp
ly
Inco
me
/ S
avin
gs
Pote
nti
al
G
ood
lev
el o
f p
ote
nti
al i
nco
me
and
sav
ings
from
ele
ctri
cal
gen
erat
ion
if
via
bil
ity o
f sp
ecif
ic l
oca
tion
can
be
asce
rtai
ned
.
Cap
ital
Cost
s /
KW
e /
KW
t
Pote
nti
ally
hig
h c
apit
al c
ost
s of
civil
en
gin
eeri
ng a
lth
ou
gh
tu
rbin
e an
d g
ener
atio
n s
yst
ems
bec
om
ing m
ore
com
pet
itiv
e at
mic
ro-l
evel
CO
2 P
erfo
rman
ce
C
arb
on
zer
o g
ener
atio
n s
o h
igh
en
vir
on
men
tal
rati
ng.
Reg
ula
tory
Req
uir
emen
ts
P
lan
nin
g p
erm
issi
on
an
d s
pec
ific
En
vir
on
men
t A
gen
cy l
icen
ces
req
uir
ed
Sit
e R
equ
irem
ents
Hea
d a
nd
flo
w r
ate
are
abso
lute
ly c
riti
cal
Sou
rce
/ F
eed
stock
Su
pp
lies
Hea
d a
nd
flo
w r
ate
are
abso
lute
ly c
riti
cal
Volu
me
/ C
apac
ity C
riti
cali
ty
M
icro
syst
ems
can
be
effi
cien
t an
d v
iab
le d
epen
din
g o
n a
ssoci
ated
civ
ils
cost
s an
d s
pec
ific
flo
w a
nd
hea
d
Lea
d T
ime
to I
nst
alla
tion
Reg
ula
tory
, d
esig
n a
nd
civ
il e
ngin
eeri
ng r
equ
irem
ents
can
res
ult
in
lon
g l
ead
tim
e fo
r in
stal
lati
on
.

108
5.3
Su
mm
ary
of
dir
ect
CO
2 e
mis
sion
s fr
om
com
bu
stio
n
Fuel
Type
CO
2 K
g/k
Wh
S
avin
gs
v. G
rid
Ele
ctri
city
K
g /
annum
*
Coal
0.3
45
483
Oil
0.2
64
823
Nat
ura
l G
as
0.2
53
869
LP
G
0.2
34
949
Wood C
hip
(10%
MC
)
0.3
54
445
Wood P
elle
t (1
0%
MC
)
0.3
49
466
Bio
gas
(60%
CH
4 4
0%
CO
2)
0.2
46
898
Car
bon Z
ero T
echnolo
gie
s (W
ind, S
ola
r,
GS
HP
, M
icro
-hydro
) 0.0
1,9
32
Ele
ctri
city
equiv
alen
t (U
K G
rid)
0.4
60
-
----
-
Sourc
e: w
ww
.bio
mas
sener
gyce
ntr
e.org
.uk
* B
ased
on a
ver
age
UK
house
hold
usa
ge
of
4,2
00 k
Wh p
er a
nnum

109
5.4
Su
mm
ary
of
pote
nti
al
an
nu
al
fin
an
cial
an
d C
O2 s
avin
gs
from
pri
nci
pal
ener
gy e
ffic
ien
cy o
pp
ort
un
itie
s.
En
ergy
use
Eff
icie
ncy
mea
sure
Ind
icati
ve
cap
ital
cost
s
En
ergy
savin
g
kW
h
CO
2
savin
g
Ton
nes
6
Fin
an
cial
savin
g
£
Vac
uum
P
um
pin
g 1
V
SD
in
stal
lati
on
3,2
00
5,4
75
2.8
9
478
Cooli
ng 2
5
o ri
se i
n
pre
-cooli
ng
1,2
00
2,2
00
1.1
6
188
Hot
wat
er
hea
ting 3
H
RU
in
stal
lati
on
3,5
00
12,3
95
6.5
3
992
Lig
hti
ng 4
In
candes
cent
� C
FL
bulb
s
40 5
4,3
80
2.3
0
429
Ass
um
pti
on
s:
1 7
.5kW
oil
van
e vac
uum
pum
p o
n 3
phas
e su
pply
oper
ated
4 h
ours
a d
ay @
aver
age
of
7.7
25p /
kW
h p
rovid
ing 5
0%
sav
ings
on r
unnin
g c
ost
of
£955 p
.a.
2 P
re-c
ooli
ng e
ffic
iency
rai
sed f
rom
10
o t
o 1
5o C
for
1M
ltr
pre
-coole
d p
er a
nnum
@ a
ver
age
of
7.7
25p /
kW
h
3 U
pli
ft a
chie
ved
by H
RU
of
40
o
4 A
ll y
ear
round l
ighti
ng f
rom
10 b
ulb
s re
pla
ced
5 W
ill
requir
e an
nual
rep
lace
men
t (i
.e. ap
pro
x. ev
ery 1
0,0
00 h
ours
) 6 B
ased
on 0
.527 k
g C
O2/k
Wh (
Def
ra 2
007)

110
Disclaimer:
Reasonable effort has been made to utilise information in this document from reliable sources. However, Newcastle University and its employees do not guarantee or warrant the accuracy of their work in any way. Newcastle University and its employees shall not be responsible for any errors, omissions or damages either directly or consequentially arising from the use of information provided.
The pictures presented in this document are for illustrative purposes only and are not meant to favour any particular piece of equipment or technology.
111
References Action Renewables (2007). Make a difference on the farm – a guide to how renewable energy can work for you. URL:www.actionrenewables.org/uploads_documents/farm.pdf. Anaerobic Digestion Systems (2009).URL:http://www.anaerobic-digestion.com Anon (2009) Managing energy and carbon. The farmers guide to energy audits. URL: http://www.calu.bangor.ac.uk/Technical%20leaflets/Energyauditmanual.pdf Beardmore J (2005) Solar Power for Dairy farms. URL:www.nottenergy.com/files/solar_for_farms3.pdf Biomass Heating (2009) A practical guide for potential users. URL:www.carbontrust.co.uk Biomass Energy Centre. URL:http://www.biomassenergycentre.org.uk CHP Focus, 2008. URL: http://chp.decc.gov.uk Burgess Salmon (2008) ‘The in-house Lawyer’ July/August 2008. ISSN 1750-1784. Cafre (2009) Report of pilot energy benchmarking project. URL: http://www.ruralni.gov.uk/dairy_energy_report.pdf Carbon Trust (2009). URL:http://www.carbontrust.co.uk/cut-carbon-reduce-costs/products-services/sector-advice/Pages/agriculture-horticulture-1.aspx#Dairy Clemens J, Trimborn M, Weiland P and Amon B (2006). Mitigation of greenhouse gas emissions by anaerobic digestion of cattle slurry. Agriculture, Ecosystems and the Environment 112 p171-177. Collings, A (2008a). Key elements of milking machinery: Getting to grips with claws and clusters. Agri Publishing International Ltd: Tonbridge. Collings, A (2008b). Milk cooling technology: keep cool and chill out. Agri Publishing International Ltd: Tonbridge. Cowshed (2007) Improving Dairy Shed Energy Efficiency. URL:http://www.cowshed.org.nz CowTime (2006). Milk Cooling. URL:http://www.cowtime.com.au/technical/QuickNotes/Quicknote%204.7.pdf DairyCo (2010) Dairy herd and cow numbers URL:http://www.dairyco.org.uk DairyCo (2009a). Electricity Uses On A Dairy Farm. URL:http://www.dairyco.org.uk/farming-info-centre/buildings/electricity.aspx

112
DairyCo (2009b). Milk Cooling. URL:http://www.dairyco.org.uk/farming-info-centre/buildings/electricity/milk-cooling.aspx. DairyCo (2009c). Energy efficiency on farm – a practical guide. AHDB: Kenilworth DairyCo (2009d). Plate Heat Exchangers. URL:http://www.dairyco.org.uk/farming-info-centre/buildings/electricity/plate-heat-exchangers.aspx. DairyCo (2009e). Dairy Farm Milk Cooling Energy Use and Cost Calculator. URL:http://www.dairyco.org.uk/farming-info-centre/buildings/energy-cost-calculators/milk-cooling-calculator.aspx. Dairy Industry SA (2008). Cooling Milk. URL:http://www.dairyindustrysa.com.au/__data/assets/pdf_file/0005/60935/RRR_InfoSheet_-_Cooling_Milk.pdf Dairying for Tomorrow (2008). Dairy Pumps and Motors. URL:http://www.dairyingfortomorrow.com/uploads/documents/file/SA%20BMP%20Info%20Sheets/RRR%20fact%20sheet%20Dairy%20Pumps%20and%20Motors%20-%20low%20res.pdf. DARD (2008). Cutting energy costs on the farm. URL:http://www.ruralni.gov.uk/index/publications/press_articles/dairy-2/recent-5/cutting_energy_costs.htm. DECC (2008) Climate Change Act. URL: http://www.decc.gov.uk/en/content/cms/legislation/cc_act_08/cc_act_08.aspx DECC (2009) The UK Renewable Energy Strategy. URL;http://decc.gov.uk/en/content/cms/what_we_do/uk_supply/energy_mix/renewable/res/res.aspx DECC (2009a) Climate Change Statistics. URL: http://www.decc.gov.uk/en/content/cms/statistics/climate_change/climate_change.aspx DEFRA (2007). Act on CO2 Calculator: Public Trial Version Data, Methodology and Assumptions Paper. URL:www.defra.gov.uk/environment/climatechange/uk/individual/pdf/actonco2-calc-methodology.pdf. DEFRA (2009) War on waste: anaerobic digestion projects get the go ahead. URL: http://www.defra.gov.uk/News/2009/090608a.htm Delaval (2006). Cooling technology. URL:http://www.delaval.co.uk/Dairy_Knowledge/EfficientCooling/Cooling_Technology.htm?wbc_purpose=BasicAbout_About_DeLavalAbout_DeLaval#Pre-coolers. DTI (2003). Our Energy Future- creating a low carbon economy.

113
URL:http://www.dti.gov.uk/energy/publications/whitepapers/index.html. EEA (2009) Europe’s onshore and offshore wind energy potential. EAA Technical Report No 6. URL:http://www.eea.europa.eu/publications/europes-onshore-and-offshore-wind-energy-potential Efficiency Maine (2008). Dairy Farms – Energy Saving Ideas. URL: http://www.efficiencymaine.com/pdfs/Dairy-Farm-Energy-Savings.pdf. Evans, S (2007). Advice on how to keep dairy cattle cool. URL:http://www.fwi.co.uk/Articles/2007/05/31/104018/Advice-on-how-to-keep-dairy-cattle-cool.htm. Fabdec Ltd (2006). SMART-HEAT Technical Information. URL:http://fabdecv2.remotenewmedia.co.uk/downloads/smartheat_2006_14062006091245.pdf. Farmers Guardian (2008). Electrical savings with Fullwood vacuum pumps. URL:http://www.farmersguardian.com/electrical-savings-with-fullwood-vacuum-pumps/20525.article. FEC Services (2000). Heat Recovery Units on Dairy Farms. FEC Services: Kenilworth FEC Services (2006a). Energy Saving Opportunities – The Dairy. URL: http://www.farm-smart.co.uk/andys-files/AndrewKneeshawEnergySavingOpportunities-TheDairyFarmEnergyCentre.pdf. FEC Services (2006b). Technical Note 10: Reducing Dairy Water Heating Costs. FEC Services: Kenilworth FEC Services (2005). Milk Cooling Costs (Technical Note 53). URL:http://www.fecservices.co.uk/DynamicContent/Documents/tech%20pubs/TN53%20Milk%20cooling%20costs.pdf. FEC Services (2008). Energy Efficiency on Dairy Farms. URL:http://www.ruralni.gov.uk/index/environment/renewables/dairying_energy_efficiency.htm. Focus on Energy (2007a). Optimise Vacuum Systems, Increase Productivity and Save Energy (Technical Data Sheet). Focus on Energy: Wisconsin Focus on Energy (2007b). Refrigeration Systems Design, Operation and Maintenance (Technical Data Sheet). Focus on Energy: Wisconsin Food Standards Agency (2006). Hygiene on the Dairy Farm. URL:http://www.defra.gov.uk/animalhealth/publications/Dairy/GuideSpring06.pdf. FWi Inputs Price Monitor (2009). URL: http://www.fwi.co.uk/staticpages/inputs-price-monitor.

114
GEA (2009) Farm Technologies URL:http://www.gea-farmtechnologies.com/uk/en/default.aspx. Geronimo (2008a). Vacuum pumps. URL:http://www.dairyenergy.eu/index.php?option=com_content&task=view&id=182&Itemid=169. Geronimo (2008b). Milk Cooling Equipment. URL:http://www.dairyenergy.eu/index.php?option=com_content&task=view&id=196&Itemid=430. Geronimo (2008c). Ventilation. URL:http://www.dairyenergy.eu/index.php?option=com_content&task=view&id=190&Itemid=174 Giesy R. (2005) Economic Feasibility of Anaerobic Digestion to Produce Electricity on Florida Dairy Farms - http://edis.ifas.ufl.edu/pdffiles/AN/AN15900.pdf Holm-Nielsen, J.B., Al Seadi, T. and Oleskowicz-Popiel, P. (2009). The future of anaerobic digestion and biogas utilization. Bioresource Technology 100 5478-5484 IEA (2001), Biogas and More! Systems and Markets Overview of Anaerobic
digestion, at http://web.sdu.dk/bio/pdf/biogas.pdf
Kirchmayr R, Scherzer R, Baggesen D, Braun R and Wellinger A, (2003) Animal by-products and anaerobic digestion, Requirements of the European Regulation - http://www.iea-biogas.net/Dokumente/IEA_ABP-Brochure_en_2.pdf Kottner (2004). The role of biogas in German Farm Business Development. Transactions of ‘Biogas in Society’ Conference, Northern Ireland
Kottner (2005). Planning matters-Germany’s on-farm power from biogas, using energy crops and farm waste. Renewable Energy World. 8 (4) p188 – 195. Kurt J. Lesker Co Ltd (2009). Rotary Vane Pumps. URL:http://www.lesker.com/newweb/Vacuum_Pumps/vacuumpumps_technicalnotes_1.cfm. Kutz, M (ed.) 2007. Handbook of Farm, Dairy and Food Machinery. William Andrew Publishing: Norwich, NY. Lazarus, F (2009) Economics of Anaerobic Digesters for processing animal manures - http://www.extension.org/pages/Economics_of_Anaerobic_Digesters_for_Processing_Animal_Manure Ludington, D.C., Johnson, A.L., Kowalski, J.A., Mage, A.L. (2004). Dairy Farm Energy Management Guide. Southern California Edison. Milk Development Council (2005). Energy Efficiency on Farm. MDC: Cirencester.

115
Milking Management (2002). Knowing Your Milking Machine. URL:http://www.milkingmanagement.co.uk/contents/technotes.htm. Mitchell (1995) Biomass and Bioenergy 9 p11-34). Monteny G, Bannink A and Chadwick D (2006). Greenhouse gas abatement strategies for animal husbandry. Agriculture, Ecosystems and Environment 112 p 163-170 Morison et al. (2007). Improving Dairy Shed Energy Efficiency. New Zealand Centre for Advanced Engineering: Christchurch. Mullinax, D. (2002). Increasing Efficiency in the Milk Parlour Translates into Cost Savings. URL: http://www.moomilk.com/archive/udder-02.htm. New Scientist December 8th 2007 Our Solar Future. NNFCC (2009) Anaerobic digestion information portal - http://www.biogas-info.co.uk Powering the future (2009) -http://www.pbpoweringthefuture.com/pdf/pb_ptf_full_report.pdf Redman, 2008. A detailed Economic Assessment of Anaerobic Digestion Technology and its Suitability to UK Farming and Waste Systems - http://www.nnfcc.co.uk/metadot/index.pl?id=7198;isa=DBRow;op=show;dbview_id=2457 SAC (2007). SAC Dairy Research Centre/Dairy Select. URL:http://www.sac.ac.uk/mainrep/pdfs/crichtonupdate0704.pdf. Sanford, Scott (2005). Energy Conservation in Dairy Enterprises. URL:http://www.mrec.org/confer/2005_EnergyConservation_DairyEnterprises_Sanford.pdf. Sharman H (2005) Why UK wind power should not exceed 10GW. Civil Engineering 158, p 161-169 Upton J (2009) Strategies to reduce energy consumption on dairy farms http://www.agresearch.teagasc.ie/moorepark/Articles/EnergyConsumptiononDairyFarms.pdf Wisconsin Public Service (2009). Vacuum Pump Technology. URL:http://www.wisconsinpublicservice.com/farm/vacuum.aspx Woodfuel Strategy for England (2007) Forestry Commission - http://www.forestry.gov.uk/pdf/fce-woodfuel-strategy.pdf/$FILE/fce-woodfuel-strategy.pdf

116
Woodfuel Meets the Challenge (2007) - http://www.forestry.gov.uk/pdf/Woodfuel_meets_the_challenge.pdf/$FILE/Woodfuel_meets_the_challenge.pdf Verma, (2002) Anaerobic Digestion of Biodegradable Organics in Municipal Solid Wastes - http://www.seas.columbia.edu/earth/vermathesis.pdf


School of Agriculture, Food and Rural Development Newcastle UniversityNE1 7RUUnited Kingdom
MO
2104
_03.
10


