40
Aussie mine* Reaping the rewards A review of trends in the Australian mid-tier mining industry June 2008

Aussie mine*Reaping the rewards
A review of trends in the Australian mid-tier mining industry
June 2008

Table of contents
Introduction 5
Executive summary 6
Financial highlights 7
Mid-tier industry in perspective 9
Movements in the Mid-tier 50 9
Market capitalisation 10
Mid-tier 50 profi le: New Hope Corporation Limited 13
Exploration expenditure 17
Climate change 23
Aggregated industry fi nancial statements 27
Top line summary 27
Aggregated industry income statements 27
Aggregated industry balance sheets 30
Aggregated industry cash fl ow statement 32
Glossary 35
List of Mid-tier 50 companies analysed 36
Explanatory notes for aggregated fi nancial information 37
Contacting PwC 38
Other PwC mining publications 39

It is evident that 2007 was a year that the mid-tier Australian mining sector was reaping the rewards.

5
Introduction
Welcome to the PricewaterhouseCoopers second annual review of trends in themid-tier Australian mining industry. This report focuses on the results of the largest50 mining companies listed on the Australian Stock Exchange with a market capitalisation of less than $5 billion at 31 December 2007 (the “Mid-tier 50”).
This report provides an overview of the fi nancial performance of the mid-tiermining sector and explores industry issues such as climate change and exploration.It is evident that 2007 was a year that the mid-tier Australian mining sector was reaping the rewards.
Thank you for your interest in this report. We trust you fi nd it interesting and informative.
Tim Goldsmith
Australian and Global Mining LeaderPricewaterhouseCoopers
Derek Kidley
Australian Resources LeaderPricewaterhouseCoopers

Executive summary
The Mid-tier 50 sector has again had a spectacular year by any measure.Aggregate market capitalisation has increased by 68.5% for the 50 companies analysed. This is at a time when, in general, global fi nancial markets have beenunder pressure compared with recent years. Similar to last year, the industry’s success has occurred on the back of strong commodity prices and increased production. These factors have resulted in the Mid-tier 50 companies delivering extraordinary shareholder value.
There has been a marked increase in the number and value of transactions that have occurred within the Mid-tier 50 sinceJune 2006. Fifteen major M&A transactions totalling $US11.9 billion were completed or pending. Part of this refl ects an increased interest in the Australian resources sector from Chinese state-owned investors.
We welcome the interest from China. In the 1960’s and 1970’s the Japanese provided vital funding that was used to developour resources base and we hope that the Chinese can provide the same stimulus. The challenge for the Australian Government is to ensure that Chinese investment remains in our long-term national interest.
One area that continues to expand is exploration. In the current year, exploration spending and metres drilled increased signifi cantly; however metres drilled remain well below levels ofa decade ago. Further, Australia is still falling behind our overseas competitors such as Canada that has successfully used initiatives such as a fl ow through share scheme to drive exploration. The industry expected the Rudd Labor Government to move quickly and introduce a fl ow through share scheme as a matter of priority, as promised in the election campaign. If Australian exploration activity does not continue to grow strongly, the nation’s ability to reap the rewards from its rich natural resources over the long term will be severely impaired. A fl ow through share scheme would promote exploration activity and help keep Australia globally competitive.
An issue on everyone’s lips is climate change. With the introduction of an emissions trading scheme by 2010 with strict policy and reporting requirements, industry participants need
to prepare themselves now. The range of issues that climate change raises for companies is broad, including reputation and brand positioning, risk and pricing. This is a long-term issue and companies need to be implementing strategies, systems and procedures to deal with a carbon-strained world.
Notwithstanding the good news for the sector, it has not been immune to the systemic reach of the credit crunch. The diffi culty companies are facing in securing debt on favourable terms leads to project delays and decreased investor confi dence. It has been unfortunate to see companies with otherwise good assets lose shareholder value as the market reacts to the debt crisis. The steady rise in the S&P/ASX 300 Metals and Mining Index experienced earlier in 2007 has become more volatile since late August 2007 as markets try to gauge the extent of the global slowdown and the impact of the credit crunch on the sector.
Events such as the collapse of Opes Prime and subsequent trading halts have resulted in companies losing considerable amounts of money, executives and investors losing shares supporting margin loans and large parcels of shares being traded.
Our list of mid-tier companies bade farewell to threeminers this year as their market capitalisation moved abovethe $5 billion upper threshold we use to defi ne the sector. However, the sector remains profi table, cashed up and readyto exploit the opportunities presented by continuing global demand for commodities and we welcome a number of new entrants to our Mid-tier 50.

7
2007A$m
2006A$m
Change%
Revenue 12,997 8,590 51%
EBITDA margin % 27% 29%
Net profi t 1,899 1,333 42%
Dividends paid (785) (634) 24%
Dividend payout ratio 41% 47%
Net operating cash infl ows 2,603 1,937 34%
Net fi nancing cash infl ows 2,355 1,376 29%
Cash taxes (paid)/refunded (579) (314) 85%
Cash 3,973 2,476 60%
Property plant & equipment 12,664 7,633 66%
Total borrowings 3,783 2,248 68%
Net assets 13,235 8,290 60%
Debt to equity ratio 22% 21%
Current ratio 1.92 2.23
The Mid-tier 50 have mined their way to another remarkable result for the year with revenues up 51%, profi ts up 42% and operating cash fl ows up 34%.
The balance sheet has continued to strengthen with signifi cant increases in cash, along with “money in the ground” assets (property, plant and equipment, development assets and capitalised exploration) that have increased in value by 66%. Gearing ratio’s have remained low; however, the current ratio has decreased because of increased borrowings and escalating operating costs.
Shareholders were rewarded with a 24% increase in dividends; however, the payout ratio has decreased as the Mid-tier 50re-invested in development and exploration in a bid to drive future production growth.
This fantastic result has been achieved on the back of the continued strength in commodity markets and the rush to increase production.
But challenges remain. Operating costs are increasing because of escalating demand for labour and materials (mining services as well as the mining industry), cost blow outs and time delays on new projects and infrastructure bottlenecks.
The appreciation of the Australian dollar against its US counterpart to record post-fl oat levels is having a signifi cant impact on unhedged US$ revenue streams and federal income tax payments have risen by 85% (excluding royalties, licence fees and other indirect taxes).
The EBITDA margin of the Mid-tier 50 has decreased to 27%; however, with the exclusion of outliers from our list of 50, the group’s EBITDA margin shows an increase from 32% to 37% in 2007. Overall effi ciencies gained from increased production volumes and commodity price strength appears tobe outstripping cost and exchange rate pressures.
2007 can therefore be remembered as a year when the Australasian mid-tier miners were reaping the rewards. The 2008 year looks more challenging in an increasingly uncertain world, however we expect miners with low cost projects in production to be able to build on their recent success.
Financial highlights

2
The 2008 year looks more challenging in an increasingly uncertain world, however we expect miners with low cost projects in production to be able to build on their recent success.

9
Mid-tier industry in perspective
Movements in the Mid-tier 50The structure of the Mid-tier 50 has continued to evolve over the past year. Lihir Gold, Oxiana and Fortescue Metals Group have moved beyond the Mid-tier 50 as their market capitalisation exceeded $5 billion for the fi rst time. They join BHP Billiton, Rio Tinto, Coal & Allied, Alumina, Newcrest and Zinifex to make up the 9 listed companies that exceed our Mid-tier 50 ceiling.
Other noteworthy points include:
30 of the 50 remain.
Of the 20 companies that have exited, 3 have exceeded our market capitalisation threshold, 12 have been overtaken in size and 4 have merged or been acquired (the fi nancial results on 1 entity were not available in time for our review).
The 20 new entrants, by commodity, are gold (5), iron ore (4), nickel (3), coal (2), base metals (2) and other (4).
•
•
•
M&A activity
There has been a marked increase in the number and value of transactions that have occurred within the Mid-tier 50 since 2006; 15 major M&A transactions, totalling $US11.9 billion, were completed or pending at 31 December 2007.
This ongoing M&A activity is driven by a number of factors, including the pursuit of diversifi cation and economies of scale. Escalating project development costs and time delays in bringing new projects to market make acquisitions increasingly attractive. That said, the recent changes in global fi nancial markets may make accessing equity and debt to exploit M&A opportunities more diffi cult.
Table 1: Mid-tier 50 exits due to acquisitions
Mid-tier 50 Company Acquired Acquiror Value US$m Consideration
Agincourt Resources Ltd Oxiana Ltd 329 Equity
Bolnisi Gold NV Coeur d’Alene Mines Corp 802 Cash & Equity
Excel Coal Ltd Peabody Energy Corp 1,577 Cash
Kimberley Diamond Co NL Gem Diamonds Ltd 276 Cash
Source: Dealogic “M&A Global” Database, December 2007
Table 2: M&A activity completed by companies within the Mid-tier 50 by December 2007
Target Acquiror Value US$m Consideration
Aztec Resources Ltd Mount Gibson Iron Ltd 191 Equity
Custom Mining Ltd Macarthur Coal Ltd 241 Cash & Equity
Goldfi elds Mine Management Pty Ltd Mincor Resources NL 57 Cash
Valhalla Uranium Ltd Paladin Resources Ltd 130 Equity
Consolidated Minerals Ltd Palmary Enterprises Ltd 1,151 Cash
Western Areas Ltd Gold Fields Ltd 749 Equity
Source: Dealogic “M&A Global” Database, December 2007
Table 3: M&A activity announced by companies in the Mid-tier 50 pending as at December 2007
Target Acquiror Value US$m Consideration
Allegiance Mining NL Zinifex Ltd 695 Cash
Jubilee Mines NL Xstrata plc 2,872 Cash
Midwest Corp Ltd Sinosteel Corp 1,103 Cash
Midwest Corp Ltd Murchison Metals Ltd 924 Equity
Resource Pacifi c Holdings Ltd Xstrata plc 776 Cash
Source: Dealogic “M&A Global” Database, December 2007

10
Chinese investment
During the past year we have seen increased interest in the Australian resources sector from Chinese state-owned enterprises. Although these companies have been active for a number of years, they have now turned their attention to Australia, particularly iron ore assets.
In the Mid-tier 50, the largest of these proposed investments is the bid by Sinosteel Corporation to acquire iron ore miner Midwest. This cash bid is valued at about US$1.1billion and,if successful, would give Sinosteel access to substantial iron ore assets in Western Australia. Other Chinese investments include a 12.9 % investment by Anshan Iron and Steel Company in Gindalbie Metals Ltd, MCC’s agreed purchase of Cape Lambert’s iron ore project and, more recently, the announcement that Sinosteel had acquired a small stake in Murchison Metals Ltd.
Although there are many Chinese companies undertaking these deals, most have the Chinese Government as theirmajor shareholder.
These transactions come at a time of increased scrutiny of investments by sovereign wealth funds and other state-owned organisations. Concerns centre on the perceived lack of transparency and motives of the state-sponsored organisations. Notwithstanding these concerns, a signifi cant proportion of our industry is foreign owned and the benefi ts generated for the Australian economy from these projects, which may not otherwise be developed, cannot be ignored. On balance, Australia should continue to welcome foreign investment and address ownership or other concerns on a case-by-case basis.
Market capitalisationDespite the occasional bump in the road, the Mid-tier 50 has signifi cantly increased its market capitalisation during the period, outperforming the ASX All Ordinaries Index by a factor of 10 to 1.
The aggregated market capitalisation of the Mid-tier 50 increased from $38.4 billion to $64.7 billion. This 68.5% increase contrasts with an increase in the ASX All Ordinaries of just 6.4%.
More than half the companies comprising this year’s Mid-tier 50 doubled their market capitalisation.
Although some of the increase was the result of equity issues, most arose due to share price accretion. Twenty companies recorded share price increases in excess of 100%, with the average increase for the sector being 117%.
This strong share price growth has led to companies having a market capitalisation comfortably exceeding their net assets. The average ratio of market capitalisation to net assets was 8.4, ranging between 1.5 to 37.
The movement in ASX 300 Metals and Mining Index, broadly refl ective of the movement in shares in the Mid-tier 50, shows the magnitude of some of the recent share price movements and, in particular, the strong recovery from the declines in late August 2007 when the subprime crisis began to affect global fi nancial markets. Since then the index has experienced considerable volatility as markets try to gauge the extent of the global slowdown and the impact of the credit crunch on the sector. Balancing this downside has been the continued growth in China and some very strong commodity price increases for iron oreand coal.
In March 2008, the sector was rocked by the collapse of Opes Prime, a Melbourne based stockbroker. Many of the Mid-tier 50 companies were placed in trading halts as large parcels of shares pledged as security for margin loans were sold. The implications were that companies lost considerable amounts of money, executives and investors lost shares supporting margin loans and large parcels of shares were traded.
Aussie mine | Mid-tier industry in perspective

11
The chart below shows the top fi ve increases in share price within the Mid-tier 50 from January 2007 to March 2008.
Figure 2: Top 5 Percentage share price growth
6000
5500
5000
4500
4000
3500
3000
2500
12/0
1/20
07
12/0
2/20
07
12/0
3/20
07
12/0
4/20
07
12/0
5/20
07
12/0
6/20
07
12/0
7/20
07
12/0
8/20
07
12/0
9/20
07
12/1
0/20
07
12/1
1/20
07
12/1
2/20
07
12/0
1/20
08
12/0
2/20
08
12/0
3/20
08
Figure 1: S&P/ASX 300 Metals and Mining Index(1 January 2007 to 28 March 2008)
Source: ASX 300 Metals and Mining Index
0%
100%
200%
300%
400%
500%
600%
700%
800%
900%
1000%
Andean Resources Limited Midwest Corporation Limited Sundance Resources
Atlas Iron Riversdale Mining Limited
Jan
08 Feb
Mar Apr
May Ju
n Jul
Aug Sep OctNov Dec Ja
nFe
b
Mar
08
Source: PricewaterhouseCoopers

12
Aussie mine | Mid-tier industry in perspective
The following graph illustrates the market capitalisation of the Mid-tier 50 by commodity.
Figure 3: Principal metal/commodity minedKey Commodity of the 50 companies analysed, based on market capitalisation
Other
7% 14%
21%
14%19%
8%
10%
7%
Uranium
Iron Ore
Gold
NickelCoal
Platinum
Non-ferrousMetals
Source: PricewaterhouseCoopers
The following graph illustrates the market capitalisation of the Mid-tier 50 by asset location.
Figure 4: Location of 50 companies analysed, based on market capitalisation
38% 19%
7%
6%
6%
19%
3%
1%1%
WesternAustralia
Africa
Asia
New SouthWales
NorthernTerritory
Queensland
SouthAmerica
SouthAustralia
Tasmania
Source: PricewaterhouseCoopers
It is interesting to note that consistent with 2006, more than 70% of the companies have their primary asset base in Australia.

We spoke with Rob Neale, the Chief Executive of New Hope Corporation Limited (“New Hope”), about where this listed energy company has come from and where he sees its future. At 31 December 2007, New Hope’s market capitalisation was about $1.86 billion, making it number eight in our Mid-tier 50 list. By 30 April 2008, the group’s market capitalisation had reached $3.13 billion.
Mid-tier 50 profi leNew Hope Corporation Limited
Aussie Mine (AM): To begin with, can you give some background on New Hope?
Rob: New Hope has close historical ties to the West Moreton coalfi elds near Ipswich in South East Queensland, wherethe company began mining in 1952 and developed its direct hands-on operations philosophy, underpinning our focus on being a low-cost producer. Head offi ce is in Ipswich and we will move to the new Springfi eld-Brookwater offi ce at year end.
When I joined in 1996 after 23 years with Exxon, we had some modest projects in West Moreton and had ventured into Indonesia where we held a 50% interest in the PT Adaro project. By 2001, Adaro was the largest coal producer in Indonesia. In 2005 we sold our Indonesian interests for US$378 million; at that time Adaro was producing about 25 mtpa.
We still have one mine operating in West Moreton, as well as our New Acland project on the Darling Downs about 200 kilometres west of Brisbane.
Washington H. Soul Pattinson is our major shareholder with a 60% interest. The company listed on the Australian Stock Exchange in 2003.
AM: Can you describe the culture you and your management team have sought to build at New Hope?
Rob: We are proud of our performance around culture and people. Staff turnover sits at half the average of the Australian coal industry.
The culture we have sought to create centres around four fundamental principles:
People are Important
Margin Management makes us Competitive
Continuous Improvement makes us Effective
Growth is an Imperative
Our track record on staff turnover and cost management, and the way New Hope is looking to the future with a well-focused strategy, shows we are bringing these principles to life, but there is always more to be done.
•
•
•
•
AM: Where are New Hope’s current production efforts focused?
Rob: The New Acland project is a big focus. Its thin coalseams make mining a challenge, but thin seam mining is something New Hope became very profi cient at in the West Moreton coal fi elds.
Production at New Acland is scheduled to increase to 4.2 mtpa from mid 2008, with plans to expand up to 10 mtpa if infrastructure and markets are available.
New Acland benefi ts from access to port capacity at the Queensland Bulk Handling (“QBH”) facility, a relatively demurrage-free coal terminal that operates at the Port of Brisbane. QBH has initiated a project to increase annual capacity to about 7 mtpa, with completion scheduled for October 2010.
AM: What about future coal production?
Rob: Aside from our New Acland expansion, New Hope’sfuture includes projects in Central Queensland where we holdthe New Saraji, Lenton and Bee Creek tenements.
Our New Saraji coking coal project, the most promising interms of production in the near term, sits adjacent to the Saraji open-cut coal mine operated by the BHP Billiton-Mitsubishi Alliance (“BMA”).
New Saraji is likely to be an underground operation, athoughan open-pit box cut access is being examined.
The current inferred in-situ resource for New Saraji is estimated at 690 million tonnes of metallurgical coal, including hardcoking coal. Our goal is to increase this to between 1.0 and1.5 billion tonnes.
AM: Has New Hope secured rail and port capacity for future Central Queensland coal production?
Rob: There’s no denying this remains a huge concern for our industry. To date it has not impacted on our South East Queensland operations because we have access to the QBH facility. From a Central Queensland perspective, we have managed to secure 10 million tonnes per annum of rail andport capacity as part of the planned expansions at the Abbott Point terminal.
13
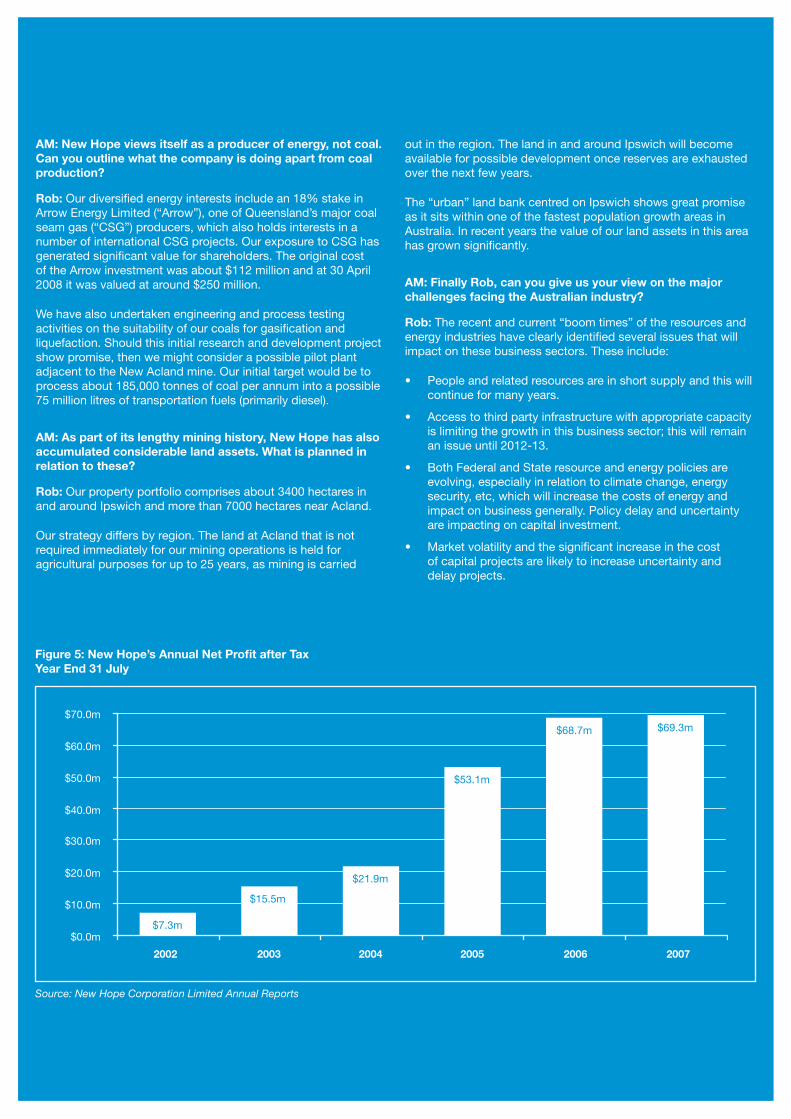
AM: New Hope views itself as a producer of energy, not coal. Can you outline what the company is doing apart from coal production?
Rob: Our diversifi ed energy interests include an 18% stake in Arrow Energy Limited (“Arrow”), one of Queensland’s major coal seam gas (“CSG”) producers, which also holds interests in a number of international CSG projects. Our exposure to CSG has generated signifi cant value for shareholders. The original cost of the Arrow investment was about $112 million and at 30 April 2008 it was valued at around $250 million.
We have also undertaken engineering and process testing activities on the suitability of our coals for gasifi cation and liquefaction. Should this initial research and development project show promise, then we might consider a possible pilot plant adjacent to the New Acland mine. Our initial target would be to process about 185,000 tonnes of coal per annum into a possible 75 million litres of transportation fuels (primarily diesel).
AM: As part of its lengthy mining history, New Hope has also accumulated considerable land assets. What is planned in relation to these?
Rob: Our property portfolio comprises about 3400 hectares in and around Ipswich and more than 7000 hectares near Acland.
Our strategy differs by region. The land at Acland that is not required immediately for our mining operations is held for agricultural purposes for up to 25 years, as mining is carried
out in the region. The land in and around Ipswich will become available for possible development once reserves are exhausted over the next few years.
The “urban” land bank centred on Ipswich shows great promise as it sits within one of the fastest population growth areas in Australia. In recent years the value of our land assets in this area has grown signifi cantly.
AM: Finally Rob, can you give us your view on the major challenges facing the Australian industry?
Rob: The recent and current “boom times” of the resources and energy industries have clearly identifi ed several issues that will impact on these business sectors. These include:
People and related resources are in short supply and this will continue for many years.
Access to third party infrastructure with appropriate capacity is limiting the growth in this business sector; this will remain an issue until 2012-13.
Both Federal and State resource and energy policies are evolving, especially in relation to climate change, energy security, etc, which will increase the costs of energy and impact on business generally. Policy delay and uncertainty are impacting on capital investment.
Market volatility and the signifi cant increase in the costof capital projects are likely to increase uncertainty anddelay projects.
•
•
•
•
Aussie Mine | Mid-tier Industry in Perspective
Figure 5: New Hope’s Annual Net Profi t after TaxYear End 31 July
$7.3m
$15.5m
$21.9m
$53.1m
$68.7m $69.3m
$0.0m
$10.0m
$20.0m
$30.0m
$40.0m
$50.0m
$60.0m
$70.0m
2002 2003 2004 2005 2006 2007
Source: New Hope Corporation Limited Annual Reports
14

15
Aside from their New Acland expansion, New Hope’s future includes projects in Central Queensland where they hold the New Saraji, Lenton and Bee Creek tenements.

3
The introduction of fl ow through shares as promised by theRudd Labor Government would be a positive for future investment in exploration and the future of the industry.

17
Exploration expenditure
In the following article, offi cial data from the Australian Bureau of Statistics hasbeen used.
Investment in exploration expenditure is a key factor in sustaining the current rate of growth in the mining sector over the long term. Although exploration expenditure and metres drilled increased signifi cantly in the period under review, Australia still falls behind our competitors, including Canada.
A range of factors will infl uence the decision to invest in exploration expenditure. Economic factors include mineralprices – current and future – and the costs and availability of inputs into the exploration process, such as labour, equipment and other costs.
The introduction of fl ow through shares as promised by theRudd Labor Government would be a positive for future investment in exploration and the future of the industry.
Total Australian exploration expenditure
Exploration expenditure has continued to increase each year,in line with the current resources boom. Expenditure has more than doubled since 2004, increasing from $0.9 billion in December 2004 calendar year to $2 billion in 2007.
Expenditure on new vs existing deposits
Exploration spending on new deposits grew by 49% in the calendar year ended December 2007 – a signifi cant increase compared with the increase in the year to December 2006 of 26%. In comparison, exploration on existing deposits grew by 35% in 2007 compared with 30% in 2006.
Figure 7 demonstrates that exploration expenditure still trends strongly towards existing rather than new deposits. This is likely to be due to the inherent risks and costs associated with greenfi elds exploration. The focus of exploration expenditure on brownfi elds sites may pose problems for the longevity of growth in the mineral sector if insuffi cient resources are being directed toward greenfi elds exploration.
Figure 6: Exploration expenditure
$0
$500
$1,000
$1,500
$2,000
$2,500
1997 1998 1999 2000 2001 2002 2003 2004 2005 2006 2007
Years
$ m
illio
ns
Source: ABS, Mineral and Petroleum Exploration, 8412.0, December Quarter 2007.

18
Aussie mine | Exploration expenditure
Figure 7: Exploration expenditure – new and existing deposits
0
500
1000
1500
2000
2500
Year
2004 2005 2006 2007
$ m
illio
ns
New Deposits Existing Deposits Total Deposits
Source: ABS, Mineral and Petroleum Exploration, 8412.0, December Quarter 2007.
Figure 8: Exploration expenditure by geographic location
0
200
400
600
800
1,000
1,200
2004 2005 2006 2007
Year
$ m
illio
ns
New South Wales Victoria Queensland South Australia
Western Austalia Tasmania Northern Territory
Source: ABS, Mineral and Petroleum Exploration, 8412.0, December Quarter 2007.

19
Exploration expenditure by geographic location
Exploration spending has increased in all states and the Northern Territory over the past four years. Western Australia dominates, attracting more than 50% of total exploration expenditure in 2007. Queensland and South Australia come second and third, attracting 15% and 13% of expenditure respectively.
Exploration by commodity type
Expenditure on all major commodities has increased over the past four years. Exploration in the gold sector has continued to be a major contributor to overall exploration; however, in the past 12 months the stronger performers have been base metals, iron ore and coal, which have all increased noticeably.
It is interesting to note that while gold has remained a major contributor over the past four years, exploration expenditure on gold has actually decreased as a proportion of total expenditure. In contrast, relative expenditure on uranium, copper and silver has increased signifi cantly.
Exploration cost
The cost of exploration drilling (per metre) has continued to increase substantially. The data available does not indicate what proportion of the increased expenditure is related to an increase in metres drilled versus the increased cost of equipment, labour and other inputs.
Analysing the expenditure per metres drilled over the past10 years is evidence of this trend over the longer term.
Figure 9: Exploration by commodity
0
500
1,000
1,500
2,000
2,500
3,000
2004 2005 2006 2007
Year
$ m
illio
ns
Copper Silver Nickel Base Metals Gold Iron Ore
Mineral Sands Uranium Coal Diamonds Other
Source: ABS, Mineral and Petroleum Exploration, 8412.0, December Quarter 2007.

20
Aussie mine | Exploration expenditure
Figure 10: Proportionate exploration expenditure by commodity
0%
10%
20%
30%
40%
50%
60%
70%
80%
90%
100%
2004 2005 2006 2007
Copper Silver Nickel Base Metals Gold Iron Ore
Mineral Sands Uranium Coal Diamonds Other
Source: ABS, Mineral and Petroleum Exploration, 8412.0, December Quarter 2007.
Figure 11: Expenditure per metre drilled
0
50.00
100.00
150.00
200.00
250.00
1997 1998 1999 2000 2001 2002 2003 2004 2005 2006 2007
Year
$
Source: ABS, Mineral and Petroleum Exploration, 8412.0, December Quarter 2007.

21
Figure 12: Metres drilled
0
2,000
4,000
6,000
8,000
10,000
12,000
14,000
1997 1998 1999 2000 2001 2002 2003 2004 2005 2006 2007
Years
'000
Source: ABS, Mineral and Petroleum Exploration, 8412.0, December Quarter 2007.
Metres drilled
Total mineral exploration metres drilled over the past three years has increased signifi cantly, rising 39% from December 2004 to December 2007.
Interestingly, a different trend emerges over a 10-year period. According to ABS statistics, annual mineral exploration metres drilled was 30% lower in December 2007 than in 1997.
Further, metres drilled in relation to new deposits, as opposed to existing deposits, has remained consistent from 2006 to 2007 with 39% of metres drilled in relation to new deposits for each year and 61% on existing deposits.
Such an overall decline in actual exploration (metres drilled) over the longer term, coupled with a lack of investment in exploration at new sites, are arguments for considering other ways of encouraging investment in exploration.
Flow through shares
The Labor Government’s election campaign included undertakings regarding the introduction of a fl ow through share scheme for smaller operators in the mineral exploration industry to promote investment in exploration.
Understandably, the industry thought the incentive was back on the table after having been rejected by the Howard Government.
But following the election, it appears the Government isback-tracking over concerns about inappropriate taxation planning under a fl ow through share scheme. This is threatening to derail a policy that is needed to encourage exploration.
Under a fl ow through share scheme, tax losses incurred by exploration companies can be passed on to shareholders and utilised to offset personal income. This brings forward the benefi t of the losses rather than having them accumulate over time within the company itself, until such time as suffi cient taxable income is earned to extinguish the losses (as is currently the case).
To be fair to the Federal Treasury, a similar scheme was introduced in the 1970s and, to some degree, it was exploited. But today, in an era when corporate governance is much stronger and the Australian Taxation Offi ce more vigilant, it should be possible to develop a scheme that is robust enough to strike the right balance between promoting exploration and preserving taxation revenue.
Canada has such a scheme and, although it has its critics, it has encouraged exploration in that country. Canada is the world’s biggest explorer after introducing the scheme 7 years ago.
Such a scheme directly encourages investment in junior exploration companies, thereby providing funds for exploration.
The introduction of a fl ow through tax credit scheme should be pursued for the long-term benefi t of the industry.

4
While Australian business leaders are aware of climate change as an issue and are keen to know more about how to respond, they are not ready for a carbon-constrained world.
Climate change
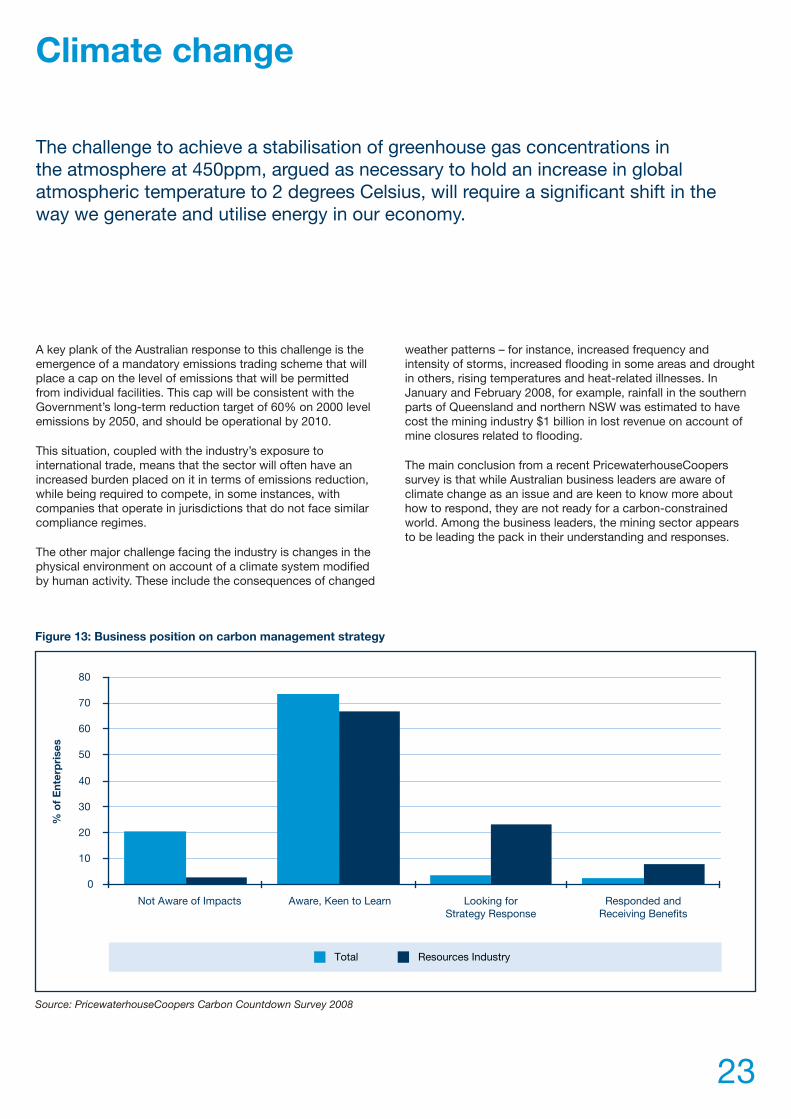
The challenge to achieve a stabilisation of greenhouse gas concentrations in the atmosphere at 450ppm, argued as necessary to hold an increase in global atmospheric temperature to 2 degrees Celsius, will require a signifi cant shift in theway we generate and utilise energy in our economy.
A key plank of the Australian response to this challenge is the emergence of a mandatory emissions trading scheme that will place a cap on the level of emissions that will be permitted from individual facilities. This cap will be consistent with the Government’s long-term reduction target of 60% on 2000 level emissions by 2050, and should be operational by 2010.
This situation, coupled with the industry’s exposure to international trade, means that the sector will often have an increased burden placed on it in terms of emissions reduction, while being required to compete, in some instances, with companies that operate in jurisdictions that do not face similar compliance regimes.
The other major challenge facing the industry is changes in the physical environment on account of a climate system modifi ed by human activity. These include the consequences of changed
weather patterns – for instance, increased frequency and intensity of storms, increased fl ooding in some areas and drought in others, rising temperatures and heat-related illnesses. In January and February 2008, for example, rainfall in the southern parts of Queensland and northern NSW was estimated to have cost the mining industry $1 billion in lost revenue on account of mine closures related to fl ooding.
The main conclusion from a recent PricewaterhouseCoopers survey is that while Australian business leaders are aware of climate change as an issue and are keen to know more about how to respond, they are not ready for a carbon-constrained world. Among the business leaders, the mining sector appears to be leading the pack in their understanding and responses.
Figure 13: Business position on carbon management strategy
0
10
20
30
40
50
60
70
80
Not Aware of Impacts Aware, Keen to Learn Looking forStrategy Response
Responded andReceiving Benefits
% o
f E
nter
pri
ses
Total Resources Industry
Source: PricewaterhouseCoopers Carbon Countdown Survey 2008
23

24
Aussie mine | Climate change
What does this mean for the mining industry?
Climate change is a business landscape modifi er. Virtually all aspects of a company’s operating environment – supply chain, customers, operations, investors, regulation and even competitors – are exposed to its effects. The extent of this vulnerability represents a real threat to future earnings and explains why pressure is growing on companies to act swiftly and decisively to protect and enhance shareholder value by minimising downside risks and maximising the upside opportunities of climate change.
Companies are achieving this by implementing a robustcarbon management strategy that addresses the foreseeable impacts of climate change on the business environment and helps manage the transition to a fully carbon conscious business over the long term. Simply branding a fi rm as “going green” will no longer suffi ce and a company’s carbon performance will need to be actively managed.
The following framework is recommended for companies when planning to prepare for increasingly unpredictable weather patterns and a carbon constrained economy.
1. Identify value at risk – fi rst and second order impacts
Identifying value at risk is the necessary and strategic fi rst step for any business. The industry will face exposures to climate change both in terms of the physical risks (fi rst order impacts)as well as changes in the regulatory regime that impose constraints on greenhouse gas emissions and changes in customer and consumer behaviour (second order impacts). Assessing a company’s exposure (value at risk) because of climate change therefore requires investigation beyond a company’s own emissions and energy use. Raw materials that involve signifi cant carbon in their extraction or production and associated services such as logistics will directly or indirectly affect a company’s exposure.
Additionally, while some assets may be signifi cantly exposed, others may be protected. What is critical is for companies tofully understand the risks and opportunities associated withthis complex area and develop robust plans to address them. The implication is that the level or quantum of a company’s response should be proportionate to the company’s ultimate “value at risk”.
2. Create a senior carbon management position
Leading companies will be managing carbon performance forat least the next 50 years and this will have an enormous impact on shareholder value. Such companies are well-advised to create a new, senior carbon management position and team. If the position is a profi t centre, it will drive the direction of that team from compliance and cost minimisation to a focus on the opportunities created through new investments and trading.
The team’s focus should be on driving internal and external carbon targets, identifying and leveraging carbon opportunities and reviewing and revising carbon strategies across the organisation.
3. Emissions management – identify emissions sources, boundaries, baseline, and prepare forecasts.
Companies will be managing their carbon for legal and legislative compliance purposes, as well as non-compliance purposes,for as long as they exist.
It is critical that a company understands its contribution to global emissions, including direct and indirect emissions, from electricity as well as emissions that relate to the company’s interaction with suppliers, partners and customers.
This information, including actual and forecast emissions, will also form the basis of all carbon-related strategic decisions.It is therefore critical that a company puts in place the processes and procedures necessary to identify and capture the required information in a manner that is effi cient, effective and repeatable.
4. Ensure carbon data is independently audited
Stakeholders want to know that all data on carbon emissions and abatement activities is credible. To ensure credibility, companies need to have their data audited by a third party. Meanwhile, companies that trade in the voluntary market will require independent verifi cation of their offset activities.
5. Report carbon data internally and externally
Transparency on carbon-related issues is essential as stakeholders – including capital markets, investors, shareholders, employees and customers – are increasingly insisting on being told about companies’ efforts to control their emissions.
A carbon management communications strategy is critical to convey the company’s vision, targets and progress on emissions reduction. Clear, transparent statements should be made, particularly in sustainability reporting, and Climate Disclosure Project (CDP) information requests should be answered robustly.
6. Prepare an inventory of abatement options – set reduction targets
Leading carbon performers identify ways to drive reductions in direct and indirect emissions and their associated cost.
Abatement options vary from industry to industry and new options are being developed regularly. Energy effi ciency improvements, fuel switching and load management in transport are some of the more common options. It is important for businesses to be aware of the abatement options available and suitable for their specifi c situations.

25
7. Identify and leverage new carbon opportunities
The immaturity of existing carbon markets and regulation means there are huge potential business opportunities. Customers, for instance, will be actively searching for solutions to their own carbon management challenges. This situation creates enormous scope for companies to provide carbon-neutral or offset products where customers receive a product with the carbon emissions completely offset by the use of robust carbon credits.
8. Track competitors’ responses
Keeping track of competitors’ responses to climate changeis vital to enable companies to assess how competitors willbe affected by the fi rst- and second-order changes in the business landscape, as well as how competitors’ carbon management policies might impact their own business, the industry and the wider business community. To this end, it is important to understand whether competitors are more or less vulnerable to the wide range of fi rst-order and second-order climate change impacts.
Longer term, businesses should look at rating competitors’ carbon performance against their own.
9. Price carbon into investment decisions
It will become increasingly necessary for companies to factor carbon exposure into their investment decisions, both with greenfi eld developments and when contemplating mergers or acquisitions. Incorporating carbon costs into acquisition analysis lessens the likelihood of signifi cant and unexpected carbon exposure and ensures carbon liability shocks, should they occur, are at least manageable.
Leading companies have been incorporating a carbon price into their investment decisions for a number of years to help them determine the viability of a project – despite Australia only recently committing to a carbon trading system.
10. Review progress on carbon targets
Robust carbon management is not a set-and-forget process.It requires regular review and revision to ensure a company remains responsive to changes in the regulatory and broader social environment. To remain ahead of the game, leading companies will need to make sure they constantly refi ne their approach to meeting carbon reduction targets.
For further information contact:
Justin Portelli – DirectorTelephone: +61 (3) 8603 3275Email: [email protected]

5
Commodity prices have generally remained buoyant on the back of unbridled global demand that continues to be underwritten by growth in the Chinese economy and constricted supply arising from project delays and infrastructure bottlenecks.

27
Aggregated industry fi nancial statements
Aggregated industry income statements
Income statement 2007A$m
2006A$m
Change%
Revenue from ordinary activities
Operating revenue 12,550 8,356 50%
Non-Operating revenue 447 234 91%
Total revenue 12,997 8,590 51%
Less expenses from ordinary activities (9,390) (5,931) 58%
Exploration expenses (159) (129) 23%
EBITDA 3,448 2,530 36%
Depreciation and amortisation (852) (696) 22%
EBIT 2,596 1,834 42%
Net interest expense (77) (85) -10%
Profi t from ordinary activities before tax 2,519 1,749 44%
Income tax expense (620) (416) 49%
Net Profi t 1,899 1,333 42%
Key earnings ratios
EBITDA margin 27% 29%
Net profi t margin 15% 16%
Interest cover (% EBITDA) 2% 3%
Effective tax rate 25% 24%
Top line summary
Operating revenues of the Mid-tier 50 have surged 50% since 2006. This has been achieved largely as a consequence of the rush to increase production in a booming commodity market.
Commodity prices have generally remained buoyant on the back of unbridled global demand that continues to be underwritten by growth in the Chinese economy and constricted supply arising from project delays and infrastructure bottlenecks.
Notwithstanding the increase in commodity prices, the appreciation of the Australian dollar against the US dollar has had a signifi cant impact on companies that remain exposed to the US currency.

28
Aussie mine | Aggregated industry fi nancial statements
Figure 14: Bloomberg commodity price index (January 2006 – March 2008)
120
150
180
210
240
270
Jan-06 Apr-06 Jul-06 Oct-06 Jan-07 Apr-07 Jul-07 Oct-07 Jan-08 Apr-08
Source: Bloomberg
Figure 15: AUD : USD exchange rate
0.7
0.75
0.8
0.85
0.9
0.95
1/01
/200
6
1/03
/200
6
1/05
/200
6
1/07
/200
6
1/09
/200
6
1/11
/200
6
1/01
/200
7
1/03
/200
7
1/05
/200
7
1/07
/200
7
1/09
/200
7
1/11
/200
7
1/01
/200
8
Source: Bloomberg

29
Top 5 Mid-tier 50 companies by operating revenue
Company name 2007A$m
2006A$m
Change%
Straits Resources Limited 3,694 961 284%
Iluka Resources Limited 920 983 -6%
Centennial Coal Company Limited 902 808 12%
Aquarius Platinum Limited 902 569 59%
Minara Resources Limited 771 752 3%
The Top 5 companies account for 57% (2006 – 53%) of total Mid-tier 50 operating revenue.
Margin
After excluding outliers, the overall trend in EBITDA margin inthe Mid-tier 50 for the year was an increase from 32% to 37%.
The continued strengthening in commodity prices has morethan offset adverse foreign exchange movements and escalating operating costs.
At the headline, operating costs increased 58% year on year; however, after excluding outliers operating costs rose by a more subdued 13%. While some of this increase is attributable to production increases, the boom has also continued in other sectors of the resource industry and continues to put upward pressure on the operating costs of resource companies. Infrastructure constraints also played a signifi cant role in increased operating costs.
The signifi cant demand in the construction market has recently resulted in numerous capital projects reporting cost blow outs
and the squeeze in the market for labour and mining material is continuing to put upward pressure on operating costs and construction timeframes for new projects.
These increased costs are having a signifi cant impact on the industry average cost curve, highlighting that cost minimisation and production growth remain key to competitive advantage and shareholder value.
Although exploration spending continues, most of these costs are capitalised to the balance sheet and have limited impact on disclosed margins.
Effective tax rate
The effective tax rate was 25% for the year, which is relatively consistent with the previous year.
Top 5 Mid-tier 50 companies by profi t
Company name 2007A$m
2006A$m
Change%
Aquarius Platinum Limited 374 189 98%
Minara Resources Limited 272 339 -20%
Jubilee Mines NL 173 103 68%
Resolute Mining Limited 170 (77) -321%
Independence Group NL 105 35 200%

30
Aussie mine | Aggregated industry fi nancial statements
Aggregated industry balance sheets
Balance sheet 2007A$m
2006A$m Change %
CURRENT ASSETS
Cash 3,973 2,476 60%
Debtors 1,351 1,297 4%
Inventories 1,090 776 40%
Other 1,085 831 31%
Total current assets 7,499 5,380 39%
NON-CURRENT ASSETS
Investments in associates and joint ventures 124 63 97%
Deferred taxation assets 287 218 32%
Property, plant and equipment and capitalised exploration 12,664 7,633 66%
Intangible assets 794 439 81%
Other 1,198 815 47%
Total non-current assets 15,069 9,168 64%
Total assets 22,567 14,548 55%
CURRENT LIABILITIES
Accounts payable & accrued liabilities 1,535 1,120 37%
Taxes payable 257 238 8%
Borrowings 1,187 432 175%
Other 924 628 47%
Total current liabilities 3,903 2,418 61%
NON-CURRENT LIABILITIES
Borrowings 2,596 1,816 43%
Deferred taxation liability 1,372 716 92%
Deferred fi nancial liability 320 290 10%
Provision for environmental rehabilitation 836 513 63%
Other 305 505 (40%)
Total non-current liabilities 5,429 3,840 41%
Total liabilities 9,332 6,258 49%
Net assets 13,235 8,290 60%
Cash levels have increased 60% since 2006 to about $3.9 billion. This has primarily been driven by increased operating cashfl ows due to higher commodity prices in conjunction with signifi cant equity raisings used to fund exploration and acquisitions.
The Mid-tier 50 has a high current ratio and liquidity ratio as depicted in the table below.

31
Key balance sheet ratios
Ratio 2007 2006
Debt to equity ratio 22.2% 21.3%
Net debt to equity ratio -1.5% -2.8%
Current ratio 1.92 2.23
Quick ratio 1.64 1.90
Net debt (borrowings less cash) (190) (228)
Gearing ratios have remained at low levels; indeed, the debt to equity ratio is 22.2%. This low gearing refl ects the high level of cash generated from operations and signifi cant equity funding fl owing from investors eager to participate in this sector.
Of the debt issued during 2007, 96% was accounted for by the producing companies. Further, 62% of the debt was raised by four producing companies: Straits Resources Limited, Centennial Coal Company Limited, Western Areas NL and Paladin Resources Limited.
Exploration and non-producing companies increased borrowings by about $78 million over the year. Producing companies increased their level of borrowings by about $1.9 billion.
The Mid-tier 50 have invested a large proportion of the funds raised during the year which is refl ected in a $5 billion increase in property, plant and equipment and capitalised exploration costs over the year.
Cash on hand exceeds borrowings; however, short-term borrowings exceed $1 billion and will therefore need to be refi nanced in the next 12 months. The debt market has certainly been impacted by the credit crunch contagion so early attention to these refi nancings will be essential.

32
Aussie Mine | Aggregated industry fi nancial statements
Aggregated industry cash fl ow statement
Cash fl ow statement 2007A$m
2006A$m
Change%
Cash fl ows related to operating activities
Cash generated from operations 3,348 2,474 35%
Net borrowing costs (0) (25) -100%
Other (166) (198) -16%
Income taxes (paid) / refunded (579) (314) 85%
Net operating cash fl ows 2,603 1,937 34%
Cash fl ows related to investing activities
Purchases of property, plant and equipment (2,370) (1,481) 60%
Exploration expenditure (740) (474) 56%
Purchases of investments and intangibles (1,208) (428) 182%
Other (159) (152) 4%
Proceeds from sale of property, plant and equipment 118 233 -50%
Proceeds from sale of investments 958 84 1040%
Net investing cash fl ows (3,401) (2,218) 53%
Cash fl ows related to fi nancing activities
Proceeds from ordinary share issues 1,915 1,635 17%
Net borrowings 1,234 443 179%
- Dividends paid (785) (634) 24%
Total other (9) (68) -87%
Net fi nancing cash fl ows 2,355 1,376 71%
Net increase/(decrease) in cash and cash equivalents 1,557 1,095 42%
Operating cash fl ows
In 2006, we described net cash fl ow from operations as “magnifi cent”, but performance has improved even further in 2007 with total net operating cash fl ow of $2.6 billion, a 34% rise.
Net borrowing costs have fallen, refl ecting a higher return oncash and other investments held by the Mid-tier 50.
Income tax payments have risen by 85%, with the Federal Government likely to reap additional benefi ts during 2008 as payments typically lag behind tax expense and losses carried forward from prior years are utilised. We note that this fi gure excludes royalties, licence fees and other indirect taxes and therefore the real cash tax impact on the Mid-tier 50 is,in reality, much higher.
Investing cash fl ows
Like last year, much of the cash generated from operations has been reinvested into mine development, expansion and exploration in the areas shown in the graphs below.

33
Figure 16: Capital expenditure by commodity 2007
Other
Uranium
Zinc
Coal
Diversified
GoldIron Ore
Nickel
9%2%
26%
7%
21%4%
18%
13%
Source: PricewaterhouseCoopers
Figure 17: Exploration expenditure by commodity 2007
Nickel
Coal
ZincIron Ore
Other
Uranium
Gold
Diversified
7%3% 14%
2%
49%
8%
13%
4%
Source: PricewaterhouseCoopers

34
The marked increase in proceeds received from sale of investments refl ects large transactions completed byResolute Mining and Allegiance Mining during the period.
Project development and expansion has its challenges.The shortage of labour, equipment and other inputs is probably more acutely refl ected in developments than operating costs, with the cost of development substantially above what it was a few years ago. The other challenge is to deliver on time and on budget: increasing lead times and a lack of skilled labour make project execution ever harder. The need for strong project management skills has never been greater. The call for Canberra to cut red tape when it comes to bringing in skilled migrants to address such labour shortages is one that the Federal Government should heed.
Financing cash fl ows
Cash fl ows from fi nancing activities have increased by $1 billion to a net in-fl ow of $2.4 billion. Net cash in-fl ows from borrowings have increased signifi cantly by 179% to $1.2 billion.
With the onset of the credit crunch, the Mid-tier 50’s capacity to access debt fi nance may be restricted or at a higher cost and this will create challenges in accessing capital to fi nance expansions in the short term.
This may force the Mid-tier 50 to seek additional funding from shareholders who have already invested signifi cantly, with a further $1.9 billion invested in 2007 (2006: $1.6 billion), or seek partnerships with foreign investors. The current level of inbound investment could be the tip of the iceberg. The credit crunch may also end any prospect of private equity taking a substantial direct interest in our mining industry, even if they wanted to.
Also within fi nancing activities, distributions to shareholders have increased slightly from the prior year to a total of $0.8 billion.
Aussie Mine | Aggregated industry fi nancial statements

35
Glossary
AIFRS Australian equivalent to International Financial Reporting Standards
Current ratio Current assets
Current liabilities
EBITDA Earnings before interest, tax, depreciation and amortisation
Debt to equity Borrowings
Borrowings plus shareholders equity
Market capitalisation The market value of the equity of the company, calculated as the share price multiplied by the number of shares outstanding
Net borrowings Total borrowings less cash and cash equivalents
Net debt to equity Net borrowings
Net borrowings plus shareholders equity
Quick ratio Current assets less inventories
Current liabilities

36
Mid-tier 50 companies analysed
Symbol Year End Company
Market Capitalisation as at 31/12/07
($millions)
Rank by Market Cap
Producer (P)/ Non-Producer(N)
ALB 31/12/2007 Albidon Limited 488.49 48 N
AGM 31/12/2007 Allegiance Mining NL 784.23 33 P
AND 30/06/2007 Andean Resources Limited 824.59 31 N
AQP 30/06/2007 Aquarius Platinum Limited 3,327.25 3 P
AQQA 30/06/2007 Aquila Resources Limited 1,945.72 7 P
AGO 30/06/2007 Atlas Iron Limited 509.63 46 N
AVO 30/06/2007 Avoca Resources Limited 527.66 44 P
BMN 30/06/2007 Bannerman Resources Limited 480.16 50 N
CNT 30/06/2007 Centamin Egypt Limited 1,072.24 22 N
CEY 30/06/2007 Centennial Coal Company Limited 1,491.70 15 P
CZA 30/06/2007 Coal of Africa Limited 538.35 41 P
CSM 30/06/2007 Consolidated Minerals Limited 1,244.78 20 P
DOM 30/06/2007 Dominion Mining Limited 569.09 37 P
ERA 31/12/2007 Energy Resources Of Australia Limited 3,719.39 2 P
EQI 30/06/2007 Equigold NL 843.34 29 P
FLX 30/06/2007 Felix Resources Limited 1,579.85 12 P
GBG 30/06/2007 Gindalbie Metals Limited 614.25 36 N
GCL 30/06/2007 Gloucester Coal Limited 537.52 42 P
ILU 31/12/2007 Iluka Resources Limited 1,114.29 21 P
IGO 30/06/2007 Independence Group NL 1,028.04 23 P
JML 30/06/2007 Jabiru Metals Limited 559.97 39 N
JBM 30/06/2007 Jubilee Mines NL 2,968.21 4 P
KZL 30/06/2007 Kagara Zinc Limited 1,338.89 19 P
LYC 30/06/2007 Lynas Corporation Limited 559.17 40 N
MCC 30/06/2007 Macarthur Coal Limited 1,840.07 10 P
MIS 31/12/2007 Midwest Corporation Limited 1,020.05 24 N
MRE 31/12/2007 Minara Resources Limited 2,897.46 5 P
MCR 30/06/2007 Mincor Resources NL 832.65 30 P
MDL 30/06/2007 Mineral Deposits Limited 567.84 38 P
MBN 30/06/2007 Mirabela Nickel Limited 900.79 28 N
MGX 30/06/2007 Mount Gibson Iron Limited 2,228.57 6 P
MMX 30/06/2007 Murchison Metals Limited 1,393.52 18 P
NHC 31/07/2007 New Hope Corporation Limited 1,859.52 8 P
PDN 30/06/2007 Paladin Resources Limited 4,162.32 1 P
PNA 31/12/2007 Pan Australian Resources Limited 1,406.75 17 P
PEM 30/06/2007 Perilya Limited 519.19 45 P
PLA 30/06/2007 Platinum Australia Limited 531.03 43 N
PMM 31/12/2007 Portman Limited 1,844.74 9 P

37
RSG 30/06/2007 Resolute Mining Limited 487.43 49 P
RSP 30/06/2007 Resource Pacifi c Holdings Limited 1,002.74 26 P
RIV 30/06/2007 Riversdale Mining Limited 1,785.05 11 P
SBM 30/06/2007 Saint Barbara Limited 774.63 34 P
SMY 30/06/2007 Sally Malay Mining Limited 1,013.78 25 P
SGX 31/12/2007 Sino Gold Mining Limited 1,552.75 13 P
SRL 31/12/2007 Straits Resources Limited 1,490.82 16 P
SMM 30/06/2007 Summit Resources Limited 625.36 35 P
SDL 30/06/2007 Sundance Resources Limited 804.71 32 N
SLV 30/06/2007 Sylvania Resources Limited 493.51 47 N
WSA 30/06/2007 Western Areas NL 908.23 27 P
ZIM 30/06/2007 Zimplats Holdings Limited 1,501.54 14 P
Note: Aditya Birla Minerals Limited has not been included, as a consequence of this company’s fi nancial year end, fi nancial results were yet to be released at the time of publication.
Explanatory notes for aggregated fi nancial information We have analysed the largest 50 mining companies listed onthe ASX with a market capitalisation of less than $5 billion at31 December 2007.
The results aggregated in this report have been sourced from publicly available information, primarily annual reports and fi nancial reports available to shareholders. Companies have different year-ends and report under different accounting regimes.
Information has been aggregated for the fi nancial yearsof individual companies and no adjustments have been madeto take into account different reporting requirements andyear-ends. As such, the fi nancial information shown for 2007 covers reporting periods between 30 June 2006 and 31 December 2007, with each company’s results included for the 12-month fi nancial reporting period that falls into this timeframe.
All fi gures in this publication are reported in Australian dollars, except when specifi cally stated. The results of companies that report in currencies other than the Australian dollar have been translated at the average Australian dollar exchange rate for the fi nancial year, with balance sheet items translated at the closing Australian dollar exchange rate.
Some diversifi ed companies undertake part of their activities outside the mining industry. No attempt has been made to exclude such non-mining activities from the aggregated fi nancial information.

38
Contacting PwC
PricewaterhouseCoopers provides industry-focused assurance, tax and advisory services to build public trust and enhance value for its clients and their stakeholders. More than 130,000 people in 148 countries work collaboratively using connected thinking to develop fresh perspectives and practical advices.
PricewaterhouseCoopers is a leading advisor to the mining industry, working with more explorers, producers and related service providers than any other professional services fi rm to ensure we meet the challenges of the global mining industry in the future.
Our strength in serving the mining industry comes from our skills, experience and seamless network of dedicated professionals who focus their time on understanding the industry and working on solutions to mining industry issues.
For more information on this publication or how PricewaterhouseCoopers can assist you in managing value and reporting, please speak to your current PricewaterhouseCoopers contact or telephone/e-mail the individuals below who will put you in contact with the right person.
Australian mining team
Australian Mining Leader
Tim Goldsmith, MelbourneTelephone: +61 (3) 8603 2016Email: [email protected]
New South Wales
Marc Upcroft, SydneyTelephone: +61 (2) 8266 1333Email: [email protected]
Queensland
Wayne Huf, BrisbaneTelephone: +61 (7) 3257 5600Email: [email protected]
South Australia
Andrew Forman, AdelaideTelephone: +61 (8) 8218 7401Email: [email protected]
Victoria
Tim Goldsmith, MelbourneTelephone: +61 (3) 8603 2016Email: [email protected]
Western Australia
Nick Henry, PerthTelephone: +61 9238 3475Email: [email protected]
Global mining group leadership
Global mining leader
Tim Goldsmith, MelbourneTelephone: +61 (3) 8603 2016Email: [email protected]
Asia-Pacifi c
Tim Goldsmith, MelbourneTelephone: +61 (3) 8603 2016Email: [email protected]
Canada
Paul Murphy, TorontoTelephone: +1 (416) 941 8242Email: [email protected]
China
Rita LiTelephone: +86 (10) 6533 2365Email: [email protected]
Derrick RyleyTelephone: +86 (10) 6533 2207Email: [email protected]
Latin America
Anthony Dawes, SantiagoTelephone: +56 (2) 940 0064Email: [email protected]
United Kingdom
Jason Burkitt Telephone: +44 20 7213 2515Email: [email protected]
United States
Steve Ralbovsky, PhoenixTelephone: +1 (602) 3648193Email: [email protected]
India
Kameswara Rao Telephone: +91 40 233 00 750Email: [email protected]
South Africa
Hugh CameronTelephone: +27 11 797 4292Email: [email protected]

39
Key contributors to this report
Tim Goldsmith, Australian Mining Leader
Phil ClewettPeter DemuraWayne HufStuart LandsbergJustin PortelliJosh RaabeCathy SimonsAdam Vassilieff
For copies of this report, contact:
Jacqui ThurlowTelephone: +61 (3) 8603 3267Email: [email protected]
Frederic SchnellTelephone: +61 (2) 8266 2983Email: [email protected]
Other PwC Mining PublicationsVisit our website www.pwc.com/mining
Global Mine* Bulletin
Quarterly e-newsletter discussing trends and issues in the mining sector.
Mining Deals* 2007 Annual Review
Mining Deals 2007 reviews deal activity in the mining industry including industry trends.
junior mine* Review of trends in the TSX-V mining industryMarch 2008
Our second edition examines the top 100 mining companies on the TSX Venture Exchanges (TSX-V) based on market capitalisation.
junior mine* Review of trends in the AIM mining industryMay 2008
Insight into the performance of the junior mining industry, as represented by 50 of the largest mining companies on the Alternative Investment Market (“AIM”).
mineIndonesia 2007*December 2007
Overview of the performance and trends of mining companies in Indonesia.
Carbon CountdownA survey of executive opinion on climate change in the countdown to a carbon economy January 2008
A major survey to assess how prepared Australian businesses are to operate in a carbon-constrained economy, particularly in relation to regulatory requirements, investor expectations and consumer demand.
Financial Reporting in the mining* industry International Financial Reporting StandardsJune 2007
An overview of the fi nancial reporting implications of IFRS across a number of areas selected for their particular relevance to the mining industry.
Mine* As good as it gets? A review of global trends in the mining industryJune 2008
PricewaterhouseCoopers’ fi fth annual review of global trends in the mining industry providing a comprehensive analysis of the fi nancial performance and position of the sector.

pwc.com/au
© 2008 PricewaterhouseCoopers. All rights reserved. “PricewaterhouseCoopers” refers to PricewaterhouseCoopers or, as the context requires, the PricewaterhouseCoopers global network or other member fi rms of the network, each of which is a separate and independent legal entity.
WL #92198


