31
9,24% REPSOL YPF PURCHASE OPERATION

9,24% REPSOL YPF PURCHASE OPERATION

2
Index
Main points of the transaction
Foundations of the transaction
Financial Analysis
SyV: a story of value generation

Main points of the transaction

4
Main Points of the transaction
Acquisition of a 5.00465% of Repsol YPF through Sacyr Vallehermoso Participaciones Mobiliarias, S.L. (100% Sacyr’s ownership). Besides, there are equity derivatives agreed with financial entities per 4.23158%. The total participation ( the direct one together with equity derivatives) is 9.23624% at an average price of €25.32 per share, which represents a total investment of €2,855.6 million.
Description
Structureof the
operation
The total amount of the direct investment, €1,504.7million, hasbeen financed through a bridging loan (due date: 15/1/2007) which will be refinanced through a non-recourse debt.
Non-Recourse debt: 85%Equity: 15%
Non –Recourse debt: Euribor + 0.9% (4.85%)
Term: 5-6 years

Basis of the transaction

6
Basis of the transaction
The operation is based on a diversification strategy of the Group SyV.
In this sense, the operation confirms that:
it is a complement of the economic cycles of the rest of divisions through long-term business with supported profitability.
It is a complement of the traditional business of the Group SyV by adding higher margins and results.
Growth directed towards its presence in the main companies of every sector
1.- Strategic reserve
Construction Promotion AssetsConcessionsServices Energy
9,24%

7
Basis of the transaction
Due to its size, position in the market and healthy financial situation Repsol YPF is an unique opportunity to go into the energy market
The moment when the transaction is performed reinforces even more the perspectives of value generation for the Group SyV;
Reduced debt level
Benefits coming from the improvements predicted in the strategic plan 2005-2009 of Repsol YPF
Future Sustained Growth of the shareholder’s earnings
Recovery of the economic situation of Latin-America
New projects in upstream/downstream
Increase of the profitability and margins.
The current value of Repsol YPF is highly priced-attractive with respect to the rest of Spanish companies
2.- Unique opportunity in the energy market

8
Basis of the transactions
Growing demand: According to the Energy Information Administration (EIA) the worldwide oil demand will increase in a 48% between 2003 and 2030.
Long term Prices relatively steady. It is predicted that the oil prices will not suffer important drops until 2030.
3.- Attractive views of the market
Evolution of prices at a worldwide level
Sources: Historical: EIA Projections: EIA, System for the Analysis of Global Energy Markets (2006)
Sources: Historical EIA Projections: EIA, Annual Energy Outlook (2006)
Worldwide consume of primary energy

9
173,549
126,943
98,072 95,608
31,93316,536 12,878 12,046 6,328
BP TOTAL ROYALDUTCHSHELL
ENI REPSOLYPF
CEPSA NORSKHYDRO
STATOIL OMV
Basis of the transaction4.- Description of Repsol YPF: among the main European leaders
Market capitalization of the main European companies (€million)
Fifth integrated oil company in Europe
Average market capitalization of the last month as of 13/10/2006Source: Factset
10
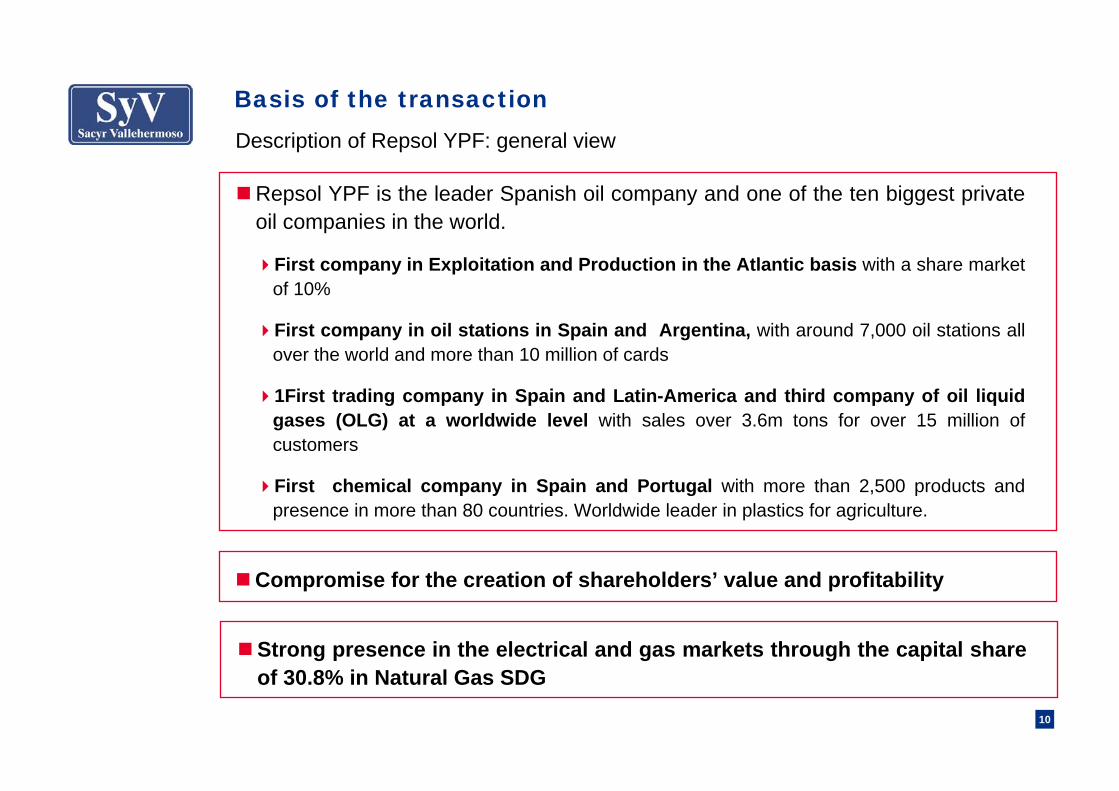
Basis of the transactionDescription of Repsol YPF: general view
Repsol YPF is the leader Spanish oil company and one of the ten biggest private oil companies in the world.
First company in Exploitation and Production in the Atlantic basis with a share market of 10%
First company in oil stations in Spain and Argentina, with around 7,000 oil stations all over the world and more than 10 million of cards
1First trading company in Spain and Latin-America and third company of oil liquid gases (OLG) at a worldwide level with sales over 3.6m tons for over 15 million of customers
First chemical company in Spain and Portugal with more than 2,500 products and presence in more than 80 countries. Worldwide leader in plastics for agriculture.
Compromise for the creation of shareholders’ value and profitability
Strong presence in the electrical and gas markets through the capital share of 30.8% in Natural Gas SDG

11
Basis of the transaction
Working Incomes
EBITDA
Working results
Results after taxes
Investments
55.719
9.684
6.414
3.281
4.076
Financial Key Figures (€million) 30/06/2006 (LTM)(1)
Hydrocarbon Production (K Bep/ day)(2)
Oil (K Bep/day)(2)
Gas (K Bep/ day)(2)
Oil products Sales (kt)
Liquid oil gases sale (LOG) (kt)
Chemical products Sales (kt)
1.100504
597
58.696
3.605
4.802
Working Key Figures 30/06/2006 (LTM)(1)
(1) Last 12 months as for 30/06/2006.(2) Data in 30/06/2006. Source: Repsol YPF

12
Description of Repsol YPF: geographic presence
EBIT 30/06/2006 (LTM)(1)
Total: 6.414 m€
Repsol is present in more than 30 countries
Basis of the transaction
(1) Last 12 months as of: 30/06/2006
Source : Repsol YPF * ABB: Argentina, Brazil and Bolivia
Resto del mundo
34%
España33%
ABB*33%
Rest of the World
Spain

13
Description of Repsol YPF: business areas
European company integrated in the whole value chain of production and trading of oil products
Source: Own data
Basis of the transaction
Exploration(oil and gas)
Production
Oil and gas)Pure y Marketing oil(inc.
LNG)
Petrochemistry
LNG

14
Description of Repsol YPF: exploration and production
Basis of the transaction
Business development based on the relations with National Oil Companies (NOCs)
Production of 1.060 K Bep /day1)
First steps in Russia and Central Asia
Gulf of Mexico Northern Africa Caribbean Sea
Solid presence in strategic areas
(1) Last 12 months as of: 30/06/2006
Source : Repsol YPF

15
Description of Repsol YPF: transport, trading and wholesale marketing
CanaportCanada
Camisea
Trinidad andTobago
Nigeria
Gassi TouilAlgeria
Persian
Leader in Liquid Natural Gas (LNG) in the Atlantic Bais, with a 10% of the market
Electric Third power of the worldwide market per volume of LNG managed through the joint venture with Gas Natural SDG, only back from the companies KOGAS and Tokio Electric
Attractive customers portfolio (Trinidad, Argelia, Iran)
Source: Repsol YPF
Basis of the transaction
16
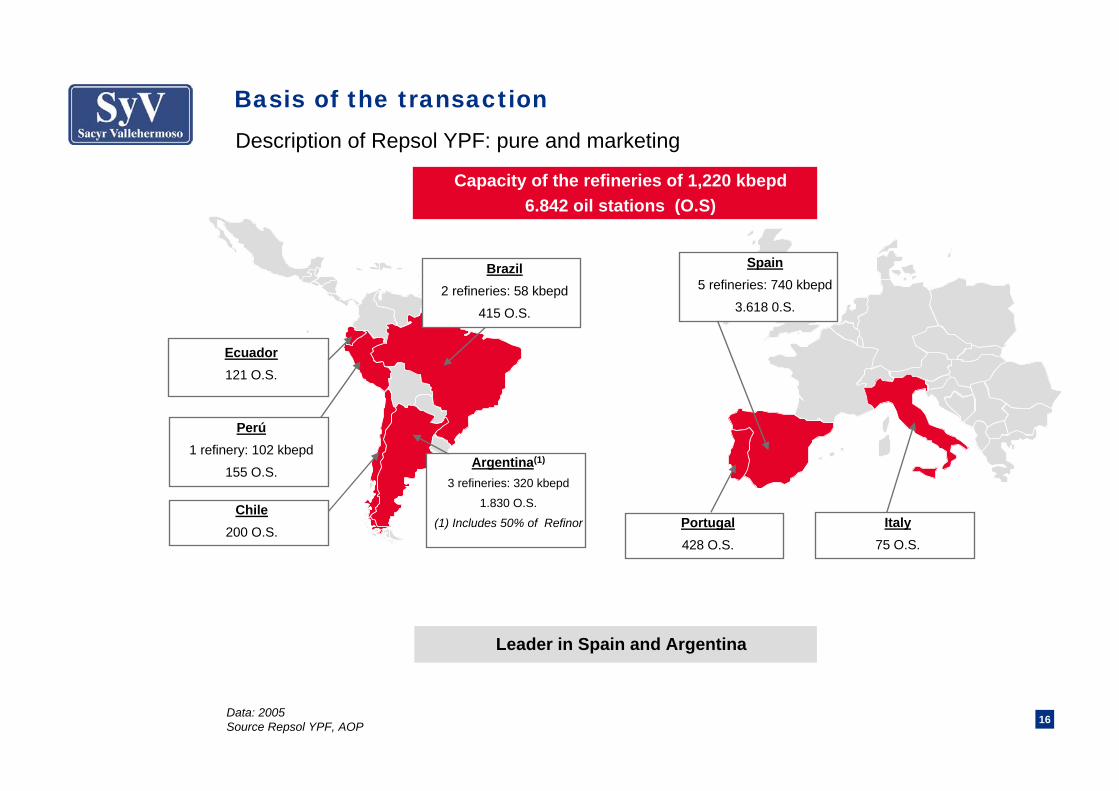
Basis of the transactionDescription of Repsol YPF: pure and marketing
Ecuador121 O.S.
Perú1 refinery: 102 kbepd
155 O.S.
Chile200 O.S.
Argentina(1)
3 refineries: 320 kbepd
1.830 O.S.
(1) Includes 50% of Refinor
Brazil2 refineries: 58 kbepd
415 O.S.
Spain5 refineries: 740 kbepd
3.618 0.S.
Portugal428 O.S.
Italy75 O.S.
Capacity of the refineries of 1,220 kbepd6.842 oil stations (O.S)
Leader in Spain and Argentina
Data: 2005Source Repsol YPF, AOP

17
Basis of the transactionDescription of Repsol YPF: leadership in the business of LNG
3,3
0 2 4 6
Ferrel
Total Gaz
ENI
Mitsubishi LPG
Zeta Group
Indian Oil
Amerigas
Repsol YPF
Shell
SHV Holding
SHVHolding
m t
Compañías no petroleras
Third worldwide company in LNG and second oil company Market share of 81% in Spain
Ecuador: 38%Peru 30%
Bolivia: 37%
Chile: 37%Argentina: 34%
Brazil
India
MoroccoPortugal: 21%Spain: 81%
France
Data 2005source: Repsol YPF
Million tons
non oil companies

18
Basis of the transactionDescription of Repsol YPF: Petrochemical
CorunnaBasis: 60 kt
SinesBasis: 580 ktDerived: 275 kt
Santader Derived 54 kt
Dynasol (50%) BilbaoBasis: 80 kt
TarragonaBasis: 1.285 kt
Derived: 1.557 kt
PuertollanoBase: 537 ktDerived: 704 kt
AltamiraDerived 45 ktDynasol (50%)
EnsenadaBasis: 175 kt Derived 592 kt
Plaza HuinculDerived: 411 kt
Bahía Blanca(1)
Derived. 933 kt
(1) 50% of Profertil
Capacity of production in 20057.402 kt
First petrochemical company in Spain and Portugal
Data 2005Source: Repsol YPF
19
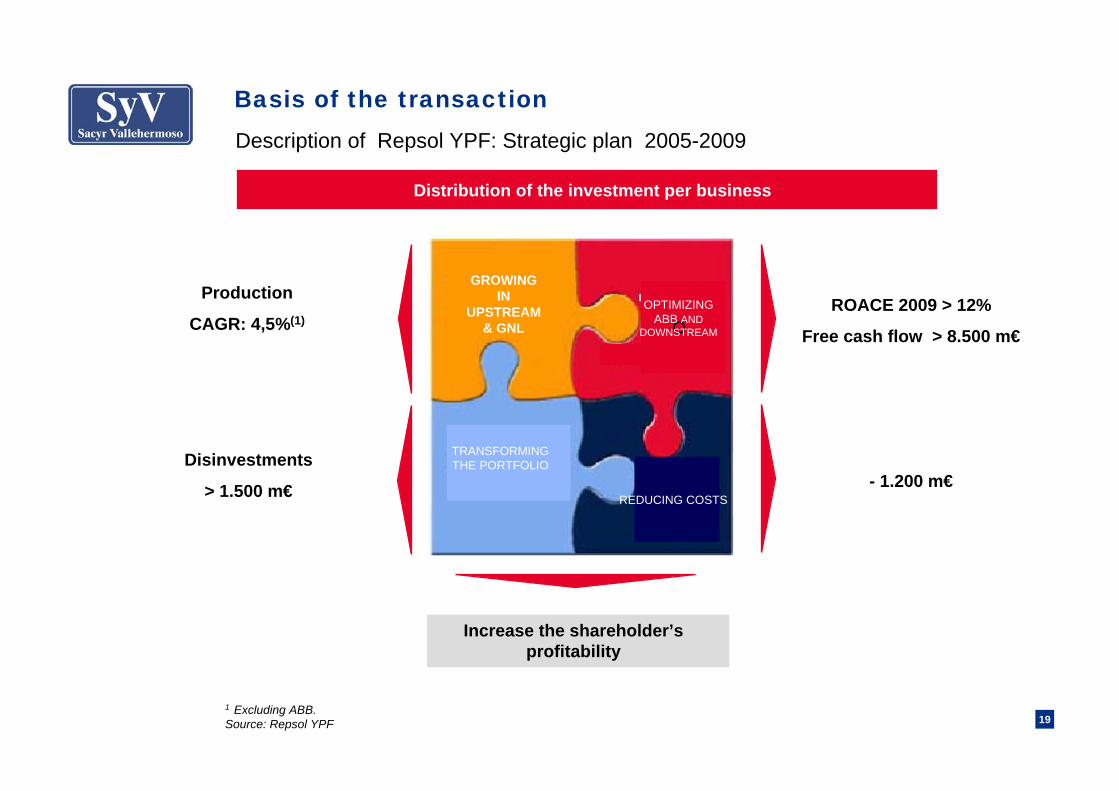
Basis of the transactionDescription of Repsol YPF: Strategic plan 2005-2009
Distribution of the investment per business
ROACE 2009 > 12%
Free cash flow > 8.500 m€
- 1.200 m€Disinvestments
> 1.500 m€
Production
CAGR: 4,5%(1)
1 Excluding ABB.Source: Repsol YPF
Increase the shareholder’s profitability
GROWING IN
UPSTREAM & GNL O
OPTIMIZING ABB AND
DOWNSTREAM
TRANSFORMINGTHE PORTFOLIO
REDUCING COSTS
Financial analysis

21
5.7x
4.5x
5.5x5.8x 5.7x5.6x
4.2x
5.6x 5.7x 5.9x5.5x
7.1x
5.7x
4.2x
5.7x 5.8x 5.8x
7.1x
5.3x 5.3x
8.5x
5.3x5.2x 5.2x
0.0x
1.0x
2.0x
3.0x
4.0x
5.0x
6.0x
7.0x
8.0x
9.0x
Repsol Norsk Hydro OMV Total ENI Royal Dutch Shell Statoil BP2006e 2007e 2008e
Financial Analysis
The implicit multiples of the acquisition of 9.24% of Repsol YPF are highly in line with the multiples EV/DACF and P/E at which the rest of comparable European companies are quoting
Implicit multiples of acquisition vs. multiples of comparable European companies
EV/DACF
Source: Analyst reports

22
9.2x
7.7x 7.8x
8.9x
7.8x8.2x
9.1x9.9x10.0x
7.8x8.5x
9.3x8.7x
9.4x8.6x
9.9x10.6x
8.7x 8.7x9.5x
9.1x 9.4x 9.6x10.0x
0.0x
2.0x
4.0x
6.0x
8.0x
10.0x
12.0x
Repsol Norsk Hydro OMV Total ENI Royal Dutch Shell Statoil BP2006e 2007e 2008e
Financial AnalysisImplicit multiples of acquisition vs. Multiples of European Comparable companies
P/E
Source: Analysts Reports
23
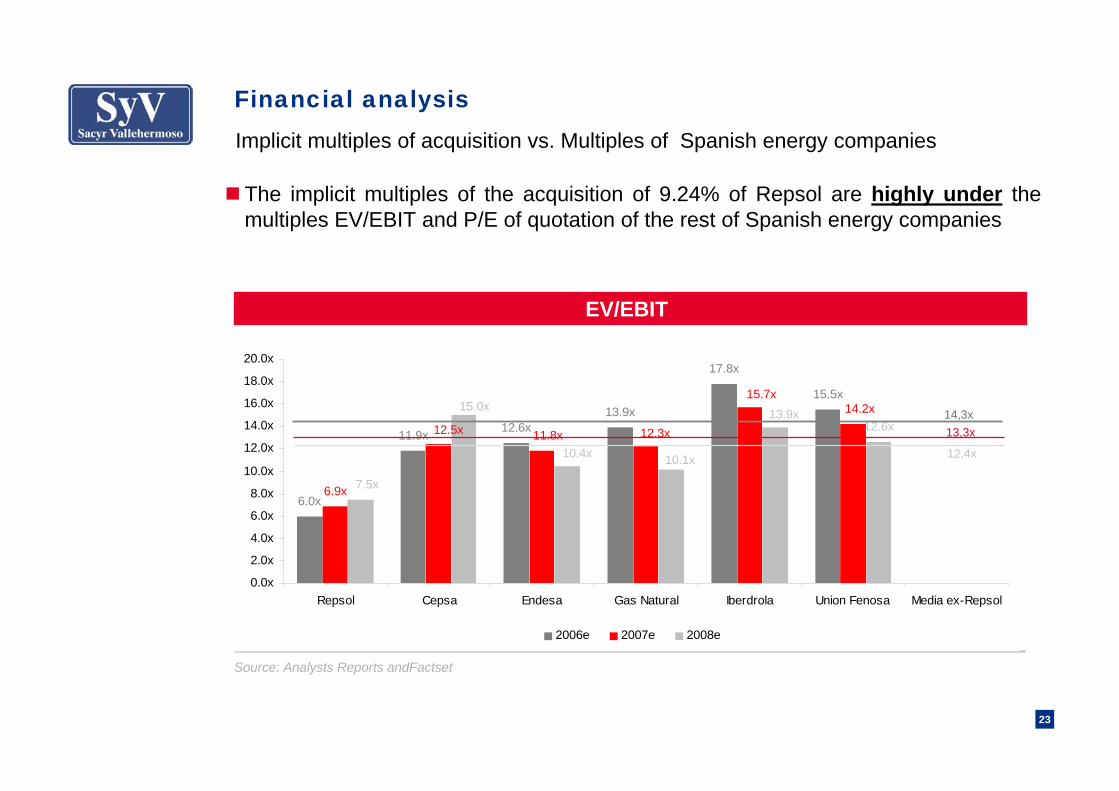
Financial analysis
The implicit multiples of the acquisition of 9.24% of Repsol are highly under the multiples EV/EBIT and P/E of quotation of the rest of Spanish energy companies
Implicit multiples of acquisition vs. Multiples of Spanish energy companies
EV/EBIT
Source: Analysts Reports andFactset
6.0x
11.9x 12.6x13.9x
17.8x
15.5x
6.9x
12.6x14.2x
11.8x12.5x 12.3x
15.7x
10.4x
7.5x
15.0x
10.1x
13.9x
0.0x
2.0x
4.0x
6.0x
8.0x
10.0x
12.0x
14.0x
16.0x
18.0x
20.0x
Repsol Cepsa Endesa Gas Natural Iberdrola Union Fenosa Media ex-Repsol
2006e 2007e 2008e
14,3x13,3x
12,4x
24
9.0x
16.4x
26.9x 26.0x
29.9x31.3x
9.7x
26.3x
22.1x
17.8x
25.8x 25.7x
22.8x23.5x
20.0x22.3x
10.3x
24.6x
0.0x
5.0x
10.0x
15.0x
20.0x
25.0x
30.0x
35.0x
Repsol Cepsa Endesa Gas Natural Iberdrola Union Fenosa Media ex-Repsol
2006e 2007e 2008e
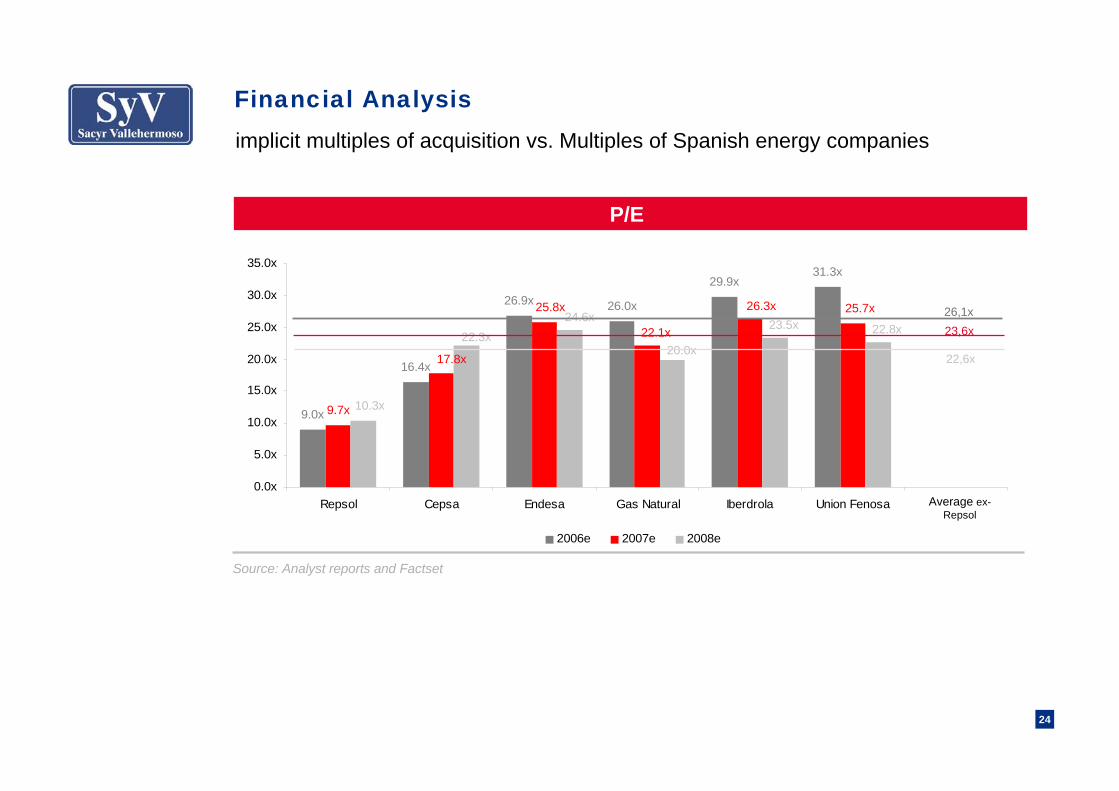
Financial Analysisimplicit multiples of acquisition vs. Multiples of Spanish energy companies
P/E
Source: Analyst reports and Factset
26,1x
22,6x
23,6x
Average ex-Repsol

25
Financial AnalysisImpact on the Group SyV: net benefit per share
Impact on the NBPS of SyV
Note: It has not been considered any type of synergy or goodwill.
Consolidation by the equity method of 3 months for an estimated result of Repsol YPF according to the consensus of Factset of €3,377 million and of SyV of €356 million together with 9 months of Eiffage (400*33%)
Consolidation by the equity method for an estimated result of Repsol YPF according to the consensus of Factset of €3,377 million and of SyV of €403million, together with Eiffage (434*33%)
*
*
**
**
1,06
1,601,79
2,63
1,50
1,001,201,401,601,80
2,002,202,402,602,80
2004 2005 2006 2006 Post 2007 E
BPAEPS

26
Financial AnalysisImpact on the Group SyV: balance
30/06/0630/06/2006
Post(€ million)
1.21.0Total net debt/ Market capitalization
7.35.8Total net Debt/ Net worth
11,2798,423Non-recourse debt
5,5902,734Corporative debt net
14,01311,157Net debt
19,99717,141Total assets
1,9081,908Net worth

SyV: a story of value creation

28
Market Capitalization as of 02/06/2003 (€ million)(1)
SyV: a story of value creationRanking per market capitalization 2003
+303%
Source: Factset(1) Merger date between Sacyr and Vallehermoso
397
2,7183,029
3,296
2,532
4,187
ACS SYV FER FCC ANA OHL

29
1,488
7,7058,768
9,482
11,551
13,504
ACS SYV FER FCC ANA OHL
In the last 3 years SyV has been the company of services and construction with the highest growth, multiplying its market capitalization per 4.6x
SyV: a story of value creation
(x3.2)
(x4.6)
(x2.9)(x2.9)
(x2.8)
(x3.7)
Market capitalization as of 13/10/2006 (€million)
Ranking per market capitalization 2006
Source Factset

30
SyV: a story of value creation
(euros per share)
Note: the price of the shares and index have as a base the price of the share of Sacyr-Vallehermoso in September 2004
stock market evolution in the last 2 years
SyV share has been the one with the highest revaluation in the sector, also highly above the reference index of the Spanish and European markets.
In 2 years the share price of SyV has been multiplied 3.6 times

31
Conclusion
The operation is framed in the strategy of diversification and growth of SyV. It
comes to reinforce the long term business and sustained profitability and confirms the idea of being present in the main companies of every sector where
the Group is acting.


