LUBE MAGAZINE No.93 OCTOBER 2009 21 Abstract: Grease high-temperature claims based on different standards can vary widely. The range of approaches commonly used in the industry to define the maximum temperature at which a grease will provide adequate lubrication can be confusing for customers wishing to select the best product for their application. A lubrication decision based upon a published grease temperature range can lead to undesired consequences unless the user understands the basis for the high-temperature limit being claimed. Factors limiting grease high-temperature performance include degradation due to oxidation, and / or the loss of base oil from bleed and evaporation. In general, dynamic grease life determi- nations based on standardised bearing tests, better represent what occurs in the field, providing a measure of grease high- temperature performance limits, which is more realistic than claims based on dropping point. A test program was conducted on a variety of commercial greases, which included DIN 51821 FAG FE9 Life, ASTM D4290 Wheel Bearing Leakage, ASTM D2265 Dropping Point, and ASTM D5483 PDSC testing, and the test results were compared to product data sheet claims. Interesting discrepancies were found between product high temperature claims and their relative ratings based on FE9 or Wheel Bearing Leakage testing. An industry standard approach to high temperature claims would be preferable to the various claims made by suppliers today. Such a basis would be far superior to the “rule-of- thumb” guidance provided in the NLGI Lubricating Grease Guide (Maximum Usable Temperature in the Grease Application Guide table), which is based solely on thickener type, and would benefit consumers and producers alike, reducing confusion in the marketplace. For example, not all lithium complex greases are the same. Complexing agents, manufacturing methods and base oil type can influence the high-temperature performance of a lithium complex, or for that matter, any high-temperature grease. Introduction: Historically, grease high temperature operating claims have been based on Dropping Point, thickener type, actual field experience, various laboratory bench or rig tests, or a combination of the above. When basing upper operating temperature limits on Dropping Point, a margin of safety is usually applied, such that the recommended limit is some number of degrees below the dropping point. Various “rules of thumb” have been applied, such as 50oC below the dropping point. Background: Table 1 is an example of industry “generic” guidance, based on thickener type, extracted from the NLGI Grease Application Guide 1. Table 2 is a similar example, extracted from an ExxonMobil grease training module 2. Examination of the “deltas” between the reported typical dropping points and the recommended maximum service temperatures in these two examples illustrates the inconsistency in this approach: Lube-Tech No.66 page 1 Shouldn't Grease Upper Operating Temperature Claims Have a Technical Basis? PUBLISHED BY LUBE: THE EUROPEAN LUBRICANTS INDUSTRY MAGAZINE Table 1 Example: NLGI Grease Application Guide Table 2 Historical ExxonMobil Guidance
Transcript
L U B E M A G A Z I N E N o . 9 3 O C T O B E R 2 0 0 9 21
Abstract:Grease high-temperature claims based on different standardscan vary widely. The range of approaches commonly used in theindustry to define the maximum temperature at which a greasewill provide adequate lubrication can be confusing for customerswishing to select the best product for their application. Alubrication decision based upon a published grease temperaturerange can lead to undesired consequences unless the userunderstands the basis for the high-temperature limit beingclaimed.
Factors limiting grease high-temperature performance includedegradation due to oxidation, and / or the loss of base oil frombleed and evaporation. In general, dynamic grease life determi-nations based on standardised bearing tests, better representwhat occurs in the field, providing a measure of grease high-temperature performance limits, which is more realistic thanclaims based on dropping point.
A test program was conducted on a variety of commercialgreases, which included DIN 51821 FAG FE9 Life, ASTM D4290Wheel Bearing Leakage, ASTM D2265 Dropping Point, andASTM D5483 PDSC testing, and the test results were comparedto product data sheet claims. Interesting discrepancies werefound between product high temperature claims and theirrelative ratings based on FE9 or Wheel Bearing Leakage testing.
An industry standard approach to high temperature claimswould be preferable to the various claims made by supplierstoday. Such a basis would be far superior to the “rule-of-thumb” guidance provided in the NLGI Lubricating Grease Guide(Maximum Usable Temperature in the Grease Application Guidetable), which is based solely on thickener type, and wouldbenefit consumers and producers alike, reducing confusion inthe marketplace. For example, not all lithium complex greasesare the same. Complexing agents, manufacturing methods andbase oil type can influence the high-temperature performance ofa lithium complex, or for that matter, any high-temperaturegrease.Introduction:Historically, grease high temperature operating claims have beenbased on Dropping Point, thickener type, actual field experience,various laboratory bench or rig tests, or a combination of the
above. When basing upper operating temperature limits onDropping Point, a margin of safety is usually applied, such thatthe recommended limit is some number of degrees below thedropping point. Various “rules of thumb” have been applied,such as 50oC below the dropping point.
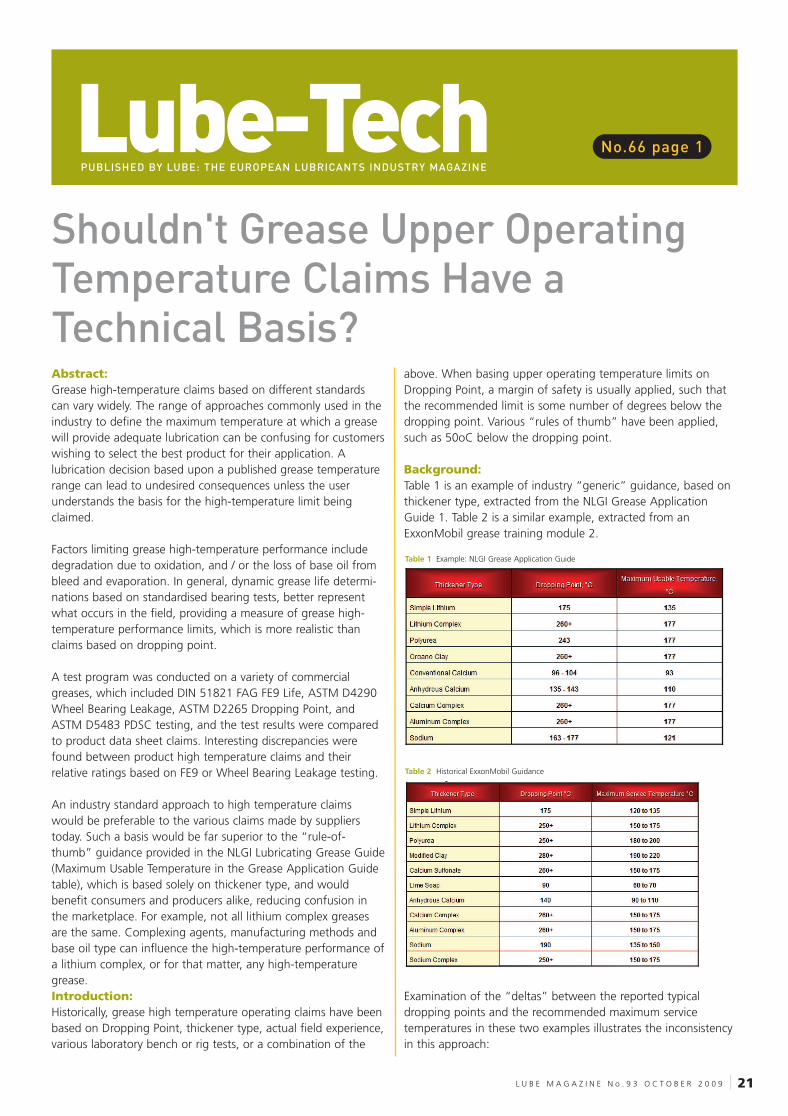
Background:Table 1 is an example of industry “generic” guidance, based onthickener type, extracted from the NLGI Grease ApplicationGuide 1. Table 2 is a similar example, extracted from anExxonMobil grease training module 2.
Examination of the “deltas” between the reported typicaldropping points and the recommended maximum servicetemperatures in these two examples illustrates the inconsistencyin this approach:
Lube-Tech No.66 page 1
Shouldn't Grease Upper OperatingTemperature Claims Have aTechnical Basis?
PUBLISHED BY LUBE: THE EUROPEAN LUBRICANTS INDUSTRY MAGAZINE
Table 1 Example: NLGI Grease Application Guide
Table 2 Historical ExxonMobil Guidance
93 Lube 10/9/09 15:31 Page 21
L U B E M A G A Z I N E N o . 9 3 O C T O B E R 2 0 0 922
Lube-TechIn the NLGI guidance, some thickener types are given a “conser-vative” maximum usable temperature of more than 83oC belowthe dropping point. For other thickener types, the maximumusable temperature is as close as 3 to 11oC below the droppingpoint. Excluding conventional and anhydrous calcium greases,the average delta is about 56oC.
In the ExxonMobil guidance, some thickener types are given a“conservative” maximum service temperature of between 85 to110oC below the dropping point. For other thickener types, themaximum service temperature is as close as 20 to 30oC belowthe dropping point. Excluding lime and anhydrous calciumgreases, the average delta is about 80oC.
So, even by these more traditional approaches, there is consid-erable difference in the maximum operating temperaturerecommendations given by different industry sources. It is nowonder that end users may be a bit confused by theseconflicting recommendations.
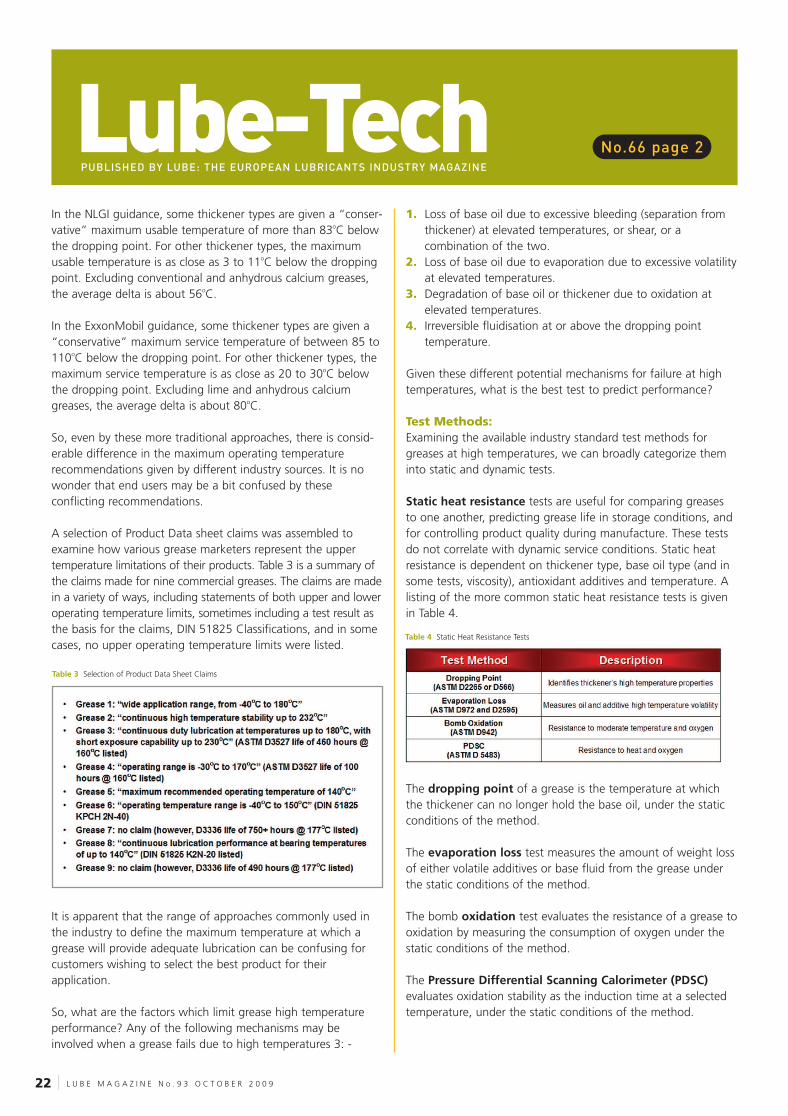
A selection of Product Data sheet claims was assembled toexamine how various grease marketers represent the uppertemperature limitations of their products. Table 3 is a summary ofthe claims made for nine commercial greases. The claims are madein a variety of ways, including statements of both upper and loweroperating temperature limits, sometimes including a test result asthe basis for the claims, DIN 51825 Classifications, and in somecases, no upper operating temperature limits were listed.
It is apparent that the range of approaches commonly used inthe industry to define the maximum temperature at which agrease will provide adequate lubrication can be confusing forcustomers wishing to select the best product for theirapplication.
So, what are the factors which limit grease high temperatureperformance? Any of the following mechanisms may beinvolved when a grease fails due to high temperatures 3: -
1. Loss of base oil due to excessive bleeding (separation fromthickener) at elevated temperatures, or shear, or acombination of the two.
2. Loss of base oil due to evaporation due to excessive volatilityat elevated temperatures.
3. Degradation of base oil or thickener due to oxidation atelevated temperatures.
4. Irreversible fluidisation at or above the dropping pointtemperature.
Given these different potential mechanisms for failure at hightemperatures, what is the best test to predict performance?
Test Methods:Examining the available industry standard test methods forgreases at high temperatures, we can broadly categorize theminto static and dynamic tests.
Static heat resistance tests are useful for comparing greasesto one another, predicting grease life in storage conditions, andfor controlling product quality during manufacture. These testsdo not correlate with dynamic service conditions. Static heatresistance is dependent on thickener type, base oil type (and insome tests, viscosity), antioxidant additives and temperature. Alisting of the more common static heat resistance tests is givenin Table 4.
The dropping point of a grease is the temperature at whichthe thickener can no longer hold the base oil, under the staticconditions of the method.
The evaporation loss test measures the amount of weight lossof either volatile additives or base fluid from the grease underthe static conditions of the method.
The bomb oxidation test evaluates the resistance of a grease tooxidation by measuring the consumption of oxygen under thestatic conditions of the method.
The Pressure Differential Scanning Calorimeter (PDSC)evaluates oxidation stability as the induction time at a selectedtemperature, under the static conditions of the method.
PUBLISHED BY LUBE: THE EUROPEAN LUBRICANTS INDUSTRY MAGAZINE
No.66 page 2
Table 3 Selection of Product Data Sheet Claims
Table 4 Static Heat Resistance Tests
93 Lube 10/9/09 15:32 Page 22
L U B E M A G A Z I N E N o . 9 3 O C T O B E R 2 0 0 9 23
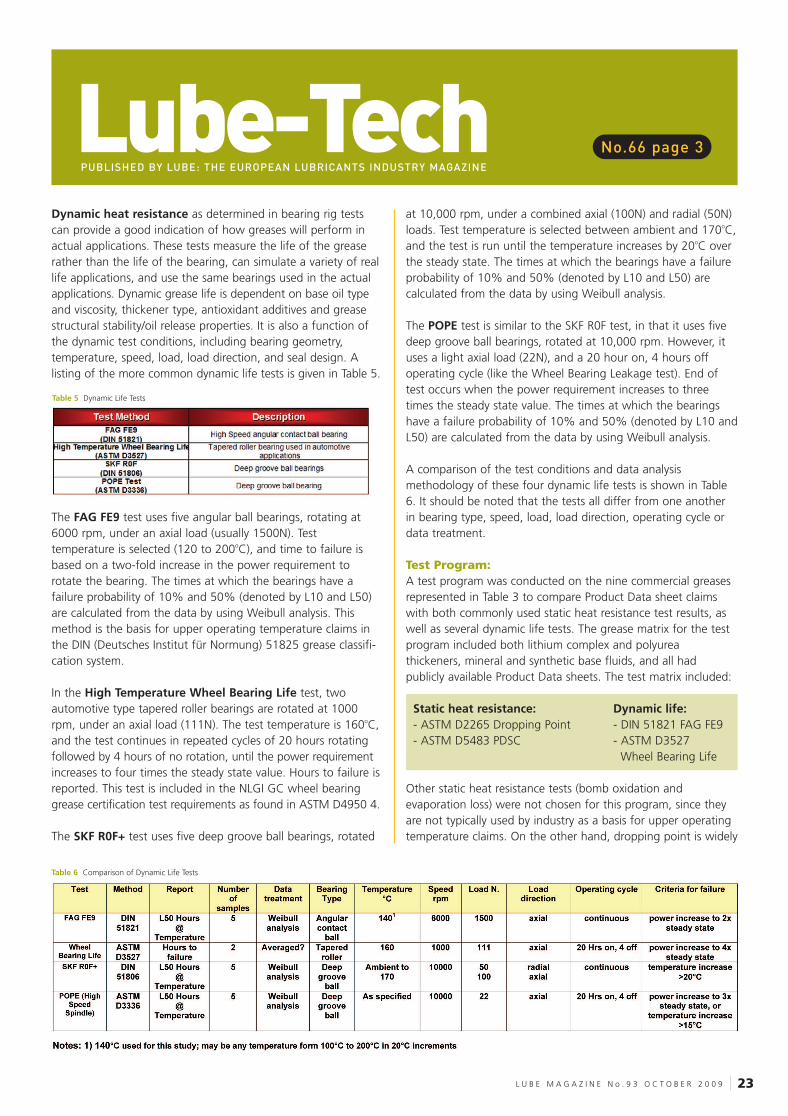
Lube-TechDynamic heat resistance as determined in bearing rig testscan provide a good indication of how greases will perform inactual applications. These tests measure the life of the greaserather than the life of the bearing, can simulate a variety of reallife applications, and use the same bearings used in the actualapplications. Dynamic grease life is dependent on base oil typeand viscosity, thickener type, antioxidant additives and greasestructural stability/oil release properties. It is also a function ofthe dynamic test conditions, including bearing geometry,temperature, speed, load, load direction, and seal design. Alisting of the more common dynamic life tests is given in Table 5.
The FAG FE9 test uses five angular ball bearings, rotating at6000 rpm, under an axial load (usually 1500N). Testtemperature is selected (120 to 200oC), and time to failure isbased on a two-fold increase in the power requirement torotate the bearing. The times at which the bearings have afailure probability of 10% and 50% (denoted by L10 and L50)are calculated from the data by using Weibull analysis. Thismethod is the basis for upper operating temperature claims inthe DIN (Deutsches Institut für Normung) 51825 grease classifi-cation system.
In the High Temperature Wheel Bearing Life test, twoautomotive type tapered roller bearings are rotated at 1000rpm, under an axial load (111N). The test temperature is 160oC,and the test continues in repeated cycles of 20 hours rotatingfollowed by 4 hours of no rotation, until the power requirementincreases to four times the steady state value. Hours to failure isreported. This test is included in the NLGI GC wheel bearinggrease certification test requirements as found in ASTM D4950 4.
The SKF R0F+ test uses five deep groove ball bearings, rotated
at 10,000 rpm, under a combined axial (100N) and radial (50N)loads. Test temperature is selected between ambient and 170oC,and the test is run until the temperature increases by 20oC overthe steady state. The times at which the bearings have a failureprobability of 10% and 50% (denoted by L10 and L50) arecalculated from the data by using Weibull analysis.
The POPE test is similar to the SKF R0F test, in that it uses fivedeep groove ball bearings, rotated at 10,000 rpm. However, ituses a light axial load (22N), and a 20 hour on, 4 hours offoperating cycle (like the Wheel Bearing Leakage test). End oftest occurs when the power requirement increases to threetimes the steady state value. The times at which the bearingshave a failure probability of 10% and 50% (denoted by L10 andL50) are calculated from the data by using Weibull analysis.
A comparison of the test conditions and data analysismethodology of these four dynamic life tests is shown in Table6. It should be noted that the tests all differ from one anotherin bearing type, speed, load, load direction, operating cycle ordata treatment.
Test Program: A test program was conducted on the nine commercial greasesrepresented in Table 3 to compare Product Data sheet claimswith both commonly used static heat resistance test results, aswell as several dynamic life tests. The grease matrix for the testprogram included both lithium complex and polyureathickeners, mineral and synthetic base fluids, and all hadpublicly available Product Data sheets. The test matrix included:
Static heat resistance: Dynamic life:- ASTM D2265 Dropping Point - DIN 51821 FAG FE9- ASTM D5483 PDSC - ASTM D3527
Wheel Bearing Life
Other static heat resistance tests (bomb oxidation andevaporation loss) were not chosen for this program, since theyare not typically used by industry as a basis for upper operatingtemperature claims. On the other hand, dropping point is widely
PUBLISHED BY LUBE: THE EUROPEAN LUBRICANTS INDUSTRY MAGAZINE
No.66 page 3
Table 5 Dynamic Life Tests
Table 6 Comparison of Dynamic Life Tests
93 Lube 10/9/09 16:05 Page 23
L U B E M A G A Z I N E N o . 9 3 O C T O B E R 2 0 0 924
Lube-Tech
used as a basis for upper operating temperature claims, andPDSC was also run because it was felt to have some potentialfor predicting high temperature life as determined by longerdynamic bearing life tests.
The FAG FE9 and Wheel Bearing Life tests were chosen becausethey each are the basis for industry certifications – FE9 for theDIN 51825 classification system and Wheel Bearing Life for theNLGI GC certification mark. In addition, the SKF R0F+ and POPEtests are both very long tests, usually running for 500 to 1000hours to failure.
Data Analysis:Raw test data from the program are shown in Table 7, includingnot only the data from the four static and dynamic heatresistance tests, but also thickener type, base oil type and 60stroke worked penetration.
The nine greases were all in the range of NLGI 1.5 to 3 gradeconsistencies, with most having a 60 stoke worked penetrationin the neighborhood of 300 dmm. Dropping points ranged from212 to 309oC for the lithium complex greases and from 264 to301oC for the polyurea greases. PDSC induction times at 210oCranged from 5 to over 120 minutes. FE9 L50 life at 140oCranged from 60 to 276 hours. High temperature wheel bearinglife at 160oC ranged from 60 to 560 hours. Product Data sheetupper operating temperature claims ranged from 140 to 232oC.
Observations and Conclusions:Dropping point versus Product Data sheet claims – Figure 1shows graphically the relationship between dropping point andupper operating temperature claims. The most risky data sheetclaim is only 59oC below its dropping point (grease 2). The mostconservative claim is 160oC below the dropping point (grease 5).The average delta is about 120oC.
PDSC versus Product Data sheet claims – PDSC induction timesat 210oC were normalised (using Arrhenius methodology) to thetemperature at which the induction time would be greater thanor equal to 1000 minutes in order to convert the data totemperature units for comparison to the data sheet claims.Figure 2 illustrates the relationship between the normalizedPDSC data in oC (at 1000+ minutes) to the data sheet claims.The most risky data sheet claim is 102oC above the PDSCtemperature (grease 2). The most conservative claim is 30oCbelow the PDSC temperature (grease 9). The average delta is8oC above the PDSC temperature.
PUBLISHED BY LUBE: THE EUROPEAN LUBRICANTS INDUSTRY MAGAZINE
No.66 page 4
Table 7 Comparative Test Data
Figure 1 Claims verses Dropping Point
Figure 2 Claims verses PDSC
93 Lube 10/9/09 16:05 Page 24
Table 8 Summary PDS Comparison
Figure 3 Claims verses FE9
Figure 4 Claims verses Wheel Bearing Life
Lube-TechFE9 versus Product Data sheet claims – Similar to the PDSC, theFE9 L50 life at 140oC was converted (using Arrheniusmethodology) to the temperature for a 100 hour L50 life. A 100hour life was chosen based on the requirements of the DIN51825 classification. Figure 3 shows compares the normalisedFE9 data in oC (at 100 hours) to the data sheet claims. The mostrisky data sheet claim is 91oC above the FE9 temperature(grease 2). The most conservative data sheet claim is equal tothe FE9 temperature (grease 8). The average delta is about 20oCabove the FE9 temperature.
High temperature wheel bearing life versus Product Datasheet claims – As with the FE9 life data, the HTWB life in hoursneeded to be converted to temperature units. A life of 80 hourswas selected, based on the requirement in the NLGI GC certifi-cation mark (as described in ASTM D4950). The normalised lifedata, shown in oC (at 80 hours) is compared to data sheetclaims in Figure 4. The most risky claim is 54oC above theHTWB temperature (grease 2). The most conservative claim is38oC below the HTWB temperature (grease 7). The averagedelta is 20oC below the HTWB temperature.
Data summary comparison The data from the four analyses was summarised into a singlematrix, shown in Table 8. Ratings are arbitrarily determined andare as follows: _
C = Conservative = more than 130oC below drop point, morethan 20oC below PDSC temperature, more than 0oC below FE9temperature, more than 20oC below HTWB life temperature.OK = Safe = from 100 to 130oC below drop point, from 10oCabove to 20oC below PDSC temperature, from 0 to 20oC aboveFE9 temperature, from 10oC above to 20oC below HTWB lifetemperature.R = Risky = less than 100oC below drop point, from 20 to 50oCabove PDSC temperature, from 20 to 30oC above FE9temperature, from 10 to 30oC above HTWB life temperature.VR = Very Risky = more than 50oC above PDSC temperature,more than 30oC above FE9 temperature, more than 30oC aboveHTWB life temperature.
It is interesting to observe that significant differences werefound between these nine greases’ high temperature claims andtheir relative rankings based on each of the four tests in theprogram. Some data sheet claims carry more risk to the enduser than others. Other observations:
• Several of the greases’ high temperature claims appeared tobe risky or worse by more than one test (Greases 2, 3 and 4)
• One grease appeared to have a safe claim based on dynamicor PDSC testing, but seemed risky by dropping point (Grease 8)
A second data examination was performed, comparing howeach of the four tests ranked the nine greases, shown in Table9. Observations from that comparison: -
PUBLISHED BY LUBE: THE EUROPEAN LUBRICANTS INDUSTRY MAGAZINE
No.66 page 5
Table 9 Relative Ranking Comparison
L U B E M A G A Z I N E N o . 9 3 O C T O B E R 2 0 0 9 25
93 Lube 10/9/09 15:33 Page 25
L U B E M A G A Z I N E N o . 9 3 O C T O B E R 2 0 0 926
Lube-Tech• While Grease 9 was ranked best by drop point and PDSC
and near the top by HTWB life, it was one of the poorest byFE9 (blue highlights)
• While Grease 1 was also ranked best by drop point, it waslast by HTWB life (blue highlights)
• While Grease 7 was ranked best by both dynamic tests, FE9and HTWB life, it had the second lowest drop point (yellowhighlights)
• While Grease 2 was ranked near best in HTWB life, it wasranked near worst by FE9 (tan highlights)
• While Grease 3 was ranked near best by FE9, it was rankednear worst by HTWB life (green highlights)
All this goes to illustrate that there appears to be no rankingcorrelation:
• Between drop point and either of the dynamic tests
• Between FE9 and HTWB life
Next Steps:It still appears that an industry standard approach to makinghigh temperature claims for greases would be vastly better thanthe current confusing and conflicting rule of thumb industryguidance. The claims made on several grease’s data sheetscompared to their performance in dynamic life tests illustratesthe sometimes substantial end user risks existing today.However, given the lack of correlation between the dynamic lifetests used in this test program, the mechanism of failure forvarious greases in these and other dynamic tests needs to befurther investigated.
Acknowledgements:ExxonMobil Research and Engineering: