190
9500/9600 Power Meter User’s Guide
9500/9600 Power MeterUser’s Guide


DANGERElectricaI equipment contains hazardous voltages and high speed moving parts.
Can cause death, serious injury or property damage.
See safety instruction contained herein. Restrict use to qualified per-sonnel.
The use of unauthorized parts in the repair of the equipment or tampering by unqualified personnel will result in dangerous conditions that can cause death, serious injury or property damage.
IMPORTANTThe information contained herein is general in nature and not intended for specific application purposes. It does not relieve the user of responsibility to use sound practices in appli-cation, installation, operation, and maintenance of the equipment purchased. Siemens reserves the right to make changes at any time without notice or obligations. Should a conflict arise between the general information contained in this publication and the contents of drawings or supple-mentary material or both, the latter shall take precedence.
QUALIFIED PERSONNELFor the purposes of this manual and product labels, "qualified personnel" is one who is familiar with the installation, construction, or operation of the equipment and the hazards involved. In addition, s/he has the following qualifications:
(a) is trained and authorized to energize, de-energize, clear, ground, and tag circuits and equipment in accordance with established safety practices.
(b) is trained in the proper care and use of protective gear equipment such as rubber gloves, hard hat, safety glasses or face shields, flash clothing, etc., in accordance with estab-lished safety procedures
(c) is trained in rendering first aid.
SUMMARYThese instructions do not purport to cover all details or variations in equipment, nor to provide for every possible contingency to be met in connection with installation, operation, or maintenance. Should further information be desired or should particular problems arise which are not covered sufficiently for the purchaser’s purposes, the matter should be referred to the local the sales office.
THE CONTENTS OF THIS INSTRUCTION MANUAL SHALL NOT BECOME PART OF OR MODIFY ANY PRIOR OR EXISTING AGREEMENT, COMMITMENT OR RELATIONSHIP. THE SALES CONTRACT CONTAINS ALL OBLIGA-TIONS OF SIEMENS ENERGY & AUTOMATION, INC. THE WARRANTY CONTAINED IN THE CONTRACT BETWEEN THE PARTIES IS THE SOLE WARRANTY OF SIEMENS ENERGY & AUTOMATION, INC.
ACCESS, ISGS, Isolated Multi-Drop, S7-I/O, SBwin, SAMMS-LV, SAMMS-MV,SEAbus,SIEServe, Static Trip III, Wisdom, and WinPM are trademark, Sensitrip and Sentron are registered trademarks of Siemens Energy & Automation, Inc. SIEMENS is a registered trademark and Windows is a trademark of Microsoft Corporation. ION is a registered trademark of Power Measurement. All other product names mentioned herein are used for identifi-cation purposes only and may be the trademarks or registered trademarks of their respective companies.

Notices Danger
This symbol indicates the presence of dangerous voltage within and outside the product enclosure that may constitute a risk of electric shock, serious injury or death to persons if proper precautions are not followed.
CautionThis symbol alerts the user to the presence of hazards that may cause minor or moderate injury to persons, damage to property or damage to the device itself, if proper precautions are not followed.
NoteThis symbol directs the user’s attention to important installation, operating and maintenance instructions.
Installation ConsiderationsInstallation and maintenance of the 9500/9600 meter should only be performed by qualified, competent personnel that have appropriate training and experience with high voltage and current devices. The meter must be installed in accordance with all Local and National Electrical Codes.
DANGER
Failure to observe the following instructions may result in severe injury or death.
During normal operation of the 9500/9600 meter, hazardous voltages are present on its terminal strips, and throughout the connected potential transformer (PT), current transformer (CT), digital (status) input, control power and external I/O circuits. PT and CT secondary circuits are capable of generating lethal voltages and currents with their primary circuit energized. Follow standard safety precautions while performing any installation or service work (i.e. removing PT fuses, shorting CT secondaries, etc).
The terminal strips on the meter base should not be user-accessible after installation.
Do not use digital output devices for primary protection functions. These include applications where the devices perform energy limiting functions or provide protection of people from injury. Do not use the 9500/9600 in situations where failure of the devices can cause injury or death, or cause sufficient energy to be released that can start a fire. The meter can be used for secondary protection functions.
Do not HIPOT/Dielectric test the digital (status) inputs, digital outputs, or communications terminals. Refer to the label on the 9500/9600 meter for the maximum voltage level the device can withstand.

CAUTION
Observe the following instructions, or permanent damage to the meter may occur.
The 9500/9600 meter offers a range of hardware options that affect input ratings. The 9500/9600 meter’s serial number label lists all equipped options. Applying current levels incompatible with the current inputs will permanently damage the meter. This document provides installation instructions applicable to each hardware option.
The 9500/9600 meter’s chassis ground must be properly connected to the switchgear earth ground for the noise and surge protection circuitry to function correctly. Failure to do so will void the warranty.
Terminal screw torque: Barrier-type (current, voltage, and relay terminal screws: 1.35 Nm (1.00 ft-lbf) max. Captured-wire type (digital inputs/outputs, communications, power supply: 0.90 Nm (0.66 ft.lbf) max.
FCC NoticeThis equipment has been tested and found to comply with the limits for a Class A digital device, pursuant to Part 15 of the FCC Rules. These limits are designed to provide reasonable protection against harmful interference when the equipment is operated in a commercial environment. This equipment generates, uses, and can radiate radio frequency energy and, if not installed and used in accordance with the instruction manual, may cause harmful interference to radio communications. Operation of this equipment in a residential area is likely to cause harmful interference in which case the user will be required to correct the interference at his own expense. The Ringer Equivalence Number (REN) for the 9500/9600 optional internal modem is 0.6. Connection to the 9500/9600 internal modem should be made via an FCC Part 68 compliant telephone cord (not supplied). The 9500/9600 cannot be used on a public coin phone service or party line services.
Network Compatibility Notice for the Internal ModemThe internal modem in meters equipped with this option is compatible with the telephone systems of most countries in the world, with the exception of Australia and New Zealand. Use in some countries may require modification of the internal modem’s initialization strings. If problems using the modem on your phone system occur, please contact Siemens Customer Service
Standards Compliance
CSA: Certified to CAN/CSA C22.2 No.1010-1
Certified to UL 3111
CE: approved


Contents
Chapter 1 Introduction ..................................................................... 11 9500 and 9600 Meters . . . . . . . . . . . . . . . . . . . . . . . . . . . . . . . . . . . . . . . . . . 12
The ACCESS meter in an Enterprise Energy Management System . . . . . . . . . . . . 14Data Display and Analysis Tools . . . . . . . . . . . . . . . . . . . . . . . . . . . . . . . . . . . . . . . . . . . 14Communications Protocols . . . . . . . . . . . . . . . . . . . . . . . . . . . . . . . . . . . . . . . . . . . . . . . . 16Digital and Analog I/O Options . . . . . . . . . . . . . . . . . . . . . . . . . . . . . . . . . . . . . . . . . . . . 16The Meter is Factory-Configured and Ready to Operate . . . . . . . . . . . . . . . . . . . . . . . 17
Firmware Revision History . . . . . . . . . . . . . . . . . . . . . . . . . . . . . . . . . . . . . . . . 18
Using this Guide . . . . . . . . . . . . . . . . . . . . . . . . . . . . . . . . . . . . . . . . . . . . . . . 19Getting More Information . . . . . . . . . . . . . . . . . . . . . . . . . . . . . . . . . . . . . . . . . . . . . . . . . 19
Chapter 2 Using The Front Panel ....................................................... 21 Displaying Data with the Front Panel . . . . . . . . . . . . . . . . . . . . . . . . . . . . . . . . 22
Display Screen Types . . . . . . . . . . . . . . . . . . . . . . . . . . . . . . . . . . . . . . . . . . . . . . . . . . . . . 23Default Front Panel Display Screens . . . . . . . . . . . . . . . . . . . . . . . . . . . . . . . . . . . . . . . . 26
Configuring the Meter with the Front Panel . . . . . . . . . . . . . . . . . . . . . . . . . . . . 31The Front Panel’s Setup Menu . . . . . . . . . . . . . . . . . . . . . . . . . . . . . . . . . . . . . . . . . . . . . . 31Basic Setup Menu . . . . . . . . . . . . . . . . . . . . . . . . . . . . . . . . . . . . . . . . . . . . . . . . . . . . . . . . 33Main Setup Menu . . . . . . . . . . . . . . . . . . . . . . . . . . . . . . . . . . . . . . . . . . . . . . . . . . . . . . . . 34Demand Setup Menu . . . . . . . . . . . . . . . . . . . . . . . . . . . . . . . . . . . . . . . . . . . . . . . . . . . . . 34Network Setup . . . . . . . . . . . . . . . . . . . . . . . . . . . . . . . . . . . . . . . . . . . . . . . . . . . . . . . . . . . 36Serial Communications Setup . . . . . . . . . . . . . . . . . . . . . . . . . . . . . . . . . . . . . . . . . . . . . . 38PQ (Power Quality) Setup . . . . . . . . . . . . . . . . . . . . . . . . . . . . . . . . . . . . . . . . . . . . . . . . . 39Format Setup Menu . . . . . . . . . . . . . . . . . . . . . . . . . . . . . . . . . . . . . . . . . . . . . . . . . . . . . . . 40Display Setup Menu . . . . . . . . . . . . . . . . . . . . . . . . . . . . . . . . . . . . . . . . . . . . . . . . . . . . . . 41Time Setup Menu . . . . . . . . . . . . . . . . . . . . . . . . . . . . . . . . . . . . . . . . . . . . . . . . . . . . . . . . 41Meter Resets . . . . . . . . . . . . . . . . . . . . . . . . . . . . . . . . . . . . . . . . . . . . . . . . . . . . . . . . . . . . . 43Security Setup . . . . . . . . . . . . . . . . . . . . . . . . . . . . . . . . . . . . . . . . . . . . . . . . . . . . . . . . . . . 44
Custom Front Panel Displays . . . . . . . . . . . . . . . . . . . . . . . . . . . . . . . . . . . . . . 46Creating a Front Panel Reset . . . . . . . . . . . . . . . . . . . . . . . . . . . . . . . . . . . . . . . . . . . . . . . 46
Chapter 3 Default Meter Functionality ............................................... 49 Default Meter Functionality . . . . . . . . . . . . . . . . . . . . . . . . . . . . . . . . . . . . . . . 50
Basic Setup . . . . . . . . . . . . . . . . . . . . . . . . . . . . . . . . . . . . . . . . . . . . . . . . . . . . . . . . . . . . . . 50Communications Setup . . . . . . . . . . . . . . . . . . . . . . . . . . . . . . . . . . . . . . . . . . . . . . . . . . . 51Data Logging Setup . . . . . . . . . . . . . . . . . . . . . . . . . . . . . . . . . . . . . . . . . . . . . . . . . . . . . . . 53Energy Pulsing Setup . . . . . . . . . . . . . . . . . . . . . . . . . . . . . . . . . . . . . . . . . . . . . . . . . . . . . 58Power Quality Configuration . . . . . . . . . . . . . . . . . . . . . . . . . . . . . . . . . . . . . . . . . . . . . . 59Setpoint Configuration . . . . . . . . . . . . . . . . . . . . . . . . . . . . . . . . . . . . . . . . . . . . . . . . . . . . 61

Meter Clock Configuration . . . . . . . . . . . . . . . . . . . . . . . . . . . . . . . . . . . . . . . . . . . . . . . . 62Display Setup . . . . . . . . . . . . . . . . . . . . . . . . . . . . . . . . . . . . . . . . . . . . . . . . . . . . . . . . . . . . 63Demand Setup . . . . . . . . . . . . . . . . . . . . . . . . . . . . . . . . . . . . . . . . . . . . . . . . . . . . . . . . . . . 64Time of Use Configuration . . . . . . . . . . . . . . . . . . . . . . . . . . . . . . . . . . . . . . . . . . . . . . . . . 65Factory Information . . . . . . . . . . . . . . . . . . . . . . . . . . . . . . . . . . . . . . . . . . . . . . . . . . . . . . 67
Third Party Protocols . . . . . . . . . . . . . . . . . . . . . . . . . . . . . . . . . . . . . . . . . . . . 68Using the Modbus RTU Protocol . . . . . . . . . . . . . . . . . . . . . . . . . . . . . . . . . . . . . . . . . . . 69Using the Modbus/TCP Protocol . . . . . . . . . . . . . . . . . . . . . . . . . . . . . . . . . . . . . . . . . . . 79Using the DNP 3.00 Protocol . . . . . . . . . . . . . . . . . . . . . . . . . . . . . . . . . . . . . . . . . . . . . . . 80
Restoring the Factory Configuration . . . . . . . . . . . . . . . . . . . . . . . . . . . . . . . . . 85
Chapter 4 Using ACCESS Software ................................................... 87 WinPM.Net Software . . . . . . . . . . . . . . . . . . . . . . . . . . . . . . . . . . . . . . . . . . . . 88
WinPM.Net: Management Console . . . . . . . . . . . . . . . . . . . . . . . . . . . . . . . . . . 89Configuring Communications . . . . . . . . . . . . . . . . . . . . . . . . . . . . . . . . . . . . . . . . . . . . . . 91
WinPM.Net: Vista . . . . . . . . . . . . . . . . . . . . . . . . . . . . . . . . . . . . . . . . . . . . . . 93Displaying Data with Vista . . . . . . . . . . . . . . . . . . . . . . . . . . . . . . . . . . . . . . . . . . . . . . . . 93Customizing the Vista Interface . . . . . . . . . . . . . . . . . . . . . . . . . . . . . . . . . . . . . . . . . . . 101
WinPM.Net: Designer . . . . . . . . . . . . . . . . . . . . . . . . . . . . . . . . . . . . . . . . . . 103Basics of ION Architecture . . . . . . . . . . . . . . . . . . . . . . . . . . . . . . . . . . . . . . . . . . . . . . . . 103Designer’s Main Configuration Screen . . . . . . . . . . . . . . . . . . . . . . . . . . . . . . . . . . . . . 107Viewing Real-time Data in Designer . . . . . . . . . . . . . . . . . . . . . . . . . . . . . . . . . . . . . . . 108Changing Setup Registers with Designer . . . . . . . . . . . . . . . . . . . . . . . . . . . . . . . . . . . 108Customizing Frameworks in Designer . . . . . . . . . . . . . . . . . . . . . . . . . . . . . . . . . . . . . . 110
WinPM.Net: Reporter . . . . . . . . . . . . . . . . . . . . . . . . . . . . . . . . . . . . . . . . . . 114Pre-configured Reports . . . . . . . . . . . . . . . . . . . . . . . . . . . . . . . . . . . . . . . . . . . . . . . . . . . 114Report Creation and Generation . . . . . . . . . . . . . . . . . . . . . . . . . . . . . . . . . . . . . . . . . . . 116
ION Setup Software . . . . . . . . . . . . . . . . . . . . . . . . . . . . . . . . . . . . . . . . . . . 118Configuring Communications . . . . . . . . . . . . . . . . . . . . . . . . . . . . . . . . . . . . . . . . . . . . . 118Basic Meter Configuration . . . . . . . . . . . . . . . . . . . . . . . . . . . . . . . . . . . . . . . . . . . . . . . . 121Displaying Data with ION Setup . . . . . . . . . . . . . . . . . . . . . . . . . . . . . . . . . . . . . . . . . . 122
Chapter 5 Features and Applications .............................................. 125 Communications . . . . . . . . . . . . . . . . . . . . . . . . . . . . . . . . . . . . . . . . . . . . . . 126
RS-232 Connections . . . . . . . . . . . . . . . . . . . . . . . . . . . . . . . . . . . . . . . . . . . . . . . . . . . . . . 127RS-485 Connections . . . . . . . . . . . . . . . . . . . . . . . . . . . . . . . . . . . . . . . . . . . . . . . . . . . . . . 128Ethernet Connections . . . . . . . . . . . . . . . . . . . . . . . . . . . . . . . . . . . . . . . . . . . . . . . . . . . . 129Internal Modem Connections . . . . . . . . . . . . . . . . . . . . . . . . . . . . . . . . . . . . . . . . . . . . . 132Infrared Port Connections . . . . . . . . . . . . . . . . . . . . . . . . . . . . . . . . . . . . . . . . . . . . . . . . 136
Internet Connectivity . . . . . . . . . . . . . . . . . . . . . . . . . . . . . . . . . . . . . . . . . . . 137WebMeter and MeterMail . . . . . . . . . . . . . . . . . . . . . . . . . . . . . . . . . . . . . . . . . . . . . . . . 137WebReach . . . . . . . . . . . . . . . . . . . . . . . . . . . . . . . . . . . . . . . . . . . . . . . . . . . . . . . . . . . . . . 138Telnet and Hyperterminal . . . . . . . . . . . . . . . . . . . . . . . . . . . . . . . . . . . . . . . . . . . . . . . . 138

Digital and Analog I/O . . . . . . . . . . . . . . . . . . . . . . . . . . . . . . . . . . . . . . . . . 139Specifying a Port in an ION Module . . . . . . . . . . . . . . . . . . . . . . . . . . . . . . . . . . . . . . . 139Using the Onboard Digital Outputs . . . . . . . . . . . . . . . . . . . . . . . . . . . . . . . . . . . . . . . . 141Using the Onboard Digital Inputs . . . . . . . . . . . . . . . . . . . . . . . . . . . . . . . . . . . . . . . . . 144Analog Inputs . . . . . . . . . . . . . . . . . . . . . . . . . . . . . . . . . . . . . . . . . . . . . . . . . . . . . . . . . . . 145Analog Outputs . . . . . . . . . . . . . . . . . . . . . . . . . . . . . . . . . . . . . . . . . . . . . . . . . . . . . . . . . 145
Time Synchronization . . . . . . . . . . . . . . . . . . . . . . . . . . . . . . . . . . . . . . . . . . 146
Meter Security . . . . . . . . . . . . . . . . . . . . . . . . . . . . . . . . . . . . . . . . . . . . . . . . 147Standard Meter Security . . . . . . . . . . . . . . . . . . . . . . . . . . . . . . . . . . . . . . . . . . . . . . . . . . 147
Data and Event Logging . . . . . . . . . . . . . . . . . . . . . . . . . . . . . . . . . . . . . . . . . 149Data Logging . . . . . . . . . . . . . . . . . . . . . . . . . . . . . . . . . . . . . . . . . . . . . . . . . . . . . . . . . . . 149Event Logging . . . . . . . . . . . . . . . . . . . . . . . . . . . . . . . . . . . . . . . . . . . . . . . . . . . . . . . . . . 150Logging and Recording Capacity . . . . . . . . . . . . . . . . . . . . . . . . . . . . . . . . . . . . . . . . . . 151Logging Configurations for 9500 Revenue Meter Applications . . . . . . . . . . . . . . . . . 152
Alerting . . . . . . . . . . . . . . . . . . . . . . . . . . . . . . . . . . . . . . . . . . . . . . . . . . . . . 153Alerting ACCESS Software via the Alarm Server . . . . . . . . . . . . . . . . . . . . . . . . . . . . 153Alerting via an Alphanumeric Pager . . . . . . . . . . . . . . . . . . . . . . . . . . . . . . . . . . . . . . . 155Alerting via a Numeric Pager . . . . . . . . . . . . . . . . . . . . . . . . . . . . . . . . . . . . . . . . . . . . . 156Alerting via Email . . . . . . . . . . . . . . . . . . . . . . . . . . . . . . . . . . . . . . . . . . . . . . . . . . . . . . . 157
Calculating Power Availability: Number of Nines . . . . . . . . . . . . . . . . . . . . . . 158
Chapter 6 Hardware Reference ...................................................... 159 Standard Model . . . . . . . . . . . . . . . . . . . . . . . . . . . . . . . . . . . . . . . . . . . . . . 160
General Specifications . . . . . . . . . . . . . . . . . . . . . . . . . . . . . . . . . . . . . . . . . . . . . . . . . . . . 161Unit Dimensions . . . . . . . . . . . . . . . . . . . . . . . . . . . . . . . . . . . . . . . . . . . . . . . . . . . . . . . . 162Communications Specifications . . . . . . . . . . . . . . . . . . . . . . . . . . . . . . . . . . . . . . . . . . . 163COM1 Port . . . . . . . . . . . . . . . . . . . . . . . . . . . . . . . . . . . . . . . . . . . . . . . . . . . . . . . . . . . . . 164COM2 Port . . . . . . . . . . . . . . . . . . . . . . . . . . . . . . . . . . . . . . . . . . . . . . . . . . . . . . . . . . . . . 166COM3 Port . . . . . . . . . . . . . . . . . . . . . . . . . . . . . . . . . . . . . . . . . . . . . . . . . . . . . . . . . . . . . 166Ethernet Port . . . . . . . . . . . . . . . . . . . . . . . . . . . . . . . . . . . . . . . . . . . . . . . . . . . . . . . . . . . 167
I/O Specifications . . . . . . . . . . . . . . . . . . . . . . . . . . . . . . . . . . . . . . . . . . . . . 169
Electrical Specifications . . . . . . . . . . . . . . . . . . . . . . . . . . . . . . . . . . . . . . . . . 174
Retrofit Options . . . . . . . . . . . . . . . . . . . . . . . . . . . . . . . . . . . . . . . . . . . . . . . 176Terminal Cover . . . . . . . . . . . . . . . . . . . . . . . . . . . . . . . . . . . . . . . . . . . . . . . . . . . . . . . . . 176Communications Card . . . . . . . . . . . . . . . . . . . . . . . . . . . . . . . . . . . . . . . . . . . . . . . . . . . 177I/O Expansion Card . . . . . . . . . . . . . . . . . . . . . . . . . . . . . . . . . . . . . . . . . . . . . . . . . . . . . . 178
TRAN Model . . . . . . . . . . . . . . . . . . . . . . . . . . . . . . . . . . . . . . . . . . . . . . . . . 180Environmental Conditions . . . . . . . . . . . . . . . . . . . . . . . . . . . . . . . . . . . . . . . . . . . . . . . . 180Unit Dimensions . . . . . . . . . . . . . . . . . . . . . . . . . . . . . . . . . . . . . . . . . . . . . . . . . . . . . . . . 180


1 Introduction
9500™ and 9600™ intelligent metering and control devices provide revenue-accurate, true RMS measurements of voltage, current, power and energy, and are complemented by extensive I/O capabilities, comprehensive logging, and advanced power quality measurement and compliance verification functions. The meters come with an extensive selection of pre-configured data screens and measurements, so you can use the meters “out of the box” or customize them to fit your unique requirements.
9500 and 9600 meters can replace numerous transducers, traditional meters, and control circuits. You can integrate the meters with ACCESS® software or other energy management, SCADA, automation and billing systems, via multiple industry-standard communication channels and protocols.
In This Chapter
9500 and 9600 Meters . . . . . . . . . . . . . . . . . . . . . . . . . . . . . . . . . . . . . . . 12
The ACCESS meter in an Enterprise Energy Management System . . . . . . . . . 14Data Display and Analysis Tools . . . . . . . . . . . . . . . . . . . . . . . . . . . . . . . . . . . . . . . 14Communications Protocols . . . . . . . . . . . . . . . . . . . . . . . . . . . . . . . . . . . . . . . . . . . . . 16Digital and Analog I/O Options . . . . . . . . . . . . . . . . . . . . . . . . . . . . . . . . . . . . . . . . . 16The Meter is Factory-Configured and Ready to Operate . . . . . . . . . . . . . . . . . . . . 17
Firmware Revision History . . . . . . . . . . . . . . . . . . . . . . . . . . . . . . . . . . . . . 18
Using this Guide . . . . . . . . . . . . . . . . . . . . . . . . . . . . . . . . . . . . . . . . . . . . 19Getting More Information . . . . . . . . . . . . . . . . . . . . . . . . . . . . . . . . . . . . . . . . . . . . . 19

9500 and 9600 Meters 9500/9600 User’s Guide
Page 12 Chapter 1 - Introduction
9500 and 9600 Meters
The 9500 and 9600 are intelligent metering and control devices suited to a wide range of applications. The meters can be used as stand-alone devices, but their extensive capabilities are fully realized when used with ACCESS software, as part of an enterprise energy management (EEM) system.
EEM systems give energy suppliers, service providers, and large industrial and commercial energy consumers the tools to meet all the challenges and opportunities of the new energy environment. EEM systems use real-time information and control to directly address a broad range of requirements throughout the power delivery chain and across an entire enterprise. These systems offer an integrated solution to managing new billing structures, distributed generation, energy purchasing, energy cost control, operational efficiency, and power quality and reliability.
ION technology uniquely delivers the benefits of enterprise energy management through an efficient, economical, and scalable architecture using web-enabled software and intelligent metering and control devices. ION systems place intelligence everywhere it’s needed, delivering information and control to everyone that needs it, wherever they are. This gives all parties the necessary information to make the best energy decisions, and the control to act on them. Systems can span widely dispersed geographic locations and multiple points within each site. A single, shared system delivers a broad range of functionality that can satisfy the needs of many different groups within an enterprise, while integrating seamlessly with existing systems.
WinPM.Net™ is a powerful web-ready software suite that can process, analyze, store, and share information from across your entire organization. Its compatibility and flexibility means you can introduce individual components, at a pace you decide, while maintaining your original investments. You can access information and alarms from any workstation, pager, PDA, or cell phone locally or around the world, in the format you require. You can also perform coordinated load and equipment control functions, either manually or automatically. ACCESS software collects data automatically from ACCESS meters and third-party devices, so you can manage a single site or a global network of devices. ACCESS software and hardware products reduce cost of installation and ownership by leverage existing corporate networks and popular networking technologies, including serial, wireless, modem, Ethernet and Internet links.
A wide selection of ACCESS intelligent metering and control devices are available, with choices to meet the specific needs of various key points within an enterprise. Devices offer a range of high accuracy metering, power quality and reliability analysis, data and event logging, alarming, control and communications.
This manual discusses 9500 and 9600 meter default functionality, as well as features and applications. Throughout the manual, the term “meter” refers to both meter models. All differences between the models, such as a feature specific to one model, are indicated with the appropriate model number.
These meters can be used effectively in numerous energy supply-side (utility) and demand-side applications. Some common meter applications are:

9500/9600 User’s Guide 9500 and 9600 Meters
Chapter 1 - Introduction Page 13
Revenue metering
Substation automation
Power quality monitoring (with Flicker)
Commercial/industrial operations metering
Demand and power factor control
SCADA (supervisory control and data acquisition)
Distributed generation (generator) monitoring and control

The ACCESS meter in an Enterprise Energy Management System 9500/9600 User’s Guide
Page 14 Chapter 1 - Introduction
The ACCESS meter in an Enterprise Energy Management System
Applications that include the meter typically require additional equipment. Display and analysis software tools are almost always used to manage, interpret and distribute the data measured or logged by a meter. There are usually a variety of tools used, and often these tools are connected using different communications standards and protocols. In many cases, a meter must also provide control capabilities and device-level data sharing.
The meter can adapt to many situations. Advanced communications allow data to be shared simultaneously across multiple networks, built-in I/O provides monitoring and control capabilities, and a variety of display and analysis tools can be used to monitor your power system.
Data Display and Analysis ToolsNot only does the meter’s front panel allow meter configuration and data display, but the meter also integrates seamlessly with display and analysis software available from Siemens. WinPM.Net software is the network and device configuration software that also lets you analyze and monitor your system and produce reports for any department in an organization. Furthermore, you can use data acquired by the meter in a variety of third-party systems. ACCESS software is designed to make use of all the available advanced capabilities.

9500/9600 User’s Guide Data Display and Analysis Tools
Chapter 1 - Introduction Page 15
The Front PanelLocal monitoring and standalone applications are facilitated by the meter’s front panel interface. The front panel combines real-time display features with limited device configuration functions.
The front panel is often used in combination with an ACCESS software system, providing an interface for field personnel.
WebMeter® Embedded Web Server FeatureAn on-board web server combined with an Ethernet port provides quick and easy access to real-time energy and basic power quality information without special software: this is WebMeter functionality. The built-in web pages display a range of energy and basic power quality information through the web-enabled device; these pages even support basic meter configuration tasks.
MeterM@il® Internal E-Mail Server FeatureConfigure the meter to automatically email high-priority alarm notifications or scheduled system-status update messages to anyone, anywhere within the facility or around the world. Specify the type of event that triggers an email alert, such as power quality disturbances or logged data at any pre-determined interval, and have your ACCESS software administrator program the meter to respond with a MeterM@il message when these events occur. MeterM@il messages can be received like any email message over a workstation, cell phone, pager, or PDA.
XML CompatibilityThe meters can exchange information using industry-standard XML format. This simple machine-readable format supports easy integration with custom reporting, spreadsheet, database, and other applications.
WinPM.Net™ SoftwareThe complete WinPM.Net software package enables the meter to be part of a fully networked information system with other meters and local and wide-area computer networks. WinPM.Net is recommended for all power monitoring systems where advanced analysis and control capabilities are required.
WinPM.Net provides tools for managing your power monitoring network, logging data, analyzing real-time and logged data, generating power system reports, and creating custom functionality at the meter level.
WinPM.Net also offers two ways to remotely view information through a web browser: WebReach and Microsoft Terminal Services.
WebReach only requires an URL to display a meter’s real-time data and select views of historical and waveform data from a web browser; there is no client machine configuration. WebReach is a data display application; there is no control functionality available through it.
Microsoft Terminal Services enable full WinPM.Net functionality, including control features. Some client machine configuration is required.

Communications Protocols 9500/9600 User’s Guide
Page 16 Chapter 1 - Introduction
ION Setup™ SoftwareION Setup is a meter configuration tool designed specifically to configure and test meters. ION Setup offers an intuitive graphical interface for performing basic meter setup, installing templates into meters, viewing real-time and reset accumulated values, verifying meter calibration and measurements, and setting up advanced security.
Communications ProtocolsThe meter can be integrated into various industry-standard networks. Data that is measured by the meter can be made available to other devices using the Modbus Master, Modbus RTU, Modbus TCP, and DNP 3.00 protocols, as well the MV-90 translation system. You can also configure the meter to import data from devices on these networks. With these advanced communications functions, the power of the meter can be utilized in most existing power monitoring systems. Any data display and analysis software that works with Modbus RTU or DNP 3.00 devices will also function with the meter.
The standard meter includes a selectable RS-232/RS-485 port (the factory default is RS-232), a high-speed RS-485 port, and an IrDA optical port for communications in the field. Order options include a 10Base-T Ethernet port or 10Base-FL fiber-optic port, and a 33.6 kbps internal modem (both FCC and CTR-21 compliant). Depending on the hardware options purchased, up to four separate ports can communicate simultaneously.
The communications card is retrofittable – it can be replaced while the meter is in the field.
Digital and Analog I/O OptionsThe meter has digital inputs and outputs that connect to the captured-wire terminals near the base of the unit. Additionally, a LED on the front panel is configured for energy pulsing. An optional analog I/O card can also be ordered with your meter. There are retrofit instructions for this I/O card, if you desire the card on a previously purchased meter.
Digital InputsThe meter contains eight self-excited digital inputs capable of detecting a pulse rate of 20 pulses/second and timestamping transitions with 1ms resolution. They can be used for monitoring external contacts or pulse counting applications. These inputs use a current sensing technique to monitor contact status by providing an internal 30 VDC supply for self-excitation.
Relay OutputsThe meter contains four solid-state Form A outputs and three mechanical Form C relays. The solid-state outputs have a maximum voltage rating of 30 VDC and maximum current rating of 100 mA. The mechanical relays are rated at 250 VAC / 30 VDC and can switch up to 10A loads.

9500/9600 User’s Guide The Meter is Factory-Configured and Ready to Operate
Chapter 1 - Introduction Page 17
Analog Inputs and Analog OutputsThe meter offers an optional Analog I/O expansion card with numerous options:
four 0 to 1 mA analog inputs
four 0 to 20 mA analog inputs
four -1 to 1 mA analog outputs
four 0 to 20 mA analog outputs
four 0 to 20 mA analog inputs & four 0 to 20 mA outputs
four 0 to 1 analog inputs and four -1 to 1 mA analog outputs
NOTE
All options have an additional eight digital inputs on the card.
The Meter is Factory-Configured and Ready to OperateEven though the meter is fully customizable, it is shipped from the factory with many pre-configured functions. Once you have performed the installation and basic setup, all of the basic measurements, energy calculations and recording functions are ready to operate right out of the box. You may find that the factory configuration aptly serves your purposes, allowing you to forego additional configuration.

Firmware Revision History 9500/9600 User’s Guide
Page 18 Chapter 1 - Introduction
Firmware Revision HistoryThe table below lists the features related to a particular firmware release for your meter.
Firmware Version Release Date Firmware Enhancements Template Improvements
v201 Aug. 10, 2000 Initial release of the 9600 meter
v203 Apr. 14, 2000 Implemented the ModemGate protocol
v206 Jan. 12, 2001
Analog I/O WebMeter MeterM@il new and enhanced ION Modules Hardware improvements:
1 Amp current input option,Modicon Modbus TCP communications
Revenue Log Module enhancements Sag/Swell Events on V4 Number of Nines display screen 9 additional DNP Slave modules 4 additional Calibration Pulser modules
v207 Feb. 22, 2001 Trending Display feature New Trend Display Module
v210 May 16, 2001 NICT and TRAN support added
v222 Nov. 28, 2001
Modbus Master capability DNP enhancements Hardware improvements:
Option to order 9500 with 4 MB or 8 MB of Log Memory
The maximum allowable number of the following ION Modules has been increased (see addendum for actual numbers):
Integrator, Data Recorder, Sliding Window Demand, External Boolean, Minimum, Maximum, Display, Set Point
v231 Aug. 6, 2002 Internet Phase 2 Stack replacement Hardware improvements
Log Mail module replaced by the Log Export module New Web Page module

9500/9600 User’s Guide Using this Guide
Chapter 1 - Introduction Page 19
Using this GuideThis User’s Guide is directed at three types of user: the typical user or operator, the system administrator, and the advanced user. You might not fit into any of these groups directly, or perhaps you are both an operator and an administrator. These classifications are intended to make this guide easier to navigate with respect to which information is appropriate to your needs.
Typical User or Operator
Most users simply want to display the data provided by the factory-configured meter. These users want fast access to data through the front panel, ACCESS software, or a third-party protocol such as Modbus or DNP.
System Administrator or Manager
Some users need to make minor adjustments so that their meters “fit” their power systems: data recording intervals, demand sub-intervals and other parameters may need to be set before the meter’s setup is complete. These users will use the front panel, or ACCESS software to change settings in the device’s operating software. (WinPM.Net is highly recommended.)
Advanced User or Systems Integrator
Advanced users may want to make use of the flexibility and power provided by the device’s operating software. These users will need to become familiar with the ION architecture, and the ACCESS software tools used to customize the device’s operation.
Before You Can Use this GuideBy the time you are ready to use this guide, your meter should be installed, basic setup should have been performed, and communications/basic operation should have been verified. If the unit is not yet installed and operational, refer to the Installation & Basic Setup Instructions shipped with the meter.
Getting More InformationAdditional information is available from Siemens. Check our web site at www.sea.siemens.com, contact your local Siemens representative, or contact Siemens directly. Documents that are related to the installation, operation and application of the meter are as follows:
Installation Guide
This brief guide is shipped with each meter. It details the mounting, wiring and basic setup of the device.
ION Programmer’s Reference
This online reference contains detailed descriptions of all modules in an ACCESS meter.

Getting More Information 9500/9600 User’s Guide
Page 20 Chapter 1 - Introduction
WinPM.Net Administrator Guide
This guide explains the installation and configuration of the WinPM.Net software suite.
Online WinPM.Net Help
Each WinPM.Net software component has an in-depth online help system.
Technical Notes
Appendix A contains technical notes that provide details for meter features and custom configurations. These technical notes are also available from our website which is regularly updated with new and revised technical notes.
Application Notes
Online application notes offer detailed, high-level descriptions of real-world situations, where Siemens’s ACCESS devices and ACCESS software provide beneficial solutions.

2 Using The Front Panel
The meter’s front panel is used for both display and configuration purposes. The ¼ VGA display screen and the numerous selection, navigation, and configuration buttons allow quick access to basic meter configuration provided by special setup screens. The front panel also provides access to the settings of many other meter functions. Although you can customize the type of data you want displayed, this cannot be done through the meter’s front panel.
In This Chapter
Displaying Data with the Front Panel . . . . . . . . . . . . . . . . . . . . . . . . . . . . . 22Display Screen Types . . . . . . . . . . . . . . . . . . . . . . . . . . . . . . . . . . . . . . . . . . . . . . . . . 23Default Front Panel Display Screens . . . . . . . . . . . . . . . . . . . . . . . . . . . . . . . . . . . . . 26
Configuring the Meter with the Front Panel . . . . . . . . . . . . . . . . . . . . . . . . 31The Front Panel’s Setup Menu . . . . . . . . . . . . . . . . . . . . . . . . . . . . . . . . . . . . . . . . . . 31Basic Setup Menu . . . . . . . . . . . . . . . . . . . . . . . . . . . . . . . . . . . . . . . . . . . . . . . . . . . . . 33Main Setup Menu . . . . . . . . . . . . . . . . . . . . . . . . . . . . . . . . . . . . . . . . . . . . . . . . . . . . . 34Demand Setup Menu . . . . . . . . . . . . . . . . . . . . . . . . . . . . . . . . . . . . . . . . . . . . . . . . . . 34Network Setup . . . . . . . . . . . . . . . . . . . . . . . . . . . . . . . . . . . . . . . . . . . . . . . . . . . . . . . 36Serial Communications Setup . . . . . . . . . . . . . . . . . . . . . . . . . . . . . . . . . . . . . . . . . . 38PQ (Power Quality) Setup . . . . . . . . . . . . . . . . . . . . . . . . . . . . . . . . . . . . . . . . . . . . . 39Format Setup Menu . . . . . . . . . . . . . . . . . . . . . . . . . . . . . . . . . . . . . . . . . . . . . . . . . . . 40Display Setup Menu . . . . . . . . . . . . . . . . . . . . . . . . . . . . . . . . . . . . . . . . . . . . . . . . . . 41Time Setup Menu . . . . . . . . . . . . . . . . . . . . . . . . . . . . . . . . . . . . . . . . . . . . . . . . . . . . . 41Meter Resets . . . . . . . . . . . . . . . . . . . . . . . . . . . . . . . . . . . . . . . . . . . . . . . . . . . . . . . . . 43Security Setup . . . . . . . . . . . . . . . . . . . . . . . . . . . . . . . . . . . . . . . . . . . . . . . . . . . . . . . . 44
Custom Front Panel Displays . . . . . . . . . . . . . . . . . . . . . . . . . . . . . . . . . . . 46Creating a Front Panel Reset . . . . . . . . . . . . . . . . . . . . . . . . . . . . . . . . . . . . . . . . . . . 46

Displaying Data with the Front Panel 9500/9600 User’s Guide
Page 22 Chapter 2 - Using The Front Panel
Displaying Data with the Front PanelThe front panel ¼ VGA display provides a detailed graphics and text display that has been factory configured to show many of the parameters measured by the meter.
The meter’s display can show numeric data screens, event logs, phasor diagrams, bar graphs, and harmonics histograms.
Using the Front Panel Buttons to Display DataThe front panel has numerous buttons: softkeys, navigation buttons, program buttons. Program buttons are used when configuring the meter (see page 32). Use the following buttons to view data on the front panel display screens.
Navigation Buttons
The horizontal navigation buttons (Left/Right keys) select a different set of five Softkey titles to access different data screens. The vertical navigation buttons(Up/Down keys) are used to navigate within certain data display screens, such as within a Trend Display’s graph and log screens or an Event Log screen, once one has been selected.
Softkeys
A Softkey button selects the data screen available in the corresponding Softkey title when pressed.
ESC
PROG
Status Bar
Softkeys
LEDs
Navigation buttons
Softkey Titles
The arrow indicates that another group of screens is available on the left.
9500/9600 User’s Guide Display Screen Types
Chapter 2 - Using The Front Panel Page 23
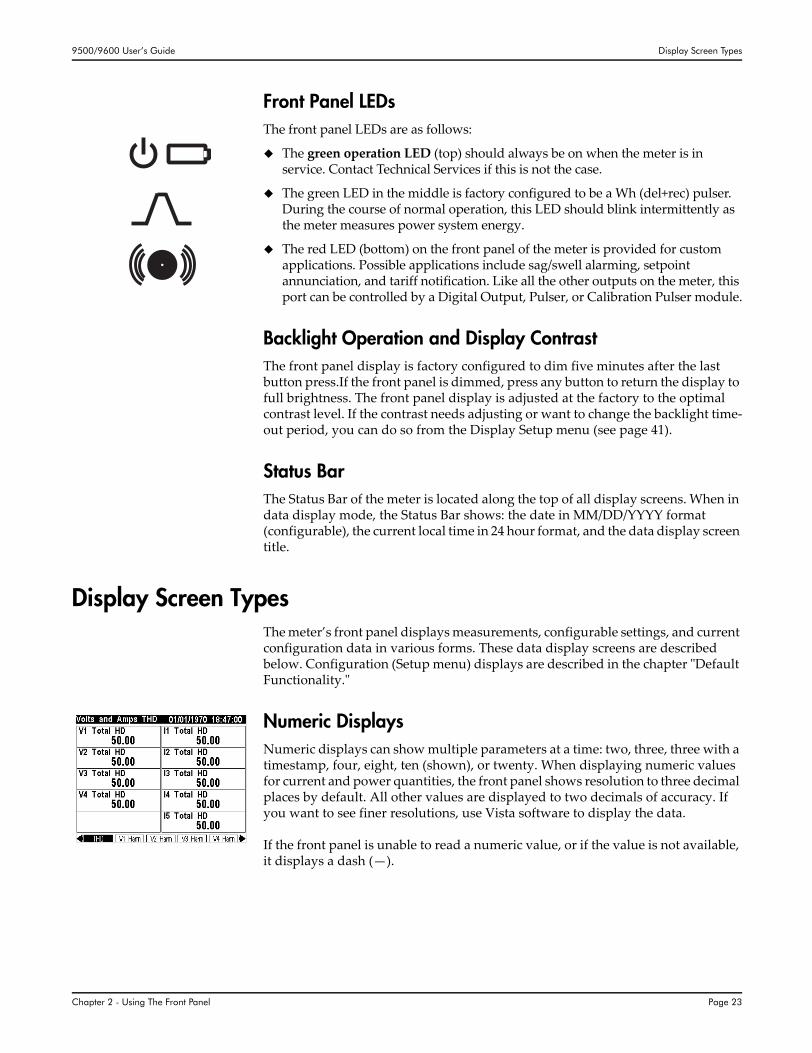
Front Panel LEDsThe front panel LEDs are as follows:
The green operation LED (top) should always be on when the meter is in service. Contact Technical Services if this is not the case.
The green LED in the middle is factory configured to be a Wh (del+rec) pulser. During the course of normal operation, this LED should blink intermittently as the meter measures power system energy.
The red LED (bottom) on the front panel of the meter is provided for custom applications. Possible applications include sag/swell alarming, setpoint annunciation, and tariff notification. Like all the other outputs on the meter, this port can be controlled by a Digital Output, Pulser, or Calibration Pulser module.
Backlight Operation and Display ContrastThe front panel display is factory configured to dim five minutes after the last button press.If the front panel is dimmed, press any button to return the display to full brightness. The front panel display is adjusted at the factory to the optimal contrast level. If the contrast needs adjusting or want to change the backlight time-out period, you can do so from the Display Setup menu (see page 41).
Status BarThe Status Bar of the meter is located along the top of all display screens. When in data display mode, the Status Bar shows: the date in MM/DD/YYYY format (configurable), the current local time in 24 hour format, and the data display screen title.
Display Screen TypesThe meter’s front panel displays measurements, configurable settings, and current configuration data in various forms. These data display screens are described below. Configuration (Setup menu) displays are described in the chapter "Default Functionality."
Numeric DisplaysNumeric displays can show multiple parameters at a time: two, three, three with a timestamp, four, eight, ten (shown), or twenty. When displaying numeric values for current and power quantities, the front panel shows resolution to three decimal places by default. All other values are displayed to two decimals of accuracy. If you want to see finer resolutions, use Vista software to display the data.
If the front panel is unable to read a numeric value, or if the value is not available, it displays a dash (—).

Display Screen Types 9500/9600 User’s Guide
Page 24 Chapter 2 - Using The Front Panel
Automatic Units
The front panel automatically scales the units for basic measurements, such as voltage, current and power parameters. For example, a measurement of 2,000 Watts is displayed as 2.000 kW. A measurement of 2,000,000 Watts is displayed as 2.000 MW. The meter makes these conversions using your PT and CT ratios.
The meter only performs these automatic units if the measurement is derived solely from the Power Meter module’s output.
Phasor Diagram DisplaysPhase information can be displayed in phasor diagram format. Phasor diagrams are accompanied by tables that state the angle and magnitude of each phasor.
In cases where phasors are too small to be represented graphically, they are only shown as table entries.
Event Log DisplaysEvent Log displays alert you to recent events written to the meter’s event log. The vertical (Up/Down) navigation buttons are used to move through the list.
Details on altering the meter’s Event Log characteristics, such as log depth and logging frequency, using Designer can be found in the "Default Functionality" chapter.
Nameplate DisplaysLike Event Log displays, Nameplate displays show information in tabular format. Default nameplates show owner, meter, and power system details.
See the section "Time-Of-Use Configuration" in the Default Meter Functionality chapter for details on configuring the TAG strings.
Histogram DisplaysHarmonics content is displayed in histogram format. Harmonics are displayed from the 2nd to the 63rd harmonic, with Total Harmonic Distortion (THD) values displayed above the histogram (K Factor and Crest Factor only appear in current harmonic histograms).
Use the vertical navigation buttons on the meter front panel to select individual harmonics (from 2nd to 40th) in the histogram and view data specific to each of them (V1, V2, V3, I1, I2, and I3 only).
An arrow appears below the harmonic selected. Harmonic magnitude is displayed as an absolute value and as a percentage of the fundamental. The phase angle of each harmonic is also provided. To return to the THD values, position the arrow below the fundamental.

9500/9600 User’s Guide Display Screen Types
Chapter 2 - Using The Front Panel Page 25
Trend Bar Graph DisplaysBar graph displays can show up to four real-time (numeric) parameters along with their upper and lower extremes.
Each bar graph automatically scales its output based on the magnitude of its extremes. The real-time value of each bar graph is displayed to the right of the graph. Note that scaling is applied separately to each bar graph in the display. Do not compare the magnitudes of two values based on the size of their bars.
In the trend bar graph shown on the left, the present value of Vll ab is 271.93 V. The bar graph also indicates that it has gone as low as 271.40 V and as high as 272.47 V.
Trend DisplaysThe Trend Display screen graphs the historical data of up to four different parameters simultaneously. A movable cursor that consists of the intersection of a vertical line and a horizontal line displays the value and timestamp of any plotted data within a parameter. The cursor displays the values of one parameter at one time only. With the Up and Down navigation keys, the cursor can move from one parameter to another.
In addition, a Trend Display log screen displays data logs for any graphed parameter – up to 3360 logs for each parameter. That is equivalent to 35 days worth of 15 minute data. The graph is updated when a new set of values is recorded. The highest supported update speed is once per second.
The 9500 front panel displays three preconfigured trending screens: V-Trend (voltage), I-Trend (current), and P-Trend (power). The 9600 must be configured using Designer in order to provide Trend Display. Contact Customer Service if you require your 9600 to be configured for Trend Display.

Default Front Panel Display Screens 9500/9600 User’s Guide
Page 26 Chapter 2 - Using The Front Panel
Default Front Panel Display ScreensThe meter is factory configured to display a number of data screens on its front panel:
42 display screens for the 9500
48 display screens for the 9600
Each of these screens is accessible with a corresponding Softkey. See the “Button Functions” section for instructions on using the front panel buttons for data display.
NOTE
Each display screen is listed with the corresponding softkey name and the screen title.
Screens Shown in Display CycleTen data display screens are included in the automatic display cycle. By default, the front panel scrolls repeatedly through the following screens in the order presented.
For details on screen type (e.g. three parameter, vector diagram, etc.) refer to the technical note Custom Front Panel Displays.
1. V,I,PF (Volts, Amps, PF)
This numeric display screen contains the average line-to-line voltage, average current, and the total signed power factor.
2. Volts (Volts)
This numeric display screen shows the line-to-line voltages Vll ab, Vll bc, and Vll ca.
3. Amps (Amps)
This is a numeric screen containing currents I a, I b, and I c.
4. Power (Total Power)
This numeric display screen contains total kW, kVAR, and kVA values.
5. Energy1 (Energy Delivered)
This numeric display screen shows delivered (imported) energy values for kWh, kVARh, and kVAh.
6. Demand1 (Demand Delivered)
This numeric display screen contains delivered values (kW, kVAR, and kVA) in the previous demand period. By default, these values come from a sliding window demand (rolling block) calculation.

9500/9600 User’s Guide Default Front Panel Display Screens
Chapter 2 - Using The Front Panel Page 27
7. Pk Dmd1 (Peak Demand Del)
This is a numeric display screen with timestamps that contains maximum delivered demand values for kW, kVAR, and kVA. The timestamps show the date and time at which the values were last updated. By default, these values come from a sliding window demand calculation.
8, 9, 10. V Bar, I Bar, P Bar (Voltage, Current, and Power Bar Graphs)
These three screens are trend bar graph displays. They show real time values for voltage (Vll ab, Vll bc, Vll ca, Vll avg), current (I a, I b, I c, I avg) andpower (kW tot, kVAR tot, kVA tot, PF lag tot). The bar graphs also indicate the maximums and minimums recorded for these values.
Additional Data Display ScreensMost of the default data screens are not included in the default scrolling cycle. To view the other display screens, you must find the group of five Softkey titles that contains the data screen you want, and then press the corresponding Softkey.
NOTE
The numbers on the left correspond to the Display module’s Softkey number in the 9600 meter’s displayframework. The Softkey numbering for an 9500 differs slightly due to V trend, I trend, and P trend takingthe place of Softkeys 13, 14, and 15 respectively. The 9500 does not support display screens forEN50160 data and statistics.
11. Summary1 (Volts/Amps Summary)
This numeric display provides many important voltage, current, phase, and frequency measurements on a single screen.
12. Summary2 (Power Summary)
This numeric display provides real, reactive, and apparent power measurements for phase a, b and c (as well as their total). Signed Power Factor measurements are also provided on this screen.
13. D Inputs (Digital Inputs)
This numeric display screen shows the status of the eight on-board digital inputs. The present state of all inputs is shown (as Off or On) and the number (Cnt) of state changes since the last reset is recorded.
14. DI - I/O (DI on I/O Card)
This numeric display screen contains the status and counters for the digital inputs on the I/O card.
15. D Outputs (Digital Outputs)
This numeric display screen contains the mode and status for the relay and solid state outputs.
16. Anlg - I/O (Analog In and Out)
This numeric display screen contains scaled analog inputs (AIn scaled) and normalized analog outputs (AOn normalized), where n ranges from 1 to 4 for both inputs and outputs.

Default Front Panel Display Screens 9500/9600 User’s Guide
Page 28 Chapter 2 - Using The Front Panel
17. Phasors (Phasors)
This screen is a phasor diagram display that shows the magnitude and the relative angular difference between all phase voltage (V a, V b, V c, V 4) and current (I a, I b, I c, I 4, I 5) fundamental components.
18. Name Plt (Name Plate Info)
The Name Plate Info screen contains the following information: Owner, TAG 1 and TAG 2 from the Factory module, firmware revision of the ACCESS meter, and a battery life indicator. TAG 1 and TAG 2 typically identify the meter’s user and installed location. The Owner and TAG registers are configurable with the Designer software.
19. Events (Event Log)
The Event Log display alerts you to events written to the meter’s event log. DATE, TIME, SOURCE, and EVENT information are provided. The up and down Navigation buttons allow you to move through the list.
20. Setpoint (Setpoint Status)
This numeric display screen displays the status of the setpoint parameters defined in the Vista Setpoints diagram.
21. Energy2 (Energy Received)
This numeric display screen shows received (exported) energy values for kWh, kVARh, and kVAh.
22. Demand2 (Demand Received)
This numeric display screen shows received power quantities (kW, kVAR, and kVA) in the present demand period. By default, these values are from a sliding window demand (rolling block) calculation.
23. Pk Dmd2 (Peak Demand Rec)
This is a numeric display screen with timestamps. It shows the maximum received demand quantities (kW, kVAR, and kVA) and the time at which they were recorded. By default, these values are from a sliding window demand (rolling block) calculation.
24. THD (Volts and Amps THD)
This numeric display screen contains the total harmonic distortion on all phase voltage and current inputs.
25, 26, 27, 28. V1 Harm, V2 Harm, V3 Harm, V4 Harm (Harmonics)
These four histogram display screens show the harmonic content on the phase voltage inputs.
29, 30, 31, 32, 33. I1 Harm, I2 Harm, I3 Harm, I4 Harm, I5 Harm (Harmonics)
These five histogram display screens show the harmonic content on the phase current inputs.
34. TOU (Active Rate / Season)
This eight parameter display screen shows kWh delivered values for each all four of the possible time of use (TOU) rates (rates A, B, C, and D).

9500/9600 User’s Guide Default Front Panel Display Screens
Chapter 2 - Using The Front Panel Page 29
35. TOU Egy (TOU Energy Del)
This numeric display screen shows the energy (in kWh) delivered for each time of use (TOU) rate (rates A, B, C, and D).
36, 37. TOU Dmd1 & TOU Dmd2 (TOU Peak Demand 1 and 2)
These two screens are numeric displays with timestamps. Together they show the maximum delivered kilowatts for each time of use (TOU) rate (rates A, B, C, and D). The timestamps show the date and time at which the values were last updated. By default, these values come from a sliding window demand (rolling block) calculation.
NOTE
The four TOU screens may only be important if you are using the meter in a billing application (i.e. youare a power provider). Typically, power consumers ignore the Time-Of-Use front panel displays.
EN50160 Data and Statistics Displays (9600 only)The remaining front panel screens display data to help you determine EN50160 voltage compliance. Unless compliance to this standard is of concern, you may ignore these displays. More details about EN50160 are provided in the technical note Power Quality: ACCESS Meters and EN50160.
38. PQ Freq (PQ Power Frequency)
This numeric display shows the following EN50160 Power Frequency data: Nominal Frequency, period (10 second) Freq mean, minimum, and maximum. It also shows the EN50160 frequency compliance statistics: Freq N (the number of valid evaluation periods), Freq N1 (a count of non-compliance), and Freq N2 (the number of invalid evaluation periods).
39. PQ Vmag1 (PQ Supply Voltage 1)
This bar graph display shows the following EN50160 Voltage Magnitude data for all three voltage phases: period (10 minute) mean, minimum, and maximum.
40. PQ Vmag2 (PQ Supply Voltage 2)
This numeric display shows the following EN50160 Voltage Magnitude compliance statistics for all three voltage phases: mag N and mag N1.
41. PQ Flk1 (PQ Flicker 1)
This bar graph display shows the following EN50160 Flicker data for all three voltage phases: present Pst, minimum Pst, and maximum Pst.
42. PQ Flk2 (PQ Flicker 2)
This numeric display shows the following EN50160 Flicker data for all three voltage phases: present Pst, present Plt, and compliance statistics (Flck N and Flck N1).
43. PQ Vdist (PQ Volt Disturbance)
This numeric display shows the following EN50160 Overvoltage and Dip data for all three voltage phases: expected nominal, minimum Dip, and maximum Overvoltage.

Default Front Panel Display Screens 9500/9600 User’s Guide
Page 30 Chapter 2 - Using The Front Panel
44. PQ Vunb (PQ Volt Unbalance)
This numeric display contains the following EN50160 Voltage Unbalance data: V unbal mean, V unbal mean min, V unbal mean max, and compliance indicators (unbal N and unbal N1).
45. PQ Vhrm1 (PQ Volt Harmonics 1)
This bar graph display shows the following EN50160 Harmonics data: THD mean, THD mean mn, THD mean max for all three voltage phases (10-minute mean values, min and max values are updated every new observation period).
46. PQ Vhrm2 (PQ Volt Harmonics 2)
This numeric display shows EN50160 Harmonics compliance statistics for all three voltage phases: Hrm N, Hrm N1, Hrm N2.
47. Avblty (Power Availability)
This numeric display provides the following measurements: availability (with up-time in parts per million), number of nines, and evaluation time (in days).
48. Pr - Avblty (Previous Availability)
This three parameter display with timestamp indicates the number of availability resets (including the most recent event’s timestamp), the previous availability (with its timestamp), and the previous number of nines (with its timestamp).
Trending Display Screens in the 9500The 9500 meter supports trending display in its framework. Each trending display has two views - graph and log - which are accessible via softkey once you are displaying the trend screen. As previously mentioned, the softkey numbering for an 9500 meter’s display screens must be adjusted from the numbering presented for the 9600
V Trend (Voltage Trend Display)
The voltage trend display graphs the VII avg trend. This display is Softkey 13.
I Trend (Current Trend Display)
The current trend display graphs the I avg trend. This display is accessed with Softkey 14.
P Trend (Power Trend Display)
The power trend display graphs the KW tot trend. This display is accessed with Softkey 15.
9500/9600 User’s Guide Configuring the Meter with the Front Panel
Chapter 2 - Using The Front Panel Page 31
Configuring the Meter with the Front PanelThe front panel allows you to setup and configure the meter at its installed location. When you change a setting in the front panel’s Setup menu, you are actually altering the setup register value of an ION module. (ION module links cannot be added or deleted using the front panel.) The front panel’s Setup menu also provides you with quick access to parameter resets for common cumulative parameters.
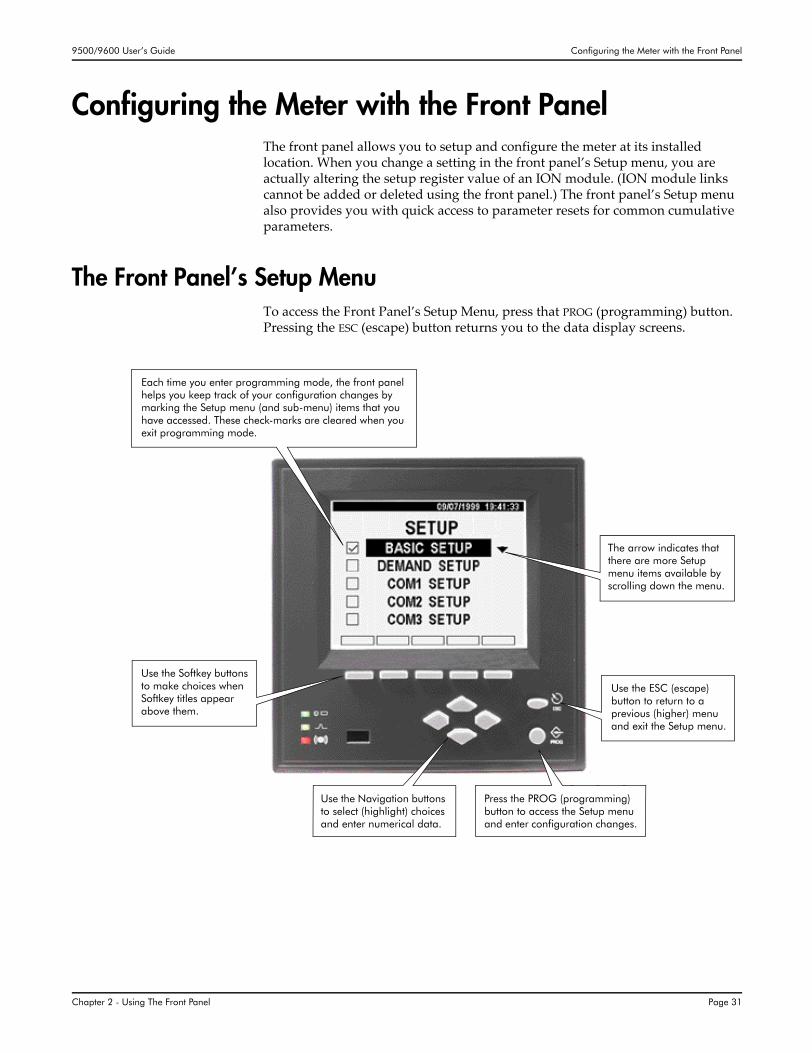
The Front Panel’s Setup MenuTo access the Front Panel’s Setup Menu, press that PROG (programming) button. Pressing the ESC (escape) button returns you to the data display screens.
Use the Navigation buttons to select (highlight) choices and enter numerical data.
The arrow indicates that there are more Setup menu items available by scrolling down the menu.
Use the Softkey buttons to make choices when Softkey titles appear above them.
Each time you enter programming mode, the front panel helps you keep track of your configuration changes by marking the Setup menu (and sub-menu) items that you have accessed. These check-marks are cleared when you exit programming mode.
Press the PROG (programming) button to access the Setup menu and enter configuration changes.
Use the ESC (escape) button to return to a previous (higher) menu and exit the Setup menu.

The Front Panel’s Setup Menu 9500/9600 User’s Guide
Page 32 Chapter 2 - Using The Front Panel
Using the Front Panel Buttons for ConfigurationUse the front panel buttons as follows to adjust the settings:
PROG
Press the PROG (programming) button to access the Setup Menu. Once in programming mode, the PROG button functions just like an Enter key on a computer keyboard. Press the PROG button to select a highlighted item or accept changes, passwords, and trigger resets.
ESC
Press the ESC (escape) button to return to a higher menu or abort a configuration change.
Navigation
Highlight menu items with the vertical (Up/Down) buttons.
Entering numbers: when a digit is highlighted, pressing the Up button increments the number by one, and pressing the Down button decreases it. Move the cursor to an adjacent digit with the horizontal (Left/Right) buttons.
Softkeys
Press a Softkey button when Softkey options become available (when titles appear in the Softkey title bar). Use Softkeys to select the parameters that you want to configure from the various sub-menus.
PasswordsAll configuration functions in the front panel are password protected. The password is set to 0 (zero) in the factory. This password allows you to access the Security setup menu and to disable or change the password for a custom value. The front panel only prompts you for the meter password before you make your first configuration change.
Setup Mode TimeoutOnce the meter has been configured, the front panel automatically exits the Setup menu five minutes after the last button press is detected. If the front panel returns to data display mode, you must re-enter the Setup menu and provide the valid meter password to resume making configuration changes.
Confirming Configuration ChangesThe CONFIRM screen appears whenever you attempt to change the meter’s settings through the front panel. This allows you to abort an unwanted configuration change. The front panel also informs you when an entry is out of range. In either case, you must press the PROG button to return to the setup screen.
WRITING ERROR Screen
If the CONFIRM screen does not appear for a valid entry, or the display reports a WRITING ERROR, repeat the configuration change. If the problem persists, contact Technical Services.
PROG
ESC
ESC TO CANCEL
PROG TO CONFIRM
CONFIRM

9500/9600 User’s Guide Basic Setup Menu
Chapter 2 - Using The Front Panel Page 33
Basic Setup MenuThe Basic Setup menu contains values that typically do not need to be reconfigured once the meter is put into service. The Basic Setup menu item provides access to the following power monitoring system settings:
1 Polarities can be normal or inverted.2 Applicable to meters ordered with the current probe input option.
All Basic Setup menu items are setup registers in the Power Meter module. See the online ION Programmer’s Reference for details.
The Current Probe phase calibration registers are setup registers in the Factory module that can be configured in a Telnet or HyperTerminal session. Up to three separate groups of registers (Factory Default, User Defined 1, and User Defined 2) can be set up for three different Current Probes. In the Basic Setup menu, the Probe Type register is used to activate one of those register groups. Only the selected group is used in the meter’s calculations.
Sub-Menu Register Default Description
PT/CT Setup
Volts Mode 4 Wire Wye The power system’s configuration
PT Primary 120 The Potential Transformer’s primary winding voltage rating for VA, VB, and VC
PT Secondary 120 The Potential Transformer’s secondary winding voltage rating for VA, VB, and VC
CT Primary 5 The Current Transformer’s primary winding current rating for IA, IB, and IC
CT Secondary 5 The Current Transformer’s secondary winding current rating for IA, IB, and IC
V4 SetupV4 Primary 120 The potential transformer’s primary winding rating on input V4
V4 Secondary 120 The potential transformer’s secondary winding rating on input V4
I4/I5 Setup
I4 Primary 5 The current transformer’s primary winding rating on input I4
I4 Secondary 5 The current transformer’s secondary winding rating on input I4
I5 Primary 5 The current transformer’s primary winding rating on input I5
I5 Secondary 5 The current transformer’s secondary winding rating on input I5
V Polarity1
VA Polarity Normal The polarity of the potential transformer on VA
VB Polarity Normal The polarity of the potential transformer on VB
VC Polarity Normal The polarity of the potential transformer on VC
V4 Polarity Normal The polarity of the potential transformer on V4
I Polarity1
IA Polarity Normal The polarity of the current transformer on IA
IB Polarity Normal The polarity of the current transformer on IB
IC Polarity Normal The polarity of the current transformer on IC
I4 Polarity Normal The polarity of the current transformer on I4
I5 Polarity Normal The polarity of the current transformer on I5
Current Probe2 Probe Type Factory Default Current Probe Input setting – selects phase angle correction method for I1, I2, I3

Main Setup Menu 9500/9600 User’s Guide
Page 34 Chapter 2 - Using The Front Panel
Main Setup MenuPress the PROG button to enter the main setup menu. The following table summarizes the front panel’s Setup menu functions:
Highlight the Setup menu item that you want to access with the vertical navigation buttons. To select the item, press the PROG button. The content of each Setup menu item is described on the following pages.
Demand Setup MenuDemand Setup provides access to all of the factory-configured parameters for sliding window demand (rolling block) and thermal demand.
The ION module setup register corresponding to each Demand Setup value is included for advanced users; these are found in the description for each Demand Setup value. Refer to the online ION Programmer’s Reference for complete details about Sliding Window Demand modules and Thermal Demand modules.
Sliding Window Demand (Rolling Block) SettingsThe Sliding Window sub-menu contains the following settings:
Sub Interval
This numeric value specifies the number of seconds in the sliding window demand sub-interval. Setting the SUB INTERVAL value changes the Sub Intvl setup register in all factory-configured Sliding Window Demand modules.
Setup Menu Item Description
Basic Setup Changes basic settings in the power measurement system configuration
Demand Setup Sliding Window (Rolling Block) and Thermal Demand settings
COM1 Setup RS-232 or RS-485 port setup
COM2 Setup High-speed RS-485 port setup
COM3 Setup Optical port (infrared) and optional internal modem setup
Network Setup Ethernet Network addressing
PQ Setup Sets the criteria (including nominal voltage) for disturbance detection
Format Setup Customizes the style and values appearing on the display screens
Display Setup Customizes display appearance and update rate
Time Setup Clock and meter time settings
Security Setup Modify and enable/disable password functions
Meter Resets Reset functions for factory and user determined cumulative parameters

9500/9600 User’s Guide Demand Setup Menu
Chapter 2 - Using The Front Panel Page 35
#Sub Intervals
This numeric value specifies the number of sub-intervals in the sliding window. Setting the #SUB INTERVALS value changes the #Subintvls setup register in all of the factory-configured Sliding Window Demand modules.
Predicted Response
This numeric value specifies the speed of the predicted demand output. It allows you to set the sensitivity of the demand prediction. Typically, this value does not need to be changed.
Specify 99 for the fastest prediction speed. The slowest prediction speed (0) causes the predicted demand output to follow the sliding window demand output. Setting the PRED RESPONSE value changes the Pred Resp setup register in all factory-configured Sliding Window Demand modules.
Thermal Demand SettingsThe Thermal sub-menu contains the following settings:
Interval
This value specifies the number of seconds in the thermal demand interval. Setting the INTERVAL value changes the Interval setup register in all factory-configured Thermal Demand modules.
Time Constant
This value is a time constant that specifies the rate at which the thermal demand output responds to changes in the source input. Typically, this value does not need to be changed.
The higher you set the time constant value, the faster the response time will be. Values commonly used are 63 and 90. Setting the TIME CONSTANT value changes the Time Const setup register in all factory-configured Thermal Demand modules.
Demand OptionsThe Demand Options sub-menu contains the following setting:
Demand Lockout (days)
This value sets the minimum time allowed between consecutive demand resets from the front panel only; any attempts to reset the demand outside the bounds of the register will be ignored.
The default value for the Demand Lockout time is 25 days. The corresponding setup register, labeled Demand Lockout Time, is found in the Display Options module. This setting does not apply to demand resets initiated from software communications connections.

Network Setup 9500/9600 User’s Guide
Page 36 Chapter 2 - Using The Front Panel
Network SetupThis menu item allows you to configure the Ethernet communications channel. The following settings can be configured in this option:
Network settings can be configured automatically with BootP or manually through the front panel. (You can also configure network settings via Designer or ION Setup software — see “Using ACCESS Software” on page 87 of this manual for more information.)
Configuring Network Settings with BootP
The BootP network setting is enabled by default. When a BootP server is set up with the correct information, the network settings (IP Address, Subnet Mask, Gateway, and SMTP Mail Server IP Address) automatically configure.
Ask your Network Administrator whether a BootP server has been set up on your network. If it has, and your Network Administrator has allocated the required network settings on the BootP server, then all of the network settings (that your facility requires) automatically appear on the Network Setup screen.
Setting Description Default
IP BootP Option
A BootP server automatically sets the IP Address, Subnet Mask, Gateway, and SMTP Mail Server IP Address– see your Network Administrator to determine if BootP is usedIf the IP BootP Option is set to BootP mode, then no network settings can be changed
BootP(Only meter’s ordered with the Ethernet option are set to BootP by default; the default is otherwise set to Manual.)
IP Address Sets the IP Address for the meter
If a BootP server has been correctly set up, the IP Address number appears.If no BootP server has been set up (e.g. you wish to configure settings through the front panel) then the default is None.
Subnet MaskUsed if subnetting applies to your network– see your Network Administrator to determine if Subnet Mask is used
If a BootP server has been correctly set up, and Subnet Mask is used, then the Subnet Mask address number appears. If Subnet Mask is not used, then the default is None.If no BootP server has been set up (e.g. you wish to configure through the front panel) then the default is None.
Gateway Used in multiple network configurations– see your Network Administrator to determine if Gateway is used
If a BootP server has been correctly set up, and Gateway is used, then the Gateway address number appears. If Gateway is not used, then the default is None.If no BootP server has been set up (e.g. you wish to configure through the front panel) then the default is None.
SMTP Address
Sets the IP Address for the SMTP Mail Server that is configured to forward mail from the meter to the final destination – see your Network Administrator to determine if the SMTP Mail Server is used
If a BootP server has been correctly set up, and an SMTP Address is used, then the SMTP Address address number appears. If an SMTP Address is not used, then the default is None.If no BootP server has been set up (e.g. you wish to configure through the front panel) then the default is None.

9500/9600 User’s Guide Network Setup
Chapter 2 - Using The Front Panel Page 37
Configuring Network Settings Through the Front Panel
To configure network settings through the meter’s front panel, you must change IP Boot Option from (the default) BootP to Manual.
Typically, your Network Administrator will provide you with the appropriate IP Address for the meter. The Subnet Mask and Gateway settings are only required if you have communications between multiple Ethernet networks and if subnetting is implemented.
CAUTION
Configuring the IP Address, Subnet Mask, and Gateway registers incorrectly can cause networkdisruptions. See your network administrator for more information.
Use the four Navigation buttons to edit the values of the network settings so that they match your system addresses.
As you configure the network addresses, the front panel automatically hides unnecessary leading zeroes from each three-digit grouping. The hidden leading zeroes appear (and disappear again) as you move the position of cursor across the network address.
In the example above, the highlighted zero is hidden as soon as you change the position of the cursor.
89.123.40. 560

Serial Communications Setup 9500/9600 User’s Guide
Page 38 Chapter 2 - Using The Front Panel
Serial Communications SetupThe current configuration of COM1 (RS-232 or RS-485), COM2 (RS-485), and COM3 (optical port or internal modem) are found in the COM Setup menu items. Ethernet settings are located under Network Setup. Depending on communications ports ordered with your meter, the parameters that you can setup for COM1, COM2, and COM3 are as follows:
1 Connect to IP service port 7701 for Modbus RTU communications over Ethernet. The Modbus Unit ID of the meter over Ethernet is 100.
2 See the technical note Time Synchronization and Timekeeping for details about GPS.3 IEC870-102, EtherGate and ModemGate are only available on COM1 and COM2.4 This setting only applies if you have ordered the internal modem option (see below).5 The factory set Unit ID for COM1 is based on the serial number of the meter, using the last four
numbers before the dash. For example, if the serial number is PA-0009B263-01, the Unit ID is set in the factory to 9263. After a factory reset, the unit ID number will default to 100.
NOTE
The Factory Protocol is reserved for the use by Siemens Customer Service. Contact Customer Service ifyou require more information.
Internal Modem SetupIf you have the internal modem order option, you disable the IrDA optical port on COM3 by selecting MODEM for the Mode setting. The modem is factory configured to answer in the number of rings specified by Answer HR Rings (the Non-Answer HR Rings value is ignored by default).
A list of compatible AT commands is provided on the website and the technical note Modem AT Commands for ACCESS Meters. Visit the web site for the latest modem configuration files.
COM Port Setting Options Default
Protocol ION, Modbus RTU1, Modbus Master, DNP 3.00, GPS Arbiter2, GPS:Arbiter-Vorne2,
GPS:TrueTime/Datum2, Factory, IEC870-1023, EtherGate3, and ModemGate3.all ports: ION
Baud Rate 300, 1200, 2400, 4800, 9600, 19200, 38400, 57600, and 115200 bps 9600 bps
Tran Delay Transmit delay - the bounds are 0.0 to 1.0 s. 0.01s (10ms)
Unit ID Sets the meter’s Unit ID;a unique Unit ID is required for each device on a serial network.
COM1: Unit ID is based on the serial number.5
COM2: 101COM3: 102
Mode(COM1 and COM3)
The communications mode selectedCOM1:RS-232 or RS-485COM3: IrDA or Modem (internal)
COM1: RS-232COM3: Modem
Flow Control(COM1 only)
‘RTS/CTS’ or ‘RTS with Delay’ ‘RTS with Delay’
Modem4
(COM3 only)
Answer HR Rings– The number of rings during defined answer hours. Valid entries for this register are 0-255 rings; an entry of 0 rings will disable answering 1
Non-Answer HR Rings– The number of rings during defined non-answer hours. 5

9500/9600 User’s Guide PQ (Power Quality) Setup
Chapter 2 - Using The Front Panel Page 39
PQ (Power Quality) SetupThe PQ Setup screen contains the following settings for the detection voltage sags and swells (i.e. ITI (CBEMA) Type 2 and Type 3 disturbances). The ION module setup register corresponding to each Sag/Swell Setup value is included for advanced users. Refer to the online ION Programmer’s Reference for complete details about the Sag/Swell module.
Sag Limit
This item specifies the magnitude below which a power system input must fall for a sag to be recorded. This value must be expressed as a percentage of the nominal voltage (entered below in the NOMINAL VOLTAGE item). Setting the SAG LIMIT value changes the Sag Lim setup register in the factory-configured Sag/Swell module.
Swell Limit
This item specifies the magnitude above which a power system input must rise for a swell to be recorded. This value must be expressed as a percentage of the nominal voltage (entered below in the NOMINAL VOLTAGE item). Setting the SWELL LIMIT value changes the Swell Lim setup register in the factory-configured Sag/Swell module.
Change Criteria
You do not need to change this value for normal operation. This setting specifies the amount by which an input must change (either rise or fall) during a disturbance to be considered a new sub-disturbance. This value must be expressed as a percentage of the nominal voltage (entered below in the NOMINAL VOLTAGE item).
For example, if your Nominal Voltage is 120 V and your Change Criteria is 10%, any voltage change of 12 V or more during a disturbance will cause a new sub-disturbance to be recorded. Setting the CHANGE CRITERIA value changes the ChangeCrit setup register in the factory-configured Sag/Swell module.
Nominal Voltage
This item specifies the nominal voltage of the power system you are monitoring. By default, this value is set to 0 V. You should ensure that this item matches your power system’s nominal voltage (i.e. 120, 277, or 347). All Sag/Swell functions are disabled when the nominal voltage setting is 0 (zero). Setting the NOMINAL VOLTAGE value changes the Nom Volts setup register in the factory-configured Sag/Swell module.
CAUTION
For the 9600 only, the value you enter will also be used by the Transient module and in all EN50160compliance calculations. Therefore, all EN50160 and Transient functions are disabled when the NOMINAL
VOLTAGE setting is 0 (zero). You should ensure that this item matches your power system’s nominal voltage(i.e. 120, 277, or 347).

Format Setup Menu 9500/9600 User’s Guide
Page 40 Chapter 2 - Using The Front Panel
Event Priority
You do not need to change this value for normal operation. This setting allows you to assign a priority level to the Sag/Swell module events (from 0 to 255, 255 being the highest priority). Setting the EVENT PRIORITY value changes the EvPriority setup register in the factory-configured Sag/Swell module.
Format Setup MenuFormat Setup contains values that allow you to set labeling and formatting preferences for the front panel display.
Numeric FormatThe Numeric Format sub-menu contains the following settings:
Digit Group
This specifies the symbols used to delimit thousands and the decimal place holder (i.e. 1000.0 or 1,000.0 or 1 000,0). The default is 1000.0 (no commas, no spaces).
Volts Decimal
You can display voltage measurements to one, two, or three decimal places. The default value is two decimal places.
Current Decimal
You can display current measurements to one, two, or three decimal places. The default value is three decimal places.
Power Decimal
You can display power measurements to one, two, or three decimal places. The default value is three decimal places.
General FormatThe General Format sub-menu contains the following settings:
Phase Label
You can apply phase labels in any of the following six variations: ABC, RST, XYZ, RYB, RWB, and 123. The default label is ABC.
PF Symbol
You can choose Power Factor symbols to be: LD/LG (lead/lag), +/– (positive/negative), or CAP/IND (capacitive/indicitive). The default symbols are LD/LG.
Date Format
You can have the front panel express the date in any of these formats: MM/DD/YYYY, DD/MM/YYYY, and YYYY/MM/DD. The default is MM/DD/YYYY.
Show DST
You can choose whether or not to display Daylight Savings Time (DST) on the front panel. The default is Display DST.

9500/9600 User’s Guide Display Setup Menu
Chapter 2 - Using The Front Panel Page 41
Display Setup MenuYou can configure the following display preferences within Display Setup.
Update Rate
You can set the front panel to update its data from every one to every six seconds. The default update time is one second.
Contrast
You can set the front panel display contrast level from level zero to level nine where higher numbers represent a sharper level of contrast.
NOTE
Press and hold both the "Up" navigation button and the PROG button at the same time. The contrast levelwill cycle through its range (0 to 9). Release the buttons at the contrast level you desire.
Backlight Timeout
This selection allows you to make the backlight dim automatically after zero to 7200 seconds (two hours). The default is 300 seconds (five minutes). If this value is set to 0 (zero), the backlight will always be at full brightness. Leaving the backlight at full brightness will reduce the back light’s life expectancy.
Time Setup MenuThe Time Setup menu provides access to various time-related parameters in the meter, such as the synchronization sources and channels used, and the time offsets applicable to your location.
Clock SetupThe Clock Setup sub-menu contains settings for the meter’s time keeping and time synchronization methods. Changing the settings under Clock Setup alters the setup register values of the Clock module — the module that provides timestamps for the data logged by the meter. Refer to the online ION Programmer’s Reference for more information about the Clock module.
TZ Offset (hh:mm)
Set this value to the time zone of the meter’s location, relative to Coordinated Universal Time (UTC). For example, an entry of -08:00 is the correct offset for Pacific Time in the USA, Canada, and Tijuana. Specify a positive (+) or negative (–) offset with the Navigation buttons. The value must be non-zero before you can change its sign.

Time Setup Menu 9500/9600 User’s Guide
Page 42 Chapter 2 - Using The Front Panel
DST Offset (hh:mm)
This setting determines the daylight savings time offset applicable to your location. The DST offset is the amount of time that the clock is moved when Daylight Savings time begins or ends. For example, an entry of +01:00 sets a daylight savings time offset of one hour. Setting DST offset to 0 (zero) disables daylight savings entirely. Specify a positive (+) or negative (–) offset with the Navigation buttons. The value must be non-zero before you can change its sign.
NOTE
The Clock Module’s DST Start and DST Stop setup registers control the start and end times for DaylightSavings for up to twenty consecutive years. These registers are already configured in the factory. Tochange them, you must use Designer.
Sync Type
This setting specifies whether time synchronization signals are received in UTC (Coordinated Universal Time) or Local Time. The default is set to UTC for WinPM.Net. Some DNP masters use Local Time.
Sync Source
This setting determines the port responsible for receiving the time synchronization signals. Only signals received on the selected port are used to synchronize the meter’s internal clock; time synchronization signals on all other ports are ignored. The choices are ETHERNET, COM1, COM2, and COM3. The default is COM1. Refer to the Time Synchronization and Timekeeping technical note for more details on synchronization sources.
Clock Source
This item determines the time synchronization source. The meter clock can be synchronized externally from the line frequency (Line Freq), or from an internal crystal (Internal), or through a communications port (COMM). The default is Line Freq. If you are using GPS time synchronization, change this setting to COMM.
Set Meter TimeThe Set Meter Time sub-menu contains settings for the date and time displayed on the front panel. The Meter Time settings are dependent upon the configuration of the Clock Setup menu–-you must set the time zone offset (TZ Offset) prior to setting the Local Date and Time.
Local Date
Use this item to set the meter’s display to the current date. The format of the date is defined in the General Format Setup menu.
Local Time
Use this item to set the meter’s display to local time.

9500/9600 User’s Guide Meter Resets
Chapter 2 - Using The Front Panel Page 43
Meter ResetsThe Meter Resets menu item allows you to clear the cumulative parameters stored by the meter. You are required to enter a valid meter password before executing any meter resets.
Factory ResetsThis sub-menu contains the following default resets:
peak dmd rset
The Peak Demand Reset allows you to clear the peak demand values logged in the meter. When the meter is in test mode, the Demand Reset object clears the Revenue Test Mode demand parameters.
NOTE
See “Revenue Measurements” on page 97 for more information about TEST mode.
By default, there is a 25 day Demand Lockout Time. This is the minimum time allowed between consecutive demand resets. Any attempts to perform a demand reset before the lockout time has expired will be ignored. See “Demand Setup Menu” on page 34 for details about reconfiguring the default Demand Lockout.
MNMX RSET
The Minimum/Maximum Reset allows you to clear all accumulated minimum and maximum values stored in the meter.
HARM MNMX RSET
The Harmonics Minimum/Maximum Reset allows you to clear all accumulated minimum and maximum harmonics values stored in the meter.
MASTER RESET
The Master Reset control allows you to clear all the cumulative and derived quantities from the meter (including demand, peak demand, energy, revenue, and test mode parameters), clear the meter’s event and waveform logs, and reset the meter’s Data Recorder modules.
CAUTION
The Master Reset operation will clear all billable quantities from the meter, all logged data from themeter’s event and waveform logs, and all data recorders. Carefully consider the implications ofperforming a Master Reset before proceeding.
DI COUNT RESET
The DI Count Reset allows you to clear the Digital Input Status Change counter. By default, the number of status changes of each digital input is shown in theD Inputs front panel display as well as in the Vista Digital Inputs/Outputs diagram.

Security Setup 9500/9600 User’s Guide
Page 44 Chapter 2 - Using The Front Panel
User ResetsThis sub-menu contains less critical and user-configurable controls.
DIST COUNT RESET
The meter contains a voltage disturbance display in its Power Quality Vista diagram, which counts the number of sag/swell events that have occurred since power-up or last reset. The Disturbance Count Reset allows you to clear this counter. See “PQ (Power Quality) Setup” on page 39.
MAN WFM TRG
The Manual Waveform Trigger forces the meter to perform a waveform capture. Waveform data is accessible in the Vista Power Quality diagram.
AVAILABILITY RESET
This item resets the Power Availability framework. Current values in the Availability display screen - availability (up-time in parts per million), number of nines, and evaluation time (in days). The previous statistics will appear in the Previous Availability display screen.
EN50160 RESET (9600 only)
This item will reset all EN50160 parameters and statistics accumulated in the meter. Refer to Chapter 2 for a description of the EN50160 parameters displayed on the default front panel data screens and Vista diagrams. The technical note Power Quality: ACCESS Meters and EN50160 contains more information about EN50160.
CUSTOM 1 TRIG, CUSTOM 2 TRIG
These are resets that you may program yourself with Designer. The 9600 only has the CUSTOM 1 TRIG available, whereas the 9500 has both custom resets. Refer to “Creating a Front Panel Reset” on page 46 for more details.
Security SetupThe meter’s eight-digit password allows you to configure the meter using the meter’s front panel.
The settings in Security menu item allow you to:
modify the existing meter password
disable the password security check
disable web browser configuration of the meter
You require the valid password to enter this menu. The default password is 0 (zero).
NOTE
The password enables users to change the configuration of the meter. It is recommended that you changeyour password from the default when you put the meter into service.

9500/9600 User’s Guide Security Setup
Chapter 2 - Using The Front Panel Page 45
If have not yet entered your password, the meter front panel requires that you enter it before you can view the Security Setup menu. Refer to “Using the Front Panel Buttons for Configuration” on page 32 for instructions on the Navigation buttons to enter numerical data.
If you enter an incorrect password, the front panel will display an “invalid password” message and you must try again.
Password
Use this setting to change the current password to any eight digit number. As with all configuration changes, you are required to confirm the change. By default, the password is set to 0 (zero) in the factory. The password may be changed to any eight digit number.
Enabled
Use this setting to enable and disable password security on the meter. Disabling the password allows changes to all the meter’s settings through the front panel without a security check.
CAUTION
Non-secure access to critical settings in the meter, such as PT and CT ratios, is not advisable. It is highlyrecommended that any meter in the field have the password security check enabled.
When you re-enable password security, the password is reset to the factory default of 0 (zero). You should re-enter a custom password at this point.
Disabling the Password Security Check is required to write to the meter via the Modbus RTU protocol. Refer to “Third Party Protocols” on page 68 for details about configuring your meter for third-party systems.
Web Config
Use this setting to disable web browser configuration of the meter.
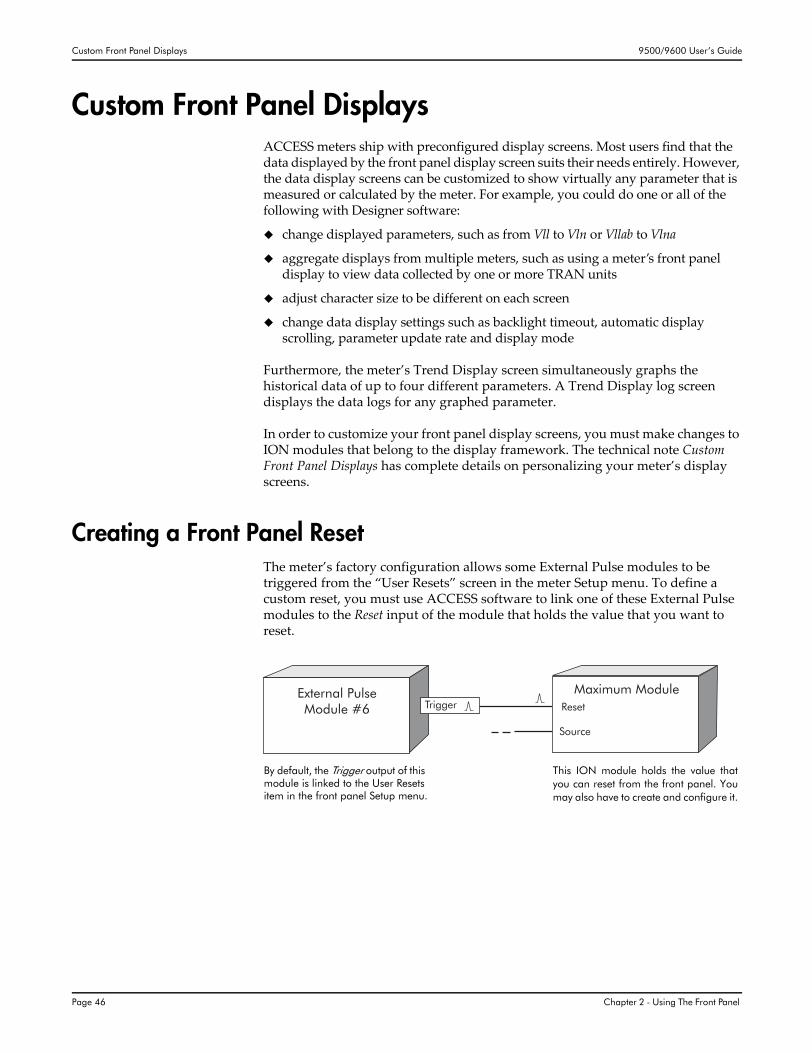
Custom Front Panel Displays 9500/9600 User’s Guide
Page 46 Chapter 2 - Using The Front Panel
Custom Front Panel DisplaysACCESS meters ship with preconfigured display screens. Most users find that the data displayed by the front panel display screen suits their needs entirely. However, the data display screens can be customized to show virtually any parameter that is measured or calculated by the meter. For example, you could do one or all of the following with Designer software:
change displayed parameters, such as from Vll to Vln or Vllab to Vlna
aggregate displays from multiple meters, such as using a meter’s front panel display to view data collected by one or more TRAN units
adjust character size to be different on each screen
change data display settings such as backlight timeout, automatic display scrolling, parameter update rate and display mode
Furthermore, the meter’s Trend Display screen simultaneously graphs the historical data of up to four different parameters. A Trend Display log screen displays the data logs for any graphed parameter.
In order to customize your front panel display screens, you must make changes to ION modules that belong to the display framework. The technical note Custom Front Panel Displays has complete details on personalizing your meter’s display screens.
Creating a Front Panel ResetThe meter’s factory configuration allows some External Pulse modules to be triggered from the “User Resets” screen in the meter Setup menu. To define a custom reset, you must use ACCESS software to link one of these External Pulse modules to the Reset input of the module that holds the value that you want to reset.
Maximum Module
Source
ResetExternal PulseModule #6 Trigger
This ION module holds the value thatyou can reset from the front panel. Youmay also have to create and configure it.
By default, the Trigger output of this module is linked to the User Resets item in the front panel Setup menu.

9500/9600 User’s Guide Creating a Front Panel Reset
Chapter 2 - Using The Front Panel Page 47
These are the External Pulse modules that you can trigger from the front panel:
Refer to “Meter Resets” on page 43 for more details about the User Resets screen in the meter’s front panel Setup menu.
To access the External Pulse modules (#4 or #6) using Designer:
1. Double-click on the Advanced Setup folder in the main meter configuration screen. A number of framework folders appear.
2. Double-click on the folder labeled Custom Resets. The appropriate External Pulse module is now available for your customization.
Meter Type External Pulse Modules User Resets Setup Menu Labels
9500 #4 and #6 Custom 1 Trg and Custom 2 Trg
9600 #6 Custom 1 Trg

Creating a Front Panel Reset 9500/9600 User’s Guide
Page 48 Chapter 2 - Using The Front Panel

3 Default Meter Functionality
The information provided in this chapter corresponds to factory-configured ACCESS devices. If you have a custom framework, some of the default settings may differ for your configuration.
In This Chapter
Default Meter Functionality . . . . . . . . . . . . . . . . . . . . . . . . . . . . . . . . . . . . 50Basic Setup . . . . . . . . . . . . . . . . . . . . . . . . . . . . . . . . . . . . . . . . . . . . . . . . . . . . . . . . . . 50Communications Setup . . . . . . . . . . . . . . . . . . . . . . . . . . . . . . . . . . . . . . . . . . . . . . . . 51Data Logging Setup . . . . . . . . . . . . . . . . . . . . . . . . . . . . . . . . . . . . . . . . . . . . . . . . . . . 53Energy Pulsing Setup . . . . . . . . . . . . . . . . . . . . . . . . . . . . . . . . . . . . . . . . . . . . . . . . . 58Power Quality Configuration . . . . . . . . . . . . . . . . . . . . . . . . . . . . . . . . . . . . . . . . . . . 59Setpoint Configuration . . . . . . . . . . . . . . . . . . . . . . . . . . . . . . . . . . . . . . . . . . . . . . . . 61Meter Clock Configuration . . . . . . . . . . . . . . . . . . . . . . . . . . . . . . . . . . . . . . . . . . . . . 62Display Setup . . . . . . . . . . . . . . . . . . . . . . . . . . . . . . . . . . . . . . . . . . . . . . . . . . . . . . . . 63Demand Setup . . . . . . . . . . . . . . . . . . . . . . . . . . . . . . . . . . . . . . . . . . . . . . . . . . . . . . . 64Time of Use Configuration . . . . . . . . . . . . . . . . . . . . . . . . . . . . . . . . . . . . . . . . . . . . . 65Factory Information . . . . . . . . . . . . . . . . . . . . . . . . . . . . . . . . . . . . . . . . . . . . . . . . . . . 67
Third Party Protocols . . . . . . . . . . . . . . . . . . . . . . . . . . . . . . . . . . . . . . . . . 68Using the Modbus RTU Protocol . . . . . . . . . . . . . . . . . . . . . . . . . . . . . . . . . . . . . . . . 69Using the Modbus/TCP Protocol . . . . . . . . . . . . . . . . . . . . . . . . . . . . . . . . . . . . . . . . 79Using the DNP 3.00 Protocol . . . . . . . . . . . . . . . . . . . . . . . . . . . . . . . . . . . . . . . . . . . 80
Restoring the Factory Configuration . . . . . . . . . . . . . . . . . . . . . . . . . . . . . . 85

Default Meter Functionality 9500/9600 User’s Guide
Page 50 Chapter 3 - Default Meter Functionality
Default Meter FunctionalityThe following sections describe the default functionality defined by your meter’s framework. With each advancement of firmware, there are changes to the framework, so your meter operation may differ slightly from what is presented.
The ION Device Templates documentation lists all the ION modules available in the current version of your meter, lists the total number of each ION module, and shows the ranges or options available for each module’s setup registers. The ION Devices Templates documentation is available at www.sea.siemens.com.
Basic SetupBasic configuration of the meter is provided by the Power Meter module. The Power Meter module is the main connection between the power system measurements and all other ION modules in the device. This module reports the values for all voltage, current and power measurements.
The Power Meter module’s setup registers describe details of the power system being monitored. Many of the Power Meter module’s setup registers are configured when the meter is initially put into service, although the device cannot operate properly until the Volts Mode and PT and CT ratios are set. Some registers may need to be changed to refine the device’s operation.
1 The registers are typically set when the device is commissioned. Changing the values of these registers while the device is in service is not recommended.
Setup Register Function Default
Volts Mode 1 The power system’s configuration – WYE, DELTA, Single, etc 4W-WYE
PT Prim 1 The Potential Transformer’s primary winding rating for V1, V2 and V3 120
PT Sec 1 The Potential Transformer’s secondary winding rating for V1, V2 and V3 120
CT Prim 1 The Current Transformer’s primary winding rating for I1, I2 and I3 5
CT Sec 1 The Current Transformer’s secondary winding rating for I1, I2 and I3 5
V4 Prim 1 The Potential Transformer’s primary winding rating for V4 120
V4 Sec 1 The Potential Transformer’s secondary winding rating for V4 120
I4 CT Prim 1 The Current Transformer’s primary winding rating for I4 5
I4 CT Sec 1 The Current Transformer’s secondary winding rating for I4 5
I5 CT Prim 1 The Current Transformer’s primary winding rating for I5 5
I5 CT Sec 1 The Current Transformer’s secondary winding rating for I5 5
Vn Polarity The polarity of the Potential Transformer on Vn Normal
In Polarity The polarity of the Current Transformer on In Normal
Phase Order The expected rotation of the voltage phases (ABC or ACB) ABC
Phase Lbls The phase label format assigned to the outputs (ABC, RST, XYZ, RYB, RWB or 123) ABC

9500/9600 User’s Guide Communications Setup
Chapter 3 - Default Meter Functionality Page 51
Once basic setup is performed (i.e. the PT/CT and Volts Mode settings), the meter operates properly. Typically there is no need to make further changes to the Power Meter module’s setup registers.
Communications SetupCommunication settings are typically configured when the ACCESS meter is initially put into service. Each communications port on a meter is controlled by a single Communications module. The modules’ setup registers define the parameters used for each port, so parameters do vary according to the type of communications channel selected (i.e. RS-232, RS-485, Modem, Infrared, Ethernet).
The Communications modules control the following channels:
A communications channel must be configured before you can use ACCESS software (i.e. Vista or Designer). Altering the settings of a channel that is in use causes a loss of communications with the meter.
Module Name Settings
Comm 1 Selectable RS-232 or RS-485 port on COM1
Comm 2 High-speed RS-485 port on COM2
Comm 3 IrDA optical (infrared) RS-485 port or optional internal modem on COM3
Ethernet Optional 10Base-T or 10Base-FL Ethernet port
Communications Port Setup Register Function Default
all Serial ports Protocol This sets the serial port’s communications protocol ION
all Serial ports Baud Rate This sets the communications speed in bits/second 9600 bps
all Serial ports RTS Delay This sets the RTS Delay for the serial communications port 0.01s (10ms)
all Serial ports Unit IDThis sets the meter’s Unit ID(A unique Unit ID is required for each device, including all the devices on a ModemGate or EtherGate serial loop.)
COM1: Unit ID is based on the serial number.1
COM2: 101COM3: 102
COM1and COM3
Mode orComm Mode
This sets the communications standard the hardware channel employs.COM1: RS-232 or RS-485COM3: IRDA optical port or internal modem
COM1: RS-232COM3: Modem
COM1 (RS-232) only HshakeMode Specifies the handshake mode the device is using when the Comm Mode is set to RS-232 RTS with Delay
COM3 (internal modem) only2
Answer Hours Rings
This specifies the number of rings during defined answer hours. Valid entries for this register are 0-255 rings; an entry of 0 rings will disable answering.
1
Non-AnswerHours Rings
This specifies the number of rings during defined non-answer hours 5

Communications Setup 9500/9600 User’s Guide
Page 52 Chapter 3 - Default Meter Functionality
1 The factory set Unit ID for COM1 is based on the serial number of the meter, using the last four numbers before the dash. For example, if the serial number is PA-0009B263-01, the Unit ID is set in the factory to 9263. After a factory reset, the unit ID number will default to 100.
2 If you have the internal modem order option, the modem shares COM3 with the IRDA optical port. The modem is factory configured to answer in the number of rings specified by Answer HR Rings (the Non-Answer HR Rings value is ignored by default). The modem initialization string (Modem Init) can only be altered via software communications.
Refer to the online ION Programmer’s Reference for complete details about all the setup registers in the Communications module.
Modem Initialization StringThe setup register labeled ModemInit is available for 9500 and 9600 meters with internal modems, and defines the initialization string for the internal modem (by default, the modem is factory configured to answer on one ring). You should not require changes to the ModemInit string for normal operation. If you require advanced modem functionality, you can customize the ModemInit register with a string up to 47 characters long.
Refer to the Modem AT Commands technical note for information regarding your internal modem, including details on customizing the modem’s registers.
NOTE
The ModemInit string is automatically sent to the internal modem when the ModemInit setup register ischanged, when the meter is powered up, and when the baud rate of the modem’s Communicationsmodule is changed.
Communications ProtocolsBy default, all COM ports are configured to use the ION protocol. If you want to make use of Modbus RTU, DNP, or GPS system, you need to configure the Protocol setup register for the Communications module that controls the port you want to use. However, the FACTORY protocol is reserved for the use by Technical Service Engineers.
Ethernet port
IP Boot Option
A BootP server automatically sets the IP Address, Subnet Mask, Gateway, and SMTP Mail Server IP Address.– see your Network Administrator to determine if BootP is used
BootP
IP Address This sets the IP Address of the meter None (if BootP server is not used)
Subnet Mask This sets the Subnet Mask setting for the Ethernet PortNone (if BootP server is not used)
Gateway This sets the Ethernet Gateway setting for the Ethernet Port None (if BootP server is not used)
SMTP ServerThis sets the IP Address for the SMTP Mail Server that is configured to forward mail from the meter to the final destination
None (if BootP server is not used)
Communications Port Setup Register Function Default

9500/9600 User’s Guide Data Logging Setup
Chapter 3 - Default Meter Functionality Page 53
Data Logging SetupThe data recording frameworks contain Data Recorder modules, Waveform Recorder modules, and Periodic Timer modules. Data Recorder and Waveform Recorder modules are responsible for logging the power system data. The Periodic Timer modules control the recording frequency of the recorder modules to which they are linked.
Default Logging CapacityThe following table summarizes the default recording depths and recording intervals of the various Data recorders and Waveform recorders in the meter.
Procedures for changing the logging depth and the frequency of logging are follow below.
Changing the Log DepthsChange the value in the Data Recorder’s Depth setup register to increase the number of records stored in the recorder. The RecordMode setup register controls how the Data Recorder will overwrite old records; refer to the Data Recorder module description in the online ION Programmer’s Reference before changing this setup register.
Log name Depth Interval
Revenue Log 3360 900 seconds (15 minutes)
Loss Log 3360 900 seconds (15 minutes)
TOU Data Logs (6 data recorders) 2050
(9500)(9600) Triggered on demand
Historic Logs (3 data recorders) 760 900 seconds (15 minutes)
Harmonics Logs (2 data recorders) 190 840
(9500)(9600) 3600
Waveform recording (waveform recorders:6 for 9500, 14 for 9600)
5 15
9500)(9600) Triggered on demand
Report Generator Log (EgyDmd Log) 192 3360
9500)(9600)
900 seconds (15 minutes)
Sag/Swell Log 100 Triggered on demand
Transient Log (9600 only) 100 Triggered on demand
Event Log (Event Log Controller module) 500 Triggered on demand
EN50160 Logs (22 data recorders)(9600 only) 10 Daily, weekly, 10 minutes, ...

Data Logging Setup 9500/9600 User’s Guide
Page 54 Chapter 3 - Default Meter Functionality
Changing the Frequency of LoggingThe five Periodic Timer modules that control the frequency of different data recording are as follows:
"Revenue Log Trg" controls the frequency of the logging of revenue values
"Loss Log Trg" controls the frequency of Loss Compensation Data logging
"EgyDmd Log Trg" controls the frequency of logging for the Energy and Demand Log (this log is used for generating reports using Reporter)
"Hist Log Trg" controls the frequency of Historic Data logging
"Harm Log Trg" controls the frequency of Harmonics logging
NOTE
The life of the flash memory is estimated at 40 to 50 years of read/writes under normal conditions. If themeter is programmed to write the data recorders in very short intervals, the life of the flash memory willbe significantly reduced.
Change the value in the Period setup register to change the frequency of data logging (Period values are specified in seconds). Do not change the Sync Mode setup register.
For more information about the EN50160 data recorders, refer to “EN50160 Compliance Logging (9600 only)” on page 57 as well as the technical note Power Quality: ACCESS Meters and EN50160.
Default Logging ConfigurationThe following sections describe each Data Recorder and the parameters they log.
Revenue Log
The Revenue Log (Data Recorder #1) is configured for use with UTS MV-90 billing software. The default values logged by the Revenue Log are as follows:
Parameter Description
kWh del int Interval kWh delivered
kWh rec int Interval kWh received
kVARh del int Interval kVARh delivered
kVARh rec int Interval kVARh received

9500/9600 User’s Guide Data Logging Setup
Chapter 3 - Default Meter Functionality Page 55
Historic Data Logging
Three data recorders are used to record “standard” power system quantities, such as phase current, phase voltage and power factor. These recorders are labeled Hist Mean Log, Hist High Log, and Hist Low Log. By default, they log the following ION output register values:
Loss Log
The Loss Log recorder is configured to record loss values. By default, it logs the following ION parameters:
Harmonics Logging
Two recorders provide various harmonics logs, including K-factor and Total Harmonics Distortion (THD). These recorders are labeled Harm Mean Log and Harm High Log. By default, they log the following ION output register values:
Hist Mean Log Hist High Log Hist Low Log
Vll ab mean I avg mean Vll ab high I avg high Vll ab low I avg low
Vll bc mean I 4 mean Vll bc high I 4 high Vll bc low I 4 low
Vll ca mean kW tot mean Vll ca high kW tot high Vll ca low kW tot low
Vll avg mean kVAR tot mean Vll avg high kVAR tot high Vll avg low kVAR tot low
V unbal mean kVA tot mean V unbal high kVA tot high V unbal low kVA tot low
Ia mean PF lag mean Ia high PF lag high Ia low PF lag low
Ib mean PF lead mean Ib high PF lead high Ib low PF lead low
Ic mean Freq mean Ic high Freq high Ic low Freq low
Parameter Description
MU Ia^2h int Phase A interval current squared hours
MU Ib^2h int Phase B interval current squared hours
MU Ic^2h int Phase C interval current squared hours
MU Vll ab^2h int Phase A interval voltage Line-to-Line squared hours
MU Vll bc^2h int Phase B interval voltage Line-to-Line squared hours
MU Vll ca^2h int Phase C interval voltage Line-to-Line squared hours
Harm Mean Log Harm High Log
V1 THD mean I1 K Fac mean V1 THD high I1 K Fac high
V2 THD mean I2 K Fac mean V2 THD high I2 K Fac high
V3 THD mean I3 K Fac mean V3 THD high I3 K Fac high
I1 THD mean I1 THD high
I2 THD mean I2 THD high
I3 THD mean I3 THD high
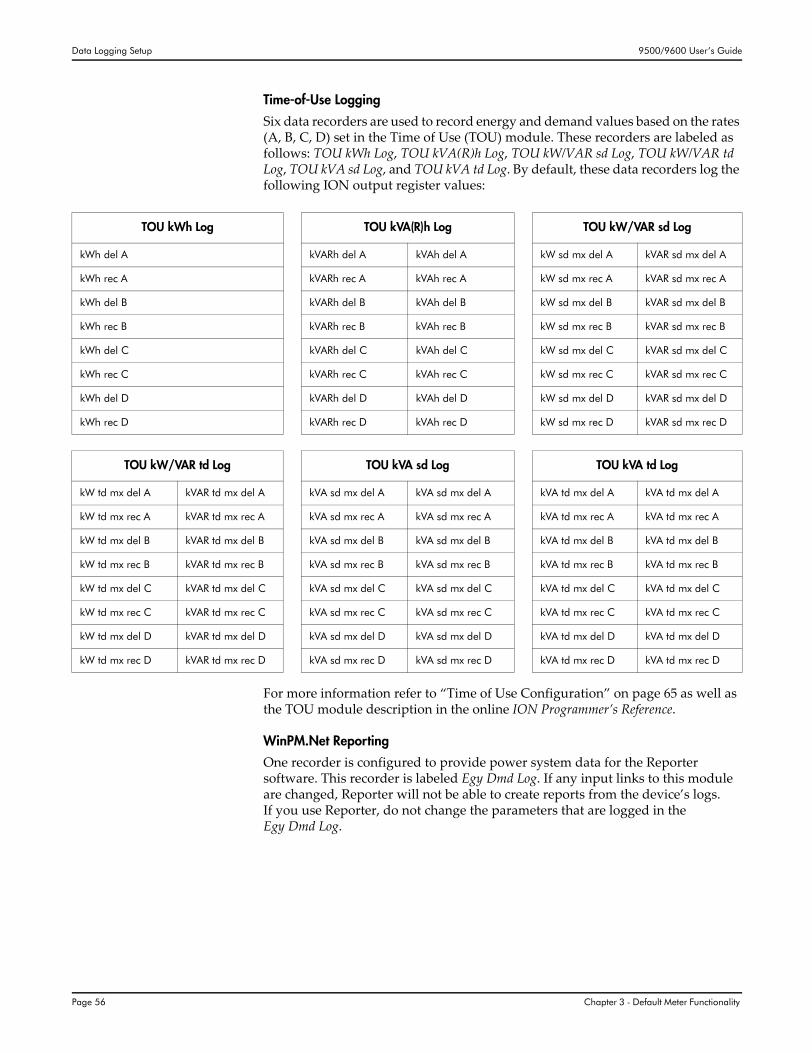
Data Logging Setup 9500/9600 User’s Guide
Page 56 Chapter 3 - Default Meter Functionality
Time-of-Use Logging
Six data recorders are used to record energy and demand values based on the rates (A, B, C, D) set in the Time of Use (TOU) module. These recorders are labeled as follows: TOU kWh Log, TOU kVA(R)h Log, TOU kW/VAR sd Log, TOU kW/VAR td Log, TOU kVA sd Log, and TOU kVA td Log. By default, these data recorders log the following ION output register values:
For more information refer to “Time of Use Configuration” on page 65 as well as the TOU module description in the online ION Programmer’s Reference.
WinPM.Net Reporting
One recorder is configured to provide power system data for the Reporter software. This recorder is labeled Egy Dmd Log. If any input links to this module are changed, Reporter will not be able to create reports from the device’s logs. If you use Reporter, do not change the parameters that are logged in the Egy Dmd Log.
TOU kWh Log TOU kVA(R)h Log TOU kW/VAR sd Log
kWh del A kVARh del A kVAh del A kW sd mx del A kVAR sd mx del A
kWh rec A kVARh rec A kVAh rec A kW sd mx rec A kVAR sd mx rec A
kWh del B kVARh del B kVAh del B kW sd mx del B kVAR sd mx del B
kWh rec B kVARh rec B kVAh rec B kW sd mx rec B kVAR sd mx rec B
kWh del C kVARh del C kVAh del C kW sd mx del C kVAR sd mx del C
kWh rec C kVARh rec C kVAh rec C kW sd mx rec C kVAR sd mx rec C
kWh del D kVARh del D kVAh del D kW sd mx del D kVAR sd mx del D
kWh rec D kVARh rec D kVAh rec D kW sd mx rec D kVAR sd mx rec D
TOU kW/VAR td Log TOU kVA sd Log TOU kVA td Log
kW td mx del A kVAR td mx del A kVA sd mx del A kVA sd mx del A kVA td mx del A kVA td mx del A
kW td mx rec A kVAR td mx rec A kVA sd mx rec A kVA sd mx rec A kVA td mx rec A kVA td mx rec A
kW td mx del B kVAR td mx del B kVA sd mx del B kVA sd mx del B kVA td mx del B kVA td mx del B
kW td mx rec B kVAR td mx rec B kVA sd mx rec B kVA sd mx rec B kVA td mx rec B kVA td mx rec B
kW td mx del C kVAR td mx del C kVA sd mx del C kVA sd mx del C kVA td mx del C kVA td mx del C
kW td mx rec C kVAR td mx rec C kVA sd mx rec C kVA sd mx rec C kVA td mx rec C kVA td mx rec C
kW td mx del D kVAR td mx del D kVA sd mx del D kVA sd mx del D kVA td mx del D kVA td mx del D
kW td mx rec D kVAR td mx rec D kVA sd mx rec D kVA sd mx rec D kVA td mx rec D kVA td mx rec D

9500/9600 User’s Guide Data Logging Setup
Chapter 3 - Default Meter Functionality Page 57
Sag/Swell and Transient Logging
The meter logs the following ION output register values:
EN50160 Compliance Logging (9600 only)
By default, 22 Data Recorders are used for logging EN50160 compliance parameters.
The 9600 logs EN50160 counter data for current and previous observation periods. EN50160 events are also logged. EN50160 parameter data logging (from seven “Prm” data recorders) is disabled by default. The EN50160 Parameter Logging enable is accessible in the default Power Quality Vista diagram. For more information about EN50160 data logging, refer to the technical note Power Quality: ACCESS Meters and EN50160.
Sag/Swell Log
DistDur DistV2Engy DistV1Engy DistV3Engy
DistV1Min DistV3Min DistV2Min DistNominal
DistV1Max DistV3Max DistV2Max SwellLim
DistV1Avg DistV3Avg DistV2Avg SagLim
Transient Log
TranV1Dur TranNominal TranV2Max PT Sec
TranV1Max Threshold TranV3Dur CT Prim
TranV2Dur PT Prim TranV3Max CT Sec
Data Recorder EN50160 Component Logged Data Recorder EN50160
Component Logged
EN50160 Frq/Mg Power Frequency andSupply Magnitude
EN50160 Vunbal Voltage Unbalance
EN50160 Flicker Flicker EN50160 Hrm Vlt Harmonics(up to 40th)EN50160 Vlt Dp1
Supply Voltage Dips
EN50160 Ihm Vlt
EN50160 Vlt Dp2 EN50160 MSignal Mains SignallingVoltage
EN50160 Vlt Dp3 EN50160 Prm-f/V
Parameter data
These data recorders are disabled by default (see below).
EN50160 Vlt Dp4 EN50160 Prm-Flk
EN50160 Vlt Dp5 EN50160 Prm-VDp
EN50160 Intrp Short/Long Interruptions EN50160 Prm-Vlr
EN50160 Ovrvlt1
TemporaryOvervoltages
EN50160 Prm-OV
EN50160 Ovrvlt2 EN50160 PrmHrm1
EN50160 Ovrvlt3 EN50160 PrmHrm2

Energy Pulsing Setup 9500/9600 User’s Guide
Page 58 Chapter 3 - Default Meter Functionality
Energy Pulsing SetupEach meter has both the Calibration Pulser module and the Pulser module.
Pulser Module Settings
The Pulser module serves as an intermediary between other modules’ pulse output registers (accepting them as pulse inputs) and a hardware output channel on the device. These modules are capable of sending pulses or pulse transitions to any hardware output channel. The Pulser module contains the following setup registers:
Five common parameters (kWh del, kWh rec, kVARh del, kVARh rec, and kW sd del) are already linked to the Pulser modules for you.
NOTE
For safety reasons, no hardware channel has been selected. To make use of these links, you mustconfigure the Pulser modules’ Port setup registers to the appropriate hardware port that receives the output.
Calibration Pulser Module Settings
The Calibration Pulser module is a highly accurate energy pulser used for verifying calibration on meters employed in billing applications. This module type serves as an intermediary between the power (kW, kVAR or kVA) outputs of the Power Meter module and a device’s hardware output channel.
The setup registers of the module labeled “kWh Pulser –D4,” allow you to configure the solid-state output D4 for calibration pulsing. By default, the output on a standard meter generates a pulse for every 1.8Wh accumulated. This is the same pulsing rate as the middle front panel LED (controlled by a Calibration Pulser module labeled “kWh Pulser –LED”). You can modify the pulsing rate of either channel by changing the value of the Kt setup register of the controlling Calibration Pulser module (see below).
Setup Register Function Default
Pulse WidthThis numeric bounded register specifies the width, in seconds, of the output pulses. 1
OutputMode This register defines whether the output is a complete pulse or a transition pulse (KYZ). Pulse
Polarity This register specifies the polarity of output. It has no effect if OutputMode is KYZ. Non-inverting
PortThis register specifies which hardware port the output appears on. Only those hardware channels that are still available appear when you access this setting.
Not Used

9500/9600 User’s Guide Power Quality Configuration
Chapter 3 - Default Meter Functionality Page 59
The following setup registers are available in the Calibration Pulser module:
1 Refer to the Calibration Pulser module description in the online ION Programmer’s Reference for more details.
Power Quality ConfigurationPower quality configuration is provided by a number of modules, depending on your meter type: the Sag/Swell module, the Transient module, and numerous EN50160 frameworks, some of which include the Mains Signalling Evaluation modules.
Sag/Swell Module Settings
The Sag/Swell module monitors voltage waveforms for sags and swells (i.e. ITI (CBEMA) Type 2 and Type 3 disturbances); it then reports each disturbance’s magnitude and duration. The Sag/Swell module can also detect sub-disturbances during a Sag/Swell event. Settings are as follows:
1 The primary power system voltage is sometimes different than the PT Primary setup register value (i.e. when the PT Primary is used to indicate winding ratio rather than primary voltage).
Setup Register Function Default
Pulse WidthThis numeric bounded register specifies the width, in seconds, of the pulses sent to the hardware channel. The Calibration Pulser module maintains a minimum duty cycle of 50% on the output pulse train.
0.05
KtThe numeric bounded register defines how much energy the module accumulates before a pulse is sent to the hardware channel. An industry standard for energy pulsing is 1.8, or one pulse per 1.8 energy-hours.
1.80
Int Mode Specifies the modes of integration that may be selected. 1 Absolute
OutputMode This register specifies whether the output is a complete pulse (Pulse) or a change of state transition (KYZ). Pulse
PortThis register specifies which hardware port the output appears on. Only those hardware channels that are still available appear when you access this setting. Not Used
Setup Register Function Default
Swell Lim This is the magnitude above which a voltage deviation is considered a swell. 106
Sag Lim This is the magnitude below which a voltage deviation is considered a sag. 88
Change Crit This is the amount a voltage signal must change during a disturbance to be considered a new sub-disturbance.
10
Nom Volts This is the nominal power system voltage (used for all Power Quality functions). 0 1
EvPriority The priority assigned to Sag/Swell and Transient module events (0 to 255, 255 is highest). 200

Power Quality Configuration 9500/9600 User’s Guide
Page 60 Chapter 3 - Default Meter Functionality
Besides NomVolts, the only setup registers that you may need to change in the Sag/Swell module are Swell Lim and Sag Lim. Most applications are served by the default values entered into these registers. The Change Crit and EvPriority setup registers do not need to be changed for normal operation.
NOTE
If the Sag/Swell module’s Nom Volts setup register is set to zero, all Sag/Swell module functions aredisabled. Nom Volts is typically set when the meter is put into service. If Nom Volts has not been set, entera value for your system’s nominal voltage (i.e. 120, 277, or 347). The value you enter will also be usedby the Transient module and in all EN50160 compliance calculations with the 9600.
Transient Module Settings (9600 only)
The Transient module monitors voltage waveforms for transient activity (i.e., ITI (CBEMA) Type 1 disturbances). The Threshold setup register defines what voltage disturbance magnitude should be considered as transient activity. Threshold is interpreted as a percentage of the nominal system voltage, plus 100. For example, if you want transients recorded when voltage deviates from nominal by 20%, enter 120 into the Threshold setup register.
EN50160 Settings (9600 only)
The EN50160 framework is composed of numerous ION module types including: Mains Signaling Evaluation, Harmonics Evaluation, Voltage Harmonics, Flicker, and more. Refer to the technical note Power Quality: ACCESS Meters and EN50160 for details.
Setup Register Function Default
Threshold This is the magnitude at which a voltage deviation is considered a transient.
125
EvPriority The priority assigned to Sag/Swell and Transient module events (0 to 255, 255 is highest). 200

9500/9600 User’s Guide Setpoint Configuration
Chapter 3 - Default Meter Functionality Page 61
Setpoint ConfigurationThe Relative Setpoint module provides extensive control, secondary protection, and analysis capabilities by allowing you to initiate an action in response to a specific condition. It is particularly useful for performing actions based on differences between a value (e.g. kW on phase A) relative to a reference value (e.g. kW demand for all three phases). You can use this module’s outputs for demand control of equipment or any other applications requiring setpoint activity relative to a varying value.
The Relative Setpoint modules monitor the following for "over" conditions: phase current, kW demand, and voltage unbalance.
Relative Setpoint Module Settings
There is no need to change any of the Relative Setpoint modules’ setup registers for normal operation of the meter.
Fine Tuning Over Condition MonitoringIf you want to fine-tune over condition monitoring, the only setup registers you should change are SusUntlON and SusUntlOFF.
SusUntlON determines how long the modules wait after an over condition is detected before reporting it. This gives the monitored value a short period to correct itself before the event is registered with the module so that very brief over conditions are ignored. Similarly, SusUntlOFF is the amount of time a normal value must be present before the module considers normal operation to be restored. Both SusUntlON and SusUntlOFF values are entered in seconds (the default value for both is 30 seconds).
Refer to the online ION Programmer’s Reference for more information about the Relative Setpoint module.
Module Label Description
Relative Setpoint 1 Over KW sd When active, this annunciates when the total kW SWDemand exceeds a specified amount.
Relative Setpoint 2 Over I a When active, this annunciates when the current on phase A exceeds a specified amount.
Relative Setpoint 3 Over I b When active, this annunciates when the current on phase B exceeds a specified amount.
Relative Setpoint 4 Over I c When active, this annunciates when the current on phase C exceeds a specified amount.
Relative Setpoint 5 Over V unbal When active, this annunciates if the voltage unbalance exceeds a specified percentage.
Relative Setpoint 6 Over I 4 When active, this annunciates when I 4 exceeds a specified amount.
Relative Setpoint 7 Over I 5 When active, this annunciates when I 5 exceeds a specified amount.
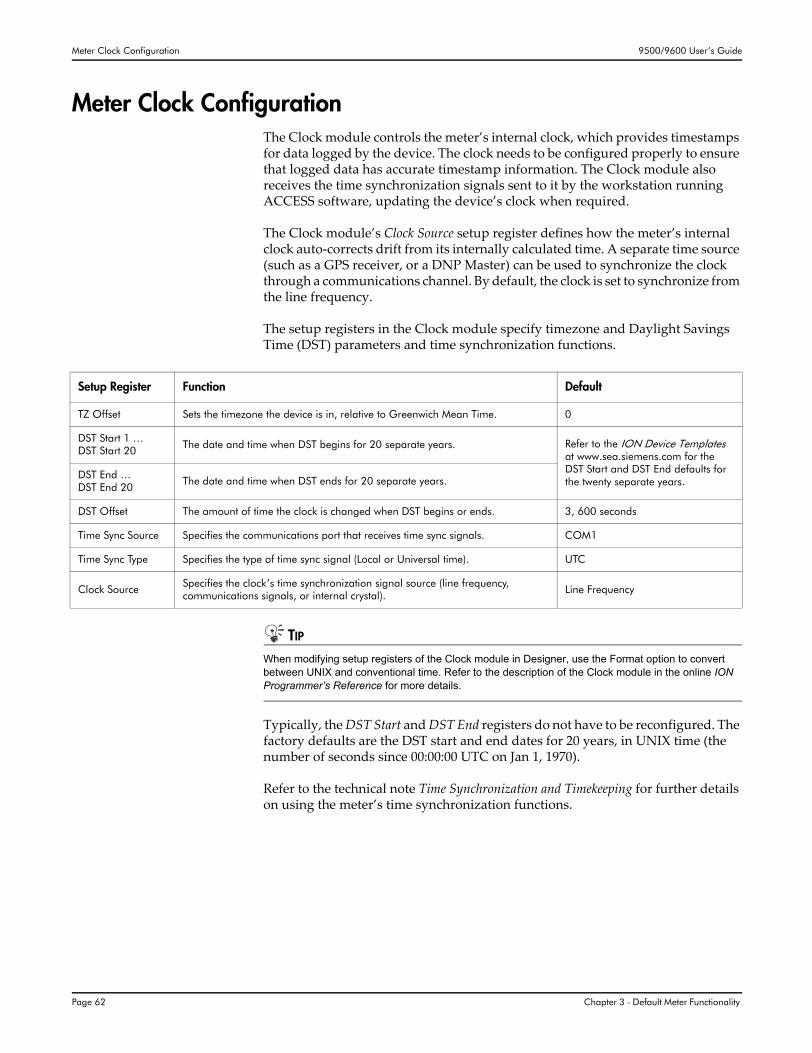
Meter Clock Configuration 9500/9600 User’s Guide
Page 62 Chapter 3 - Default Meter Functionality
Meter Clock ConfigurationThe Clock module controls the meter’s internal clock, which provides timestamps for data logged by the device. The clock needs to be configured properly to ensure that logged data has accurate timestamp information. The Clock module also receives the time synchronization signals sent to it by the workstation running ACCESS software, updating the device’s clock when required.
The Clock module’s Clock Source setup register defines how the meter’s internal clock auto-corrects drift from its internally calculated time. A separate time source (such as a GPS receiver, or a DNP Master) can be used to synchronize the clock through a communications channel. By default, the clock is set to synchronize from the line frequency.
The setup registers in the Clock module specify timezone and Daylight Savings Time (DST) parameters and time synchronization functions.
TIP
When modifying setup registers of the Clock module in Designer, use the Format option to convert between UNIX and conventional time. Refer to the description of the Clock module in the online ION Programmer’s Reference for more details.
Typically, the DST Start and DST End registers do not have to be reconfigured. The factory defaults are the DST start and end dates for 20 years, in UNIX time (the number of seconds since 00:00:00 UTC on Jan 1, 1970).
Refer to the technical note Time Synchronization and Timekeeping for further details on using the meter’s time synchronization functions.
Setup Register Function Default
TZ Offset Sets the timezone the device is in, relative to Greenwich Mean Time. 0
DST Start 1 …DST Start 20 The date and time when DST begins for 20 separate years. Refer to the ION Device Templates
at www.sea.siemens.com for the DST Start and DST End defaults for the twenty separate years.
DST End …DST End 20
The date and time when DST ends for 20 separate years.
DST Offset The amount of time the clock is changed when DST begins or ends. 3, 600 seconds
Time Sync Source Specifies the communications port that receives time sync signals. COM1
Time Sync Type Specifies the type of time sync signal (Local or Universal time). UTC
Clock Source Specifies the clock’s time synchronization signal source (line frequency, communications signals, or internal crystal). Line Frequency

9500/9600 User’s Guide Display Setup
Chapter 3 - Default Meter Functionality Page 63
Display SetupThe meter’s front panel display is controlled by three types of ION modules: the Display Options module, the Scroll module, and Display modules.
Display Options Module SettingsThe Display Options module contains setup registers that hold data display settings such as contrast level, backlight timeout, daylight savings time, and update time. Settings in the Display Options modules are global, and affect the entire set of front panel display screens.
Scroll Module Settings
The Scroll module determines the sequence and rate of scrolling for multiple front panel display screens.
The Trigger outputs of Scroll module are linked to the inputs of Display modules. When a pulse is sent from the Trigger output of a Scroll module to a linked Display module, the Display module shows its information on the front panel.
Display Module Settings
Display modules determine the form and content of each display screen.
Setup Register Function Default
Contrast Sets the global contrast setting for the meter display. 7
Backlight Timeout Sets the time that the front panel’s backlight stays on after the last press of a front panel button (in seconds). 300
Display Update Time Sets the period between data display refreshes (in seconds). 1
Digital Grouping Sets the numbering format by determining how groups of three digits are separated. 1,000
Demand Lockout Timeout Sets the minimum time allowed between consecutive demand resets. 2,160,000
Setup Register Function Default
Scroll Delay Sets the time that will elapse between successive pulses on the Trigger outputs when the scroll module is enabled. 6
Wraparound Designates the last Trigger output (Trigger n) before returning to the first Trigger in he order. 10
Freeze Time Sets the time (in seconds) that the Scroll module remains "frozen" when pulsed from the Freeze, Up, or Down inputs.
120
Setup Register Function Default
Screen Type This specifies the way the linked parameters are displayed on the front panel screen.
Defaults vary among display screens. Refer to the ION Device Templates at www.sea.siemens.com.
Softkey Number This assigns a softkey number to the display screen.
Softkey Name This assigns a softkey name to the display screen.
Screen Title This assigns a title to the display screen.

Demand Setup 9500/9600 User’s Guide
Page 64 Chapter 3 - Default Meter Functionality
Changing the Parameters that are DisplayedThe meter’s default display configuration shows a comprehensive set of parameters. Changing these parameters requires that you alter the links between various ION modules. Complete details on configuring the front panel displays are provided in the Custom Front Panel Displays technical note in the Appendix A.
Demand SetupDemand is a measure of average power consumption over a fixed time interval. Peak (or maximum) demand is the highest demand level recorded over the billing period. Two methods of measuring demand are with Thermal Demand modules and Sliding Window Demand modules. These modules are configured to calculate the average current demand and kW, kVAR and kVA demand. The setup registers in the demand modules define time intervals for demand calculations, setting the sensitivity of the module’s operation.
Sliding Window Demand Module Settings
Sliding Window Demand is often referred to as Rolling Block Demand. To compute sliding window demand values, the Sliding Window Demand module uses the sliding window averaging (or rolling interval) technique which divides the demand interval into sub-intervals. The demand is measured electronically based on the average load level over the most recent set of sub-intervals. This method offers better response time than fixed interval methods.
Thermal Demand Module Settings
The Thermal Demand module calculates thermal demand over a specified length of time. It uses a method which is equivalent to thermal averaging. For thermal averaging, the traditional demand indicator responds to heating of a thermal element in a Watt-Hour meter. You can adjust the Thermal Demand module's calculation to mimic this technique by changing the Time Const and Interval setup parameters.
Setup Register Function Default
Sub Intvl The time, in seconds, in the sliding window demand sub-interval. 900
#SubIntvls The number of sub-intervals in the sliding window. 1
Pred Resp The speed of Predicted Demand calculations; use higher values for faster prediction (70 to 99 recommended).
70
Setup Register Function Default
Interval The time, in seconds, in the thermal demand interval. 900
Time Const The sensitivity to changes in the source signal; higher values provide faster response time (common values are 63 and 90). 90

9500/9600 User’s Guide Time of Use Configuration
Chapter 3 - Default Meter Functionality Page 65
Time of Use ConfigurationThe Time of Use module may only be important if you are using the meter in a billing application (i.e. you are a power provider), as the module contains the meter’s seasonal rate schedules. Typically, power consumers can ignore Time Of Use configuration.
Seasonal SettingsThe Time of Use module supports up to four separate seasons. Each seasons’ start and end dates are set into the appropriate Season setup register.
NOTE
Ensure that there is no date overlapping when defining seasons and that every day of the year is coveredby your seasons. If there are gaps between seasons, the module returns an error and will not function.
If your rates do not change between seasons, you do not need to configure the Season setup registers — Season 1 is the default, and all Season 1 rates are in effect all year.
If you have different seasons, enter their start and end dates into the appropriate setup registers. If your season is active on the same dates every year, you only need to enter a single range of dates in the appropriate Season setup register. If the active dates are different each year (for example, Season 3 becomes active every first Monday in August), the start dates must be individually specified for each year.
Time Of Use Module Settings
The Time of Use module’s setup registers define your seasons’ start and end dates, the day types where your rates may differ, and the rate schedules for each season’s day types. The module compares the meter’s internal clock with the season, day, and time of day settings in these registers, and changes its output registers to reflect the current state of these settings.

Time of Use Configuration 9500/9600 User’s Guide
Page 66 Chapter 3 - Default Meter Functionality
The Time of Use module is partially configured at the factory. Check the setup registers to ensure that the settings match your Time of Use schedules.
For more information, refer to the Time of Use module description in the online ION Programmer’s Reference.
Creating a New Time Of Use ScheduleYou can create a new TOU schedule using the TOU Program Manager; the program is a self-documented, graphical wizard. You launch the TOU Program Manager in Designer from the Options menu.
Setup Register Function
Season 1- 4 These setup registers define the dates for each active season. When a season is active, the Time of Use module will use the applicable rate schedules.
Season 1 - 4Weekday Rates These setup registers specify seasonal weekday rates.
Season 1 - 4Weekend Rates These setup registers specify seasonal weekend rates.
Season 1 - 4Alt 1 Rates These setup registers specify a season's daily rates during the days specified in the Alt 1 Days setup register.
Season 1 - 4Alt 2 Rates These setup registers specify a season's daily rates during the days specified in the Alt 2 Days setup register.
Season 1 - 4Holiday Rates These setup registers specify a season's daily rates during the days specified in the Holidays setup register.
Weekdays This register defines the days of the week for all seasons. The rates in the Season (1, 2, 3, or 4) Weekday Rates setup registers are used on these days.
Weekends This register defines the weekend days for all seasons. The rates in the Season (1, 2, 3, or 4) Weekend Rates setup registers are used on these days.
Alt 1 Days This register defines a set of alternative dates for all seasons. These dates generally have different rates from weekdays, weekends, or holidays.
Alt 2 Days This register is similar in function to Alt 1 Days, but contains a different set of dates.
Holidays This register defines the holidays for all seasons. The rates defined in the Season (1, 2, 3, or 4) Holiday Rates setup registers are used on these days.
Self Read Days This setup register defines the dates and times that the Self Read output register will pulse. If no time is entered in this register, the Self Read output register will pulse on the date specified at 12:00 AM.

9500/9600 User’s Guide Factory Information
Chapter 3 - Default Meter Functionality Page 67
Factory InformationThe Factory module displays firmware version, serial number and other device information in read-only setup registers (read-only registers can be viewed but not changed).
Factory Module Settings
The device information provided is as follows:
The Factory module also contains numerous read-only setup registers that hold the calibration constants used at the factory.
How to TAG Your MeterThree configurable setup registers are provided for you to enter your company name and other text information you want stored in the meter:
Owner - This is a text register for storing user information (e.g. company name); it can be up to 255 characters in length.
Tag 1 - This is a text register for storing user information (e.g. device location); it can be up to 15 characters in length.
Tag 2 - This is a text register for storing user information (e.g. device number or identifier); it can be up to 15 characters in length.
Setup Register Description
Device Type A device type identifier (e.g. “7600” for the 9600)
Compliance A statement of whether the device is ION compliant or not
Options Shows model number of meter
Revision The meter’s firmware version
Serial Num The meter’s serial number
ION Version The ION version supported by the device
Template The name of the template (framework) installed on the device at the factory
Nom Freq The expected frequency of the power system being monitored

Third Party Protocols 9500/9600 User’s Guide
Page 68 Chapter 3 - Default Meter Functionality
Third Party ProtocolsModbus and DNP modules are factory configured and do not require basic configuration changes. Changing the factory configuration is an advanced setup procedure that requires an understanding of the protocol, as well as an understanding of the meter’s internal operation.
Refer to the technical notes DNP 3.0 and ION Technology, and Modbus and ION Technology for the appropriate list of parameters available for each protocol.
NOTE
The meter can also be configured to receive data through Modbus or DNP 3.0, though there is no factory-configured framework for receiving data through these protocols. For details on configuring your networkfor receiving data via Modbus or DNP 3.0, refer to the DNP Slave Import module and Modbus SlaveImport module descriptions in the online ION Programmer’s Reference, as well as the technical notesDNP 3.0 and ION Technology, and Modbus and ION Technology.
Communications Protocol ConfigurationIn order to use the factory Modbus or DNP configuration you must first configure the communications channel you want to use. By default, all communications ports are configured to use the ION protocol. Choose the 3rd-party protocol you want from the list of available protocols in the Communications module’s Protocol setup register.
NOTE
Modbus RTU is available on each of the meter’s communications ports, and multiple ports cancommunicate using Modbus simultaneously. Only a single port can use the DNP 3.00 protocol at anyone time.

9500/9600 User’s Guide Using the Modbus RTU Protocol
Chapter 3 - Default Meter Functionality Page 69
Using the Modbus RTU ProtocolBoth the 9500 and 9600 meters can make any real-time data available through the Modicon Modbus RTU protocol. Modbus Master devices connected to the meter can access this data. Modbus Master devices can also write data into ION registers, making device configuration changes or initiating control actions.
The Factory Modbus Configuration
The meter makes data available to Modbus Master devices using four Modbus Slave modules. These modules are linked to other modules in the meter that provide the energy, power and demand data. Once a communications channel is configured to use Modbus RTU protocol, the data is available to Modbus Master devices.
NOTE
Connect to IP Service Port 7701 for Modbus RTU communications over Ethernet. The Modbus Unit ID ofthe meter over Ethernet is 100.
As the data available through the Modbus Slave modules is in a specific format, knowledge of the Modbus protocol and an understanding of the settings used in the meter are required to interpret the data provided.
Changing the Modbus Configuration
If the factory Modbus configuration does not suit your needs, the existing Modbus Slave modules can be relinked to other parameters that you want to access through Modbus.
If your Modbus Master device requires data in a format different than that provided by the factory Modbus configuration, you can edit the setup registers in the Modbus Slave modules. These setup registers specify the Modbus format, scaling and base address settings.
Refer to the online ION Programmer’s Reference for complete details on Modbus Slave module.
ION meter
Modbus SlaveModule
Power MeterModule
Measured data islinked to the Modbusmodule’s input.
Modbus Slave moduleoutputs data in Modbusformat
Data is availableto Modbus masterdevices
Set the COM portto the ModbusRTU protocol
Vln a 40011
Communications Port
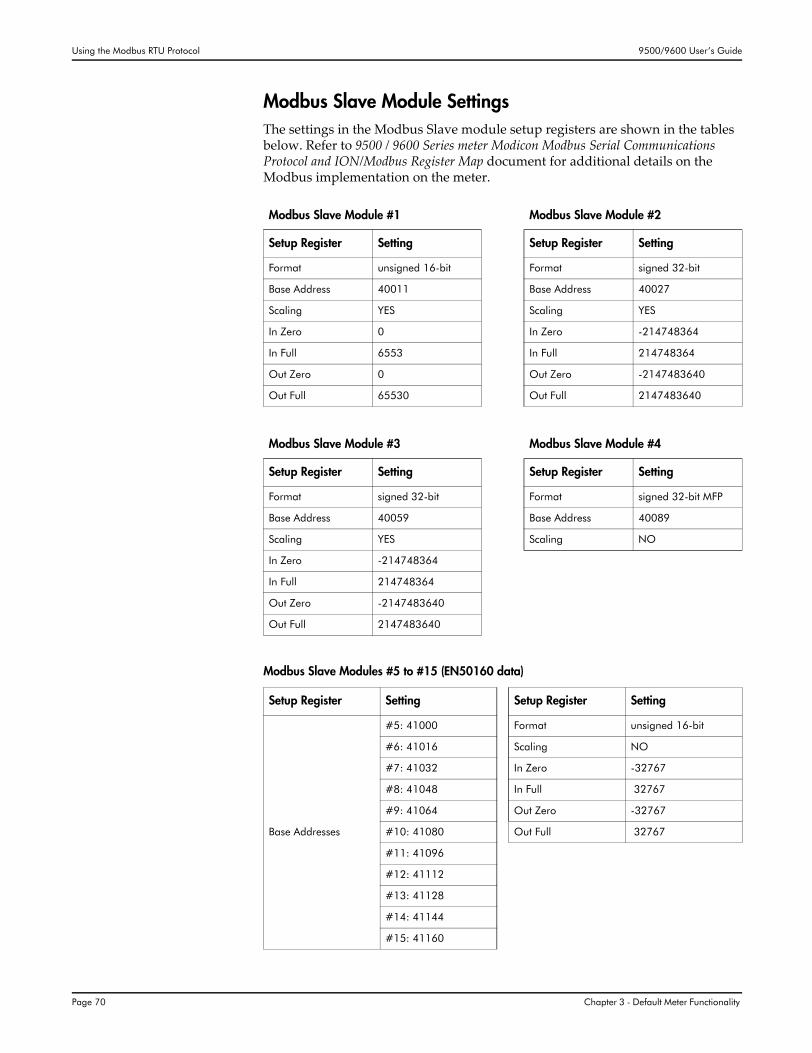
Using the Modbus RTU Protocol 9500/9600 User’s Guide
Page 70 Chapter 3 - Default Meter Functionality
Modbus Slave Module SettingsThe settings in the Modbus Slave module setup registers are shown in the tables below. Refer to 9500 / 9600 Series meter Modicon Modbus Serial Communications Protocol and ION/Modbus Register Map document for additional details on the Modbus implementation on the meter.
Modbus Slave Module #1 Modbus Slave Module #2
Setup Register Setting Setup Register Setting
Format unsigned 16-bit Format signed 32-bit
Base Address 40011 Base Address 40027
Scaling YES Scaling YES
In Zero 0 In Zero -214748364
In Full 6553 In Full 214748364
Out Zero 0 Out Zero -2147483640
Out Full 65530 Out Full 2147483640
Modbus Slave Module #3 Modbus Slave Module #4
Setup Register Setting Setup Register Setting
Format signed 32-bit Format signed 32-bit MFP
Base Address 40059 Base Address 40089
Scaling YES Scaling NO
In Zero -214748364
In Full 214748364
Out Zero -2147483640
Out Full 2147483640
Modbus Slave Modules #5 to #15 (EN50160 data)
Setup Register Setting Setup Register Setting
Base Addresses
#5: 41000 Format unsigned 16-bit
#6: 41016 Scaling NO
#7: 41032 In Zero -32767
#8: 41048 In Full 32767
#9: 41064 Out Zero -32767
#10: 41080 Out Full 32767
#11: 41096
#12: 41112
#13: 41128
#14: 41144
#15: 41160

9500/9600 User’s Guide Using the Modbus RTU Protocol
Chapter 3 - Default Meter Functionality Page 71
Modbus Slave Module Parameter MappingThe following tables show which measurements are provided by each of the Modbus Slave modules. The source for each measurement is shown (“Source ION Module”) so that you can easily delete parameters if you want to access different data. Note that the Modbus Register remains the same if you link a different parameter into one of the Modbus Slave module inputs (i.e. any value you link to Modbus Slave module #1, Source Input #1 will use Modbus Register 40011).
Measurement Label Source ION Module Modbus Module and Input Number Modbus Register
L-N Voltage Phase A Vln a Power Meter Modbus Slave #1 – Source Input #1 40011
L-N Voltage Phase B Vln b Power Meter Modbus Slave #1 – Source Input #2 40012
L-N Voltage Phase C Vln c Power Meter Modbus Slave #1 – Source Input #3 40013
Average L-N Voltage Vln avg Power Meter Modbus Slave #1 – Source Input #4 40014
L-L Voltage AB Vll ab Power Meter Modbus Slave #1 – Source Input #5 40015
L-L Voltage BC Vll bc Power Meter Modbus Slave #1 – Source Input #6 40016
L-L Voltage CA Vll ca Power Meter Modbus Slave #1 – Source Input #7 40017
Average L-L Voltage Vll avg Power Meter Modbus Slave #1 – Source Input #8 40018
Phase A Current I a Power Meter Modbus Slave #1 – Source Input #9 40019
Phase B Current I b Power Meter Modbus Slave #1 – Source Input #10 40020
Phase C Current I c Power Meter Modbus Slave #1 – Source Input #11 40021
Average Current I avg Power Meter Modbus Slave #1 – Source Input #12 40022
Voltage Unbalance V unbal Power Meter Modbus Slave #1 – Source Input #13 40023
Current Unbalance I unbal Power Meter Modbus Slave #1 – Source Input #14 40024
Line Frequency Freq Power Meter Modbus Slave #1 – Source Input #15 40025
Neutral Current I 4 Power Meter Modbus Slave #1 – Source Input #16 40026
Measurement Label Source ION Module Modbus Module and Input Number Modbus Register
Phase A kW kW a Power Meter Modbus Slave #2 – Source Input #1 40027
Phase B kW kW b Power Meter Modbus Slave #2 – Source Input #2 40029
Phase C kW kW c Power Meter Modbus Slave #2 – Source Input #3 40031-40032
Total kW kW tot Power Meter Modbus Slave #2 – Source Input #4 40033-40034
Phase A kVAR kVAR a Power Meter Modbus Slave #2 – Source Input #5 40035-40036
Phase B kVAR kVAR b Power Meter Modbus Slave #2 – Source Input #6 40037-40038
Phase C kVAR kVAR c Power Meter Modbus Slave #2 – Source Input #7 40039-40040
Total kVAR kVAR tot Power Meter Modbus Slave #2 – Source Input #8 40041-40042
Phase A kVA kVA a Power Meter Modbus Slave #2 – Source Input #9 40043-40044
Phase B kVA kVA b Power Meter Modbus Slave #2 – Source Input #10 40045-40046

Using the Modbus RTU Protocol 9500/9600 User’s Guide
Page 72 Chapter 3 - Default Meter Functionality
Phase V kVA kVA c Power Meter Modbus Slave #2 – Source Input #11 40047-40048
Total kVA kVA tot Power Meter Modbus Slave #2 – Source Input #12 40049-40050
Phase A signed PF PF sign a Power Meter Modbus Slave #2 – Source Input #13 40051-40052
Phase B signed PF PF sign b Power Meter Modbus Slave #2 – Source Input #14 40053-40054
Phase C signed PF PF sign c Power Meter Modbus Slave #2 – Source Input #15 40055-40056
Average signed PF PF signed tot Power Meter Modbus Slave #2 – Source Input #16 40057-40058
Measurement Label Source ION Module Modbus Module and Input Number Modbus Register
Maximum Avg L-L Voltage Vll avg mx Maximum Modbus Slave #3 – Source Input #1 40059 to 40060
Maximum Average Current I avg mx Maximum Modbus Slave #3 – Source Input #2 40061 to 40062
Maximum Total kW kW tot mx Maximum Modbus Slave #3 – Source Input #3 40063 to 40064
Maximum Total kVAR kVAR tot mx Maximum Modbus Slave #3 – Source Input #4 40065 to 40066
Maximum Total kVA kVA tot mx Maximum Modbus Slave #3 – Source Input #5 40067 to 40068
Maximum Line Frequency Freq mx Maximum Modbus Slave #3 – Source Input #6 40069 to 40070
Minimum Avg L-L Voltage Vll avg mn Minimum Modbus Slave #3 – Source Input #7 40071 to 40072
Minimum Average Current I avg mn Minimum Modbus Slave #3 – Source Input #8 40073 to 40074
Minimum Line Frequency Freq mn Minimum Modbus Slave #3 – Source Input #9 40075 to 40076
kW Sliding Window Demand kW sd del-rec Sliding Win Demand Modbus Slave #3 – Source Input #10 40077 to 40078
kVA Sliding Window Demand KVA sd del+rec Sliding Win Demand Modbus Slave #3 – Source Input #11 40079 to 40080
kVAR Sliding Window Demand
kVAR sd del-rec Sliding Win Demand Modbus Slave #3 – Source Input #12 40081 to 40082
Maximum kW SW Demand kW sd mx del-rec
Maximum Modbus Slave #3 – Source Input #13 40083 to 40084
Maximum kVA SW Demand kVA sd mx del+rec Maximum Modbus Slave #3 – Source Input #14 40085 to 40086
Maximum kVAR SW Demand kVAR sd mx del-rec Maximum Modbus Slave #3 – Source Input #15 40087 to 40088
Phase reversal indicator(0=no reversal; 1=reversal)
Phase Rev Power Meter Modbus Slave #3 – Source Input #16 40089 to 40090
Measurement Label Source ION Module Modbus Module and Input Number Modbus Register
Imported kWh kWh del Integrator Modbus Slave #4 – Source Input #1 40091 to 40092
Exported kWh kWh rec Integrator Modbus Slave #4 – Source Input #2 40093 to 40094
Total kWh kWh del+rec Integrator Modbus Slave #4 – Source Input #3 40095 to 40096
Net kWh kWh del-rec Integrator Modbus Slave #4 – Source Input #4 40097 to 40098
Imported kVARh kVARh del Integrator Modbus Slave #4 – Source Input #5 40099 to 40100
Measurement Label Source ION Module Modbus Module and Input Number Modbus Register

9500/9600 User’s Guide Using the Modbus RTU Protocol
Chapter 3 - Default Meter Functionality Page 73
Exported kVARh kVARh rec Integrator Modbus Slave #4 – Source Input #6 40101 to 40102
Total kVARh kVARh del+rec Integrator Modbus Slave #4 – Source Input #7 40103 to 40104
Net kVARhkVARh del-rec Integrator Modbus Slave #4 – Source Input #8 40105 to 40106
Total kVAh kVAh del+rec Integrator Modbus Slave #4 – Source Input #9 40107 to 40108
Max Phase A Voltage THD V1 THD mx Maximum Modbus Slave #4 – Source Input #10 40109 to 40110
Max Phase B Voltage THD V2 THD mx Maximum Modbus Slave #4 – Source Input #11 40111 to 40112
Max Phase C Voltage THD V3 THD mx Maximum Modbus Slave #4 – Source Input #12 40113 to 40114
Max Phase A Current THD I1 THD mx Maximum Modbus Slave #4 – Source Input #13 40115 to 40116
Max Phase B Current THD I2 THD mx Maximum Modbus Slave #4 – Source Input #14 40117 to 40118
Max Phase C Current THD I3 THD mx Maximum Modbus Slave #4 – Source Input #15 40119 to 40120
(unused) (unused) (unused) Modbus Slave #4 – Source Input #16 (unused)
Measurement Label Source ION Module Modbus Module and Input Number Modbus Register
EN50160 parameters– refer to Appendix A for more information about EN50160.
V1-Flck N Signal Limit Evaluation Modbus Slave #5 – Source Input #1 41000
V1-Flck N1 Signal Limit Evaluation Modbus Slave #5 – Source Input #2 41001
V2-Flck N Signal Limit Evaluation Modbus Slave #5 – Source Input #3 41002
V2-Flck N1 Signal Limit Evaluation Modbus Slave #5 – Source Input #4 41003
V3-Flck N Signal Limit Evaluation Modbus Slave #5 – Source Input #5 41004
V3-Flck N1 Signal Limit Evaluation Modbus Slave #5 – Source Input #6 41005
Freq N Signal Limit Evaluation Modbus Slave #5 – Source Input #7 41006
Freq N1 Signal Limit Evaluation Modbus Slave #5 – Source Input #8 41007
Freq N2 Signal Limit Evaluation Modbus Slave #5 – Source Input #9 41008
V1-Mag N Signal Limit Evaluation Modbus Slave #5 – Source Input #10 41009
V1-Mag N1 Signal Limit Evaluation Modbus Slave #5 – Source Input #11 41010
V2-Mag N Signal Limit Evaluation Modbus Slave #5 – Source Input #12 41011
V2-Mag N1 Signal Limit Evaluation Modbus Slave #5 – Source Input #13 41012
V3-Mag N Signal Limit Evaluation Modbus Slave #5 – Source Input #14 41013
V3-Mag N1 Signal Limit Evaluation Modbus Slave #5 – Source Input #15 41014
Vunbal N Signal Limit Evaluation Modbus Slave #5 – Source Input #16 41015
Measurement Label Source ION Module Modbus Module and Input Number Modbus Register
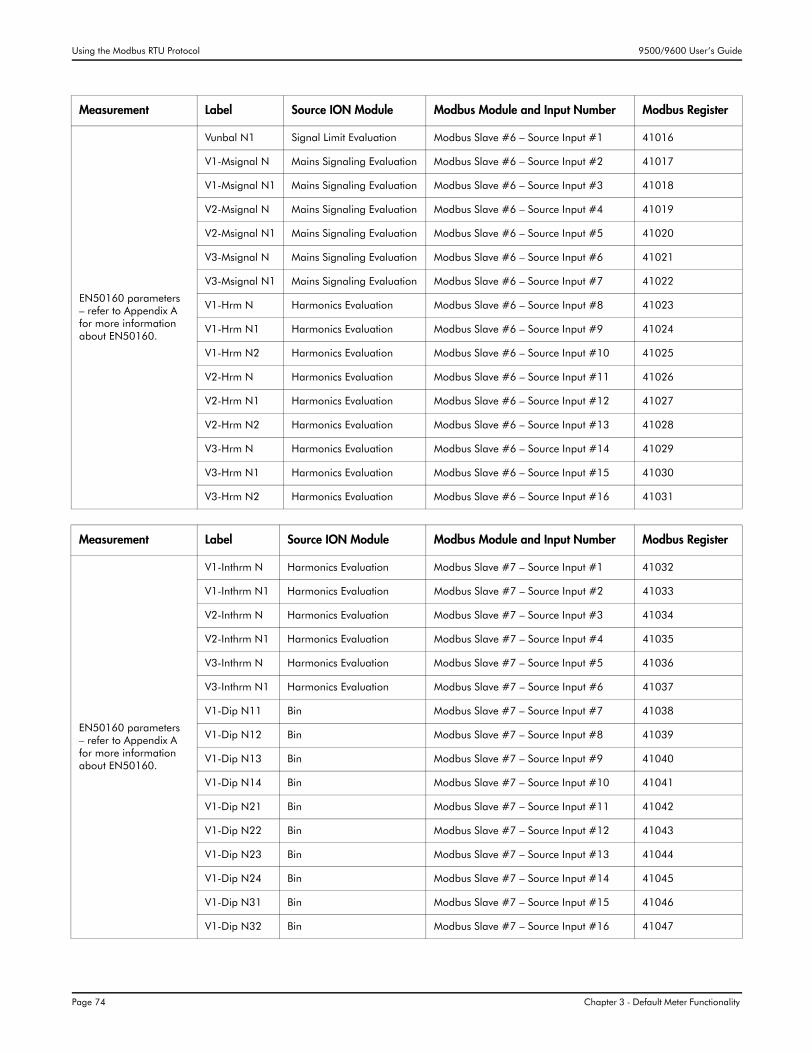
Using the Modbus RTU Protocol 9500/9600 User’s Guide
Page 74 Chapter 3 - Default Meter Functionality
Measurement Label Source ION Module Modbus Module and Input Number Modbus Register
EN50160 parameters– refer to Appendix A for more information about EN50160.
Vunbal N1 Signal Limit Evaluation Modbus Slave #6 – Source Input #1 41016
V1-Msignal N Mains Signaling Evaluation Modbus Slave #6 – Source Input #2 41017
V1-Msignal N1 Mains Signaling Evaluation Modbus Slave #6 – Source Input #3 41018
V2-Msignal N Mains Signaling Evaluation Modbus Slave #6 – Source Input #4 41019
V2-Msignal N1 Mains Signaling Evaluation Modbus Slave #6 – Source Input #5 41020
V3-Msignal N Mains Signaling Evaluation Modbus Slave #6 – Source Input #6 41021
V3-Msignal N1 Mains Signaling Evaluation Modbus Slave #6 – Source Input #7 41022
V1-Hrm N Harmonics Evaluation Modbus Slave #6 – Source Input #8 41023
V1-Hrm N1 Harmonics Evaluation Modbus Slave #6 – Source Input #9 41024
V1-Hrm N2 Harmonics Evaluation Modbus Slave #6 – Source Input #10 41025
V2-Hrm N Harmonics Evaluation Modbus Slave #6 – Source Input #11 41026
V2-Hrm N1 Harmonics Evaluation Modbus Slave #6 – Source Input #12 41027
V2-Hrm N2 Harmonics Evaluation Modbus Slave #6 – Source Input #13 41028
V3-Hrm N Harmonics Evaluation Modbus Slave #6 – Source Input #14 41029
V3-Hrm N1 Harmonics Evaluation Modbus Slave #6 – Source Input #15 41030
V3-Hrm N2 Harmonics Evaluation Modbus Slave #6 – Source Input #16 41031
Measurement Label Source ION Module Modbus Module and Input Number Modbus Register
EN50160 parameters– refer to Appendix A for more information about EN50160.
V1-Inthrm N Harmonics Evaluation Modbus Slave #7 – Source Input #1 41032
V1-Inthrm N1 Harmonics Evaluation Modbus Slave #7 – Source Input #2 41033
V2-Inthrm N Harmonics Evaluation Modbus Slave #7 – Source Input #3 41034
V2-Inthrm N1 Harmonics Evaluation Modbus Slave #7 – Source Input #4 41035
V3-Inthrm N Harmonics Evaluation Modbus Slave #7 – Source Input #5 41036
V3-Inthrm N1 Harmonics Evaluation Modbus Slave #7 – Source Input #6 41037
V1-Dip N11 Bin Modbus Slave #7 – Source Input #7 41038
V1-Dip N12 Bin Modbus Slave #7 – Source Input #8 41039
V1-Dip N13 Bin Modbus Slave #7 – Source Input #9 41040
V1-Dip N14 Bin Modbus Slave #7 – Source Input #10 41041
V1-Dip N21 Bin Modbus Slave #7 – Source Input #11 41042
V1-Dip N22 Bin Modbus Slave #7 – Source Input #12 41043
V1-Dip N23 Bin Modbus Slave #7 – Source Input #13 41044
V1-Dip N24 Bin Modbus Slave #7 – Source Input #14 41045
V1-Dip N31 Bin Modbus Slave #7 – Source Input #15 41046
V1-Dip N32 Bin Modbus Slave #7 – Source Input #16 41047

9500/9600 User’s Guide Using the Modbus RTU Protocol
Chapter 3 - Default Meter Functionality Page 75
Measurement Label Source ION Module Modbus Module and Input Number Modbus Register
EN50160 parameters– refer to Appendix A for more information about EN50160.
V1-Dip N33 Bin Modbus Slave #8 – Source Input #1 41048
V1-Dip N34 Bin Modbus Slave #8 – Source Input #2 41049
V1-Dip N41 Bin Modbus Slave #8 – Source Input #3 41050
V1-Dip N42 Bin Modbus Slave #8 – Source Input #4 41051
V1-Dip N43 Bin Modbus Slave #8 – Source Input #5 41052
V1-Dip N44 Bin Modbus Slave #8 – Source Input #6 41053
V1-Dip N51 Bin Modbus Slave #8 – Source Input #7 41054
V1-Dip N52 Bin Modbus Slave #8 – Source Input #8 41055
V1-Dip N53 Bin Modbus Slave #8 – Source Input #9 41056
V1-Dip N54 Bin Modbus Slave #8 – Source Input #10 41057
V1-Dip N61 Bin Modbus Slave #8 – Source Input #11 41058
V1-Dip N62 Bin Modbus Slave #8 – Source Input #12 41059
V1-Dip N63 Bin Modbus Slave #8 – Source Input #13 41060
V1-Dip N64 Bin Modbus Slave #8 – Source Input #14 41061
V2-Dip N11 Bin Modbus Slave #8 – Source Input #15 41062
V2-Dip N12 Bin Modbus Slave #8 – Source Input #16 41063
Measurement Label Source ION Module Modbus Module and Input Number Modbus Register
EN50160 parameters– refer to Appendix A for more information about EN50160.
V2-Dip N13 Bin Modbus Slave #9 – Source Input #1 41064
V2-Dip N14 Bin Modbus Slave #9 – Source Input #2 41065
V2-Dip N21 Bin Modbus Slave #9 – Source Input #3 41066
V2-Dip N22 Bin Modbus Slave #9 – Source Input #4 41067
V2-Dip N23 Bin Modbus Slave #9 – Source Input #5 41068
V2-Dip N24 Bin Modbus Slave #9 – Source Input #6 41069
V2-Dip N31 Bin Modbus Slave #9 – Source Input #7 41070
V2-Dip N32 Bin Modbus Slave #9 – Source Input #8 41071
V2-Dip N33 Bin Modbus Slave #9 – Source Input #9 41072
V2-Dip N34 Bin Modbus Slave #9 – Source Input #10 41073
V2-Dip N41 Bin Modbus Slave #9 – Source Input #11 41074
V2-Dip N42 Bin Modbus Slave #9 – Source Input #12 41075
V2-Dip N43 Bin Modbus Slave #9 – Source Input #13 41076
V2-Dip N44 Bin Modbus Slave #9 – Source Input #14 41077
V2-Dip N51 Bin Modbus Slave #9 – Source Input #15 41078
V2-Dip N52 Bin Modbus Slave #9 – Source Input #16 41079

Using the Modbus RTU Protocol 9500/9600 User’s Guide
Page 76 Chapter 3 - Default Meter Functionality
Measurement Label Source ION Module Modbus Module and Input Number Modbus Register
EN50160 parameters– refer to Appendix A for more information about EN50160.
V2-Dip N53 Bin Modbus Slave #10 – Source Input #1 41080
V2-Dip N54 Bin Modbus Slave #10 – Source Input #2 41081
V2-Dip N61 Bin Modbus Slave #10 – Source Input #3 41082
V2-Dip N62 Bin Modbus Slave #10 – Source Input #4 41083
V2-Dip N63 Bin Modbus Slave #10 – Source Input #5 41084
V2-Dip N64 Bin Modbus Slave #10 – Source Input #6 41085
V3-Dip N11 Bin Modbus Slave #10 – Source Input #7 41086
V3-Dip N12 Bin Modbus Slave #10 – Source Input #8 41087
V3-Dip N13 Bin Modbus Slave #10 – Source Input #9 41088
V3-Dip N14 Bin Modbus Slave #10 – Source Input #10 41089
V3-Dip N21 Bin Modbus Slave #10 – Source Input #11 41090
V3-Dip N22 Bin Modbus Slave #10 – Source Input #12 41091
V3-Dip N23 Bin Modbus Slave #10 – Source Input #13 41092
V3-Dip N24 Bin Modbus Slave #10 – Source Input #14 41093
V3-Dip N31 Bin Modbus Slave #10 – Source Input #15 41094
V3-Dip N32 Bin Modbus Slave #10 – Source Input #16 41095
Measurement Label Source ION Module Modbus Module and Input Number Modbus Register
EN50160 parameters– refer to Appendix A for more information about EN50160.
V3-Dip N33 Bin Modbus Slave #11 – Source Input #1 41096
V3-Dip N34 Bin Modbus Slave #11 – Source Input #2 41097
V3-Dip N41 Bin Modbus Slave #11 – Source Input #3 41098
V3-Dip N42 Bin Modbus Slave #11 – Source Input #4 41099
V3-Dip N43 Bin Modbus Slave #11 – Source Input #5 41100
V3-Dip N44 Bin Modbus Slave #11 – Source Input #6 41101
V3-Dip N51 Bin Modbus Slave #11 – Source Input #7 41102
V3-Dip N52 Bin Modbus Slave #11 – Source Input #8 41103
V3-Dip N53 Bin Modbus Slave #11 – Source Input #9 41104
V3-Dip N54 Bin Modbus Slave #11 – Source Input #10 41105
V3-Dip N61 Bin Modbus Slave #11 – Source Input #11 41106
V3-Dip N62 Bin Modbus Slave #11 – Source Input #12 41107
V3-Dip N63 Bin Modbus Slave #11 – Source Input #13 41108
V3-Dip N64 Bin Modbus Slave #11 – Source Input #14 41109
V1-Intrpt N1 Bin Modbus Slave #11 – Source Input #15 41110
V1-Intrpt N2 Bin Modbus Slave #11 – Source Input #16 41111
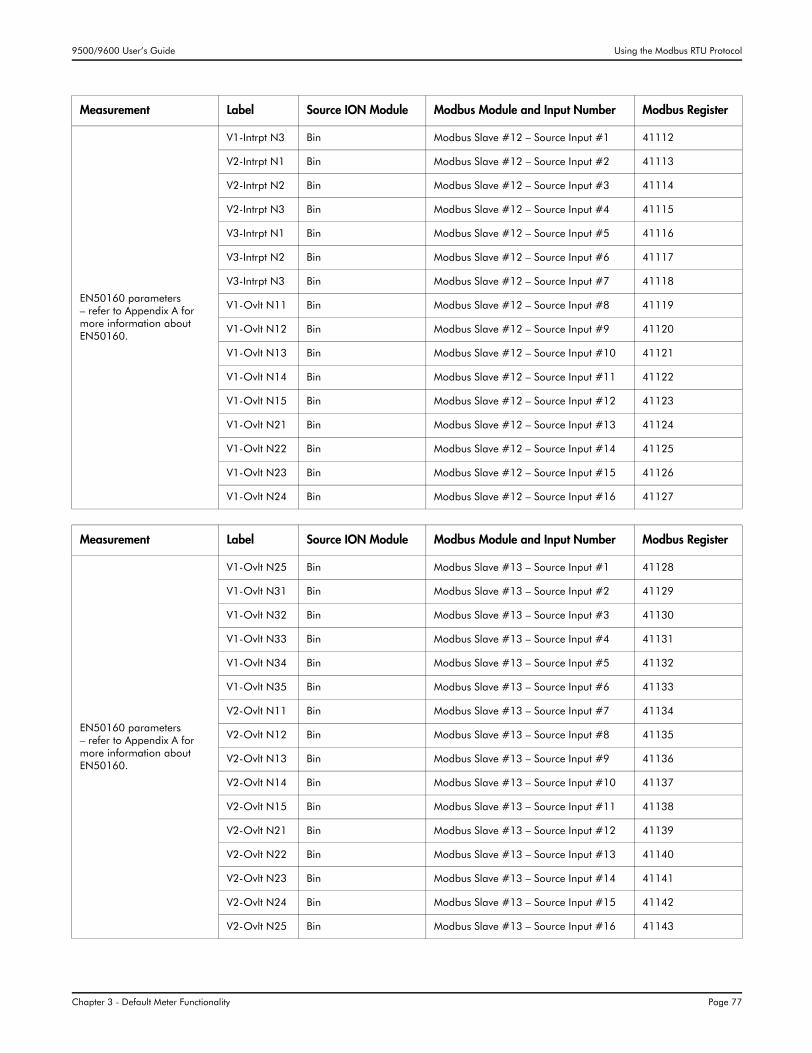
9500/9600 User’s Guide Using the Modbus RTU Protocol
Chapter 3 - Default Meter Functionality Page 77
Measurement Label Source ION Module Modbus Module and Input Number Modbus Register
EN50160 parameters– refer to Appendix A for more information about EN50160.
V1-Intrpt N3 Bin Modbus Slave #12 – Source Input #1 41112
V2-Intrpt N1 Bin Modbus Slave #12 – Source Input #2 41113
V2-Intrpt N2 Bin Modbus Slave #12 – Source Input #3 41114
V2-Intrpt N3 Bin Modbus Slave #12 – Source Input #4 41115
V3-Intrpt N1 Bin Modbus Slave #12 – Source Input #5 41116
V3-Intrpt N2 Bin Modbus Slave #12 – Source Input #6 41117
V3-Intrpt N3 Bin Modbus Slave #12 – Source Input #7 41118
V1-Ovlt N11 Bin Modbus Slave #12 – Source Input #8 41119
V1-Ovlt N12 Bin Modbus Slave #12 – Source Input #9 41120
V1-Ovlt N13 Bin Modbus Slave #12 – Source Input #10 41121
V1-Ovlt N14 Bin Modbus Slave #12 – Source Input #11 41122
V1-Ovlt N15 Bin Modbus Slave #12 – Source Input #12 41123
V1-Ovlt N21 Bin Modbus Slave #12 – Source Input #13 41124
V1-Ovlt N22 Bin Modbus Slave #12 – Source Input #14 41125
V1-Ovlt N23 Bin Modbus Slave #12 – Source Input #15 41126
V1-Ovlt N24 Bin Modbus Slave #12 – Source Input #16 41127
Measurement Label Source ION Module Modbus Module and Input Number Modbus Register
EN50160 parameters– refer to Appendix A for more information about EN50160.
V1-Ovlt N25 Bin Modbus Slave #13 – Source Input #1 41128
V1-Ovlt N31 Bin Modbus Slave #13 – Source Input #2 41129
V1-Ovlt N32 Bin Modbus Slave #13 – Source Input #3 41130
V1-Ovlt N33 Bin Modbus Slave #13 – Source Input #4 41131
V1-Ovlt N34 Bin Modbus Slave #13 – Source Input #5 41132
V1-Ovlt N35 Bin Modbus Slave #13 – Source Input #6 41133
V2-Ovlt N11 Bin Modbus Slave #13 – Source Input #7 41134
V2-Ovlt N12 Bin Modbus Slave #13 – Source Input #8 41135
V2-Ovlt N13 Bin Modbus Slave #13 – Source Input #9 41136
V2-Ovlt N14 Bin Modbus Slave #13 – Source Input #10 41137
V2-Ovlt N15 Bin Modbus Slave #13 – Source Input #11 41138
V2-Ovlt N21 Bin Modbus Slave #13 – Source Input #12 41139
V2-Ovlt N22 Bin Modbus Slave #13 – Source Input #13 41140
V2-Ovlt N23 Bin Modbus Slave #13 – Source Input #14 41141
V2-Ovlt N24 Bin Modbus Slave #13 – Source Input #15 41142
V2-Ovlt N25 Bin Modbus Slave #13 – Source Input #16 41143

Using the Modbus RTU Protocol 9500/9600 User’s Guide
Page 78 Chapter 3 - Default Meter Functionality
Importing Data using Modbus RTU
It is possible to bring data into the meter using Modbus. Various ION registers can be written by Modbus Master devices by correlating the Modbus register number with the address of the ION register you want to write. When a Modbus register is written with a value, the corresponding ION register will be written, provided the Modbus RTU protocol is active on the communications channel that connects the Modbus Master to the meter.
Measurement Label Source ION Module Modbus Module and Input Number Modbus Register
EN50160 parameters– refer to Appendix A for more information about EN50160.
V2-Ovlt N31 Bin Modbus Slave #14 – Source Input #1 41144
V2-Ovlt N32 Bin Modbus Slave #14 – Source Input #2 41145
V2-Ovlt N33 Bin Modbus Slave #14 – Source Input #3 41146
V2-Ovlt N34 Bin Modbus Slave #14 – Source Input #4 41147
V2-Ovlt N35 Bin Modbus Slave #14 – Source Input #5 41148
V3-Ovlt N11 Bin Modbus Slave #14 – Source Input #6 41149
V3-Ovlt N12 Bin Modbus Slave #14 – Source Input #7 41150
V3-Ovlt N13 Bin Modbus Slave #14 – Source Input #8 41151
V3-Ovlt N14 Bin Modbus Slave #14 – Source Input #9 41152
V3-Ovlt N15 Bin Modbus Slave #14 – Source Input #10 41153
V3-Ovlt N21 Bin Modbus Slave #14 – Source Input #11 41154
V3-Ovlt N22 Bin Modbus Slave #14 – Source Input #12 41155
V3-Ovlt N23 Bin Modbus Slave #14 – Source Input #13 41156
V3-Ovlt N24 Bin Modbus Slave #14 – Source Input #14 41157
V3-Ovlt N25 Bin Modbus Slave #14 – Source Input #15 41158
V3-Ovlt-N31 Bin Modbus Slave #14 – Source Input #16 41159
Measurement Label Source ION Module Modbus Module and Input Number Modbus Register
EN50160 parameters– refer to Appendix A for more information about EN50160.
V3-Ovlt-N32 Bin Modbus Slave #15 – Source Input #1 41160
V3-Ovlt-N33 Bin Modbus Slave #15 – Source Input #2 41161
V3-Ovlt-N34 Bin Modbus Slave #15 – Source Input #3 41162
V3-Ovlt-N35 Bin Modbus Slave #15 – Source Input #4 41163
(unused) (unused) (unused) Modbus Slave #15 – Source Input #5 to #16 (unused)

9500/9600 User’s Guide Using the Modbus/TCP Protocol
Chapter 3 - Default Meter Functionality Page 79
You can use the Modbus RTU protocol to write values into ION external numeric, pulse and Boolean registers, allowing you to enable, disable and reset meter functions. You can also use the Modbus protocol to change setup register values in various ION modules to configure the meter’s operation.To bring data into the meter with Modbus RTU, you must disable the meter’s password security. Information about writing ION registers through Modbus is available in the9500 / 9600 Series meter Modicon Modbus Serial Communications Protocol document.
Using the Modbus/TCP ProtocolModbus/TCP is the newest open Modbus protocol variant (formerly called MBAP). It defines the packet structure and connection port (port 502) for the industry standard TCP/IP protocol. The structure of Modbus/TCP is very similar to the Modbus RTU packet except that it has an extra six-byte header and does not use the cyclic redundancy check (CRC). Some of the newest ION firmware now supports Modbus/TCP for direct communications with the meter.
Modbus/TCP retains the Modbus RTU limit of 256 bytes to a packet. It is suggested that higher through-put is possible if this limitation is removed. This variant is called Enhanced Modbus/TCP but, so far, few devices have moved to support it.
Modbus TCP CommunicationsYou can now communicate to the meter via Modbus TCP (formerly called MBAP). Your meter must have the optional Ethernet port. Connect to socket 502.
Be aware that you cannot form an EtherGate to the Modbus TCP network.
Ethernet Connect to socket 502
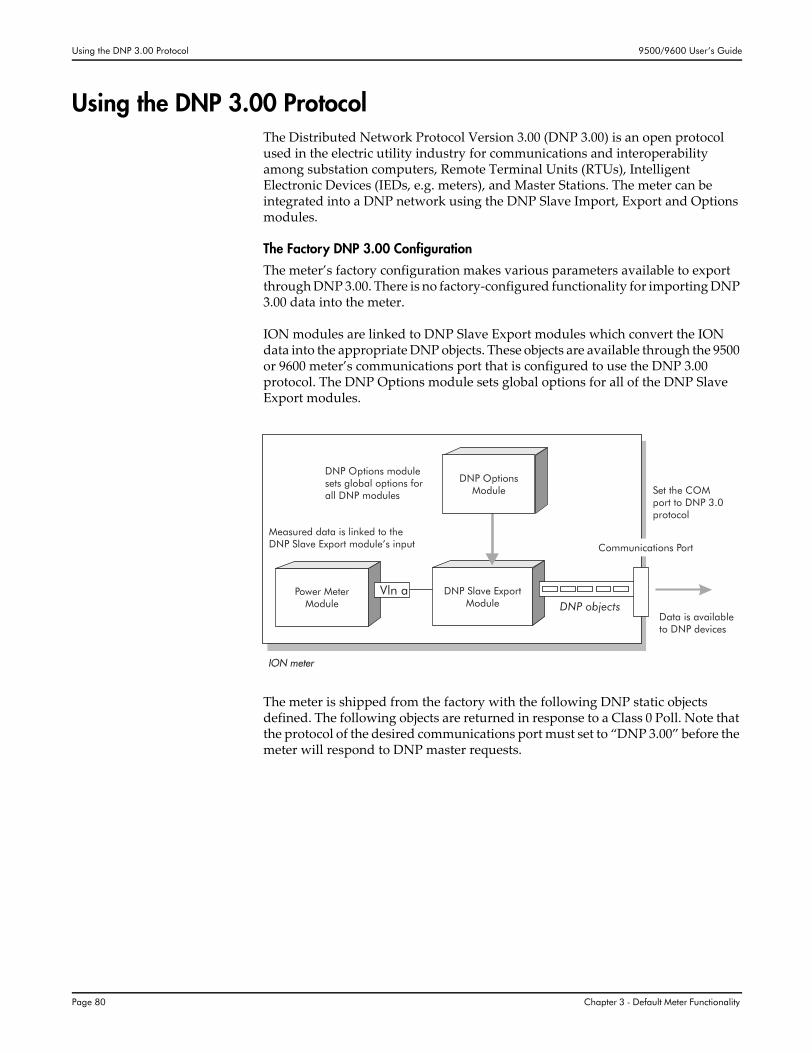
Using the DNP 3.00 Protocol 9500/9600 User’s Guide
Page 80 Chapter 3 - Default Meter Functionality
Using the DNP 3.00 ProtocolThe Distributed Network Protocol Version 3.00 (DNP 3.00) is an open protocol used in the electric utility industry for communications and interoperability among substation computers, Remote Terminal Units (RTUs), Intelligent Electronic Devices (IEDs, e.g. meters), and Master Stations. The meter can be integrated into a DNP network using the DNP Slave Import, Export and Options modules.
The Factory DNP 3.00 Configuration
The meter’s factory configuration makes various parameters available to export through DNP 3.00. There is no factory-configured functionality for importing DNP 3.00 data into the meter.
ION modules are linked to DNP Slave Export modules which convert the ION data into the appropriate DNP objects. These objects are available through the 9500 or 9600 meter’s communications port that is configured to use the DNP 3.00 protocol. The DNP Options module sets global options for all of the DNP Slave Export modules.
The meter is shipped from the factory with the following DNP static objects defined. The following objects are returned in response to a Class 0 Poll. Note that the protocol of the desired communications port must set to “DNP 3.00” before the meter will respond to DNP master requests.
ION meter
DNP Slave ExportModule
Power MeterModule
Vln a
DNP objects
DNP Options modulesets global options forall DNP modules
Set the COMport to DNP 3.0protocol
Data is availableto DNP devices
Measured data is linked to theDNP Slave Export module’s input Communications Port
DNP OptionsModule

9500/9600 User’s Guide Using the DNP 3.00 Protocol
Chapter 3 - Default Meter Functionality Page 81
Analog Input Objects (16-Bit Analog Input without Flag) (Object 30, Variation 4)
Point Label Measurement DNP Module and Input Number Scaling
0 Vln a L-N Voltage Phase A DNP Slave Export #1 – Source Input #1 x1
1 Vln b L-N Voltage Phase B DNP Slave Export #1 – Source Input #2 x1
2 Vln c L-N Voltage Phase C DNP Slave Export #1 – Source Input #3 x1
3 Vln avg Average L-N Voltage DNP Slave Export #1 – Source Input #4 x1
4 Vll ab L-L Voltage AB DNP Slave Export #2 – Source Input #1 x1
5 Vll bc L-L Voltage BC DNP Slave Export #2 – Source Input #2 x1
6 Vll ca L-L Voltage CA DNP Slave Export #2 – Source Input #3 x1
7 Vll avg Average L-L Voltage DNP Slave Export #2 – Source Input #4 x1
8 I a Phase A Current DNP Slave Export #3 – Source Input #1 x1
9 I b Phase B Current DNP Slave Export #3 – Source Input #2 x1
10 I c Phase B Current DNP Slave Export #3 – Source Input #3 x1
11 I avg Average Current DNP Slave Export #3 – Source Input #4 x1
12 kW a Phase A kW DNP Slave Export #4 – Source Input #1 x1
13 kW b Phase B kW DNP Slave Export #4 – Source Input #2 x1
14 kW c Phase C kW DNP Slave Export #4 – Source Input #3 x1
15 kW tot Total kW DNP Slave Export #4 – Source Input #4 x1
16 kVAR a Phase A kVAR DNP Slave Export #5 – Source Input #1 x1
17 kVAR b Phase B kVAR DNP Slave Export #5 – Source Input #2 x1
18 kVAR c Phase C kVAR DNP Slave Export #5 – Source Input #3 x1
19 kVAR tot Total kVAR DNP Slave Export #5 – Source Input #4 x1
20 kVA a Phase A kVA DNP Slave Export #6 – Source Input #1 x1
21 kVA b Phase B kVA DNP Slave Export #6 – Source Input #2 x1
22 kVA c Phase C kVA DNP Slave Export #6 – Source Input #3 x1
23 kVA tot Total kVA DNP Slave Export #6 – Source Input #4 x1
24 PFsign a Phase A signed PF DNP Slave Export #7 – Source Input #1 x1
25 PFsign b Phase B signed PF DNP Slave Export #7 – Source Input #2 x1
26 PFsign c Phase C signed PF DNP Slave Export #7 – Source Input #3 x1
27 PF sign tot Average signed PF DNP Slave Export #7 – Source Input #4 x1
28 V unbal Voltage Unbalance DNP Slave Export #8 – Source Input #1 x10
29 I unbal Current Unbalance DNP Slave Export #8 – Source Input #2 x10
30 I4 Neutral Current DNP Slave Export #9 – Source Input #1 x1
31 Freq Line Frequency DNP Slave Export #10 – Source Input #1 x10
32 kW sd del – rec kW Sliding Window Demand DNP Slave Export #11 – Source Input #1 x1
33 kVAR sd del – rec kVAR Sliding Window Demand DNP Slave Export #11 – Source Input #2 x1
34 kVA sd del - rec kVA Sliding Window Demand DNP Slave Export #11 – Source Input #3 x1

Using the DNP 3.00 Protocol 9500/9600 User’s Guide
Page 82 Chapter 3 - Default Meter Functionality
Binary Counter Objects (16-Bit Binary Counter without Flag) (Object 20, Variation 6)
Changing the DNP Configuration
If the factory DNP configuration does not suit your needs, you can relink the existing DNP Slave Export modules to access a different set of parameters through DNP. Alternately, you can add additional DNP Slave Export modules and link the desired ION parameters to them. There are 16 DNP Slave Export modules available on the meter; of these, 14 are used by the factory configuration.
NOTE
Only one meter port can be used to communicate via DNP 3.00 at a time. More details about using theDNP protocol is available in the 9500 & 9600 DNP V3.00 Device Profile, available from www.pwrm.com.
If your DNP network requires data in a format different than that provided by the factory DNP configuration, you can edit the setup registers in the DNP Slave Export modules and the DNP Options module. Do not make any changes to the DNP Options module’s setup registers unless you understand the effects each change will cause. Refer to the online ION Programmer’s Reference for complete details on DNP Slave Export and DNP Options module function.
Consult the DNP User’s Group at http://www.dnp.org/ to learn more about the protocol.
Point Label Measurement DNP Module and Input Number Scaling
0 kWh del kWh Delivered DNP Slave Export #12 – Source Input #1 x1
1 kWh rec kWh Received DNP Slave Export #12 – Source Input #2 x1
2 kWh del+rec kWh Total DNP Slave Export #12 – Source Input #3 x1
3 kWh del-rec kWh Net DNP Slave Export #12 – Source Input #4 x1
4 kVARh del kVARh Delivered DNP Slave Export #13 – Source Input #1 x1
5 kVARh rec kVARh Received) DNP Slave Export #13 – Source Input #2 x1
6 kVARh del+rec kVARh Total DNP Slave Export #13 – Source Input #3 x1
7 kVARh del-rec kVARh Net DNP Slave Export #13 – Source Input #4 x1
8 kVAh del+rec kVAh Total DNP Slave Export #14 – Source Input #1 x1

9500/9600 User’s Guide Using the DNP 3.00 Protocol
Chapter 3 - Default Meter Functionality Page 83
DNP Slave Export Module SettingsThe factory-configured DNP Slave Export modules are configured as shown in the following table.
As the table indicates, some of the setup register settings vary for different modules. Specifically, BasePoint differs for each module within a group (Analog Input and Binary Counter are groups), and StaticObj is set to Analog Input for the 11 analog input points and Binary Counter for the three binary counter points. (StaticObj defines the type of DNP object the module provides when the Master polls it.)
In addition, Scaling is OFF for all but two modules. The only modules that apply scaling are the Analog Input points that provide Voltage and Current Unbalance data (labeled Unbalx10) and Frequency data (Labeled Freqx10). These modules apply x10 scaling.
Setup Register Setting
BasePoint Varies – each analog input or binary counter has a different BasePoint
StaticObj 11 modules are Analog Input; three are Binary Counter
EventObj Disable Event Objects
Deadband 0
FrozStaObj Disable Frozen Static Objects
FrozEvtObj Disable Frozen Event Objects
EventClass Class 1
Scaling OFF (excluding Unbalx10 and Freqx10 which are ON)
IONZero 0
IONFull 0 (1000 for Unbalx10 and 100 for Freqx10)
DNPZero 0
DNPFull 0 (10000 for Unbalx10 and 1000 for Freqx10)

Using the DNP 3.00 Protocol 9500/9600 User’s Guide
Page 84 Chapter 3 - Default Meter Functionality
DNP Options Module SettingsThe DNP Options module provides global settings that affect all DNP Slave Export and DNP Slave Import modules. The default settings in this module are shown in the following table.
Importing Data using DNP 3.00
Data can be imported into the meter from a DNP control relay or analog output device. DNP Slave Import modules are used to take a DNP Analog output or Binary output object and map them into ION registers. Refer to the DNP Slave Import module description in the online ION Programmer’s Reference for details.
Setup Register Setting Function
BinInStatic Single-bit Binary Input variant for Binary Input Static objects
BinInEvents Binary Input Change w/o time variant for Binary Input Event objects
BinInEvDepth 100 maximum number of Binary Input Events that can be stored
BinCntStatic 16-bit Binary Counter w/o flag variant for Binary Counter Static objects
FrzCntStatic 16-bit Frozen Counter w/o flag variant for Frozen Counter Static objects
FrzCntEvents 16-bit Frozen Counter Event w/o time variant for Frozen Counter Event objects
FrzCntEvDepth 100 maximum number of Frozen Counter Events that can be stored
CntChangeEvents 16-bit Counter Change Event w/o time variant for Counter Change Event objects
CntChangeEvDepth 100 maximum number of Counter Change Events that can be stored
AIStatic 16-bit Analog Input w/o flag variant for Analog Input Static objects
FrzAIStatic 16-bit Frozen Analog Input w/o flag variant returned from Class 0 poll for Frozen Analog Input Static objects
FrzAIEvents 16-bit Frozen Analog Event w/o time variant for Frozen Analog Input Event objects
FrzAIEvDepth 100 maximum number of Frozen Analog Input Events that can be stored
AIChangeEvents 16-bit Analog Input Change Event w/o time variant for Analog Input Change Event objects
AIChangeEvDepth 200 maximum number of Analog Input Change Events that can be stored
AOStatic 16-bit Analog Output Status variant for Analog Output Block objects
SelectTimeout 10 Select Before Operate timeout period (in seconds)
TimeSynchPeriod 86400 time (in seconds) between IED requests for time syncs
ALFragSize 2048 maximum application layer message size (in octets) that IED can send
DLAck Never when device will request data link layer acknowledgements
DLTimeout 2 how long data link layer waits for acknowledgement from Master
DLNumRetries 0 how many times a data link layer packet is re-sent after failing

9500/9600 User’s Guide Restoring the Factory Configuration
Chapter 3 - Default Meter Functionality Page 85
Restoring the Factory ConfigurationIf you have made changes to the default functionality and want to return to the factory configuration, you can re-initialize the factory configuration in the meter through Designer. The basic setup of the device can be retained, so the meter does not need to be taken out of service for a long period of time.
NOTE
If you restore the factory configuration, all custom features you created are lost.
To restore the factory configuration:
1. Display the meter’s main Configuration screen in Designer.
2. Choose Select All from the Edit menu, then press Delete on your keyboard.
The confirmation dialog box appears explaining that some modules will not be deleted (core modules cannot be deleted — scroll down in the dialog to see that various standard modules will be deleted).
3. Click OK on the confirmation dialog box.
After a brief wait the modules are deleted, and the main meter Configuration screen is blank except for the Frameworks folder in the Advanced Setup area. (The Frameworks folder contains the folder of Core modules which cannot be deleted.)
4. Choose Select All from the Edit menu to select the Frameworks folder. This selects all subfolders and modules within the folder.
5. In the Edit menu, choose Paste from Framework, then select the appropriate .fwn file from the folder \WinPM.Net\config\fmwk\nd\. Click OK.
The Factory module’s Default Template register tells you the filename for the default factory framework. (For details about framework files, contact Technical Services or visit the Siemens web site’s technical support area.)
6. Click Open. The Paste Summary window appears.
7. Click on the first module, scroll down to the last module, hold the Shift key and click on the last module. This selects all of the modules.
8. While holding the Shift key, click on the check box to the left of the module name so you see a lock icon with a green checkmark.
CAUTION
Persistent modules can be overwritten in Designer. When pasting a default framework onto a meter, uselock-paste on the Persistent modules, not free-paste. A list of Persistent modules is available on the Librarypage of Power Measurement's website, under "ION Device Templates".
9. Check “Maintain external inputs” and click OK on the confirmation dialog box.
A message appears indicating that Designer is pasting modules. All modules are selected when the paste is complete. Click anywhere in the background of the node diagram to deselect all of the modules.

Restoring the Factory Configuration 9500/9600 User’s Guide
Page 86 Chapter 3 - Default Meter Functionality
10. Click the Power Meter shortcut in the Basic Configuration area to select it. Once selected, click Reset in the Designer toolbar, or select Reset from the Edit menu. This reverts the Power Meter to the settings it had before you deleted any modules (retaining the basic setup you previously had).
11. Choose Send & Save from the File menu. The factory configuration is now restored (any custom functionality you created is removed).
NOTE
The time required to complete steps 3, 5, and 11 may vary depending on your connection and the meterconfiguration.

4 Using ACCESS Software
ACCESS software encompasses a variety of programs that enhance the functionality and usability of your ACCESS devices. ACCESS software can collect data via serial, wireless, modem, or Ethernet links, so you can manage a single site or global network of devices. WinPM.Net is a software suite with applications for displaying data, configuring ACCESS meters, performing system control, and much more. ION Setup is a stand-alone program that greatly simplifies meter configuration.
This chapter recognizes the various ACCESS software programs available to you, and provides instructions on each program’s use. Details on where to find more information on a program’s operation are included in that program’s introduction.
In This Chapter
WinPM.Net Software . . . . . . . . . . . . . . . . . . . . . . . . . . . . . . . . . . . . . . . . . 88
WinPM.Net: Management Console . . . . . . . . . . . . . . . . . . . . . . . . . . . . . . . 89Configuring Communications . . . . . . . . . . . . . . . . . . . . . . . . . . . . . . . . . . . . . . . . . . 91
WinPM.Net: Vista . . . . . . . . . . . . . . . . . . . . . . . . . . . . . . . . . . . . . . . . . . . 93Displaying Data with Vista . . . . . . . . . . . . . . . . . . . . . . . . . . . . . . . . . . . . . . . . . . . . 93Customizing the Vista Interface . . . . . . . . . . . . . . . . . . . . . . . . . . . . . . . . . . . . . . . . 101
WinPM.Net: Designer . . . . . . . . . . . . . . . . . . . . . . . . . . . . . . . . . . . . . . . 103Basics of ION Architecture . . . . . . . . . . . . . . . . . . . . . . . . . . . . . . . . . . . . . . . . . . . . 103Designer’s Main Configuration Screen . . . . . . . . . . . . . . . . . . . . . . . . . . . . . . . . . . 107Viewing Real-time Data in Designer . . . . . . . . . . . . . . . . . . . . . . . . . . . . . . . . . . . . 108Changing Setup Registers with Designer . . . . . . . . . . . . . . . . . . . . . . . . . . . . . . . . 108Customizing Frameworks in Designer . . . . . . . . . . . . . . . . . . . . . . . . . . . . . . . . . . 110
WinPM.Net: Reporter . . . . . . . . . . . . . . . . . . . . . . . . . . . . . . . . . . . . . . . 114Pre-configured Reports . . . . . . . . . . . . . . . . . . . . . . . . . . . . . . . . . . . . . . . . . . . . . . . 114Report Creation and Generation . . . . . . . . . . . . . . . . . . . . . . . . . . . . . . . . . . . . . . . 116
ION Setup Software . . . . . . . . . . . . . . . . . . . . . . . . . . . . . . . . . . . . . . . . 118Configuring Communications . . . . . . . . . . . . . . . . . . . . . . . . . . . . . . . . . . . . . . . . . 118Basic Meter Configuration . . . . . . . . . . . . . . . . . . . . . . . . . . . . . . . . . . . . . . . . . . . . 121Displaying Data with ION Setup . . . . . . . . . . . . . . . . . . . . . . . . . . . . . . . . . . . . . . . 122

WinPM.Net Software 9500/9600 User’s Guide
Page 88 Chapter 4 - Using ACCESS Software
WinPM.Net SoftwareWinPM.Net software offers control capabilities and comprehensive power quality and reliability analysis. It is a powerful software suite that can process, analyze, store, and share data across your entire enterprise. The fully networked client-server information system allows you to access data from any workstation, locally or around the world, in the formats you need. With WinPM.Net you can manage an intelligent ACCESS metering network, monitoring and controlling individual devices, analyzing data, and deciding on new courses of action.
WinPM.Net software has four main components, each with their own user interfaces. These applications are the Management Console, Vista, Designer, and Reporter.
If you require more information on WinPM.Net software than is presented here, refer to the:
online WinPM.Net Help
WinPM.Net Administrator Guide
WinPM.Net Client User Guide
Software SecurityThe software security system limits how you can use ACCESS software to view meter data and send configuration changes to ACCESS meters. A valid user account and password are required to log on to any ACCESS software application. Each access level, or authority, that is specified for a user account defines the types of operations available in each application, so you may not necessarily be allowed to view or configure meter information if your authority does not permit it.
WinPM.Net provides two default software security settings: guest and supervisor. Both of these default security settings use 0 (zero) for the password, and enable the highest level of authority which allows complete control of the system.
NOTE
Since both the software and the meter use password security, you may need to enter the softwarepassword, meter password, or both depending on the function you are performing.
For details on software security configuration, refer to the technical note ION Security.

9500/9600 User’s Guide WinPM.Net: Management Console
Chapter 4 - Using ACCESS Software Page 89
WinPM.Net: Management ConsoleThe Management Console is responsible for building your network. You build your power-monitoring network to reflect the way your physical communications network is wired so that WinPM.Net software can communicate with your devices. The network is created using servers, sites, devices, and modems. These network components must be configured in the Management Console before you can use the other WinPM.Net applications.
The following is a brief description of each network component. To learn how to configure these components, refer to the “Configuring Communications” on page 91.
Servers
A server is a computer in an WinPM.Net system running administrative software that controls access to the network and its resources, such as ACCESS devices, and provides resources to computers functioning as workstations on the network. A server runs service components that create communication and software links between ACCESS systems components, and it creates links into the ACCESS database, too.
Computers with primary and secondary WinPM.Net installations are servers, as they have the communication software (services) installed. A primary server contains all software components and the database; a secondary server contains software but references the primary server for program files and database information. Both server types connect directly to ACCESS devices via serial, Ethernet, or modem links, but there can be only one primary server on a network. When you install WinPM.Net, the Primary Server must be installed before any Secondary server or Client computers.
System Setup Pane
Display Window
Network Component Icon
Title Bar

WinPM.Net: Management Console 9500/9600 User’s Guide
Page 90 Chapter 4 - Using ACCESS Software
Sites
A site in an WinPM.Net system contains one or more intelligent devices that share a common communications link. There are three different types of sites, based on the type of communications medium each uses. The site types are as follows:
Direct (Serial) Site - a direct-connected RS-232 or RS-485 network
Modem Site - a remote serial site connected by a modem
Ethernet Gateway Site - a gateway that transfers data between an Ethernet device and an RS-485 chain of connected devices
NOTE
You are not required to create a site for an Ethernet Device, unless you intend to use the device as anEthernet Gateway Site.
Depending on the site type, devices belonging to a site may be at different physical locations.
Devices
Devices refer to intelligent devices (basic energy meters, multi-function monitoring/analysis/control devices, intelligent relays, etc.) that can be connected to an WinPM.Net network serially, via Ethernet, or through a gateway.
Serial Devices belong to Direct Sites or Modem Sites, so they communicate using modem, RS-232, or RS-485 connections. Before these types of devices can be added to the network, they require the prior configuration of a Direct Site or Modem Site.
Ethernet Devices are those that are directly connected to an Ethernet network. You are not required to create a site for an Ethernet Device, unless you intend to use the device as an Ethernet Gateway Site. Furthermore, you can manually connect and disconnect your Ethernet Devices from the Management Console.
Dialout Modems
A Dialout Modem is the modem that a server computer uses to communicate with a remote modem at a Modem Site.
Connection Schedules
Connection schedules are programmed routines for a server to regularly connect to and disconnect from Modem Sites and their associated ACCESS (or other) devices. If so desired, you can also create connection schedules from Direct Sites and Ethernet Devices / Ethernet Gateway Sites.

9500/9600 User’s Guide Configuring Communications
Chapter 4 - Using ACCESS Software Page 91
Configuring CommunicationsBefore you can talk to the devices on your network, you need to configure communications within the Management Console. Essentially, this means adding one or more sites and then adding the devices associated with each site. If you create a modem site, then you also need to add and configure a dialout modem. There may be instances where you want to add a new server (either another computer or third-party gateway); the computer running the WinPM.Net software is considered a server and is listed in the Server section.
Adding a new Server, Site, Device or Dialout Modem:
1. Click the appropriate network component icon (Servers, Sites, Devices, Dialout Modems) in the System Setup pane. The title bar reflects your selection.
2. Right-click in the display window, select New and the type of Server, Site, Device. If you are configuring a modem you only have one New option.
3. Configure the item using the drop-down list boxes and manually entering values where required.
4. Right click in the Properties dialog box to access Advanced Properties. You can use the drop-down list boxes or manually enter new values as required.
5. Click OK when you are done.
The process of adding network components to the Management Console is the same for each component — the difference lies in how you configure the components. When the Properties dialog appears for the component you added, the fields for which you are required to provide information are highlighted in red. For example, the illustration below shows the required fields when adding a new Ethernet device:
The Properties dialog has different required fields depending on which component you are adding:
For a Direct Site you specify the serial port (COM1, COM 2, etc.) on the server computer where the serial device (or network of serial devices) is connected. You must specify the server computer that communicates with the direct site.
For a Modem Site you provide information about the modem at the (remote) modem site: baud rate, modem telephone number, etc. You also specify the server computer that communicates with the modem site.
Although Group has a drop down list box, you are not restricted to the values in the list. If you want to create a new group, simply type its name in the value field.Other drop down list boxes restrict you to the values in the list.

Configuring Communications 9500/9600 User’s Guide
Page 92 Chapter 4 - Using ACCESS Software
For an Ethernet Gateway Site, you specify the Ethernet device acting as the gateway and the TCP/IP port to which the serial device, or network of serial devices, is connected. Before you can add an Ethernet Gateway Site, an Ethernet Device must be added and configured first.
For a Serial Device you provide the device type, the unit ID, and the site to which the meter is connected. Before you can add serial devices, a Serial or Modem Site must be added and configured first.
For an Ethernet Device you specify the type of meter, the meter’s IP address, and the server computer that communicates with the Ethernet device.
For a Dialout Modem, you provide the modem type, the computer that communicates over the modem channel, and the serial port used on the computer.
For a Computer (Server) you specify the machine’s computer name.
For a 3rd-Party Gateway (Server), you specify the name of the network host, the IP address of the gateway device, and the computer that communicates through the Ethernet gate
Complete details on working with the Management Console are available in the online WinPM.Net Help.

9500/9600 User’s Guide WinPM.Net: Vista
Chapter 4 - Using ACCESS Software Page 93
WinPM.Net: VistaVista is a display, analysis, and control application. It is the main user interface to the WinPM.Net system. Vista presents a graphical view of your power system, allowing you to view real-time data from power meters or historical data from the WinPM.Net database. It simplifies the tasks of managing your power system and transcends a number of physical device boundaries, so you can retrieve, store, and display data from any device in your system through a unified interface. Vista reports on the status of your power system components, informing you of alarm conditions and providing you with control capabilities for initiating intelligent device functions or actuating field machinery.
Displaying Data with VistaA standard set of Vista User Diagrams display real-time and logged data for various power system parameters. Interactive objects are provided on the diagrams that allow operators with appropriate authority to enable and disable logging functions and reset cumulative parameters.
A network diagram uses links to default user diagrams to display data from each device in your system. When you generate a network diagram, Vista automatically locates all devices in your system and displays them.
Generating a network diagram in Vista
1. Select Generate Network Diagram from the File menu.
The Network Diagram initially looks like this:
2. Click the appropriate grouping object. These are labelled according to the device’s “Group” value in the Management Console.
NOTE
If you have Show Toolbox selected in the Options menu, you must double-click diagram objects and iconsinstead of single clicking them.
Vista Grouping Object
Menu bar
Toolbar

Displaying Data with Vista 9500/9600 User’s Guide
Page 94 Chapter 4 - Using ACCESS Software
This opens a new window showing all of the installed meters. Each meter appears with an icon that represents its type and a label reflecting the name you configured in the Management Console.
3. Click a meter icon to open its main default diagram.
Each meter has a set of default diagrams that show the results of various real-time measurements and calculations that are being performed. Links to data, waveform, and event logs are also provided (if the meter supports logging).
You should now be able to navigate through the various diagrams and view real-time and logged data.
Displaying Data if the Software is Not Fully Configured
If WinPM.Net has been installed and configured using the recommended guidelines in the online WinPM.Net Help, the standard Vista user diagrams automatically display real-time data from your meter.
If you are unable to display data from your meter in Vista, contact your WinPM.Net software administrator, or refer to the online WinPM.Net Help before continuing with this User’s Guide.
Meter icons (representing configured devices in the Management Console)

9500/9600 User’s Guide Displaying Data with Vista
Chapter 4 - Using ACCESS Software Page 95
Vista Diagram ElementsEach Vista diagram shows the name of the meter, the time on the meter’s clock, and the type of meter. The main diagrams also provide buttons that let you jump to other diagrams. Jump to another diagram by clicking any of the buttons near the top right-hand corner (as illustrated in the Volts/Amps diagram below).
Most measurements appear on-screen in Vista numeric objects.
Some ON/OFF quantities, such as the status of a setpoint, may appear as status objects.
To view another screen or diagram, click on a grouping object. Grouping objects may be in the form of buttons, folders, meter icons, etc.
To return to the previous diagram, use the button on the Vista toolbar, or use the File > Up One Level menu item.
Level 3 WinPM.Net authority is required to use control objects.
Logged data (such as snapshot, interval and waveform data) can be accessed by
clicking the associated the data log viewer icon, which looks like this
To view a record of events and alarms for the active user diagram, click — the event log viewer icon.
To view records of high-priority events and alarms for your entire system, select the global event log viewer from the View pull-down menu.
Click this button to return to the Network Diagram.
This numeric object shows real-time data.
Logged data is available through these data log viewer objects.
Events and Alarms are available through the Event Log viewer.
Click this control object to enable/disable historic data logging.
Click any of these buttons (grouping objects) to jump to other diagrams.
This grouping object leads to Long-Term Min/Max data.

Displaying Data with Vista 9500/9600 User’s Guide
Page 96 Chapter 4 - Using ACCESS Software
Summary of Data Provided in VistaThe standard set of Vista diagrams included with WinPM.Net display a variety of data measured by the factory-configured meter. Some of the diagrams include grouping windows that display additional data. The following section summarizes the data, and interactive control functions provided.
Volts/Amps
The Volts/Amps diagram includes a simple power system illustration that shows various real-time parameters including: Line-to-neutral, line-to-line, average line-to-neutral, and line-to-line voltages, and voltage unbalance level.
The diagram also includes links to a min/max parameter display, the meter’s event log, and various historical data logs. A control object is provided for disabling/enabling historic data.
Historic Data Logging Enable The Log Server must be running to view historical data.
Historic data logging is enabled by default.
The control object indicates the logging enable status: the switch is in the up position (1) when logging is enabled and down (0) when logging is disabled.
Long-Term Min/Max MeasurementsClick the Long-Term Min/Max object in the Volts/Amps diagram to see the Long-Term Min/Max Measurements window. It displays min/max values for line-to-line and line-to-neutral voltages, power factor, and frequency. Min/max values can be reset with the Min/Max Reset Object. All min/max values are valid from the time the last reset was performed.
Power Quality
The Power Quality diagram shows voltage disturbance and harmonics details. For an 9600 meter, these details are on the Basic Overview tab of the Power Quality diagram. The details include:
Running total of sag/swell events
Running total of transient events (9600 only)
NOTE
The 9600 features dual waveform capture: Sags are recorded at 32 samples x 54 cycles. Transientswaveform capture at 256 samples x 7 cycles.
ITI (CBEMA) plot of power quality events (Log Server must be running)
Captured waveforms & sequence-of-events log (Log Server must be running)
Phase voltage and current THD as a percentage of phase measurements
Min/max display of phase voltage and current THD
Trend logs of voltage THD, current THD, and current K-factor
9500/9600 User’s Guide Displaying Data with Vista
Chapter 4 - Using ACCESS Software Page 97
Real-time voltage flicker severity data for short term (Pst) and Long term (Plt) observation periods. Plt values > 0.65, or Pst values >= 1.0 indicate that the level of flicker is likely to be irritable (refer to the description of the Ficker module in the online ION Programmer’s Reference for more details). (9600 only)
This diagram also includes control objects for triggering manual waveform recording, enabling/disabling sag/swell and transient (if applicable) event recording, enabling/disabling harmonics logging, and resetting the Voltage Disturbance Counter.
Harmonics Trending The Log Server must be running to view the logged harmonics data.
Harmonics data logging is enabled by default.
The control object indicates the logging enable status: the switch is in the up position (1) when logging is enabled, and down (0) when logging is disabled.
Long-Term Harmonics Min/Max MeasurementsClick the Long-term Min/Max object in the Power Quality Diagram to view the Long-Term Harmonics Min/Max Measurements window. It shows min/max values for phase voltage and current THD.
Min/max values can be reset with the Harmonics Min/Max Reset Object. All min/max values are valid from the time the last reset was performed.
EN50160 Measurements (9600 only)Click on the EN50160 tab of the Power Quality diagram to view a comprehensive display of EN50160 statistics and parameters. Each tab in the EN50160 display corresponds to an EN50160 voltage measurement component (Frequency, Magnitude, Interruptions, Dips, Overvoltages, Flicker, Unbalance, Harmonics, Interharmonics, and Mains Signalling).
Refer to the technical note Power Quality: ACCESS Meters and EN50160 for more information.
Revenue Measurements
The Revenue Measurements diagram shows instantaneous power, energy and demand measurements. It also provides access to an Energy & Demand by Quadrant screen, and a number of interactive setups and controls.
Instantaneous PowerThis section of the window depicts instantaneous active power, reactive power, and apparent power against a four-quadrant display.
Energy & DemandThis section shows Sliding window and thermal demand for the active, reactive, and apparent power (delivered and received). Accumulated values of active, reactive, and apparent energy (delivered and received) are also provided.

Displaying Data with Vista 9500/9600 User’s Guide
Page 98 Chapter 4 - Using ACCESS Software
Energy & Demand by QuadrantClick the By Quadrant button to see a Vista grouping window showing the following demand measurements by quadrant:
Sliding window and thermal demand for active, reactive, and apparent power in all four quadrants
Accumulated values of active, reactive, and apparent energy in all four quadrants
Demand Max and Demand MinClick the Demand MAX and Demand MIN objects to see a Vista grouping window showing the maximum and minimum demand measurements.
Loss CompensationThe meter can perform loss compensation to the measurements it provides in one of two ways. Use this screen to do the following:
1. Enable loss compensation by double-clicking on the Loss Compensation Mode control object. You can ignore the remaining steps if you disable loss compensation.
2. Select a Loss Compensation Method (either the “Test Sheet” method or “%Loss Constants” method), and
3. Enter the power system specifications necessary for the line and transformer loss calculations to be performed.
Level 3 WinPM.Net authority is required to use control objects and enter system values.
Setup and ControlsClick the Setup & Controls object in the Revenue Measurements diagram to view the Setup & Controls grouping window. You may only use the Setup & Controls if you have Level 3 (or higher) permission.
Meter Mode
During regular service, you should not have to enable TEST mode. Placing the meter in TEST mode activates the parameters displayed in the Revenue Test Mode window. Typically, TEST mode should only be enabled for testing and calibration purposes (see Note). All TEST mode values are cleared when you exit TEST mode.
NOTE
All billing quantities recorded during normal operation cease to accumulate while the meter is in TEST
mode. The data recorded by the 9600 in TEST mode is sent to special TEST mode registers instead.
LED Pulser Mode
This setting determines if front panel LED energy pulser will pulse in NORMAL and TEST mode, or just in TEST mode. Refer to “Displaying Data with the Front Panel” on page 22 for more information about the front panel LEDs.

9500/9600 User’s Guide Displaying Data with Vista
Chapter 4 - Using ACCESS Software Page 99
Revenue Measurements Scaling
By clicking on Secondary Units (“1:1”) this control object lets the meter display and record Secondary values for kW, kVAR, and kVA (values not scaled with PT and Ct ratios). By default, the meter displays Primary values (values that using Ct, and PT scaling) for these revenue quantities.
Peak Demand Reset
The Peak Demand Reset control object allows you to clear the peak demand values logged in the meter. When the meter is in TEST mode, this object clears Revenue Test Mode demand parameters.
Master Reset
The Master Reset control object allows you to clear all the cumulative and derived quantities from the meter (including demand, peak demand, energy, revenue, and Revenue Test Mode parameters). A master reset also clears the meter’s Event log.
CAUTION
The Master Reset operation will clear all billable quantities from the meter. The Master Reset operationwill also clear the logged data from the meter’s Event log.
Report Log Enable
The Report Log Enable object allows you to disable the data recorder that is factory configured to work with Reporter. Disabling this recorder reduces the processing load on the meter and the network (and the Log Server in particular).
You should only consider performing this action if the Reporter is not present with your version of WinPM.Net. For more information about Reporter, consult the online WinPM.Net Help.
Setpoints
The Setpoints diagram uses setpoints to monitor kW demand, over current and voltage unbalance levels. Vista annunciates warnings if any of the values match or exceed specified upper limits for 30 seconds or longer. Users with Level 3 authority can define the setpoint limits. All status indicators read “NOT AVAILABLE” when monitoring is disabled.
Over kW Sliding Window Demand Monitoring Over kW demand monitoring is disabled by default.
To set the upper kW demand limit, enter the total number of kW that should be considered as an over demand condition.
Per Phase Over Current Monitoring Over current monitoring is disabled by default.
To set the over current limits, enter the total number of Amps that should be considered as an over current condition.

Displaying Data with Vista 9500/9600 User’s Guide
Page 100 Chapter 4 - Using ACCESS Software
Voltage Unbalance Monitoring Over voltage unbalance monitoring is disabled by default.
To set the upper limit for voltage unbalance, enter the percentage of the average voltage measurement that will be considered as a voltage unbalance condition if it is exceeded by the voltage on any phase.
Time-of-Use
This diagram may only be important if you are using the meter in a billing application (i.e. you are a power provider). Typically, power consumers can ignore the Time-Of-Use Vista diagram.
The Time-of-Use (TOU) diagram displays TOU energy and demand information (from sliding window or thermal demand calculations) for four billing rates in the present and previous billing period, as well as the previous season. This diagram also provides a shortcut to grouping-window display showing peak demand details for all TOU parameters. Historic Data Logging is provided for all TOU parameters.
Time-of-Use Tables Tabs provide access to the different groups of parameters. TOU information is
provided for demand, peak demand, and energy (real, reactive, and apparent components).
Information is “NOT AVAILABLE” if TOU is not configured.
Historic Data Logging is enabled by default. The Historic Data Logging enable object is located in the Volts/Amps diagram (refer to page 96).
TOU– Peak Demand DetailsDouble-click on the Peak Demand Details object in each parameter grouping to displays peak demand information about that parameter.
Digital Inputs/Outputs
The Digital I/O diagram monitors all eight status inputs and six of the seven relay outputs of the meter. The diagram displays the status (ON or OFF) of each port. It also keeps count of the number of input state changes. You can reset the status change counter with the Reset Counter control object. For more information on Digital I/O, refer to the technical note Digital and Analog I/O.
InputsThe meter’s status inputs are de-energized when the meter is powered-up, so each status will initially be OFF.
OutputsThe meter’s status outputs remain NOT AVAILABLE until they are configured using ION Setup or Designer software (details for both applications are provided elsewhere). Digital Output D4 is not shown in the Digital I/O diagram. Port D4 is factory configured to output calibration pulses at a rate of 1.8Wh (del+rec)/pulse.
9500/9600 User’s Guide Customizing the Vista Interface
Chapter 4 - Using ACCESS Software Page 101
Analog Inputs/Outputs
The optional Analog I/O card must be installed on your meter for this diagram to function. Depending on which option you chose for your card, the Analog I/O diagram monitors either analog inputs or analog outputs, or it monitors both the inputs and outputs.
InputsThe meter’s analog inputs are monitored for the ScaledValu output register. This value is displayed next to the appropriate port.
OutputsThe meter’s analog outputs are monitored for the Normalized output register. This value is displayed next to its port.
Refer to the technical note Digital and Analog I/O for more information on analog inputs and outputs and their associated output registers.
Revenue Test Mode
The Revenue Test Mode diagram shows TEST mode parameters. The energy and demand values displayed only accumulate when the meter is in TEST mode. See “Setup and Controls” on page 98 for instructions on placing the meter in TEST mode.
Revenue Test Mode Values Accumulated values of active, reactive, and apparent energy (delivered,
received, and delivered + received)
Sliding window and thermal demand for active power (delivered, received, delivered peak, and received peak)
All TEST mode values are cleared once you exit TEST mode
A red, flashing TEST mode label appears above the Energy label when the meter is in Revenue TEST mode.
Customizing the Vista InterfaceStandard Vista diagrams show much of the data that the factory-configured meter measures and calculates. However, the factory-configured meter can provide additional data that is not presented by default with these display tools. This data can be added to the standard Vista diagrams by placing addition diagram objects on them; or, you can create new user diagrams to display any additional data you want.
Vista cannot be used to customize data displays on the ACCESS meters themselves.
NOTE
Level 5 ACCESS software authority (Supervisor) is required to create and configure new Vista diagrams.If you do not have Level 5 password authority, contact your ACCESS software administrator for assistance.

Customizing the Vista Interface 9500/9600 User’s Guide
Page 102 Chapter 4 - Using ACCESS Software
Diagram Objects in a User Diagram
Diagram objects provide the interface to ION registers in your network, and to DDE values from other applications. Each diagram object displays a single piece of information from somewhere in your power-monitoring network; for example, a single numeric object displays numeric data from a single source.
If your account has permission to edit user diagrams, the following diagram objects are represented by icons in a floating toolbox.
If this toolbox is not available in Vista, yet you have the proper permissions to edit user diagrams, you must select Options > Show Toolbox from the Vista menu. A check mark next to the option indicates that it has been selected.
To place a diagram object, simply click, drag and drop the object you want from the toolbox onto the current Vista display window. Once you have added the diagram object, right-click the icon to specify the actions you want it to perform.
Complete details on configuring diagram objects and creating Vista User Diagrams are in the online WinPM.Net Help.
Custom Appearance of a User Diagram
You can customize the appearance and configuration of any window within a user diagram. You can alter a window's font or background color, or configure window properties such as background image, real-time and logged data links, double-click action, and stale data settings.
To make one or more of these changes, right-click anywhere in the background of a user diagram. A menu appears with three selections:
Choosing Default Font or Background Color allows you to customize the area implied by the selection. Choosing Properties brings up the Window Properties Configuration box, which offers five groups of options: Image, Log Server, Node, Action and Stale Data. Complete details on these options are found in the online WinPM.Net Help.

9500/9600 User’s Guide WinPM.Net: Designer
Chapter 4 - Using ACCESS Software Page 103
WinPM.Net: DesignerDesigner is an application for advanced users who know the nature of ION architecture, specifically the nature of frameworks. A framework is a number of ION modules arranged (linked) to perform a specific function or number of functions. Designer allows you to customize current frameworks by adding, deleting, or re-linking ION modules, and it allows you to create entirely new frameworks. Although it can be used to perform basic setup, such as changing an ION module’s setup register, it is recommended that you only use Designer for framework customization and creation.
NOTE
In most cases, you will be able to achieve the functionality you want by changing the settings in an existingmodule’s setup registers. For this operation it is recommended that you use ION Setup.
Basics of ION ArchitectureBefore you begin altering the meter’s operation, it is advisable to familiarize yourself with the basics of how the device operates. Understanding the basics of the ION architecture will help you understand how to make different types of configuration changes.
The ION architecture applies the principles of object-oriented software design to the creation of functionality inside your devices. The object-oriented structure allows you to connect different discrete objects (called ION modules) in different ways to define how information is accessed, transferred, and manipulated inside the device and across the power monitoring network.
Each ACCESS device contains a number of ION modules that perform specific functions. The ION modules are linked together to create frameworks or framework templates, defining multiple operations and logical pathways for power system information. The basic structure of an ION module is the same for each module type, making it easy to use new features once the basics are understood.

Basics of ION Architecture 9500/9600 User’s Guide
Page 104 Chapter 4 - Using ACCESS Software
ION ModulesThe ION module is the basic building block of the ACCESS device’s operating software. A module can be considered as a “function box”: it receives data from its inputs, makes decisions based on the settings in its setup registers, and then makes data available at its output registers. All functionality provided by an ACCESS device can be considered in terms of its modules and the linkages between them.
Modules are linked together to create powerful functions. For example, the framework below consists of four modules that, when combined, trigger a waveform recording in response to an over-voltage condition.
Module Linking Restrictions
The maximum number of modules that can be linked in a row is 25. This is referred to as the framework’s depth. Modules that branch off or branch into the chain do not affect the depth, and there is no restriction on the number of branches you can have in a framework.
Another restriction concerns “circular” linking of modules. You cannot link a module’s output register to its own input or to the input of any module that precedes it in the chain. This protects you from creating infinite loops that can waste system resources.
The one exception to this rule is the Feedback module, which makes circular linkages possible (refer to the online ION Programmer’s Reference).
ION ModuleOutput 1
Output 2
Input 1
Input 2
OUTPUT REGISTERShold the result of the module’s operation– this data is available to other ION modules.
SETUP REGISTERScontrol how the module
processes data
INPUT REGISTERSare connected to the output registers of other modules; data flows into them.
Voltage on phase Ais measured
Waveform is recordedand stored in the log file
Setpoint goes ON whenVln a exceeds a limit andoutputs a trigger pulse
One-Shot Timer waits fora specified period thenoutputs a trigger pulse
Power MeterModule Vln a
SetpointModule Trigger
One-Shot TimerModule Trigger
Waveform RecorderModule Waveform log

9500/9600 User’s Guide Basics of ION Architecture
Chapter 4 - Using ACCESS Software Page 105
Sequence of ION Module Execution
ION modules always execute in the order of the data flow (in the example below, from 1 to 4). This logical execution order is maintained even if you created the framework from back to front.
ION modules may execute simultaneously if they do not depend on each other for data (such as both ION modules labelled 1). Conversely, ION module 3 will not execute until both ION modules 1 and ION module 2 have executed.
ION RegistersEach module has one or more output registers, and most modules have Setup registers. (A module’s inputs are links to the output registers on other modules.) There are different types of registers, each classified by the type of data they accept. When you want to change a module’s configuration, you must supply the type of data that is appropriate for the register you are configuring. The configuration tools prevent you from entering the wrong type of data into a register, but they do not prevent you from entering the wrong value.
The ‘NOT AVAILABLE’ Value
An ION module that requires a link to one or more of its inputs, but has no such links created, does not contain any values in its output registers. Instead, its output registers are set to NOT AVAILABLE. In addition, if a module has an input that is invalid (for example, a line-to-neutral measurement for a 3-wire Delta system) its output register is also set to NOT AVAILABLE. The NOT AVAILABLE value helps to distinguish between cases where a register contains a value like 0 or OFF, and cases where there is actually no value stored.
NOTE
The NOT AVAILABLE value appears in Vista objects that are linked to ION modules with output registersthat are NOT AVAILABLE. The front panel of the meter displays values that are NOT AVAILABLE as dashes (–).
If the inputs of a module are NOT AVAILABLE, its output registers are also NOT AVAILABLE. The NOT AVAILABLE value propagates through all linked modules. (The NOT AVAILABLE value propagates through linked Arithmetic modules differently - refer to the ION Arithmetic module description in the onlineION Programmer’s Reference.)
1
1 2
3 4

Basics of ION Architecture 9500/9600 User’s Guide
Page 106 Chapter 4 - Using ACCESS Software
ION Configuration Changes and Module SecurityWhen you make configuration changes to an ACCESS device you are either changing a value in a module’s setup register (basic configuration) or you are changing the linkage between two or more modules (advanced customization).
Certain parts of the meter’s operating software are protected against deletion and tampering, specifically core ION modules, fixed module links, persistent ION modules, and locked ION modules. Visit Siemens’s web site (www.sea.siemens.com) for a complete listing of these module types for your meter.
Core Modules
Core ION modules are fundamental to basic device or software node operation. You cannot create or delete core modules, and in some cases, you cannot configure them. Those ION modules classed as Core modules are the same in every device or software node, though not all devices and software nodes support all the Core modules. The following are examples of Core Modules: Power Meter module, Communications module, Display Options module, and the Factory Module.
Fixed Module Links
Several of the linkages between core modules are fixed; they are required for the basic operation of the device. A fixed link cannot be removed. A core module with fixed links can still be linked to other modules.
Persistent Modules
Persistent ION modules are similar to Core modules, as they are core to the operation of the device and cannot be created or deleted. These ION modules are protected, because they are factory-configured to provide important external control functions. Many External Pulse modules are Persistent ION modules. Do not reuse Persistent modules.
CAUTION
Persistent modules can be overwritten in Designer. When pasting a default framework onto a meter, uselock-paste on the Persistent modules, not free-paste. A list of Persistent modules is available on the Librarypage of Power Measurement's website, under "ION Device Templates".
Locked Modules
Locked modules provide security for revenue meters. This type of module security only applies to ACCESS meters with the revenue-lock enabled (RM) order option. Furthermore, there are varying degrees to locked module security: Fully Locked, Writable Locked, and Front Panel Locked. Fully Locked security is designed to protect the revenue related functions within the meter; they cannot be modified in any way. (Fully Locked modules have their values written via internal meter methods, as the meter makes calculations based on its voltage and current inputs.) Writable Locked security allows you to trigger or change the state of the ION module, but you cannot delete it, link to it, or change its label. Front Panel Locked security prevents registers from being altered remotely via software; you must use the ACCESS meter’s front panel to make any modifications to these registers.

9500/9600 User’s Guide Designer’s Main Configuration Screen
Chapter 4 - Using ACCESS Software Page 107
NOTE
Depending on the meter family, there may be different types of module security. Rev_write_state_lookupmeans the module cannot be modified in any way, and Rev_destroy_lookup means the module cannotbe deleted.
Designer’s Main Configuration ScreenIf the software has been properly configured, the main screen of the meter’s node diagram appears each time that you open a meter in Designer. If the ACCESS software has not yet been configured, refer to the online WinPM.Net Help, or contact your network administrator. The different types of device functions are grouped together on the Designer screen, so you can quickly access the types of settings you want to change.
Once you have logged on to Designer and opened the meter’s node diagram, you can begin configuring ION modules. Designer displays two types of objects on the main configuration screen: ION modules and grouping objects (also called folders).
A folder in Designer indicates that additional modules are available. Double-click on a folder to access the modules contained inside it. In some cases a folder will contain additional folders — continue double-clicking on the folders until you reach the appropriate ION module.
ION modules appear on the main Designer screen, grouped by the functions they perform. Right-click a module to access its Setup registers.
Folder icons indicate that additional ION modules are available. Double-click on the folder to view them.
Status Bar

Viewing Real-time Data in Designer 9500/9600 User’s Guide
Page 108 Chapter 4 - Using ACCESS Software
Viewing Real-time Data in DesignerYou can view the real-time values of output registers in Designer. This is useful when you are linking these outputs to other modules. It is recommended that you use Vista as your main data display application.
To view real-time data of output registers:
1. Click Options > Show Toolbox on the Designer menu.
2. Find the ION module you want, press the Shift key and click the output register. The following example shows the real-time data for the outputs of the Clock module in an 9600 meter:
Changing Setup Registers with DesignerIf you are familiar with the nature of ION architecture and comfortable using Designer, you can use the application to modify ION modules’ setup registers.
NOTE
It is recommended that you use the Setup Assistant in the ION Setup software to configure an IONmodule’s setup registers. The Setup Assistant is a user interface that provides access to the setup registersfor a meter. (Refer to the ION Setup section for more details.)

9500/9600 User’s Guide Changing Setup Registers with Designer
Chapter 4 - Using ACCESS Software Page 109
To configure ION module setup registers with Designer
1. Right-click near the module’s center. The ION Module Setup dialog box appears, showing a list of setup registers available for configuration.
2. Highlight the Setup register you want to configure, and click Modify.... A Modify Register dialog box appears.
Make the change to the register’s setting here. As there are different types of data held in setup registers, there are different Modify Register dialog boxes. The Modify Register dialog box may require that you choose an option from a list or enter a numeric value.
A format option is available when modifying Numeric Bounded setup registers. Clicking Format causes a “Formatted Numeric Value” window to appear:
The list of available Setup registers appears here. Select a Setup register, then click Modify... (or double click on the Setup register name).
A drop down list of option appears when you click on the arrow because this setup register is of the enumerated type.

Customizing Frameworks in Designer 9500/9600 User’s Guide
Page 110 Chapter 4 - Using ACCESS Software
Use the Interval Format area if the setting you are changing requires intervals. Use the Date/Time Format area if the setting you are changing requires specific dates (such as those needed used in the Clock module). Click OK when you have the desired setting for the time interval or date.
3. Click OK when you are satisfied with your configuration changes.
Complete details about the Setup registers of every ION module are provided in the online ION Programmer’s Reference. Details about the Setup Areas on the main screen of the node diagram can be found in the Default Functionality chapter.
Customizing Frameworks in DesignerTo create custom functions, ION modules are linked together and then configured. Linking ION modules is relatively straightforward: output registers on one module are linked to the input registers of subsequent modules. Data flows from the output register on the first module to the input registers on a second module. Each module that receives data makes decisions and processes the data based on its setup registers’ settings. Once the data has been processed, a module makes the data available at its output registers. These output registers can then be linked to the inputs of other modules, and so on.
Most ION modules perform simple, discrete functions. The combination of modules linked together creates a more powerful functionality. Multiple modules linked together can be referred to as a framework. Since a device’s operation can be separated into the specific, smaller functions performed by the modules, creating specialized functionality is simple if you understand the operation of the component pieces.
CAUTION
The meter is factory-configured for optimal operation. You should not make any changes to its operatingsoftware unless you are familiar with the ION architecture, you know specifically what you want toaccomplish, and you understand the effects of the changes you intend to make.
If you need to customize your meter’s operation, you will need to create new ION modules, configure their settings, and in some cases link them to other modules. Designer provides a graphical view of your meter’s internal operation, making these tasks simple. If you require more information on Designer than is presented in these pages, refer to the online ION Programmer’s Reference or online WinPM.Net Help for complete usage details.

9500/9600 User’s Guide Customizing Frameworks in Designer
Chapter 4 - Using ACCESS Software Page 111
Creating New ModulesTo add a module, locate its icon in the Designer toolbox, press and hold the left mouse button over the icon, and drag it onto the node diagram. Once you release the mouse button, the module becomes part of the diagram and is ready to be configured and linked.
Choosing the Module
The Designer toolbox displays icons for all the meter’s available module types. If the toolbox is not displayed, choose Show Toolbox from the Options menu.
As you drag the mouse over the icons in the toolbox, the status bar at the bottom of the Designer window displays the module type.
Creating the Module
Follow these steps to create an ION module in the meter:
1. On the ION Modules toolbox, press the mouse button down on top of the icon of the module you want to create, and drag it onto the node diagram. As you drag the icon, the cursor changes shape to indicate you are placing an object.
2. Release the mouse button to place the module in the diagram. When you release the mouse button, Designer places a pending module icon into the diagram (pending modules appear with a dashed outline).
3. Once you have configured the node to your liking, choose Send & Save from the File menu to download the configuration to the node. The dashed outline is replaced with a solid outline, indicating that your changes have been saved.
After a Send & Save, ION modules that are offline (or inactive) appear with a red border. This can mean that the ION module’s setup is incomplete. Refer to the online WinPM.Net Help for more details.
The web site has information about the setup register defaults a module has when it is initially created, as well as the ranges or options each setup register supports.
Deleting ModulesTo delete a module, select it by clicking its icon, then press the Delete key. Use caution when deleting modules – any dependant modules will be affected. Designer informs you of dependant modules if they exist on the same node.
Linking ModulesModule linking involves clicking on one module’s output register symbol, choosing the output register you want to link, then clicking the input of a second module and selecting the input to link to. This operation can be performed in reverse – you can start with one module’s input and link to another module’s output register if desired.
You can link modules that reside on different nodes, provided that you are linking between software nodes, or from meter to software node. You cannot link modules between meters. The following section describes how to link modules that reside on the same node. The online ION Programmer’s Reference or the online WinPM.Net Help have instructions on linking modules that reside on different nodes.
Each ION module available to a meter appears in the toolbox.

Customizing Frameworks in Designer 9500/9600 User’s Guide
Page 112 Chapter 4 - Using ACCESS Software
Follow the steps below to link modules on the meter:1. Click on the symbol on the right side of the module icon to list a module’s
output registers. (To list the module’s setup registers, hold the CTRL key while clicking on the symbol.) In most cases, a pop-up menu appears and lists the available registers. If the module has many registers, a dialog box appears instead.
2. Click on the register you want to select. In the case of the dialog box, double-click on an output register, or choose the register and click Select.
3. Drag the cursor towards the module to which you want to link; the cursor changes and a dotted line follows it across the node diagram. This indicates you are in the process of creating a link. The dotted line also shows where the connecting line will appear in the node diagram once the link is made.
If you link to a module that is in a different window than the original module (either in a different node diagram or grouping window), the dotted line disappears, but the cursor still indicates that a link is in progress.
4. Click on the module icon’s left symbol to display the module’s inputs. In most cases, a pop-up menu appears and lists the module’s inputs. (If there are a large number of inputs, a dialog box similar to the More Output Registers dialog box appears instead.) Inputs that are a different class than the selected output register are grayed out to indicate that you cannot select them.
If the input is already linked, the register label it is linked to is displayed beside the input. If you select the input, the existing link is overwritten.
5. Choose the input you want from the pop-up or dialog box.
If the two modules are in the same window, the dotted line remains on the screen to show the link between the modules.
6. Save the changes you made to the node. When you save, the line changes from a dotted line to a thin black line to indicate that the link is now programmed on the node.
The procedure described above can also be performed in reverse order. You can select a module’s input first and then link it to another module’s output register.
Accessing module outputs
or
Accessing module inputs
The cursor looks like this when a linking operation is in progress:

9500/9600 User’s Guide Customizing Frameworks in Designer
Chapter 4 - Using ACCESS Software Page 113
Editing Existing FrameworksIf you are comfortable with the ACCESS software and the meter’s configuration, you can make changes to the existing frameworks to customize operation. Any edits you make to the existing frameworks alter the device’s operation — be sure you understand what effect your changes will have before proceeding.
Checking an Output Register’s “Owner”
Using Designer, right-click a module’s output register to view its linkages, referred to as “owners”. A dialog box appears showing all of the inputs that are linked to that output register. With this information you can determine what changes will result to the framework by deleting the links to the parameter. Note that links to inputs on other nodes are not shown in this dialog box.
CAUTION
Viewing owners by right-clicking a module's output register will only show you module linkages on thesame node. Any links to modules on different nodes will not be shown. If links to modules on other nodesmay exist, always check the links at a module’s inputs.
Deleting the Link at a Module’s Input
You can also check the links at a module’s input. Using Designer, right-click on the input symbol on a module to view a dialog box listing each of the inputs and the output registers they are linked to. You can unlink inputs from within this dialog box as well.
Replacing a Link
You do not need to unlink a module’s input before linking a different output register to it. If you link an output register to an input that is already linked, the existing link is overwritten.

WinPM.Net: Reporter 9500/9600 User’s Guide
Page 114 Chapter 4 - Using ACCESS Software
WinPM.Net: ReporterReporter is a database reporting application. It lets you define, generate, and manage comprehensive reports based on the data in your database. Reporter retrieves data from the Relational Database Management System (RDBMS), and processes it into a finished report in Microsoft Excel format. There are a number of pre-configured reports available, including Power Quality, Load Profile, Energy and Demand, and EN50160 reports. You can also generate custom reports that incorporate virtually any data stored in the RDBMS and perform further analysis using Excel’s advanced mathematical and graphical functions.
After you’ve designed custom reports and configured the Excel workbooks, reports are updated automatically, either in response to a power system event, or following a specified schedule. You can also configure reports to automatically email selected recipients after updating.
NOTE
The Report View Manager, a component of the Reporter, can be used on its own to create customdatabase views for use with other third party reporting packages. Advanced knowledge of databaseoperation may be required to use the Report View Manager with third-party applications. Refer to theonline WinPM.Net Help for details on the Report View Manager.
Pre-configured ReportsWhen you start Reporter, the main Reporter screen appears with a list of pre-configured reports. The most commonly accessed reports are the Energy and Demand report, the Load Profile report, and the Power Quality report. There are also 2 reports related to the European EN50160 power quality standards.
Time of Use Schedule used for Energy and Demand reports.This is not to beconfused with the Time of Use Module

9500/9600 User’s Guide Pre-configured Reports
Chapter 4 - Using ACCESS Software Page 115
Energy and DemandThis report is designed to generate and display details about energy consumption and peak demand levels over a given time period. It uses a Time of Use Schedule (TOU) to reference the metered data against an energy provider’s tariff schedule.
The first step in creating an Energy and Demand report is to preconfigure the TOU schedule that will be applied to the metered data. If you do not require a time of use schedule, you can create a mock schedule with only one time period defined. Use the EgyDmd Log as a query item.
Load ProfileThis report generates a graphical representation of demand, or load levels, over a given time frame. The profile is a characterization of peak loads that can be used to determine and limit demand peaks which could lead to financial penalties for energy consumers, or could signal a need for additional generation or the introduction of load control programs for energy suppliers.
The Load Profile report also uses the EgyDmd Log as a query item, but it does not use a TOU schedule.
Power QualityThis report summarizes the number and severity of sags, swells, and transients over a given time range, and graphically represents the waveform captures of each individual event for further analysis.
The Power Quality report is slightly different than the other two report types, mainly in its requirements for different data log sources. The Power Quality report requires a combination of the Sag/Swell Log, Transient Log, and Waveform Log.
NOTE
You generate a Power Quality report with a combination of the Sag/Swell logs, Transient logs, andWaveform logs from the ACCESS meters that have these as features. For example, the 9350 uses a Sag/Swell module and Waveform capture to generate a Power Quality report; however, the 9600 has theSag/Swell Log, Transient Log, and Waveform Log, so all three sources are used for a Power Qualityreport.
EN50160EN50160 is a general power quality standard used by energy suppliers and energy consumers in European countries. The report is a summary of the multiple pass/fail results of the evaluation methods outlined in the standard. All fourteen of the logs below must be added to each EN50160_General report:
EN50160 Vlt Dp1 to EN50160 Vlt Dp5
EN50160 Ovrvlt1 to EN50160 Ovrvlt3
EN50160 Frq/Mg, EN50160 Flicker, EN50160 Intrp, EN50160 Hrm Vlt, EN50160 Ihm Vlt, and EN50160 Vunbal
EN50160 MSignal is the log used for the EN50160_Mains_Signal report.

Report Creation and Generation 9500/9600 User’s Guide
Page 116 Chapter 4 - Using ACCESS Software
Report Creation and GenerationThese steps are used for creating all report types. Be sure to know which log(s) you use for the report you are creating.
NOTE
If you are creating an Energy and Demand report, complete the steps under “Creating a Time of UseSchedule” (following “Creating a Report”) before you proceed with creating your report.
Creating a Report1. Start Reporter.
2. Select the report type you want and click Copy.
The pre-configured reports include some basic programing to simplify the customization process. It is recommended that you create a copy prior to making changes, leaving the default report unmodified.
3. Click the Properties button (while your copy is selected). The Report Properties dialog box appears.
On the General tab, it is recommended that you change the default report name to distinguish it from other reports you may create.
4. Click New from within the Database Queries section. The Database Query Properties dialog box appears.
5. Select your DSN (Data Source Name). This is the name of your database file or archive.
6. Select the appropriate Log file(s) for the report. Click OK to close the Database Query Properties dialog box.
7. Click on the Distribution tab and select the appropriate check box.
You may need to provide more information, such as a destination folder or email address, depending on your distribution method.
8. Make any changes you require on the Advanced tab and write any information you desire on the Notes tab.
9. Save your new report template.
Generating the Report 1. Select your report from the list.
2. Click Generate.
The Report Generator extracts the requested information from the database, applies the TOU (if required), and displays the report in Microsoft Excel. Larger reports with many queries may take a few minutes to complete.
NOTE
If you selected the check box for Interactive Date Range on the Advanced tab, you are prompted to selectthe date range within the Interactive Date Range screen.

9500/9600 User’s Guide Report Creation and Generation
Chapter 4 - Using ACCESS Software Page 117
Creating a Time of Use Schedule1. Start Reporter and select the TOU tab.
2. Select the Sample file, then click copy to duplicate it.
All of the pre-configured samples include some basic programing to simplify customization. It is generally best to create a copy of the samples before making changes, and leave the sample in its default state.
NOTE
Be aware that the NEW button creates a completely new report or TOU schedule with no defaultconfiguration. Use this option to create completely customized reports.
3. Select your new copy and click Properties to configure it.
Examples of possible changes for the TOU schedule are as follows:
Rename the TOU Schedule using the appropriate field.
Modify On Peak and Off Peak charges using the appropriate field.
Add a 'Shoulder Period' which is often called a 'Partial Peak' (see below).
Change the Holidays to an appropriate country (see below).
4. Save the new TOU configuration when configuration is complete.
Adding a Shoulder Period1. Highlight the Off Peak period by left clicking on it, select New.
2. Rename your new tariff period (i.e. Partial Peak).
3. Modify the time period by left clicking the plus sign, selecting the time period and changing the time within the left window.
4. You will also have to modify the time period within the On Peak and/or Off Peak intervals to ensure that there is no overlap (i.e. if your new 'Partial Peak' period is between 6:00 and 8:00 PM, then you will have to change your 'Off Peak' period to 8:00 PM to End Of Day).
Changing Which Days are Holidays1. Select the Off Peak period.
2. Left-click 'All Day, Canada Holidays' and select a different country from the window on the left.
3. Add or remove holiday dates as required.
CAUTION
Double check to make certain that there are no gaps and no overlapping date or time ranges. The TOUschedule should not be confused with the Time of Use Module used by billing applications.
Once you have completed configuring the TOU schedule, you are ready to create the actual Energy and Demand report.

ION Setup Software 9500/9600 User’s Guide
Page 118 Chapter 4 - Using ACCESS Software
ION Setup SoftwareION Setup is a software solution that allows basic configuration and control capabilities for your power monitoring devices. ION Setup can also display real-time and diagnostic data for your networked devices.
When starting ION Setup, you have the option to enter network mode or single device mode at the logon screen. Network mode allows you to add multiple sites and meters to your network, organize your meters into logical groups, and configure each site and meter individually. The single device mode, however, allows you to connect to only one meter and make changes to its configuration or view its data.
Refer to the documentation on you ION Setup CD or visit the Siemens web site for complete details on ION Setup.
Configuring CommunicationsWith ION Setup, you first create one or more communication sites: the site defines the communication method. You then add devices to a site, followed by grouping the devices in a logical manner according to your needs (e.g. by common function or physical location).
NOTE
You must be logged on to ION Setup in network mode in order to add a site, group, or device.
These are the types of sites available
You can group meters from different sites

9500/9600 User’s Guide Configuring Communications
Chapter 4 - Using ACCESS Software Page 119
Sites, Groups, and MetersYou can create a network of items within ION Setup so that the next time you want to upgrade a meter’s firmware or make any configuration changes, the meter is easy to find and your communication setup is ready.
Sites refers to a communication method. For example, you need separate sites for Ethernet, Serial or Modem types of communication. A site can have many connected devices. You can also have one meter that is connected to two or more sites provided that the meter has the capability.
A group is an optional feature that lets you define a logical grouping of meters. For example, you can have a group of meters for power quality monitoring, or you can have a group of meters defined by location. Groups are always attached to the System icon. Devices within each group are attached to both the group and a communications site (sites are connected to the workstation).
You can add a meter to a communication site or a group. When you add a meter to a group, it is automatically attached to the appropriate communication site. However, when you delete a meter from a group, the meter remains attached to the communication site.
Adding a Site, Group or Meter1. Close any open windows to return to the Network Viewer screen. Do one of
the following:
From the toolbar, click the Insert An Item button, or From the Insert menu, choose Item, or Right-click anywhere on the screen to display the shortcut menu, and then
click Insert Item.
The New Network Item dialog box appears (see illustration in step 2).
2. Click the item (Group, Site or Meter) that you want to add. In the Attach To: box, select where you want to attach the item.

Configuring Communications 9500/9600 User’s Guide
Page 120 Chapter 4 - Using ACCESS Software
3. Click OK. A dialog box for the appropriate item appears. Depending on the item, there may be multiple tabs each with numerous options for configuration:
When you add a new site, the dialog displays three tabs: General, Timings, and Polling. If you are adding a modem or gateway site, there is a fourth tab labelled Remote Info.
When you add a new group, the dialog box has only one tab labelled General. On this tab, you can change the name of your newly created group.
When you add a new meter, the dialog box displays three tabs: General, Display, and Tools.

9500/9600 User’s Guide Basic Meter Configuration
Chapter 4 - Using ACCESS Software Page 121
Basic Meter ConfigurationThe Setup Assistant is a user interface that contains relevant instructions to help guide you through common setup requirements for your ACCESS meter. After you have added a device to ION Setup in network mode, or connected using single device mode, the Setup Assistant appears in the right pane. Double-click the Setup Assistant to access the setup dialog box.
The Setup Assistant is accessible in both single device mode and network mode.
The Setup Screens on the left let you access different setup tabs on the right. It is from these setup tabs that you can configure a meter’s setup registers.
Changing a setup register1. Highlight the Setup Screen you want and select the desired tab where
applicable.
Important notices may be included in the description box. Read them carefully before proceeding with your configuration changes.

Displaying Data with ION Setup 9500/9600 User’s Guide
Page 122 Chapter 4 - Using ACCESS Software
2. Highlight the setup register you want to edit in the register window.
3. Click the Edit button.
(If advanced meter security is enabled, a window will appear asking for the meter’s password. Type the meter’s password and click OK.)
A window appears where you can edit the register value.
Depending on the register class, you either select a value from a drop-down list or enter the new value manually in the field provided.
4. Make your selection from the drop-down list or enter a new value. Click OK. The setup register changes immediately.
Displaying Data with ION SetupYou can use ION Setup to display real-time or diagnostic data from any meter that you have added to the software.
Displaying real-time data
1. Select Data Screens from the View menu (or click on the toolbar).
2. Click the device icon from which you want to view real-time data.
3. Double-click the icon for the screen you want to display (the screens in the right pane of the ION Setup window).
4. Click the desired tab to display its contents if there is more than one tab in the display screen.

9500/9600 User’s Guide Displaying Data with ION Setup
Chapter 4 - Using ACCESS Software Page 123
Displaying diagnostics data
1. Select a site or device icon from the left pane.
2. Select Diagnostics from the Tools menu (or click on the toolbar).
The Communication tab displays information about the meter’s communication status, message information, message timing, and packet frames. Clicking the Reset button sets all values to zero.
The General tab display information about the meter, such as the meter type, the firmware version, serial number, communications, and available memory.

Displaying Data with ION Setup 9500/9600 User’s Guide
Page 124 Chapter 4 - Using ACCESS Software

5 Features and ApplicationsThe 9500 and 9600 meters offer unmatched value, functionality, and ease of use at key distribution points and sensitive loads. Comprehensive analog and digital I/O, multiple communication ports, industry-standard protocols, and precision time synchronization compliment the meters’ ability to integrate with your energy management and SCADA systems.
In This Chapter
Communications . . . . . . . . . . . . . . . . . . . . . . . . . . . . . . . . . . . . . . . . . . . 126RS-232 Connections . . . . . . . . . . . . . . . . . . . . . . . . . . . . . . . . . . . . . . . . . . . . . . . . . . 127RS-485 Connections . . . . . . . . . . . . . . . . . . . . . . . . . . . . . . . . . . . . . . . . . . . . . . . . . . 128Ethernet Connections . . . . . . . . . . . . . . . . . . . . . . . . . . . . . . . . . . . . . . . . . . . . . . . . 129Internal Modem Connections . . . . . . . . . . . . . . . . . . . . . . . . . . . . . . . . . . . . . . . . . . 132Infrared Port Connections . . . . . . . . . . . . . . . . . . . . . . . . . . . . . . . . . . . . . . . . . . . . 136
Internet Connectivity . . . . . . . . . . . . . . . . . . . . . . . . . . . . . . . . . . . . . . . . 137WebMeter and MeterMail . . . . . . . . . . . . . . . . . . . . . . . . . . . . . . . . . . . . . . . . . . . . 137WebReach . . . . . . . . . . . . . . . . . . . . . . . . . . . . . . . . . . . . . . . . . . . . . . . . . . . . . . . . . . 138Telnet and Hyperterminal . . . . . . . . . . . . . . . . . . . . . . . . . . . . . . . . . . . . . . . . . . . . 138
Digital and Analog I/O . . . . . . . . . . . . . . . . . . . . . . . . . . . . . . . . . . . . . . 139Specifying a Port in an ION Module . . . . . . . . . . . . . . . . . . . . . . . . . . . . . . . . . . . . 139Using the Onboard Digital Outputs . . . . . . . . . . . . . . . . . . . . . . . . . . . . . . . . . . . . 141Using the Onboard Digital Inputs . . . . . . . . . . . . . . . . . . . . . . . . . . . . . . . . . . . . . . 144Analog Inputs . . . . . . . . . . . . . . . . . . . . . . . . . . . . . . . . . . . . . . . . . . . . . . . . . . . . . . . 145Analog Outputs . . . . . . . . . . . . . . . . . . . . . . . . . . . . . . . . . . . . . . . . . . . . . . . . . . . . . 145
Time Synchronization . . . . . . . . . . . . . . . . . . . . . . . . . . . . . . . . . . . . . . . 146
Meter Security . . . . . . . . . . . . . . . . . . . . . . . . . . . . . . . . . . . . . . . . . . . . 147Standard Meter Security . . . . . . . . . . . . . . . . . . . . . . . . . . . . . . . . . . . . . . . . . . . . . . 147
Data and Event Logging . . . . . . . . . . . . . . . . . . . . . . . . . . . . . . . . . . . . . 149Data Logging . . . . . . . . . . . . . . . . . . . . . . . . . . . . . . . . . . . . . . . . . . . . . . . . . . . . . . . 149Event Logging . . . . . . . . . . . . . . . . . . . . . . . . . . . . . . . . . . . . . . . . . . . . . . . . . . . . . . 150Logging and Recording Capacity . . . . . . . . . . . . . . . . . . . . . . . . . . . . . . . . . . . . . . 151Logging Configurations for 9500 Revenue Meter Applications . . . . . . . . . . . . . 152
Alerting . . . . . . . . . . . . . . . . . . . . . . . . . . . . . . . . . . . . . . . . . . . . . . . . . 153Alerting ACCESS Software via the Alarm Server . . . . . . . . . . . . . . . . . . . . . . . . . 153Alerting via an Alphanumeric Pager . . . . . . . . . . . . . . . . . . . . . . . . . . . . . . . . . . . 155Alerting via a Numeric Pager . . . . . . . . . . . . . . . . . . . . . . . . . . . . . . . . . . . . . . . . . 156Alerting via Email . . . . . . . . . . . . . . . . . . . . . . . . . . . . . . . . . . . . . . . . . . . . . . . . . . . 157
Calculating Power Availability: Number of Nines . . . . . . . . . . . . . . . . . . . 158

Communications 9500/9600 User’s Guide
Page 126 Chapter 5 - Features and Applications
CommunicationsThe following illustration shows all the possible connections to the communications card.
The 9500 and 9600 meters have numerous communication possibilities depending on your ordering preferences. Both models can have exactly the same communications options.
All of the communications ports can be used concurrently.
1 10Base-FL option will only be available if -FL was specified when the meter was ordered.
COM 3:Internal modem or optical portCOM 3 provides an optical port or an optional internal modem. You canconfigure only one of these media types to use the communications portat any given time.The optical port (located on the front of the meter) is used for serialcommunications, and supports these protocols: ION, Factory, Modbus RTU,GPS, Modbus Master, or DNP 3.00.
COM4 COM3 COM2 COM1
COM1:RS-232 or RS-485 serial connectionCOM1 is actually two ports: RS-232 fordirect connections, and RS-485 for serialconnections. Both ports support theseprotocols: ION, Factory, EtherGate, GPS,ModemGate, Modbus RTU, ModbusMaster or DNP 3.00. Note that you cannot use the RS-232 andRS-485 ports on COM1 simultaneously.
COM 2:RS-485 serial connectionCOM 2 provides an RS-485 serial portthat supports ION, ModemGate, GPS,EtherGate, ModemGate, Modbus RTU,DNP 3.00, Modbus Master, or Factoryprotocols.
The meter internal modemcommunicates to the servercomputer over the telephonenetwork.
COM 4 (front panel menu “Network”): Ethernet connectionCOM 4 provides optional 10Base-T or10Base-FL Ethernet communications.
COM Port Available Connections Standard/Option
1 Selectable RS-232/RS-485 port Standard
2 Dedicated RS-485 port Standard
3 IrDA optical port Standard
3 Internal modem Option
4 10Base-T (or –FL) Ethernet 1 Option

9500/9600 User’s Guide RS-232 Connections
Chapter 5 - Features and Applications Page 127
RS-232 ConnectionsRefer to the “Hardware Reference” chapter for the 9500 and 9600 meters’ RS-232 specifications.
An RS-232 connection is made at the male DB9 connector (COM1) at the back of the meter. The meter acts as a DTE device in all RS-232 connections. Use a null modem cable for connecting a meter to a workstation or use a standard straight-through RS-232 cable for connecting to an external modem. In either case, one end of the cable must be equipped with DB9 female connector for mating with the DB9 male connector on the meter. The maximum cable length is 50 feet (15.2 m).
Computer Connections
Meter Connections
External Modem Connections
RS-232
50 feet (15.2 m) max
Null modem
DB9 female connector to COM1
RS-232
RS-485 loop
50 feet (15.2 m) max RS-232 to RS-485 Converter
DB9 female connector to COM1
50 feet (15.2 m) max
RS-232
DB9 female connector to COM1
Telephone network connection between workstation modem and remote modem
Remote modem

RS-485 Connections 9500/9600 User’s Guide
Page 128 Chapter 5 - Features and Applications
RS-485 ConnectionsRefer to the “Hardware Reference” chapter for the 9500 and 9600 meters’ RS-485 specifications.
RS-485 connections are made via the captured-wire connectors on the rear of the meter. Up to 32 devices can be connected on a single RS-485 bus. Use a good quality shielded twisted pair cable for each RS-485 bus, AWG 22 (0.5 mm2) or larger. The overall length of the RS-485 cable connecting all devices cannot exceed 4000 ft. (1219 m). The RS-485 bus may be configured in straight-line or loop topologies.
Straight-Line Topology
Loop Topology
General Bus Wiring ConsiderationsDevices connected on the bus, including the meter, converter(s) and other instrumentation, must be wired as follows:
Connect the shield of each segment of the cable to ground at one end only.
Isolate cables as much as possible from sources of electrical noise.
Use an intermediate terminal strip to connect each device to the bus. This allows for easy removal of a device for servicing if necessary.
Install a ¼ Watt termination resistor (RT) between the (+) and (-) terminals of the device at each end point of a straight-line bus. The resistor should match the nominal impedance of the RS-485 cable (typically 120 ohms – consult the manufacturer’s documentation for the cable’s impedance value).
SHLD
RS-232 toRS-485Converter
TerminationResistor
+ SHLD + SHLD +
SHLD + SHLD + SHLD
RT
SHLD
+
RT
-+
COM
RS-485
SH + -
+ SHLD + SHLD
SHLD + SHLD +
SHLD TerminationBlock
+ SHLD
SHLD +SHLD
RS-232 toRS-485Converter
-+
COM
RS-485
SH + -

9500/9600 User’s Guide Ethernet Connections
Chapter 5 - Features and Applications Page 129
RS-485 Connection Methods to AvoidAny device connection that causes a branch in the main RS-485 bus should be avoided. This includes star and tee (T) methods. These wiring methods cause signal reflections that may cause interference. At any connection point on the RS-485 bus, no more than two cables should be connected. This includes connection points on instruments, converters, and terminal strips. Following this guideline ensures that both star and tee connections are avoided.
Ethernet ConnectionsRefer to the “Hardware Reference” chapter for specifications on both Ethernet port options for the 9500 and 9600 meters.
This section only applies if your 9500 or 9600 meter has the Ethernet option. There are two port options available: a 10 Base-T Ethernet port with an RJ45 modular connector or a 10 Base-FL Ethernet port with an ST-type connector. Using the -FL option disables the standard RJ45 port. This optional Ethernet port is capable of data rates up to 10Mbps, and supports TCP/IP, ION, Telnet, and Modbus/TCP protocols. The Ethernet port is controlled by the ETH1 Communications module.
The EtherGate feature provides communications both to an Ethernet connected device and through that device to a connected serial network (See “The EtherGate Protocol” on page 131).
Avoid 3-way “Star”connection point
Avoid 3-way “T” connection point
Ethernet

Ethernet Connections 9500/9600 User’s Guide
Page 130 Chapter 5 - Features and Applications
Meter Setup for Ethernet Communications
To enable communications through the meter’s Ethernet port, you must configure the Ethernet Communications module. The IP Address, Subnet Mask, Gateway, SMTP Server and SMTP Connection Timeout setup registers must properly match your system and can be set through the meter’s front panel or ACCESS software.
Configuring the Ethernet Module through the Front Panel
1. Select Network Setup from the 9600 Setup menu.
2. Configure the Ethernet Communications module IP Address, Subnet Mask, Gateway, SMTP Server and SMTP Connection Timeout setup registers to match your communications system.
Configuring the Ethernet Module via Designer
After you have wired your meter to the Ethernet network and performed basic setup, add the meter to your WinPM.Net network using the Management Console. (It is not necessary/possible to add an Ethernet site.)
Adding an Ethernet Device to your WinPM.Net Network
In the Management Console, the Ethernet Device Options screen appears when you add an Ethernet device (meter). Use this screen to describe your meter Ethernet address and other communications information. Be sure to include:
the server computer that will communicate with the Ethernet device
the Ethernet device TCP/IP address.
Configuring the Ethernet Module in Designer
To enable communications through the Ethernet port, you must configure the Ethernet (Communications) module. Launch Designer and configure the IP Address, Subnet Mask, Gateway, SMTP Server and SMTP Connection Timeout registers to match your system.
Server computer that communicates with the Ethernet device
Meter TCP/IP Address

9500/9600 User’s Guide Ethernet Connections
Chapter 5 - Features and Applications Page 131
The EtherGate ProtocolThe EtherGate protocol is a powerful communications tool that lets you communicate to a meter and through a meter simultaneously. When a meter installed on the Ethernet network has EtherGate enabled, a master device (such as a workstation running WinPM.Net software) can communicate to the meter, and through the meter to a serial network of devices wired to the meter’s COM port. EtherGate is available on serial ports COM1 and COM 2 in place of the ION, Modbus Master, Modbus RTU, or DNP 3.00 protocols. The protocol permits the direct transfer of data from up to 62 devices (31 devices per COM port).
Once you have the chain of serial devices installed, use Designer or the meter’s front panel to change the COM1 or COM 2 Protocol setting to EtherGate. The transfer of data between protocols is then handled automatically.
The Devices list in the Management Console appears as follows:
Refer to the ACCESS Meter as an Ethernet Gateway technical note for complete details on configuring your meter for EtherGate.
Ethernet
Specifying the TCP/IP Port instructs the ACCESS gateway meter to:7801—talk through COM17802—talk through COM27803—talk through COM3
Each device in the serial network must have a unique Unit ID and operate at the same baud rate.
The devices that reside on the RS-485 loop connected to the 9600.
The Gateway Site - set the IP Service Port 7801 for COM1 or 7802 for COM2. The number following the IP Service Port number is the device’s unique Unit ID.
The 9600 appears in the Devices list, because it must be configured as an Ethernet device before you can configure it as an Ethernet Gateway Site.
From the Type heading in the Sites window, you can see the 9600 has been configured as an Ethernet Gateway Site.

Internal Modem Connections 9500/9600 User’s Guide
Page 132 Chapter 5 - Features and Applications
Internal Modem ConnectionsRefer to the “Hardware Reference” chapter for internal modem specifications for the 9500 and 9600 meters.
This section only applies if your meter has an internal modem option. Depending on the ACCESS meter and its date of manufacture, the installed optional internal modem could be one of two different brands. The Conexant modem is the older type modem, and is available in North American (FCC approved) or European (CTR-21 compliant) versions. The newer modem is manufactured by Multi-Tech and is a universal modem that can be readily used in most countries, and complies with FCC, Industry Canada and TBR-21 regulations — refer to the Notices at the start of this document for more details.
The internal modem shares the communications channel with the optical port. It is factory-configured to respond (and the optical port is disabled). To enable communications through the meter’s internal modem, you must configure the Comm 3 Communications module. The Baud Rate, Unit ID, and Protocol setup registers must properly match your system, and the initialization string for the internal modem must be set up using the ModemInit register.
NOTE
The internal modem is multiplexed with the IrDA optical port on the meter’s front panel, so only onechannel can be in use at a time. To use the modem, the Comm Mode setup register of the Comm 3Communications module must be set to Modem (the default value).
ModemInit Setup RegisterThe ModemInit string register defines the initialization string for the internal modem, with a maximum of 47 characters. Edit the ModemInit register and enter the initialization string desired. The string is sent to the modem as soon as you download the COM1 module. Note that the string is also sent to the modem whenever the meter is powered up, or whenever the baud rate in the Comm 1 Communications module is changed. Any changes to the Modem Init or Baud Rate setup registers while the modem is online will cause the modem to disconnect from the phone line.
CAUTION
Changing the ModemInit setup register while the internal modem is online causes the modem todisconnect from the phone line.
Telephone Network

9500/9600 User’s Guide Internal Modem Connections
Chapter 5 - Features and Applications Page 133
Modem Initialization Strings
Refer to the technical note Modem AT Commands for a complete list of AT commands for both Conexant and Multi-Tech modems.
NOTE
The technical note also contains instructions on how you can determine your meter’s modem type basedon the meter’s serial number.
Adjusting the Modem Initialization String for CTR-21 Compliant modems
The table below shows the strings to add to the end of your modem configuration string setup register for each of three possible problems.
CAUTION
A Conexant Modem does not support Pulse dialing. The Conexant Modem should be the only device onthe telephone line. Attaching devices on the same line may cause one or more of these devices to operateincorrectly.
If your local modem (not the internal modem) is not already set up, configure it with the Remote Modem Configuration Utility according to the instructions in the online help. After the meter is installed and the internal modem is connected to the telephone network, the Comm 3 module can be configured using the meter’s front panel or ACCESS software. To learn how to connect the internal modem to the telephone network, consult your meter’s Basic Setup and Installation Instructions.
NOTE
The online WinPM.Net Help contains details on: commissioning an ACCESS network, managing modemconnections, setting up periodic dial-out, and configuring remote site event notification.
Problem Add to Modem Initialization String
Does not answer(modem does not detect ring tone) *NC70
Does not dial(modem does not detect dial tone)
In order of preference:*NC70, *NC70X0, *NC8 (Italy only)
Does not detect busy signal *NC70

Internal Modem Connections 9500/9600 User’s Guide
Page 134 Chapter 5 - Features and Applications
Configuring the Comm 3 Module through the Front Panel
1. Select COM 3 Setup > COM 3 Hardware > Mode > Modem from the meter’s setup menu. Press ESC to go back to the COM 3 Setup menu.
2. Select COM 3 Protocol to configure the Comm 3 communications module Baud Rate, Unit ID, and Protocol setup registers to match your communications system.
Configuring the Comm 3 Module via Designer
Before you can configure the Comm 3 module in Designer you must add the meter (with the internal modem) and a modem site to your WinPM.Net network.
Adding a Meter and a Modem Site to your WinPM.Net Network
In the Management Console, add the meter with the internal modem, and a modem site to your WinPM.Net network. Describe how your remote modem is wired and other communications information on the options screens.
Either before or after adding the Modem Site, you must add a dialout modem to the server computer. The server computer dialout modem communicates to the modem at the modem site. Refer to the online WinPM.Net Help to learn how to add a dialout modem.
On the Modem Site Options screen, be sure to include:
the server computer that will communicate with the remote modem
the remote modem telephone number
Configuring the Comm 3 Communications Module in Designer
Launch Designer, and configure the Comm 3 Communications module Baud Rate, Unit ID, and Protocol setup registers to match your communications system. Configure the initialization string for the internal modem using the ModemInit register. Refer to “ModemInit Setup Register” on page 132.
To avoid excessive communication errors, the baud rate of the modem site should match the baud rate of the COM 3 port of the meter.
Server computer that communicates with the remote modem. Ensure that the server computer dialout modem is configured.
Remote modem telephone number
Pick a local modem type from the drop-down box.

9500/9600 User’s Guide Internal Modem Connections
Chapter 5 - Features and Applications Page 135
The ModemGate ProtocolThe ModemGate feature creates a communications connection between the telephone network and an RS-485 serial network of devices. When you specify the protocol for a meter’s COM port as MODEMGATE, all data received by the meter’s internal modem is automatically transferred to the serial network. ModemGate is available on either COM1 and COM 2, but you cannot use the protocol on both ports simultaneously.
ModemGate connections do not connect a workstation with WinPM.Net (or other master device) to the gateway meter’s COM1 or COM 2 port, but rather the gateway meter’s internal modem port (COM 3).
The example below illustrates how the Management Console’s Sites and Devices windows appear:
Refer to the ACCESS Meter as a ModemGate technical note for complete details on configuring your meter for ModemGate.
Telephone Network
Meter with an internal modem on COM 3.The serial network is connected to COM1.Workstation with
WinPM.Net and modem
Each device on the RS-485 loop, including the gateway meter’s internal modem, must have a unique Unit ID.All serial devices must operate at the same baud rate as the gateway meter.
The Modem Site
The 9600 with in-ternal modem
The RS-485 device network connected to the meter with the internal modem. The same RS-485 serial protocol must be selected for connections to multiple devices along the same bus.

Infrared Port Connections 9500/9600 User’s Guide
Page 136 Chapter 5 - Features and Applications
Infrared Port ConnectionsRefer to the “Hardware Reference” chapter for the 9500 and 9600 meters’ infrared port specifications.
The infrared port is IrDA compliant. It can be used to communicate real-time measurements to a portable PC via the ION, DNP 3.00, or Modbus RTU protocols. To enable communications from the infrared port, you must configure the COM 3 Communications module. The Protocol, the Baud Rate and Unit ID setup registers must properly match your system. If you have the internal modem option, you must ensure that the Comm Mode setup register is set to select the IrDA port. When creating an ACCESS site, ensure that RtsCts is disabled (set to No) in the COM 3 serial site.
Refer to the Management Console online help for more details about adding serial sites.
This is your PC’s (workstation’s) COM port.
If you are using ACCESS software, ensure that RtsCts is disabled for the infrared port's site in Management Console.

9500/9600 User’s Guide Internet Connectivity
Chapter 5 - Features and Applications Page 137
Internet ConnectivityACCESS meters provide Internet connectivity so you can receive meter emails, view realtime data, and configure your system through a web browser from anywhere in the world. Your ACCESS meter provides the following internet connectivity options:
MeterM@il® feature (receive data logs and email alerts from the meter)
WebMeter® feature (onboard web server allows you to view real-time data and configure the meter through a web browser)
Microsoft Terminal Services for WinPM.Net (an WinPM.Net system that is located on a Terminal Server allows multiple users to view or configure an WinPM.Net system through a web browser)
WebReach (view WinPM.Net system information through a web browser)
WebMeter and MeterMailThe WebMeter feature provides real-time data display and system configuration of a meter over the Internet. The MeterM@il feature lets meters automatically transmit data by email to anyone, anytime, anywhere.
Both the 9500 and 9600 meters provide WebMeter and MeterM@il capability. The following sections provide WebMeter and MeterM@il details.
ACCESS WebMeter FeatureWebMeter-enabled meters have an on-board web server. Built-in web pages display certain energy and basic power quality information and also support basic meter configuration tasks. A meter with the WebMeter feature can be connected to your corporate Ethernet network like any other network device, and you can access it with a standard web browser like Internet Explorer.
Refer to the technical note WebMeter Internal Web Server Feature to learn how to:
view your WebMeter data on the Internet
configure your WebMeter-enabled meter
set up your network for the WebMeter feature
enable/disable web browser configuration of the meter
ACCESS MeterM@il FeatureThe MeterM@il feature allows your meter to send data logs as email attachments to a workstation, pager, cell phone, or PDA. In addition to the log export function, your meter can send email alerts.
Refer to the technical note ACCESS MeterM@il Internal Email Server Feature to learnhow to:
view MeterM@il data

WebReach 9500/9600 User’s Guide
Page 138 Chapter 5 - Features and Applications
set up your network for the MeterM@il feature
configure your meter to use the MeterM@il feature
set up the meter for your SMTP Serverset up the MeterM@il feature to send alertsset up the MeterM@il feature to send data logs
WebReachWebReach allows you to remotely view WinPM.Net information through a web browser. WebReach requires a simple URL and no client machine configuration so you have the flexibility to view your data from a web browser anywhere in the world. With WebReach, you can view real-time data and select views of historical/waveform data. Currently, no configuration or control functions are available through WebReach. Refer to the online WinPM.Net Help for more details on WebReach.
Telnet and HyperterminalYou can access certain Ethernet settings and statistics through a telnet application such as Microsoft Telnet. Similarly, you can use Windows HyperTerminal to access certain meter module settings. Use the following guidelines to determine which application you should use to access your meter:
If your meter is connected to an Ethernet network, use a telnet application such as Microsoft Telnet.
If your meter is connected serially or through a modem to your workstation, use a terminal application such as Windows HyperTerminal.
You can access certain Power Meter module and Factory module settings from both a Telnet session and HyperTerminal session. Both sessions also let you configure Factory module setup registers for Current Probe Input applications. Additionally, a Telnet session lets you view ethernet statistics and access certain Ethernet communications module settings.
Refer to the technical note Telnet and HyperTerminal Access for the appropriate application’s menu options and connection instructions.

9500/9600 User’s Guide Digital and Analog I/O
Chapter 5 - Features and Applications Page 139
Digital and Analog I/OThe digital and analog I/O ports on ACCESS meters let you bring a variety of data into a common system, thereby simplifying data gathering. The the 9500 and 9600 meters offers a variety of I/O combinations.
Standard in all meters are eight digital (status) inputs, four form A digital (solid-state) outputs, three form C relay outputs (electromechanical), and two front panel LED outputs. The digital inputs are ideal for monitoring status or counting pulses from external dry contacts. The four Form A outputs are suitable for performing end of interval pulsing, load control and alarm annunciation; the Form C relays are suitable for load switching applications. The LED outputs are used for energy pulsing and alarming.
There meter can be also be equipped with an optional I/O card which can include analog inputs and/or analog outputs or additional digital inputs. Analog inputs let you monitor a wide range of conditions, such as flow rates, RPM, fluid levels, oil pressures and transformer temperatures. Analog outputs let you output realtime power to an RTU or perform equipment control operations. Refer to the meter’s datasheet for the ordering options available on the optional I/O card. This card does not need to be ordered with your meter; it can be retrofitted to meters already operating in the field.
The inputs are controlled by Digital Input modules. The outputs can be controlled by Digital Output modules, Pulser modules, or Calibration Pulser modules. All of these modules can act as intermediaries between the hardware port and the other modules in the meter. They define the characteristics of outgoing signals or tell the meter how to interpret incoming signals.
Refer to the technical note Digital and Analog I/O for more information regarding digital and analog inputs and outputs than is provided in this User’s Guide.
Specifying a Port in an ION ModuleThe Digital Output, Digital Input, Analog Output, Analog Input, Pulser, and Calibration Pulser modules have Port setup registers that allow you to specify which port handles the outgoing or incoming signals. To assign a port to one of these modules, simply modify the Port setup register by picking a port from the enumerated list. This can be done with both Designer and ION Setup.
Be aware that the enumerated list only displays those ports that are not yet assigned to another module. For example, the meter’s factory configuration makes use of Digital Output DO4 (it is already assigned to Calibration Pulser module “kWh Pulser –D4”). If you create a new Digital Output module and set its Port setup register, the port DO4 does not appear in the list of available ports.
To make a port available, you must locate the module controlling the port and set its Port setup register to NOT USED (or delete the module entirely). The port now appears in the enumerated list.

Specifying a Port in an ION Module 9500/9600 User’s Guide
Page 140 Chapter 5 - Features and Applications
The following table describes the ports that can be configured (in the Digital Output, Pulser, Digital Input, Analog Input, Analog Output, and Calibration Pulser modules) to handle outgoing or incoming signals.
All 9500 and 9600 meters have these digital input/output ports. Optional analog input/output ports and optional digital inputs are also available on both meters.
Standard Output Port Names Description
Port R1 Digital (Form C Relay) Output port 1
Port R2 Digital Output port 2
Port R3 Digital Output port 3
Port D1 Digital (Form A Solid-State) Output port 4
Port D2 Digital Output port 5
Port D3 Digital Output port 6
Port D4 Digital Output port 7
kWh Pulse –LED LED Output
Alarm LED LED Output
Optional Output Port Names Description
Port AO1 Analog Output port 1
Port AO2 Analog Output port 2
Port AO3 Analog Output port 3
Port AO4 Analog Output port 4
Standard Input Port Names Description
Port S1 Digital (Status) Input port 1
Port S2 Digital Input port 2
Port S3 Digital Input port 3
Port S4 Digital Input port 4
Port S5 Digital Input port 5
Port S6 Digital Input port 6
Port S7 Digital Input port 7
Port S8 Digital Input port 8
Optional Input Port Names Description
Port AI1 Analog Input port 1
Port AI2 Analog Input port 2
Port AI3 Analog Input port 3
Port AI4 Analog Input port 4
Port DI1 Digital (Status) Input port 9
Port DI2 Digital Input port 10
Port DI3 Digital Input port 11
Port DI4 Digital Input port 12
Port DI5 Digital Input port 13
Port DI6 Digital Input port 14
Port DI7 Digital Input port 15
Port DI8 Digital Input port 16

9500/9600 User’s Guide Using the Onboard Digital Outputs
Chapter 5 - Features and Applications Page 141
Using the Onboard Digital OutputsDigital outputs are used for hardware relay control or pulse counting applications. For example, an ACCESS meter’s digital outputs can provide on/off control signals for capacitor banks, generators, and other equipment. The digital output ports can also send out status signals or kWh pulses, if the receiving device determines energy usage by counting pulses.
The meter provides three Form C mechanical relays and four Form A digital (solid-state) relays. The four Form A digital relays are suitable for performing end of interval pulsing, load control and alarm annunciation. All digital outputs can deliver a continuous signal or a pulse. (Contact Siemens for complete information regarding relay applications.)
CAUTION
The relay outputs of the meter should never be used for primary protection functions. Be sure that you arefamiliar with warnings at start of this document, as well as those presented your meter’s Installation &Basic Setup Instructions.
These outputs can be controlled by Digital Output modules, Pulser modules, or Calibration Pulser modules, depending on the application. For relay and control, the Digital Output module is used. For pulsing applications, the Pulser and Calibration Pulser modules are generally used. All of these modules can act as intermediaries between the hardware port and the other modules in the meter. They define the characteristics of outgoing signals.
Output ModulesBoth the Form A and Form C relays can be controlled with Digital Output modules, Pulser modules, or Calibration Pulser modules. By default, six Digital Output modules (labeled DO-D1 to DO-D3 and DO-R1 to DO-R3) are already created for this purpose. You can either use these modules, or create and configure other modules to control the output ports.
Calibration Pulser modules allow you to generate high accuracy energy pulses for calibration testing purposes. They integrate instantaneous power inputs.
Digital Output modules accept Boolean inputs, and output a continuous signal or pulses.
Pulser modules convert instantaneous pulses to pulses or transitions.
Consult the online ION Programmer’s Reference if you require more information about these ION modules.

Using the Onboard Digital Outputs 9500/9600 User’s Guide
Page 142 Chapter 5 - Features and Applications
Configure the settings of the controlling module to match your requirements. The settings in these modules are as follows:
1 See “Calibration Pulsing Relay DO4,” below.
Ensure that the module’s Port setup register matches the meter’s output you want to control. If the port you want to use does not appear in the Port setup register’s list, that port is in use by another module. Edit the port setup register of the module using that port and set it to NOT USED – the port will then be available to other modules.
Calibration Pulsing Relay DO4
Solid-state relay DO4 is factory configured for calibration pulsing and requires no further setup. The Calibration Pulser module labeled kWh Pulser –D4 controls this port. By default, the module is linked to the kW del+rec output of the Arithmetic module labeled “del, rec” (in the Demand Framework). (This Arithmetic module is linked to the MU Power Meter module’s MU kW tot output.) The port will output a pulse for every 1.8 Wh accumulated (in NORMAL or TEST mode). This is the same pulsing rate as the middle LED on the front panel of the meter.
ION Module Setup Registers Available Settings Creation Default Description
Digital Output
Port
Not UsedPort DO1Port DO2Port DO3Port DO4 1
Port R1Port R2Port R3kWh Pulse –LEDAlarm LED
Not Used The output hardware channel
Pulse Width 0 to 2000000 0 Pulse Width, in seconds(0 for continuous pulse)
Polarity Inverting or Non-Inverting Non-Inverting Inverted or non-inverted output
EvLog Mode Log on or Log off Log offWhether or not to log status changes in the Event Log
Pulser
Port As per Digital Output, above Not Used The output hardware channel
PulseWidth 0.020 to 2000000 1 Pulse width, in seconds
OutputMode Pulse or KYZ Pulse Full pulse or KYZ (transition pulse)
Polarity Inverting or Non-Inverting Non-Inverting Inverted or non-inverted output
Calibration Pulser
Port As per Digital Output, above Not Used The output hardware channel
Pulse Width 0.010 to 1.000 0.05 Pulse Width, in seconds
Kt 0.01 to 1000000000 1.8 Watts per pulse
Int Mode Forward, Reverse, Absolute, or Net Absolute Integration modes that may be selected
OutputMode Pulse or KYZ Pulse Full pulse or KYZ (transition pulse)

9500/9600 User’s Guide Using the Onboard Digital Outputs
Chapter 5 - Features and Applications Page 143
Energy Pulsing with LEDsYou can customize the operation of two LEDs on the meter’s front panel: the kWh Pulse –LED and the Alarm LED.
kWh Pulse –LED
By default, the middle green LED on the meter’s front panel is factory configured to be an energy pulser. Like solid-state relay output DO4, the kWh Pulser –LED is controlled by a Calibration Pulser module that has its Source input linked to the kW del+rec output of the Arithmetic module labeled “del, rec.” (This Arithmetic module is linked to the MU Power Meter module’s MU kW tot output.). The LED port outputs a pulse for every 1.8 Wh accumulated (in both NORMAL and TEST mode).
Changing the value for the Kt setup register of the controlling Calibration Pulser module lets you modify the pulsing rate of either channel. If you want to configure the LED port for a different pulsing application, you must re-link the Source input to the output register of a different instantaneous power quantity in one of the Arithmetic modules in the Demand Framework. Ensure that the quantity you choose originates from the MU (meter units) Power Meter module.
Alarm LED
The red (bottom) LED on the front panel of the meter is provided for custom applications. It can be linked to a framework to provide notification to any event. Possible applications include sag/swell alarming, setpoint annunciation, and tariff notification. Like all the other outputs on the meter, this port can be controlled by a Digital Output, Pulser, or Calibration Pulser module.
kWh Pulser LED
front panel
1.8 Wh pulsing(default)
DIGITAL OUTPUTS
D3
- +
D2
- +
D1
- +
D4
- +
rear of unit(bottom right)
kWh Pulser D4

Using the Onboard Digital Inputs 9500/9600 User’s Guide
Page 144 Chapter 5 - Features and Applications
Using the Onboard Digital InputsDigital inputs are necessary for status monitoring or pulse counting applications. Status monitoring can help you prevent equipment damage, improve maintenance, or track security breaches. Some common status monitoring applications are monitoring the closed/open positions of breakers, on/off status of generators, armed/unarmed conditions in a building alarm system, and over/under pressures of transformers.
The meter has eight status input ports. The function of each status input is controlled by a Digital Input module; this module tells the meter how to interpret incoming signals. Digital Input modules can be linked with other modules for counting status changes.
The function of each status input is controlled by the Digital Input modules DI-S1 to DI-S8. (Eight Counter modules for counting status changes and an External Pulse module for resetting them are included with the Digital Input framework.)
NOTE
The Digital Inputs on the Optional I/O card are controlled by the Digital Input modules I/O-S1 to I/O-S8. However, on the Optional I/O card itself, the inputs are labelled DI1 to DI8
The settings in the Digital Input modules are as follows:
Setup Register Available Settings Creation Default Description
Input Mode Pulse or KYZ Pulse Complete pulse or KYZ transition pulse
EvLog Mode Log Off or Log On Log Off Whether or not to log status changes in the Event Log
Debounce 0 to 65.25 0.010 Mechanical contact bounce, in seconds
Polarity Non-Inverting or Inverting Non-Inverting Non-inverted (or level) pulse
Port
Not UsedPort DI1Port DI2Port DI3Port DI4Port DI5Port DI6Port DI7Port DI8
Not Used The input hardware channel controlled

9500/9600 User’s Guide Analog Inputs
Chapter 5 - Features and Applications Page 145
Analog InputsAnalog inputs can measure and store analog information such as electrical signals from transducers; transducers derive the electrical signals from flow rates, temperatures, pressures, rotations, and fluid levels. They are controlled by Analog Input modules.
Analog inputs require the installation of an optional circuit board inside the meter. The I/O card provides four analog inputs. By default, four Analog Input modules (labeled AI1 to AI4) are already created for this purpose. Configure the settings of the controlling module to match your requirements. The settings in these modules are as follows:
1 An arbitrary input value can be treated as the Zero Scale (i.e., a 4-20mA input is capable of generating a 0 to X output).
Analog OutputsAn ACCESS meter’s analog outputs act as transducers. The meter measures power and energy, and then sends that information via the analog outputs to a remote terminal unit (RTU). The analog outputs issue industry standard 0 to 20 mA current signals. They are controlled by the Analog Output modules.
Analog inputs require the installation of an optional circuit board inside the meter. The I/O Card provides four analog outputs. By default, four Analog Output modules (labeled AO1 to AO4) are already created for this purpose. Configure the settings of the controlling module to match your requirements. The settings in these modules are as follows:
Setup Registers Available Settings Creation
Default Description
Port Not Used orAI1 to AI4 inclusive Not Used The input hardware channel
Full Scale -1 x 10⁹ to 1 x 10⁹ 1Defines what value appears in the ScaledValu output register when the highest possible value from the hardware is applied
Zero Scale 1 -1 x 10⁹ to 1 x 10⁹ 0
Defines what value appears in the ScaledValu output register when the lowest possible value from the hardware is applied
Setup Registers Available Settings Creation
Default Description
PortNot UsedAO1 to AO4 inclusive Not Used The output hardware channel
Full Scale -1 x 10⁹ to 1 x 10⁹ 1Defines what value appears in the ScaledValu output register when the highest possible value from the hardware is applied
Zero Scale -1 x 10⁹ to 1 x 10⁹ 0
Defines what value appears in the ScaledValu output register when the lowest possible value from the hardware is applied

Time Synchronization 9500/9600 User’s Guide
Page 146 Chapter 5 - Features and Applications
Time SynchronizationTime synchronization lets you synchronize the internal clocks of all networked meters and devices. Once synchronized, all data logs have timestamps that are relative to a uniform time base. This allows you to achieve precise sequence-of-events and power quality analyses. To synchronize clocks, use ACCESS software to broadcast time signals across the network.
Refer to the technical note Time Synchronization & Timekeeping for more information on implementing time synchronization for your system.
Enabling or Customizing Time Synchronization
1. Launch the Management Console.
2. From the System Setup Pane, select Sites or Devices.
Select Sites if you want to customize a particular serial, modem, or Ethernet Gateway site.
Select Devices if you want to customize an individual Ethernet device.
3. Right-click in the main window and select Properties.
4. Right-click inside the display window and select Advanced Properties.
The fields for enabling or customizing time synchronization are shown below.
The Property Description area explains the purpose for each field. The default time synchronization interval of 3,600 seconds (displayed in milliseconds) is acceptable for most ACCESS installations.
NOTE
You need appropriate permissions to configure the meters on your network. Refer to the technical noteION Security for details on software and meter security.
Use these fields on the Site Advanced Properties screen to enable timesynchronization or set custom intervals for any device in any Serial Site or Ethernet Gateway Site.
These fields appear in the Devices Advanced Properties screen for Ethernet devices. Serial devices are configured via the Serial Siteadvanced properties.

9500/9600 User’s Guide Meter Security
Chapter 5 - Features and Applications Page 147
Meter SecurityThe meter’s security settings allow you to configure the meter through the front panel, with ACCESS software, or with the optional embedded web server.
Standard meter security
Anytime you make configuration changes to your meter, either through the front panel or with ACCESS software, you must enter a password.
Anti-tamper sealing
Your revenue meter can be protected by anti-tamper sealing.
Software security
ACCESS software security brings access-level security to the meter. With ACCESS software, you can configure multiple users with different passwords and specify access rights. For example, one user may have view-only rights, while another user may have meter configuration rights. ACCESS software security only applies to users who are accessing the meter via ACCESS software.
For more information on meter security, refer to the ION Security technical note in Appendix A.
Standard Meter SecurityStandard meter security lets you configure the meter through the front panel or with communications software using a meter password.
This section describes password security options available from the front panel of the meter. Step-by-step instructions are given to help you enter, or change the meter password and disable (enable) the password security check on the front panel of the meter.
Entering the Password through the Front PanelThe first time you make a change to any setting you are presented with the Password display. The factory configured password is zero (0). The password prevents unauthorized tampering with your meter’s configuration. Depending on site security, you may want to modify the user password from the default to protect your configuration. The default password is “0” and can be set to a maximum numeric value of 99999999.

Standard Meter Security 9500/9600 User’s Guide
Page 148 Chapter 5 - Features and Applications
Changing the Meter Password
1. Scroll down the Setup menu and select the Security Setup menu.
2. Press the PROG button to enter the Security Setup menu.
3. Press the MODIFY softkey. The menu selection Password becomes highlighted as well as the last zero.
4. Enter your new numeric password.
To change the value of the highlighted digit use the Up/Down arrow buttons.
To change the position of the cursor one space to the left or right, use the Left/Right arrow buttons.
5. Press PROG to accept the new password.
6. Press PROG to confirm your selection.
Disabling (and enabling) password security
Though it is not recommended, you can disable the meter password.
1. Scroll down the Setup menu and select the Security Setup menu.
2. Press the PROG button to enter the Security Setup menu.
3. Enter the current password and press PROG if you are presented with the Enter Password screen.
4. Press the softkey titled ENABLE, and select Yes to enable password security (if it has been disabled) or No to disable it.
5. Press PROG to make your selection. The Confirm screen appears.
6. Press PROG to confirm the change.

9500/9600 User’s Guide Data and Event Logging
Chapter 5 - Features and Applications Page 149
Data and Event LoggingThe meter includes powerful data logging and event recording capabilities. Data and event logs recorded by the meter are prioritized and stored onboard. Data is retrieved periodically by the WinPM.Net software Log Server (or other third party application).
If you use WinPM.Net software, all retrieved data from your system is stored in an ODBC-compliant database. The information in the database can be viewed and analyzed using WinPM.Net software applications such as Vista (for viewing), or Reporter (for organizing and presenting data).
Data LoggingThe meter ships with a comprehensive data-logging configuration. Information regarding the default logging capacity and default logging configuration can be found in “Data Logging Setup” on page 53.
To learn more about the data recorder modules in your meter, refer to ION Device Templates at www.pwrm.com. ION Device Templates lists all of the ION modules available in the current version of your meter, and the total number of each module. ION Device Templates also shows the ranges or options available for each module’s setup registers.
Changing the Parameters that are LoggedThe meter’s factory configuration logs a comprehensive set of energy, power and harmonics parameters. You cannot change which parameters are logged by configuring a setup register. Adding or deleting a log’s parameters is an advanced procedure, as it requires changes to the links between modules, so you must use Designer.
Refer to the Designer section of the chapter ACCESS Software Tools. Once you are comfortable editing module links, you can change the logged parameters by linking the output registers you want logged to the inputs of an ION Data Recorder module.
Changing Waveform RecordingThe Waveform Recorder modules do not require changes to their default settings. If you want to change the format of the recorded waveforms, refer to the Waveform Recorder module description in the online ION Programmer’s Reference.

Event Logging 9500/9600 User’s Guide
Page 150 Chapter 5 - Features and Applications
Event LoggingEvents produced by a meter’s various ION modules are prioritized and grouped to facilitate custom logging. Each event is assigned a priority group number based on its type and severity.
ION Event Priority GroupsSome event groups are preset with a Priority Number as shown in the table below. You can also define your own priority number for some modules. Priority numbers from 128-191 appear in the global even log viewer in WinPM.Net software. Priority numbers from 192-255 are logged, initiate a beep and cause the window to flash. You can customize these responses to display messages or perform netsend messages, for example.
The Event Log Controller module allows you to set a priority cutoff for event logging. Any events with a priority number greater than the cutoff value are logged, and events with lower priorities are discarded. Refer to the individual module descriptions and the Event Log Controller module description in theonline ION Programmer’s Reference for more details.
Event Group Description Priority Number
Reset Module reset or re synchronized 5
Setup Change Module setup changes (setup register changes, label changes, input handle changes) 10
Input Register Change Inputs of certain modules change value (ie, input to And/Or module changes) 15
I/O State Change I/O state changes (ie, relay closes) 20
Information Module produces important user information 25
Warning Module produces a warning 30
EN50160 Event(9600 only)
An EN50160 Counter (N1 or N2) increases 50
Failure A failure has occurred 255
Setpoint Setpoint condition goes Active or Inactive (ie, Sag/Swell module detects a disturbance) programmable viamodule setup

9500/9600 User’s Guide Logging and Recording Capacity
Chapter 5 - Features and Applications Page 151
External ION EventsSome events are not produced by a specific module; they are generated internally by the meter. These events and their associated priority levels are shown in the table below.
Logging and Recording CapacityThe meter provides both data and event logs, but the amount of memory required to store these logs depends on the number of parameters being logged and the frequency with which these parameters are logged. The following equation can help determine the amount of memory required to store data and event logs:
each record consumes (in Bytes) = ((number of parameters * 5) + 8)
The meter can also perform waveform recording. It can simultaneously capture events on all channels to a maximum of 96 cycles each. To calculate the waveform memory usage use the following formula:
waveform memory usage (in Bytes) = (2*(number of samples per cycle) + 10)*(number of cycles in waveform) + 30
NOTE
Round up to the next kilobyte after each of the above calculations.
Event Group Description Priority Number
Warning
Factory initialize performed
30
Firmware or memory upgrade performed
Meter power-up or power-down
Internal modem not responding or modem recovered
Battery low
Telnet or serial terminal locked out
Security disabled or enabled
Failure Communications fail to allocate required memory 255

Logging Configurations for 9500 Revenue Meter Applications 9500/9600 User’s Guide
Page 152 Chapter 5 - Features and Applications
Logging Configurations for 9500 Revenue Meter ApplicationsYou can alter the logging capacity of your 9500 meter, if it is being used for revenue metering applications. A suggested configuration is shown in the table below. To make use of the suggested revenue logging configuration, you must make all of the changes outlined below.
The following configuration does not apply to the 9600 meter, as it has a specific Revenue Log (see Chapter 2 for more details). This configuration is for an 9500 with standard 1Mb log memory.
Log Depth Interval ION Modules Requiring Settings Changes
Revenue Log 760 35 days Data Recorder module “Revenue Log”Periodic Timer module “Revenue Log Trg”
Loss Log 760 35 days Data Recorder module “Loss Log”Periodic Timer module “Loss Log Trg”
Time Of UseData Recorders 20 Triggered
on demand No changes required
Historic Logs 192 2Data Recorder modules “Hist mean Log,” “Hist high Log,” and “Hist low Log”Periodic Timer module “Hist Log Trig”
Harmonics Logs 48 2Data Recorder modules “Harm mean Log” and “Harm high Log”Periodic Timer module “Harm Log Trig”
Waveform recording 5 Triggered on demand Data Recorder module “EgyDmd Log”
Report Generator Log 192 2 Data Recorder module “EgyDmd Log”Periodic Timer module “EgyDmd Log Trig”
Sag/Swell Log 100 Triggered on demand No changes required
Event Log 500 Triggered on demand No changes required

9500/9600 User’s Guide Alerting
Chapter 5 - Features and Applications Page 153
AlertingThe purpose of an ACCESS alert system is to send an email or to contact a modem, fax, pager, or software in the event of a user-specified condition. These conditions can be changes in relays or power quality problems including surges, sags, swells and outages. With ACCESS alarm notification, you can automatically advise key people of problems allowing quick remedial action, or notify ACCESS software so logs can be uploaded from the site that initiated the alert.
The Alert module sends an alert whenever its Trigger input is pulsed. You can connect this input to any module that produces a pulse output. You can use modules that monitor alarm conditions such as changes in relay status and power quality problems. For example, you can connect the Trigger input to the output of a Setpoint module, thereby allowing the Alert module to send an alert when the setpoint condition is reached.
The Alert module delivers these types of alerts:
Numeric Pager
Alphanumeric Pager
PEGASYS (for alerts to PEGASYS software)
ION Alert (for alerts to WinPM.Net software)
ASCII
Selection between modes is made with the Alert module Alert Type setup register.
The Alert module requires access to either a modem (a dedicated modem or a modem handling a loop of meters) or Ethernet (for the Alert module email capabilities).
Alerting is briefly described in the following section. For detailed information about alerting, including how to build a framework to send alerts, refer to the Alert module description in the online ION Programmer’s Reference.
Alerting ACCESS Software via the Alarm ServerNOTE
For detailed information about sending alerts to WinPM.Net/PEGASYS software via the Alarm Server,refer to the WinPM.Net online help.
The Alarm Server can run on any ACCESS software Primary or Secondary server. The server computer should have a dedicated phone line and modem. Modems at remote sites are programmed to dial the server's phone number when a priority event occurs. The Alarm Server monitors the phone line and waits for the remote sites to annunciate events. The most common use of the Alarm Server is to handle Remote Site Event Notification.

Alerting ACCESS Software via the Alarm Server 9500/9600 User’s Guide
Page 154 Chapter 5 - Features and Applications
Remote Site Event Notification
The Alarm Server uses a series of command line arguments to specify the actions it takes when a priority event is reported. These commands must be entered on the computer that is running the Alarm Server utility. Typically the Alarm Server is configured to launch the Connection Manager, which dials up the remote site and retrieves the logs from the devices. The Alarm Server can also be configured to launch other applications. A series of parameter switches are added to the command line to pass information about the event to the application that is launched.
Configuring the Alarm Server
The Alarm Server should have a dedicated phone line, modem, and COM port to avoid conflicts with other ACCESS software components.
The modem used by the Alarm Server is not configured with the Management Console– only dialout modems are configured in the Management Console. The Alarm Server's executable, alarmsrv.exe, is typically located in \\Siemens\WinPM.Net\SYSTEM\bin. You can run the Alarm Server in a console window, or you can define a shortcut icon that includes all of the command line arguments required.
Alarm Server Command Line Arguments
Refer to the online WinPM.Net Help for a list of command lines that the Alarm Server supports.
Dedicated AlarmServer Modem
Modem Site
Any DialoutModem
ConnectionManager
Alarm Server.exe
Server or LAN
CommunicationServices contactthe modem siteand retrievepriority messages
3.
Remote Siteinforms theAlarm Serverthat a prioritymessage exists
1.
Servercomputerreceives thealarm
2.

9500/9600 User’s Guide Alerting via an Alphanumeric Pager
Chapter 5 - Features and Applications Page 155
Alerting via an Alphanumeric PagerNOTE
For detailed information about building a framework for alerting via an alphanumeric pager, refer to theAlert module description in the online ION Programmer’s Reference.
If an alphanumeric pager is specified as the destination address in the Alert module, then an alphanumeric paging service receives a message from the ACCESS meter.
Once the modem at the paging service is contacted, the ACCESS meter transmits the following information:
Pager identification number
Local time (year, month, date, hours, minutes, seconds)
Remote site identification
Priority of the alarm
Alert message, with text strings and realtime measured values
To include a module’s Source input in the message, reference the message string by using the form %Vn, where n is the Source input number. In the following Message register setting, the kWtot value is %V1. The string includes Source input 1 which would be the kWtot register from the Power Meter module.
The destination register contains your modem access number for the paging service provider and is what is dialed out first. The Pager Num register is the pager access number that is provided by your paging company.

Alerting via a Numeric Pager 9500/9600 User’s Guide
Page 156 Chapter 5 - Features and Applications
Alerting via a Numeric PagerNOTE
For detailed information about building a framework for alerting via a numeric pager, refer to the Alertmodule description in the online ION Programmer’s Reference.
If a numeric pager is specified as the destination address in the Alert module, then a numeric paging service receives a message from the ACCESS meter. Due to the inherent limitations in numeric paging, the ACCESS meter can only send a string of digits to the paging service. The Alert module then waits a specified time, determined by the number of commas inserted after the phone number in the Pager Num setup register. Finally, the Alert module dials the message digital string.
There are two important factors to consider when setting up the Alert module for numeric paging. First, be sure to specify a string of digits that is meaningful to you, such as a coded message. Second, be aware that there is no way to assure that a message has been successfully transmitted. Instead, there may be a busy signal or an answering machine may take the call. The number of commas you add to your dial string is an estimate of how long the modem at the remote site waits before it transmits numbers.
NOTE
In the following destination-setting example: 1-250-555-666,,,,,999#, the pager number is 1-250-555-666 and the message string that displays on the pager is 999. You may need to insert 9,,, before thedestination number if the line you are using is not a direct line. In this case the destination number is 9,,1-250-555-666,,999#

9500/9600 User’s Guide Alerting via Email
Chapter 5 - Features and Applications Page 157
Alerting via Email NOTE
For detailed information about setting up your network and building a framework for meter email(MeterM@il) alerts, refer to the technical note ACCESS MeterM@il Internal Email Server Feature.
If email is specified as the destination address in the Alert module then an email message is sent to any address you specify. You can only set one email address per Alert module. If you want to send an alert to more than one email address you need to create a group — be sure your email server is configured to send email to groups via SMTP (Simple Message Transport Protocol).
Follow the steps below to send email alerts from your meter. Note that your meter must support emailing (with a correctly configured SMTP server):
1. Create an Alert module.
2. Configure these Alert module setup registers as indicated:
Message – type in the text of the alert to be emailed.
Destination – type in the destination email address.
Type – select Email.
Com Port – select Ethernet.
Location – type in a custom string; this is optional, and appears in the email.
Email From – type in an address that you want the email to appear from. This may be required as some SMTP servers only accept emails from valid addresses.
3. Create an ION module that will produce a pulse on its Trigger output when the exceptional event occurs (for example, a Setpoint module pulses its Trigger output when the setpoint condition is reached).
4. Link the Alert module’s Trigger input to the Trigger output of the module created in step 3.
5. Send and save. When the Trigger input is pulsed, the Alert module establishes communications with the SMTP mail server, and emails the alert message.

Calculating Power Availability: Number of Nines 9500/9600 User’s Guide
Page 158 Chapter 5 - Features and Applications
Calculating Power Availability: Number of NinesPower availability is becoming an increasingly important topic in today’s electronic world. As the use of electronic equipment increases in industry and the home, the degree of tolerance for power outages has decreased. In some cases, a very short loss or reduction of supply voltage can have a large economic impact.
The purpose of calculating the “Number of Nines” is to provide a measurement of the time that power was available at the point the meter is monitoring. This value can be used alone or incorporated into other reliability calculations. Availability can be calculated as a percentage of total time (since the last reset).
A typical utility distribution system provides an availability of approximately 99.9%. Many applications require better availability than this: up to 99.9999% or better. It has become common to refer to high availability using the “Number of Nines”: 99.9% corresponds to 3 nines; 99.9999% is 6 nines.
Once the meter is installed, the availability calculations must be reset to ensure valid time counts. You can reset the availability calculations with Vista software, ION Setup software, or through the meter’s front panel.
For more information on the power availability, refer to the technical note Power Availability.

6 Hardware Reference
This chapter is intended to provide quick, at-a-glance, technical specifications for the more common hardware features of the 9500 and 9600 meters. Not all specifications are included.
All specifications are subject to change without notice. For the most recent information see the meter’s Datasheet.
In This Chapter
Standard Model . . . . . . . . . . . . . . . . . . . . . . . . . . . . . . . . . . . . . . . . . . . 160General Specifications . . . . . . . . . . . . . . . . . . . . . . . . . . . . . . . . . . . . . . . . . . . . . . . . 161Unit Dimensions . . . . . . . . . . . . . . . . . . . . . . . . . . . . . . . . . . . . . . . . . . . . . . . . . . . . 162Communications Specifications . . . . . . . . . . . . . . . . . . . . . . . . . . . . . . . . . . . . . . . . 163COM1 Port . . . . . . . . . . . . . . . . . . . . . . . . . . . . . . . . . . . . . . . . . . . . . . . . . . . . . . . . . 164COM2 Port . . . . . . . . . . . . . . . . . . . . . . . . . . . . . . . . . . . . . . . . . . . . . . . . . . . . . . . . . 166COM3 Port . . . . . . . . . . . . . . . . . . . . . . . . . . . . . . . . . . . . . . . . . . . . . . . . . . . . . . . . . 166Ethernet Port . . . . . . . . . . . . . . . . . . . . . . . . . . . . . . . . . . . . . . . . . . . . . . . . . . . . . . . . 167
I/O Specifications . . . . . . . . . . . . . . . . . . . . . . . . . . . . . . . . . . . . . . . . . . 169
Electrical Specifications . . . . . . . . . . . . . . . . . . . . . . . . . . . . . . . . . . . . . . 174
Retrofit Options . . . . . . . . . . . . . . . . . . . . . . . . . . . . . . . . . . . . . . . . . . . . 176Terminal Cover . . . . . . . . . . . . . . . . . . . . . . . . . . . . . . . . . . . . . . . . . . . . . . . . . . . . . . 176Communications Card . . . . . . . . . . . . . . . . . . . . . . . . . . . . . . . . . . . . . . . . . . . . . . . 177I/O Expansion Card . . . . . . . . . . . . . . . . . . . . . . . . . . . . . . . . . . . . . . . . . . . . . . . . . . 178
TRAN Model . . . . . . . . . . . . . . . . . . . . . . . . . . . . . . . . . . . . . . . . . . . . . . 180Environmental Conditions . . . . . . . . . . . . . . . . . . . . . . . . . . . . . . . . . . . . . . . . . . . . 180Unit Dimensions . . . . . . . . . . . . . . . . . . . . . . . . . . . . . . . . . . . . . . . . . . . . . . . . . . . . 180

Standard Model 9500/9600 User’s Guide
Page 160 Chapter 6 - Hardware Reference
Standard Model
+_
SHORTING BLOCK or TEST BLOCK
3~ VOLTAGE INPUTS 3~ CURRENT INPUTS
V3 V4 Vref I11 I12 I21 I22 I31 I32 I41 I42 I51V1 V2 I52
SCOM
S1
S2
S3
S4
S5
S6
S7
S8
D3
- +
D2
- +
D1
- +
D4
- +
DIGITAL INPUTS DIGITAL OUTPUTS
V+ (30 V max)
Relay
I/O Expansion CardBackplate
Communications CardBackplate
Power Supply
Relays
G N _L +
Rear View of Meter
R11 R12 R13 R21 R22 R23 R31 R32 R33
External Dry Contacts(polarity for SSRcontacts shown)
Current Inputssee page 175
Power Supplysee page 174
I/O Expansion Cardsee page 178
Digital Inputssee page 169
Communications Cardsee page 177
Digital Outputssee page 170
Voltage Inputssee page 174

9500/9600 User’s Guide General Specifications
Chapter 6 - Hardware Reference Page 161
General Specifications
Environmental ConditionsTo operate properly and effectively, environmental conditions should fall within the guidelines listed below.
1 Display visibility may be adversely affected below 0°C.
Environmental Condition Acceptable Range
Location Indoor use
Operating Range -20°C to +70°C (-4°F to +158°F) with no formation of ice.
Display Operating Range -20°C to +60°C (-4°F to +140°F)1
Storage -40°C to +85°C (-40°F to +185°F)
Humidity 5 to 95% non-condensing

Unit Dimensions 9500/9600 User’s Guide
Page 162 Chapter 6 - Hardware Reference
Unit Dimensions
Basic Model — Rear View
31.9 mm[1.23“]
[2.322“] [4.35“]80.9 mm[3.19“]
43.3 mm[1.71“]
192.0 mm[7.56“]
82.5 mm[3.25“]
5.1 mm[0.20“]
8.48 mm[0.33“]
192.0 mm[7.56“]
56.1 mm[2.21“]
11.5 mm[0.45“]
9.5 mm[0.38“]
60.7 mm[2.39“]
81.1mm[3.19“]
14.2 mm[0.56“]
14.2 mm[0.56“]
43.9 mm[1.73“]
18.3 mm[0.72“]
11.1 mm[0.44“]
192.0 mm[7.56“]
192.0 mm[7.56“]
12.6 mm[0.50“]
159.2 mm[6.27“]
183.9 mm[7.24“]
Basic Model — Front View Basic Model — Side View

9500/9600 User’s Guide Communications Specifications
Chapter 6 - Hardware Reference Page 163
Communications SpecificationsThe following illustration shows all the possible connections to the communications card.
1 10Base-FL option will only be available if -FL was specified when the meter was ordered.
RS-232 DTE
COM 1
RS-485
SH - SH+ +-COM 1COM 2
TXD
RXD
TXD
RXD
HAZARDOUS VOLTAGEHAUTE TENSION
L + N -
LINKFL/T
10BASE-T10BASE-FLTXRX
MODEMRI
DCD
ACTIVITYFL/T COM 3 RXDTXD
Complies with Part 68, FCC Rules (North American Modem).Complies with Part 68, FCC Rules (North American Modem).FCC Registration Number: DHUCAN-27064-MD-EFCC Registration Number: DHUCAN-27064-MD-ERinger Equivalence: 0.6BRinger Equivalence: 0.6B
Complies with CTR21 (European Modem).Complies with CTR21 (European Modem).C COM ARD
G
ST-typeconnector RJ45 RJ11
Captured-wireconnectors
DB9 Connector(male)
62.5/125 µmmultimode fiber
Category 3or 5 UTP
FCC part 68compliant
telephone cord
22 AWG (0.50 mm )shielded, twisted pair
2
Standard RS232Cable with DB9
female connector
The optical (infrared) communications port is located on the front of the unit. It shares COM3 with the internalmodem order option.
COM Port Available Connections Standard/Option
1 Selectable RS-232/RS-485 port Standard
2 Dedicated RS-485 port Standard
3 IrDA optical port Standard
3 Internal modem Option
4 10Base-T (or –FL) Ethernet 1 Option
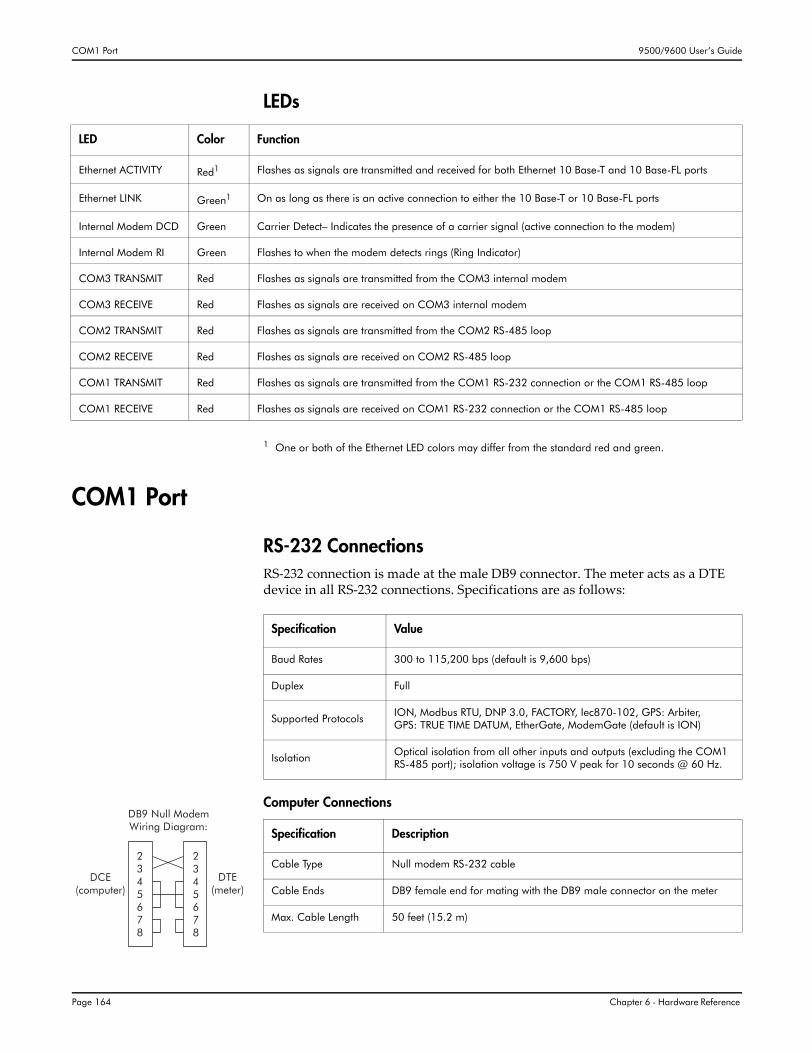
COM1 Port 9500/9600 User’s Guide
Page 164 Chapter 6 - Hardware Reference
LEDs
1 One or both of the Ethernet LED colors may differ from the standard red and green.
COM1 Port
RS-232 ConnectionsRS-232 connection is made at the male DB9 connector. The meter acts as a DTE device in all RS-232 connections. Specifications are as follows:
Computer Connections
LED Color Function
Ethernet ACTIVITY Red1 Flashes as signals are transmitted and received for both Ethernet 10 Base-T and 10 Base-FL ports
Ethernet LINK Green1 On as long as there is an active connection to either the 10 Base-T or 10 Base-FL ports
Internal Modem DCD Green Carrier Detect– Indicates the presence of a carrier signal (active connection to the modem)
Internal Modem RI Green Flashes to when the modem detects rings (Ring Indicator)
COM3 TRANSMIT Red Flashes as signals are transmitted from the COM3 internal modem
COM3 RECEIVE Red Flashes as signals are received on COM3 internal modem
COM2 TRANSMIT Red Flashes as signals are transmitted from the COM2 RS-485 loop
COM2 RECEIVE Red Flashes as signals are received on COM2 RS-485 loop
COM1 TRANSMIT Red Flashes as signals are transmitted from the COM1 RS-232 connection or the COM1 RS-485 loop
COM1 RECEIVE Red Flashes as signals are received on COM1 RS-232 connection or the COM1 RS-485 loop
Specification Value
Baud Rates 300 to 115,200 bps (default is 9,600 bps)
Duplex Full
Supported ProtocolsION, Modbus RTU, DNP 3.0, FACTORY, Iec870-102, GPS: Arbiter,GPS: TRUE TIME DATUM, EtherGate, ModemGate (default is ION)
Isolation Optical isolation from all other inputs and outputs (excluding the COM1 RS-485 port); isolation voltage is 750 V peak for 10 seconds @ 60 Hz.
Specification Description
Cable Type Null modem RS-232 cable
Cable Ends DB9 female end for mating with the DB9 male connector on the meter
Max. Cable Length 50 feet (15.2 m)
2345678
2345678
DB9 Null ModemWiring Diagram:
DCE(computer)
DTE(meter)

9500/9600 User’s Guide COM1 Port
Chapter 6 - Hardware Reference Page 165
External Modem Connections
RS-485 ConnectionsRS-485 connections are made via the captured-wire connectors on the rear of the meter. Devices can be connected in series using RS-485 (see diagram to the left). Be sure not to ground the wires at both ends.
Specifications are as follows:
Connections
1 The lengths of all (+ and –) cable segments must be counted including those that connect devices to terminal blocks.
Terminal connections on the meter are marked as follows:
Specification Description
Cable Type Standard straight-through RS-232 cable
Cable Ends DB9 female end for mating with the DB9 male connector on the meter
Max. Cable Length 50 feet (15.2 m)
Specification Value
Baud Rates 300 to 57,600 bps (default is 9,600 bps)
Duplex Half
Supported Protocols ION, Modbus RTU, DNP 3.0, FACTORY, Iec870-102, GPS: Arbiter,GPS: TRUE TIME DATUM, EtherGate, ModemGate (default is ION)
IsolationOptical isolation from all other inputs and outputs (the COM1 RS-485 port is not isolated from the COM1 RS-232 port); isolation voltage is 750 V peak for 10 seconds @ 60 Hz.
Specification Description
Cable Type Good quality shielded twisted pair cable, AWG 22 or larger.
Max. Cable Length 4,000 ft. (1219 m) 1
Max. number of devices per bus 32
Marking Terminal Function
SHLD RS-485 Shield
– RS-485 Data Minus
+ RS-485 Data Plus
SH + -SH
COM
RS-485
+ -

COM2 Port 9500/9600 User’s Guide
Page 166 Chapter 6 - Hardware Reference
COM2 PortSame as for COM Port 1 except there is no RS-232 connection available, only RS-485.
COM3 Port
Internal Modem The internal modem is multiplexed with the optical port.
By default, the modem is enabled and the optical port is disabled.
1 The baud rate used between connected modems is independent of the baud rate used forcommunication between the internal modem and the meter.Higher data rates can be achieved if data compression is enabled in the modem.
Connection
Connect to the internal modem via the female RJ-11 jack located on the back of the meter. For FCC compliant modems, use an FCC Part 68 compliant telephone cord.
If your meter has the CTR21 Compliant internal modem option, you may also require an adapter to interface with your particular European telephone line connection. The adapter type will depend on the telephone line standards in your country or region (several standards may be in use in the same country).
Specification Value
Baud Rate 300 to 33,600 bps 1
Error Correction V.42 LAPM, MNP 2-4, MNP 10
Data Compression V.42 bis/MNP 5
Interface RJ11 (Tip & Ring)
GovernmentApprovals
FCC Modem: FCC P68 (USA), Industry Canada CS-03 (CAN)CE Modem: CTR-21 (Austria, Belgium, Denmark, Finland, France, Germany, Greece, Iceland, Ireland, Italy, Luxemburg, Netherlands, Norway, Portugal, Spain, Sweden, Switzerland, UK)
RJ11 12
34
56
Ring
Tip

9500/9600 User’s Guide Ethernet Port
Chapter 6 - Hardware Reference Page 167
Optical (Infrared)Specifications for the optical port are as follows:
1 No physical connection is required to use the infrared port. Any device with an IRDA-compliant port that is positioned within the operating distance and optical range specified above can receive data.
Ethernet PortSpecifications for the Ethernet ports are as follows:
1 The unit ID for Modbus RTU and Modbus TCP over Ethernet is 100.
Ethernet Connections
10Base-T
10Base-FL
Specification Value
Baud Rate 9,600 to 115,200 bps (default is 9,600 bps)
Duplex Half
Operating Distance less than 1 meter (3 feet) 1
Optical Range ±15° (minimum), ±30° (maximum)
Supported Protocols ION, Modbus RTU, DNP 3.0, FACTORY (default is ION)
Specification Value
Data Rate 10 Mbps, half duplex
Supported Protocols ION, Telnet, Modbus RTU 1, Modbus TCP 1, FACTORY
Specification Description
Isolation Transformer isolatedMin. isolation voltage: 1,500VAC/2,250VDC
Wire TypeHigh quality Category 3 or 5 UTP (CAT 5 unshielded twisted pair recommended) cableMax. length: 100 meters
Connector Type Male RJ45 modular
Specification Description
Isolation Optical
Wire Type 62.5/125 micrometer multimode fiber cableMax. length: 2,000 meters
Connector Type ST-type
12
34
56
78
Transmit Data
Receive DataTransmit Data
Receive Data
RJ45

Ethernet Port 9500/9600 User’s Guide
Page 168 Chapter 6 - Hardware Reference
NOTE
Using the fiber port disables the standard RJ45 port.
IP Service Ports
Connect to the following IP Service Ports for communications over the Ethernet.
Protocol TCP/IP Port
ION 7700
Modbus RTU 7701
Modbus TCP 502
EtherGate COM1 7801
EtherGate COM2 7802

9500/9600 User’s Guide I/O Specifications
Chapter 6 - Hardware Reference Page 169
I/O Specifications
Digital Inputs
AI4 AO4AI3 A03AI2 A02AI1 AO1
Rear View of Meter
Analog connections fromexternal transducers0 to 20 mA or 0 -1 mA
Analog Connections toanalog transducers0 to 20mA: 500 Ohm load Max-1 to 1mA: 10k Ohm load Max
Digital connections fromexternal relays or pulse counter50 VDC Max
External Dry Contacts(polarity for SSRcontacts shown)
AWG 12 to 14 (3.3 to 2.1 mm ) recommended; wire sizes will vary depending on application2
DI1DI2DI3DI4DI5DI6DI7DI8DICOM
AI1+ -
AO1OUTCOM
I/O CARD
Standard I/O Locations
Specification Standard I/O (S1 to S8) Expansion Card I/O (D11 to D18)
Min Pulse Width 1 millisecond 20 milliseconds
Max Pulse Rate 20 Hz 25 Hz
Scan Time 1 millisecond for all inputs (min) 20 milliseconds for all inputs (min)
Isolation to Ground 300 VDC for 10 seconds, 60 Hz 300 VDC for 10 seconds, 60 Hz
Max Voltage 130 VDC (continuous) 50 VDC (continuous)
Timestamp Accuracy 1 millisecond 2 milliseconds
Connection Type Captured-wire
Wire Type AWG 14 to AWG 12
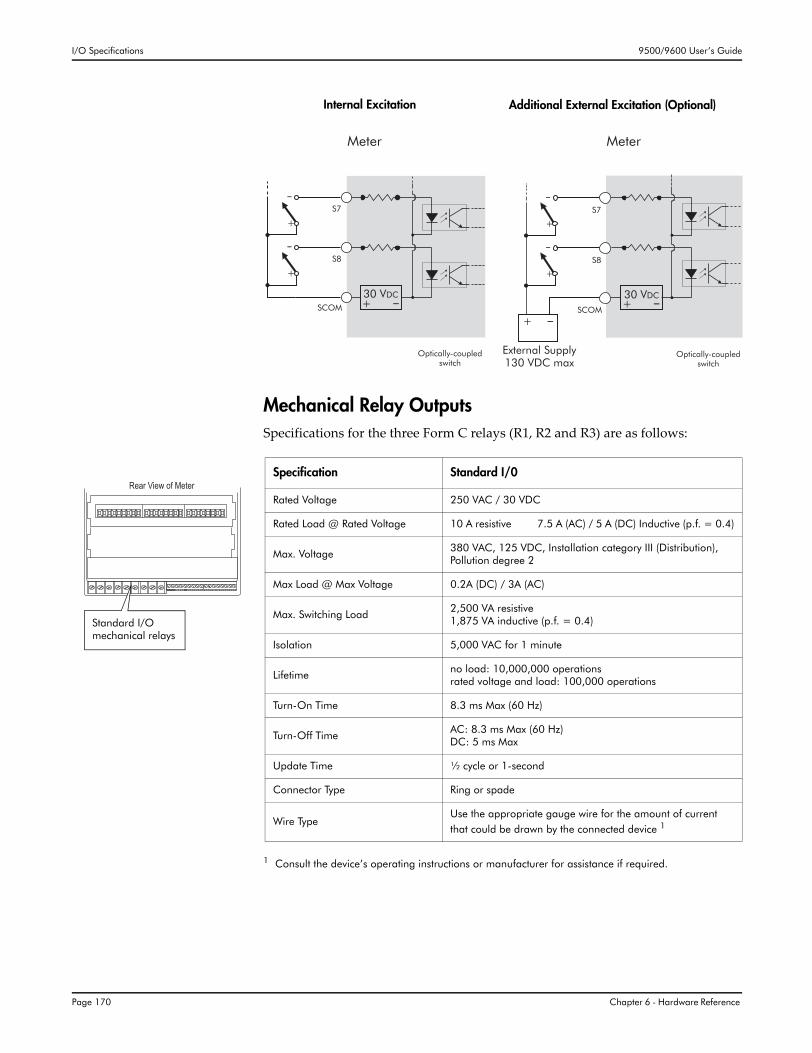
I/O Specifications 9500/9600 User’s Guide
Page 170 Chapter 6 - Hardware Reference
Mechanical Relay OutputsSpecifications for the three Form C relays (R1, R2 and R3) are as follows:
1 Consult the device’s operating instructions or manufacturer for assistance if required.
Specification Standard I/0
Rated Voltage 250 VAC / 30 VDC
Rated Load @ Rated Voltage 10 A resistive 7.5 A (AC) / 5 A (DC) Inductive (p.f. = 0.4)
Max. Voltage 380 VAC, 125 VDC, Installation category III (Distribution),Pollution degree 2
Max Load @ Max Voltage 0.2A (DC) / 3A (AC)
Max. Switching Load 2,500 VA resistive1,875 VA inductive (p.f. = 0.4)
Isolation 5,000 VAC for 1 minute
Lifetime no load: 10,000,000 operationsrated voltage and load: 100,000 operations
Turn-On Time 8.3 ms Max (60 Hz)
Turn-Off Time AC: 8.3 ms Max (60 Hz)DC: 5 ms Max
Update Time ½ cycle or 1-second
Connector Type Ring or spade
Wire TypeUse the appropriate gauge wire for the amount of current that could be drawn by the connected device 1
Additional External Excitation (Optional)Internal Excitation
Rear View of Meter
Standard I/O mechanical relays

9500/9600 User’s Guide I/O Specifications
Chapter 6 - Hardware Reference Page 171
NOTE
Because mechanical relays have limited lifetimes, mechanical KYZ relays are typically not suitable forenergy pulsing applications. For energy pulsing applications, consider using Form A outputs in KYZmode.
A typical connection and operational details are illustrated below..
NOTE
The mechanical relays should be protected by external fuses.
Solid-State Relay OutputsSpecifications for the four digital relay (Form A) outputs (D1 through D4) are as follows:
1 Digital output D4 is configured at the factory to emit pulses for calibration testing purposes.
Operational Block Diagram
STATE RX1 – RX2 RX2 – RX3
Inactive Open Closed
Active Closed Open
Pulse Closed for duration of pulse
Open for duration of pulse
R X1 R X2 R X3
N/O N/C
R 11 R 12 R 13 R 21 R 22 R 23 R 31 R 32 R 33
Specification Value
Signal Type Continuous or pulse 1
Maximum Load Voltage 30V
Maximum Load Current 80 mA
Isolation 5,000 Vrms
Scan Time ½ cycle
Connection Type Captured-wire
Wire Type AWG 28 to AWG 16
Rear View of Meter
Standard I/O Solid-State relays

I/O Specifications 9500/9600 User’s Guide
Page 172 Chapter 6 - Hardware Reference
Connections to the terminal strip are made as shown in the following diagram.
Analog OutputsThe I/O expansion card can be ordered with 4 analog outputs.
CAUTION
Due to internal circuit design, it is recommended that the analog inputs of the I/O Card NOT be drivenwith the outputs on the same card.
Specification 0 to 20 mA Analog Outputs -1 to 1 mA Analog Outputs
Scalable To 4-20 mA To 0-1 mA
Signal Type Continuous DC Continuous DC
Driving Capability 500 Ω 10 kΩ
Accuracy +/– 0.30% of full scale
Connection Type Captured-wire
Wire Type AWG 14 to AWG 12
Externalrelays
80mA max
Excitation voltage(30 V max)
1.8 Wh pulsing
rear of unit(bottom right)
DIGITAL OUTPUTSD3
- +
D2
- +
D1
- +
- +- +- +- +
D4
- +
Rear View of Meter
I/O Card analog outputs

9500/9600 User’s Guide I/O Specifications
Chapter 6 - Hardware Reference Page 173
Analog InputsThe I/O expansion card can be ordered with 4 unidirectional analog inputs.
Specification 0-20 mA Analog Inputs 0-1 mA Analog Inputs
Scalable To 4-20 mA To 0-1 mA
Signal Type Continuous DC Continuous DC
Input Impedance 25 Ω 475 Ω
Isolation Impedance (channel/channel) > 400 kΩ
Accuracy +/– 0.30% of full scale
Connector Type Captured-wire
Wire Type AWG 14 to AWG 12
Rear View of Meter
I/O Card analog inputs

Electrical Specifications 9500/9600 User’s Guide
Page 174 Chapter 6 - Hardware Reference
Electrical Specifications
Power Supply
Voltage Inputs
Potential Transformers (PTs)
1 To maximize accuracy, the use of PTs is recommended for all delta connections, however, direct connect delta up to 480 V is supported.
Specification Description
Rated InputsAC: 85 – 240 VAC, 47-63 HzDC:110 – 330 VDC Installation category II (local), Pollution degree 2
Dielectric Withstand 2,000 VAC RMS, 60Hz for 1 minute
BurdenTypical: 12 VA
Max: 20 VA
Ride-through Min: 100ms (6 cycles @ 60 Hz)
Connector Type Captured wire
Wire Type AWG 14 to AWG 12
Specification Value
Operating Range 0 to 347 Volts RMS (L-N) and 0 to 600 RMS (L-L)
Steady-State Rating 0 to 347 Volts RMS
Overload Rating 1,500 VAC RMS (continuous) and 3,250 VAC RMS (one minute)
Input Impedance 5 MΩ
Phase Voltage Connector Type Ring or spade
Phase Voltage Wire Type AWG 12 to AWG 10
Phase Voltage Sense Lead Protection
Use breakers or fuses at their source
System Mode Voltage Range Requires PTs
Wye
120 VAC line-to-neutral or 208 VAC L-L no
277 VAC line-to-neutral or 480 VAC L-L no
347 VAC line-to-neutral or 600 VAC L-L no
over 347 VAC L-N or 600 VAC L-L yes
Single Phase
120 VAC line-to-neutral or 240 VAC L-L no
277 VAC line-to-neutral or 554 VAC L-L no
over 277 VAC L-N or 554 VAC L-L yes
Deltaup to 480 VAC L-L recommended 1
over 480 VAC L-L yes

9500/9600 User’s Guide Electrical Specifications
Chapter 6 - Hardware Reference Page 175
Current Inputs
Specification 5A Option 1A Option
Input Rating 5A, 10A, or 20A 1A, 2A, 5A, or 10A
Fault Capture 70A peak 17.5A peak
Maximum Voltage 600V RMS (CAT III IEC61010-1) 600V RMS (CAT III IEC61010-1)
Impedance 2 mΩ 15 mΩ
Burden 0.05 VA per phase (at 5A) 0.015 VA per phase (at 1A)
Dielectric Withstand 3250 VAC, 60Hz for 1 minute 3250 VAC, 60Hz for 1 minute
Overload 500A RMS for 1 second, non-recurring
50A RMS for 1 second, non-recurring

Retrofit Options 9500/9600 User’s Guide
Page 176 Chapter 6 - Hardware Reference
Retrofit Options
Terminal Cover
Installation Instructions1. Turn off all power to the meter.
2. Open all PT fuses (or direct voltage input fuses). Close all CT shorting blocks.
3. Ensure that all cables connected to the meter (including those at to the I/O terminals) are NOT live.
4. For each cover, insert two tabs into the small rectangular openings at either end of the strip (refer to the diagram below).
5. Optional: you can tamper-proof each terminal strip by inserting a sealing wire or tag through the holes at the end of the tabs.
6. Close the PT fuses (or direct voltage input fuses), and open the CT shorting blocks.
7. Turn on power to the meter and verify the correct operation of the unit.
Installation Diagram
Opening where top of tab will stick through.
Tab (one of four)
Terminal cover for relay and digital inputs
One of four rectangular openings
Tamper proofing holes – insert a sealing wire or tag through these two holes (sizes: 0.125” & 0.050”)
Terminal cover for voltage and current inputs

9500/9600 User’s Guide Communications Card
Chapter 6 - Hardware Reference Page 177
Communications Card
Installation Instructions
DANGER
The components inside the meter are extremely sensitive to electrostatic discharge. To prevent damageto the unit, wear an anti-static wrist strap at all times when working inside the unit. Failure to use properequipment during servicing will void the meter’s warranty.
The following steps should be taken before inserting a Comm Card into themeter:
1. Turn off all power to the meter.
2. Open all PT fuses (or direct voltage input fuses). Close all CT shorting blocks.
3. Disconnect the Line and Neutral (or DC power) wires from the Control Power inputs of the unit.
4. Disconnect all other wiring (or power off all other circuits) which may present potentially hazardous voltage levels to the unit, such as connections to the relay outputs, status inputs, etc.
5. Ensure that all cables still connected to the meter are NOT live.
Removing the Existing Communications Card
The meter’s Comm Card can be removed while the unit is still mounted in its switchgear panel (or other mounting location).
1. Remove the two screws and lockwashers on the Comm Card’s backplate (refer to the diagram).
2. Remove the nut from the chassis ground lug.
3. Grasp the Comm Card by the sides of its backplate and pull it out of the socket, away from the chassis.
4. Place the Comm Card in an anti-static wrapping.
Installing the New Card
The Comm Card consists of a circuit board with an attached polarized CHAMP connector on the component side. Install the communications card as follows:
1. Hold the communications card by the sides and slide it into the base unit with the component side facing up.
2. Slide the edge of the circuit board down the slots along each side of the chassis.
3. Align the CHAMP connector with the socket and press the Comm Card firmly into place. The socket and the connector are polarized, so the pins in the connector will not fit into the socket if the card is not oriented correctly. The communications card is securely inserted into the socket when the backplate of the Comm Card meets the chassis of the meter.

I/O Expansion Card 9500/9600 User’s Guide
Page 178 Chapter 6 - Hardware Reference
Final Steps
4. Ensure the cover meets the chassis of the base unit.
5. Use the Phillips screwdriver to replace the two backplate screws, as well as the nut on the chassis ground lug, with their lock-washers. They must be installed firmly to preserve transient immunity.
6. Reinstall the Line and Neutral (or DC power) wiring to the Control Power inputs of the unit.
7. Reconnect all other wiring (or re-enable all other circuits). Close the PT fuses (or direct voltage input fuses), and open the CT shorting blocks.
8. Turn on power to the meter and verify the correct operation of the unit.
I/O Expansion CardThe standard I/O expansion card has 8 digital (status) inputs labelled DI1 to DI8. Depending on what you ordered, the I/O expansion card will also contain either 4 analog inputs, or 4 analog outputs, or both. Check the label on the I/O Card for your I/O specifications.
Installation InstructionsThe following steps should be taken before inserting an I/O Card into the meter:
1. Turn off all power to the meter.
2. Open all PT fuses (or direct voltage input fuses). Close all CT shorting blocks.
3. Disconnect the Line and Neutral (or DC power) wires from the Control Power inputs of the unit.
4. Disconnect all other wiring (or power off all other circuits) which may present potentially hazardous voltage levels to the unit, such as connections to the relay outputs, status inputs, etc.
5. Ensure that all cables still connected to the meter are NOT live.
Installing the I/O Card
The I/O Card consists of a circuit board with an attached polarized CHAMP connector on the component side. Follow these steps to install the I/O Card:
1. If present, remove the plastic tab that seals the I/O Card’s cover plate to the meter. Use the Phillips screwdriver to remove the plate’s two screws, then remove the plate.
2. Hold the I/O card by the sides and slide it into the base unit with the component side facing up. Slide the edge of the circuit board down the slots along each side of the chassis.
3. Align the CHAMP connector with the socket and press the I/O Card firmly into place. The socket and the connector are polarized, so the pins in the connector will not fit into the socket if the card is not oriented correctly. The I/O card is securely inserted into the socket when the backplate of the I/O Card meets the chassis of the meter.

9500/9600 User’s Guide I/O Expansion Card
Chapter 6 - Hardware Reference Page 179
4. Ensure the cover meets the chassis of the base unit. Use the Phillips screwdriver to replace the two backplate screws with their lock-washers. They must be installed firmly to preserve transient immunity.
5. Reinstall the Line and Neutral (or DC power) wiring to the Control Power inputs of the unit.
6. Reconnect all other wiring (or re-enable all other circuits). Close the PT fuses (or direct voltage input fuses), and open the CT shorting blocks.
7. Turn on power to the meter and verify the correct operation of the unit.
Refer to “Digital and Analog I/O” on page 139 for the settings in these modules.

TRAN Model 9500/9600 User’s Guide
Page 180 Chapter 6 - Hardware Reference
TRAN ModelA TRAN is a meter with no display. All specifications are the same as for a standard meter, except the following.
Environmental ConditionsThe TRAN meter can operate at a lower temperature than the standard meter.
Unit Dimensions
Environmental Condition Acceptable Range
Location Indoor use
Operating -40°C to +70°C (-40°F to +158°F) no formation of ice
Storage -40°C to +85°C (-40°F to +185°F)
Humidity 5 to 95% non-condensing
184.1 mm[7.25“]
216.2 mm[8.51“]
TRAN Model — Front View

9500/9600 User’s Guide Unit Dimensions
Chapter 6 - Hardware Reference Page 181
134.6 mm[5.30“]
200.1 mm[7.88“]
101.6 mm[4.00“]
4.3 mm[0.17“]
167.3 mm[6.59“]
TRAN Model — Front View TRAN Model — Side View

Unit Dimensions 9500/9600 User’s Guide
Page 182 Chapter 6 - Hardware Reference

Page 183
I N D E X. . . . . . . . . . . . . . .
INumerics10Base-FL 16910Base-T 169
Aacceptable ranges 163alarm LED 144Alert module 243alerting
by email 235configuring MeterMail to 243
Analog Input module 146, 224analog inputs 146
configuring 224specifications 175
Analog Output module 146, 226analog outputs 146
configuring 226specifications 174
analog zero scale 227AT commands 275, 279AT+MS commands 280Auto Scroll 197auxiliary analog inputs
connecting 224
Bbacklight 23bar graphs
creating custom trend 202before you can use this guide 18BootP server 238, 266bus wiring 128button functions 22
CCalibration menu 190Calibration Pulser module 58, 142, 222calibration pulsing 143CBEMA/ITIC 59, 60, 96clock
configuration 62
Clock module 41, 62, 335Clock Setup menu 41clock source 335COM1
computer connections 166external modem connections 167RS-485 connections 167
COM2 168COM3 168
connections 168internal modem 168
Comm 3 module 133communications
adding a new server,site,device or dialout mo-dem 91
channel 51configuring in Management Console 91Modbus/TCP 79possible connections 165protocol configuration 68protocols 16, 52serial setup 38setup 51
communications card 126installation instructions 179
Communications module 51company name 67Conexant modems 279connections
10Base-FL 16910Base-T 169ethernet 169
contrast 23control objects 95CTR-21 compliant modems 133current input specifications 177current probe
basic setup 188current probe input option 187
Ddata
displaying diagnostics in ION Setup 123

9500/9600 User’s Guide
Page 184 Index
displaying from other meters 208displaying in Vista if software is not fully con-
figured 94displaying with ION Setup 122displaying with the front panel 22displaying with Vista 93EN50160 29historical logging 55importing using DNP 3.00 84importing using Modbus RTU 78
data logs 244Data Recorder module 53date 42daylight savings time 62
adjustment 336debounce 219default logging 53default meter functionality 50default unit ID 52demand lockout 35Demand Options menu 35demand setup 64Demand Setup menu 34Designer 66, 85, 150, 200, 208, 256Device Upgrader utility 344devices 90DI count reset 43Diagnostics module 341dialout modem 90digital I/O diagram 100Digital Input module 145, 219digital inputs 145, 171
configuring 219digital output boards 215Digital Output module 142, 221digital outputs 142
configuring 220dips
EN50160 298disk simulator 207display cycle 26Display module 63, 195
changing default settings 196Display Options module 63, 197Display Setup menu 41displays
adding a new screen 200additional screens 27automatic units 24bar graph 25
changing default frameworks 199changing parameters 64changing parameters in an existing screen 201configuring custom display frameworks 208creating custom trend bar graphs 202custom front panel 46, 193default screens 26displaying data from other meters 208event log 24frameworks overview 198histogram 24nameplate 24phasor diagram 24removing a screen 200screen types 23trend 25, 204
DNP 3.00 80changing configuration 82
DNP Options module 84DNP Slave Export module 80, 83DNP Slave Import module 84
EEEM 12electrical specifications 176email alerts 235email data logs 236EN50160 29, 59
compliance 289dips 298external controls 311flicker 295harmonics 304interharmonics 307interruptions 300logging 57magnitude of volatge supply 292mains signaling 309overvoltages 301power frequency 290reset 44settings 60unbalance 303
energy demand log 56energy pulsing 231energy pulsing setup 58energy pulsing with LEDs 144environmental conditions 163EtherGate 79, 131, 326

9500/9600 User’s Guide
Index Page 185
Ethernet Communications module 130ethernet connection 129ethernet port 169
connections 169specifications 169
Eurelectric 289Event Log Controller module 151event log viewer 95event priority 151expansion card 17external ION events 152External Pulse module 47, 286
Ffactory configuration 17, 80
restoring 85factory information 67Factory module 67Factory Terminal menu 323fiber port 170firmware
upgrading 343flash memory 54flicker
EN50160 295Flicker module 97Form A relays 142, 173Form C relays 142, 172Format Setup menu 40frameworks 50, 104
changing default display 199depth 104editing 113making a backup 199pasting 85
front panel 15, 21buttons 32confirming changes 32custom displays 46customizing the Modbus Master display 317LEDs 23mode timeout setup 32passwords 32reset 46Setup menu 31viewing number of nines data 284writing error screen 32
Full Scale 227full scale values
setting 227
Ggateway meter 327General Format menu 40getting more information 18global event log viewer 95GPS 338Grayhill 214grouping objects 95
Hharmonics
EN50160 304logs 55min/max reset 43trending 97
historic data log 55Hyperterminal 139, 188, 322
II/O
analog inputs 17, 175analog outputs 17, 174configuring digital and analog 218digital inputs 16, 171expansion card 180external 214mechanical relay outputs 172onboard 213options 16relay outputs 16solid-state relay outputs 173specifications 171
I/O Expander 214I/O expansion card
installation instructions 180infrared port 136Infrared. See Infraredinterharmonics 307internal modem 38
changing settings 281types 274
internet connectivity 137interruptions
EN50160 300ION Enterprise 88, 327
reporting 56

9500/9600 User’s Guide
Page 186 Index
ION MeterMail 137ION modules 104
additional configurations 245assigning a port 230configuring for digital and analog I/O 230creating new 111deleting 111in the display framework 194linking 111
ION Setupdisplaying data 122displaying diagnostics data 123
ION software 87ION WebMeter 137IP service ports 170IrDA 136
KKCTRD commands 190KCTSTP commands 190kWh Pulser –LED 144KYZ 220
LLCD 22, 46, 194LEDs 58, 144, 166logging
data by email 236default 53diagnostics and event 341EN50160 57historical data 55, 96loss log 55time of use 56
logging capacity 152loss log 55
MMain Setup menu 34mains signaling 309Mains Signaling Eval module 310Mains Signalling Evaluation module 59Management Console 89master reset 99master reset control 43mechanical relay outputs 172Meter Resets menu 43MeterMail 137
configuring the meter for 242in a Modbus network 247sending alerts 243sending data logs 244setting up network for 238viewing 235XML attachments 237
min/max reset 43Modbus 69, 208
changing configuration 69configuring the network 314MeterMail 247using expansion boards with 216WebMeters 271
Modbus Import module 318Modbus Master
configuring 314customizing the frameworks 316multiple devices 316pasting frameworks 315
Modbus RTU 69Modbus Slave
configuring 314Modbus Slave module 69, 70
mapping parameters 71Modbus/TCP 79modem 132, 168
adding a site to an ION network 331adding meters to site 332cellular phone compatibility 281changing local settings 281Conexant 279initialization 52internal setup 38
ModemGate 330configuring ION gateway meter 332
Modicon ModbusModbus Master device 69
Multi-Tech ModemModule 275MV-90 54
Nnameplate 24network components 89network setup 36nominal voltage 39NORMAL/TEST mode 98number of nines
calculating 159, 284

9500/9600 User’s Guide
Index Page 187
disabling 288resetting 286viewing data 284
numeric displays 23Numeric Format menu 40numeric objects 95
OOptical 169optical port
specifications 169output registers
owner 113over condition monitoring 61overvoltages 301
Ppasswords 32, 44, 148, 253
default 88to upgrade devices 344
peak demand reset 43, 99Periodic Timer module 53, 54phasor diagrams 24ports
making available 231virtual 326
potential transformers specifications 176power frequency
EN50160 290Power Meter module 50power provider 65power quality
setup 39Power Quality diagram 97power supply specifications 176predicted response 35protocols
DNP 3.0 80Modbus RTU 69third party 68
Pulser module 58, 142, 223
RRelative Setpoint module 61Relay Expansion Board (REB) 215relay outputs
mechanical 172retrofit options
communications card 179I/O expansion card 180terminal cover 178
revenue log 54revenue logging 153Revenue Measurements diagram 97RJ-11 168RS-232 38
connections 127, 166RS-485 38
connections 167
SS commands 277sag limit 39sag/swell
logging 57setup 39
Sag/Swell module 59, 292Sag/Swell modules 285scaling 228screen messages 206Scroll module 63, 197seasons 65security
advanced meter 255device access for ION services 257disabling password 149software 88standard meter 148, 254
serial communications 38servers 89Set Meter Time menu 42setpoints
setup 61Setpoints diagram 99Setup & Controls grouping window 98sites 90Sliding Window Demand module 34, 64sliding window demand settings 34SMTP
connection timeout 240server 242
softkeys 22, 32solid-state relay outputs 173specifications
current input 177electrical 176potential transformers 176

9500/9600 User’s Guide
Page 188 Index
power supply 176voltage inputs 176
statusbar 23
sub-meteringdata logging 317with Modbus Master 313
swell limit 39
TTAG 67Telnet 139, 188, 320terminal connections 167terminal cover 178Terminal Server 138TEST mode. 98Thermal Demand module 35, 64thermal demand settings 35time
synchronization using GPS 338synchronization using ION 337type used for synchronization 335
time constant 35time of use 56
Vista diagram 100Time of Use module 65Time Setup menu 41time synchronization 147time zone
adjustment 336TOU Program Manager 66TRAN 182, 208
environmental conditions 182unit dimensions 182
transient logging 57Transient module 59, 60trend bar graphs 25trend display
adding new modules 206trend displays 204
Uunbalance 303UNIPEDE 289unit dimensions 164unit ID 217, 331
default Modbus 69user resets 44using this guide 18
Vvirtual ports 326Vista 93
displaying long-term min/max measurements96
generating a network diagram 93status 95
voltageunbalance monitoring 100
voltage inputs specifications 176Volts/Amps diagram 96
WWaveform Recorder module 53, 150web browser configuration
enabling and disabling 269web pages
custom 261default 261
web server functionalityenabling and disabling 270
WebMeter 137WebMeters
configuring 264in a Modbus network 271setting up network for 266viewing on the internet 261XML pages 263
WebReach 138
XXML 16, 236, 263


Siemens Energy & Automation, Inc.Power Management Technologies3333 Old Milton ParkwayAlpharetta, GA 30005
© Siemens Energy & Automation, Inc.Siemens is a registered trademark of Siemens AG. Specifications are subject to change without notice.
For Nearest Sales Office1.800.964.4114www.sea.siemens.comsales/salesoffices.html
For More Information Visitwww.sea.siemens.com/access
Windows is a trademark and Microsoft is a registered trademark of Microsoft Corporation. ION is a registered trademark and WebMeter and MeterM@il are trademarks of Power Measurement.All others are of Siemens AG.
Order No. 70000-0178-01PDF 0800 Printed in the U.S.A.


