66
9 789937 290579

ElEctions in nEpal identifying the politically
Excluded Groups
a study of the parliamentary election results from 1991 to 2013
Kåre Vollan

© Kåre Vollan
First published, 2015
ISBN: 978 9937 2 9057 9
Published for Social Science Baha by Himal Books
Social Science Baha345 Ramchandra Marg, Battisputali, Kathmandu – 9, NepalTel: +977-1-4472807 • [email protected] • www.soscbaha.org
Himal BooksHimal Kitab Pvt Ltd521 Narayan Gopal Sadak, Lazimpat, Kathmandu – 2, NepalGPO Box 4249, Kathmandu, NepalTel: +977-1-2120321 • [email protected] • www.himalbooks.com
Printed in Nepal by Sthapit Press, Tahachal, Kathmandu
Price: Rs 200/-

Contents
Preface v
1. Inclusion in Nepal 12. Targeting and Simplifying the Quotas 53. The Method 84. The Census Groups 115. The Election Results per Group 146. Possible Minimum Quotas 23
Appendix A. The relationship between the groups of the 31 2001 Census and the 2011 Census.Appendix B. The allocation of the 2001 Census sub-groups 35 into broad groups, with 2001 population figures.Appendix C. The allocation of the 2011 Census sub-groups 39 into broad groups, with 2011 population figures. Appendix D. The representation of groups in the parliaments 44 of the 1990s.Appendix E. The representation of groups in the Constituent 48 Assembly of 2008.Appendix F. The representation of groups in the Constituent 52 Assembly of 2013.
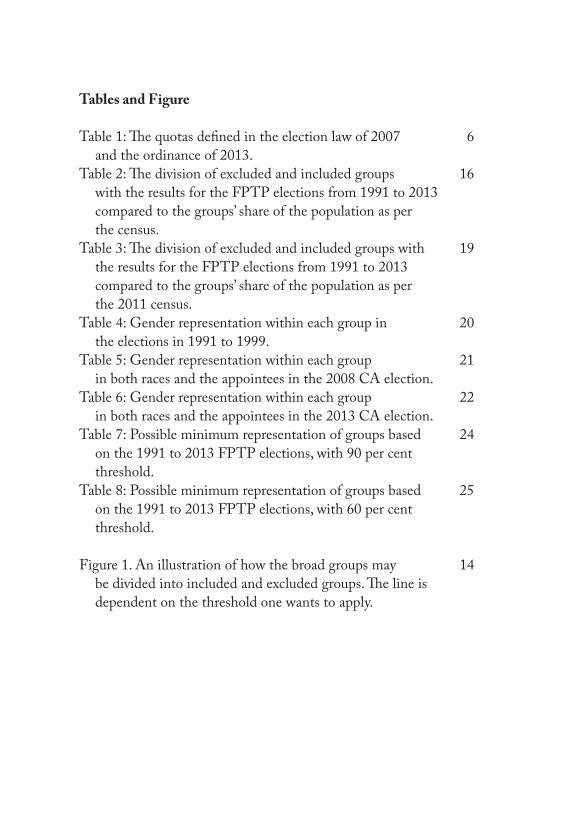
Tables and Figure
Table 1: The quotas defined in the election law of 2007 6 and the ordinance of 2013.
Table 2: The division of excluded and included groups 16 with the results for the FPTP elections from 1991 to 2013 compared to the groups’ share of the population as per the census.
Table 3: The division of excluded and included groups with 19 the results for the FPTP elections from 1991 to 2013 compared to the groups’ share of the population as per the 2011 census.
Table 4: Gender representation within each group in 20 the elections in 1991 to 1999.
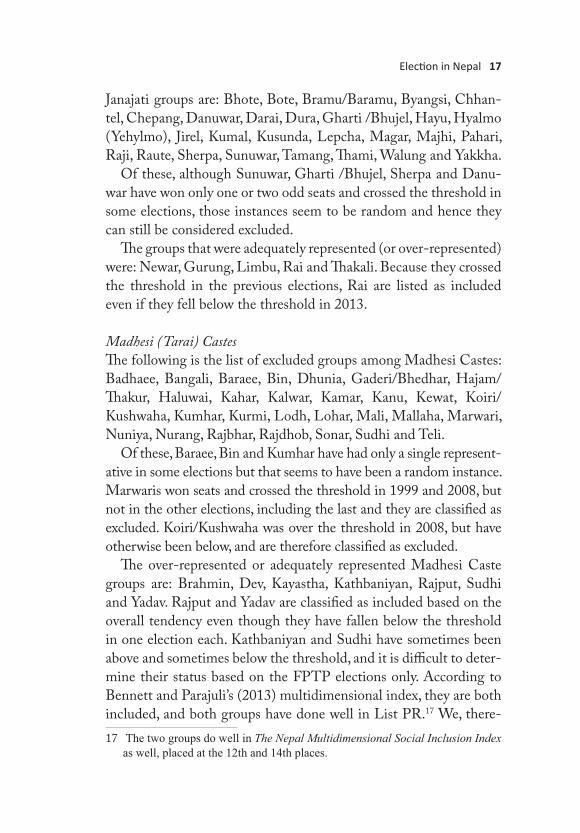
Table 5: Gender representation within each group 21 in both races and the appointees in the 2008 CA election.
Table 6: Gender representation within each group 22 in both races and the appointees in the 2013 CA election.
Table 7: Possible minimum representation of groups based 24 on the 1991 to 2013 FPTP elections, with 90 per cent threshold.
Table 8: Possible minimum representation of groups based 25 on the 1991 to 2013 FPTP elections, with 60 per cent threshold.
Figure 1. An illustration of how the broad groups may 14 be divided into included and excluded groups. The line is dependent on the threshold one wants to apply.

Preface
This booklet presents the results of a study that has been carried out over several years, starting in 2010. The purpose has been to find out which of the many caste and ethnic groups of Nepal have managed to get elected to parliament (including the two constituent assem-blies) without any assistance from affirmative action and which groups have generally been excluded from unless some measures of inclusiveness are applied. The basis for the study has been the clas-sification of each member of the three parliaments since 1990 and the 2008 Constituent Assembly against the 100 social groups of the 2001 census and then for the 2013 election against the 125 groups of the 2011 census.
This has been a painstaking effort involving calling almost each of the members, at least when the classification has not been obvious. In 2010, Anamika Sharma took up this assignment, and in 2014 Aakriti Kharel worked on the classification of those elected in the 2013 election. For all elections Samhita Malla was involved in com-pleting the work and conducting the necessary reviews. She has also worked with a number of experts on the anthropology of Nepal, leading to the classification of groups into broader and more opera-tive groups. I thank them all for their great contribution. Thanks are also due to Deepak Thapa of Social Science Baha for encouraging me to publish my findings in this form and for all the editorial sug-gestions he provided.
The study was performed in my capacity as a subcontractor to the International Foundation for Electoral Systems (IFES) under grants provided by the Norwegian Embassy to Nepal. This publication is, however, the sole responsibility of the author and the publisher, and the conclusions drawn may not represent the views of IFES or of the donor.
Kåre Vollan


1. Inclusion in Nepal
Nepal went through a 10-year civil war between the Communist Party of Nepal (Maoist) and the government before ending with the 2006 Comprehensive Peace Accord (CPA) followed by the 2008 Constituent Assembly (CA) elections. The conflict was ideological but it was deeply rooted in social injustice as well. Since the type and degree of inequality had taken different forms for the various social groups those considerations need to be taken into account when designing a future system of representation.
The CPA and the 2007 Interim Constitution defined a transition period with significant elements of power-sharing, such as consensus governments (an ideal that was difficult to realise), broad representa-tion of groups and political parties, and consensus politics. Simple majority rule would not reflect the complexity of Nepal. During the current period of transition a new constitution is being drafted. All the elements of power-sharing are not likely to be included in the constitution, but some are. Federalism has been a defined premise for the restructuring of the state while the form of government and the system of representation are still being negotiated as this is being written. This paper will discuss the possibilities for making the sys-tem of representation inclusive and as simple as possible given the complexity of Nepali society.
The 2008 and 2013 CA elections had significant elements of pro-portional representation in the form of political parties’ represen-tation and the inclusion of caste and ethnic groups implemented through an elaborate quota system. The elections were held under a mixed parallel system in which 240 seats were elected under a first-past-the-post (FPTP) system in single-member constituencies and 335 seats were filled by a list system of proportional representation (List PR) with quotas applied to the List PR section only. (In addi-tion, 26 were appointed by government.) If one decides to continue

2 Election in Nepal
to secure inclusive representation of groups, it is most easily achieved by retaining List PR as part of the election (or introducing full List PR for that matter). The subject of this paper, however, is not to dis-cuss the merits of various electoral systems but only to give a back-ground for the choices on how to make the elections inclusive.
The history of discrimination and exclusion in Nepal is extensive. In particular, Dalits have been subject to discrimination at all levels, from daily interaction with other castes, access to temples and other public places, as well as access to land and work. Laws against caste-based discrimination have been in place since 1962, but the practice has never been effectively stopped. One way of strengthening the enforcement of anti-discriminatory laws is to include the victims of discrimination in decision-making bodies.
The many indigenous ethnic groups ( Janajatis) are diverse in terms of language, culture, religion, way of life, and political rep-resentation. The 59 recognised groups1 vary from advanced groups, such as Gurungs and Newars, who have taken part in political life, to small, nomadic groups living far from urban centres and struggling to retain their traditional livelihood.
‘Madhesi’ is a term used for people with origins in the Tarai, the lowlands along the Indian border. The term is often restricted to caste groups and Muslims, Jains and Sikhs, but sometimes also includes the Janajati groups living in the Tarai. The definition used during the 2008 and 2013 elections included the Janajatis, but in this paper we will use Tarai Janajati for the indigenous groups of the Tarai. The Madhesi Caste groups are also diverse socio-economically and politically. Some castes have been represented in proportion to their size in all the elections since 1991, but their representation has not necessarily translated into positions in government, civil service, military, police, etc. However, Madhesi Dalits and a large number of Madhesi Castes as well as Muslims have been excluded from proper representation in parliament.
The Hill Castes dominate the political and administrative bodies
1 Although 59 groups were listed as indigenous ethnic groups by the government in 2002, a government taskforce in 2010 recommended that a total of 81 groups be recognised as such.

Election in Nepal 3
in Nepal. That does not mean that they are the only ones who have been elected to parliament after multi-party elections began in 1991, but they have dominated important state bodies such as government, civil and military service, the police and academic institutions.
Legal initiatives have been taken to include otherwise excluded groups in the public sector, and a central element of the electoral system to the CA in 2008 and 2013 was the inclusion of women, and ethnic and caste groups in some proportion to their share of the population in the List PR part of the election. Fixed quotas were given to the following groups: women, Madhesis, Janajatis, Dalits, people from backward regions (nine districts in the Mid- and Far-Western regions) and Others (Hill Castes).
While designing future systems, one needs to assess the purpose of the instruments used, particularly since all the groups listed for proportional representation in the List PR part of the election are not politically excluded. In this paper, I explore other ways of defin-ing the quotas which could target the groups who actually need to be supported in terms of representation on their way to equality, and at the same time try to simplify a very complicated system.
It should be underlined that the term ‘proportional representa-tion’ often has a different meaning in Nepal than in other contexts. In election terminology, ‘proportional representation’ means that the seats are distributed to the parties according to the share of the votes a party wins in the election. This is normally done through the List PR system, which means that parties nominate lists of candidates before the election, and the number of party seats is determined by the vote they get and are filled from the lists.2 In Nepal, ‘proportional representation’ also means that the various groups are represented in parliament according to their share of the population. List PR does not provide for that automatically even though there are strong 2 In closed list systems the seats are filled from the top of the lists presented
before the elections, so that voters know who they are voting for. In open list systems the voters can cast individual votes for candidates within the lists and thus have an influence on who should fill the seats. The system used in Nepal in 2008 and 2013 whereby parties can choose the candidates freely from the lists after the elections is not how List PR systems are normally implemented and it makes the accountability of the elected members towards the voters very weak.

4 Election in Nepal
incentives for nominating inclusive party lists since it can appeal to broader electorates and garner more votes, which in proportional systems can translate into more seats. It is the quotas applied to the List PR race that provided for group representation in the 2008 and 2013 elections, and it is these quota arrangements that are the sub-ject of this study, which suggests replacing quotas for all groups with minimum quotas for excluded groups only.

2. Targeting and Simplifying the Quotas
This section looks at political exclusion in Nepal based on how the different castes and ethnic groups have fared in the parliaments, including the two constituent assemblies, since 1991. The back-ground is the extensive use of quotas in the List PR part of the elections in 2008 and in 2013. Of the 575 elected members in the CAs, 335 were elected according to List PR and 240 according to the FPTP system in single-member constituencies. The quota rules given in Table 1 were applied to the representation of each party in the List PR elections, whereas in FPTP the parties were not bound by any particular rules.3
In general, however, parties were not only obliged to include polit-ically excluded groups on the lists but they also needed to include the Hill Castes and men according to their proportional share of the population. The purpose of the quotas was clearly to make the CA more inclusive, but the quotas for the Hill Castes set a definitive ceiling on the representation of excluded groups from the PR part of the election.
A side effect of the quota-for-everybody system was that candi-dates could run under the List PR side of the election only if they declared their identity. Persons who might insist that their identity is only Nepali and not want to disclose if they were Dalits, Bahuns or Newars, could not be included. It can be argued that this vio-lates Article 25 of the International Covenant on Civil and Political Rights by imposing unreasonable restrictions to stand for elections.4
3 Of the total number of candidates from a party for both races, at least a third had to be women, but that stipulation did not have any significance for representation. In FPTP, too, the parties were required to keep inclusiveness in mind according to the Interim Constitution but that was not enforced.
4 Which states: ‘Every citizen shall have the right and the opportunity, without any
6 Election in Nepal
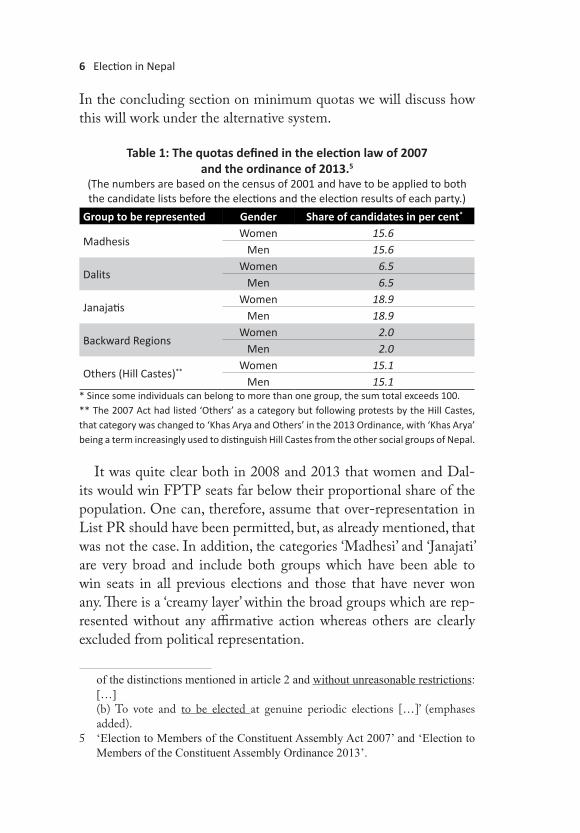
In the concluding section on minimum quotas we will discuss how this will work under the alternative system.
Table 1: The quotas defined in the election law of 2007 and the ordinance of 2013.5
(The numbers are based on the census of 2001 and have to be applied to both the candidate lists before the elections and the election results of each party.)
Group to be represented Gender Share of candidates in per cent*
MadhesisWomen 15.6
Men 15.6
DalitsWomen 6.5
Men 6.5
JanajatisWomen 18.9
Men 18.9
Backward RegionsWomen 2.0
Men 2.0
Others (Hill Castes)** Women 15.1 Men 15.1
* Since some individuals can belong to more than one group, the sum total exceeds 100. ** The 2007 Act had listed ‘Others’ as a category but following protests by the Hill Castes, that category was changed to ‘Khas Arya and Others’ in the 2013 Ordinance, with ‘Khas Arya’ being a term increasingly used to distinguish Hill Castes from the other social groups of Nepal.
It was quite clear both in 2008 and 2013 that women and Dal-its would win FPTP seats far below their proportional share of the population. One can, therefore, assume that over-representation in List PR should have been permitted, but, as already mentioned, that was not the case. In addition, the categories ‘Madhesi’ and ‘Janajati’ are very broad and include both groups which have been able to win seats in all previous elections and those that have never won any. There is a ‘creamy layer’ within the broad groups which are rep-resented without any affirmative action whereas others are clearly excluded from political representation.
of the distinctions mentioned in article 2 and without unreasonable restrictions: […]
(b) To vote and to be elected at genuine periodic elections […]’ (emphases added).
5 ‘Election to Members of the Constituent Assembly Act 2007’ and ‘Election to Members of the Constituent Assembly Ordinance 2013’.

Election in Nepal 7
The censuses enumerate a large number of caste and ethnic groups. In 2001, there were 100 specified groups while in 2011 there were 125.6 It would be impractical to give each of these an electoral quota. It would, therefore, be of interest to assess which of these groups are able to be represented in parliament in a reasonable manner without any assistance through affirmative action and which groups would require some help in order to be represented. Should the CA want to shift from quotas for everybody, including the elite groups, to a sys-tem with minimum representation for those who need it, the study presented here may offer some data on such groups that could be considered for quotas.
6 Not counting unidentified groups and foreigners.
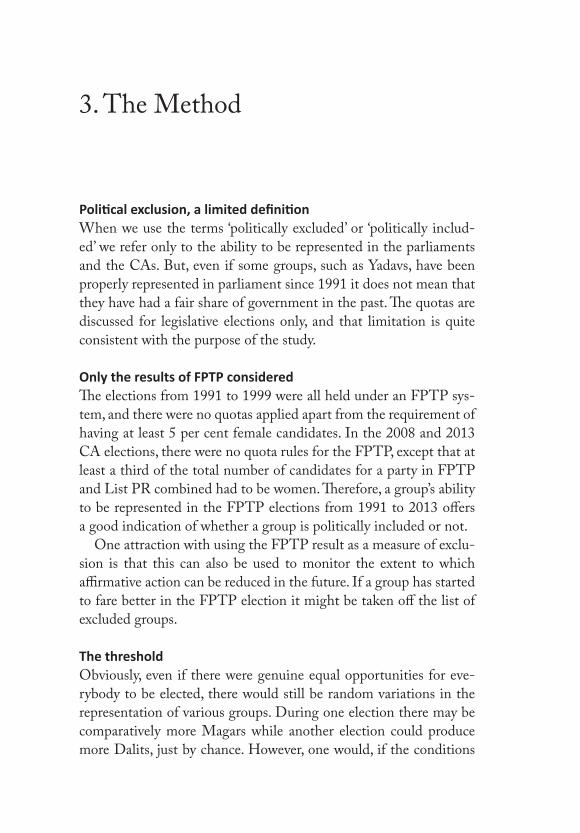
3. The Method
Political exclusion, a limited definitionWhen we use the terms ‘politically excluded’ or ‘politically includ-ed’ we refer only to the ability to be represented in the parliaments and the CAs. But, even if some groups, such as Yadavs, have been properly represented in parliament since 1991 it does not mean that they have had a fair share of government in the past. The quotas are discussed for legislative elections only, and that limitation is quite consistent with the purpose of the study.
Only the results of FPTP consideredThe elections from 1991 to 1999 were all held under an FPTP sys-tem, and there were no quotas applied apart from the requirement of having at least 5 per cent female candidates. In the 2008 and 2013 CA elections, there were no quota rules for the FPTP, except that at least a third of the total number of candidates for a party in FPTP and List PR combined had to be women. Therefore, a group’s ability to be represented in the FPTP elections from 1991 to 2013 offers a good indication of whether a group is politically included or not.
One attraction with using the FPTP result as a measure of exclu-sion is that this can also be used to monitor the extent to which affirmative action can be reduced in the future. If a group has started to fare better in the FPTP election it might be taken off the list of excluded groups.
The thresholdObviously, even if there were genuine equal opportunities for eve-rybody to be elected, there would still be random variations in the representation of various groups. During one election there may be comparatively more Magars while another election could produce more Dalits, just by chance. However, one would, if the conditions

Election in Nepal 9
are equal, not expect any group to be consistently under-represented over time. In this study, we look for consistent tendencies of over- or under-representation. For that purpose, we define a threshold of exclusion. If a group wins more seats than the threshold we define it as being politically included in that election, and if it falls below the threshold it is seen as excluded or under-represented.
The value of the threshold is a matter choice. We are presenting two different thresholds in order to illustrate the point. First, we have assessed the election results against a threshold of 90 per cent of the group’s share of the population. If a group wins seats equal to less than 90 per cent of their share of the population in an election, they are defined as being excluded. If they win more, they are included. For example, if a group comprises 10 per cent of the population they should win more than 9 per cent of the FPTP seats in parliament in order to be regarded as included. After that, we present the results with a threshold of 60 per cent.
For most groups the tendency over time is quite consistent, and there is no doubt whether they are above or below the threshold, but a few groups do vary from one election to the next. In such cases we give reasons for the classification made.
Small groupsSome groups are so small that it is difficult to make a clear sig-nificant statistical assessment of the elections. In those cases we do make some judgements, which we discuss in each case.
Use of the latest census on all electionsIn the summary tables, we have compared the election results with the 2011 census only. One may argue that it would be more correct to compare each election with the share the group had in the census closest to the concerned election. We have in a previous paper7 com-pared the 1999 elections to the 2001 census (which has also been
7 Kåre Vollan, ‘Minimum Quotas for Excluded Groups: Securing Inclusiveness of the Nepalese Parliament, 2011, with updates 2012’, unpublished paper. See also Appendix E for a comparison between the 2008 results and the 2001 census figures.

10 Election in Nepal
presented in Appendix B), and the conclusions were similar to what we provide here. We have not checked the 1991 and 1994 elections against the 1991 census, but there are few indications that it would alter the main conclusions. In any case, wherever there is no clear conclusion, the 2008 and 2013 elections are given more weight since they are more recent.
Other indicatorsThe suggestions in this paper are based on election results only, except in the few cases where the trends are inconclusive. Other indicators, such as poverty or exclusion indices,8 could also be used as a supple-ment to define quotas for excluded groups.
8 For example, Lynn Bennett and Dilip Parajuli have in their study, The Nepal Multidimensional Exclusion Index (Himal Books, Kathmandu, 2013), suggested an index covering a number of indicators of social inclusion as has The Nepal Multidimensional Social Inclusion Index: Diversity and Agenda for Inclusive Development (Central Department of Sociology/Anthropology, Tribhuvan University, Kathmandu, 2014).

4. The Census Groups
The 2001 census recorded 100 caste and ethnic groups apart from those unspecified or in the ‘Others’ category. In 2011, this number increased to 125 groups. We have found it fruitful to allocate the 125 groups to the following broad categories, which are commonly used as categories in other studies and they are close to (but a little more detailed than) those used as quotas in the 2008 and 2013 elections:
1. Hill and Mountain Janajatis2. Hill Castes3. Hill Dalits4. Tarai Janajatis5. Madhesi Castes6. Madhesi Dalits7. Religious groups (Muslims and Sikhs)
The census does not slot the population groups into the broader categories such as Tarai Castes or Hill Dalits, and for some groups this is not altogether straightforward. In such cases, information from the National Foundation for the Development of Indigenous Nationalities (NFDIN) and the National Dalit Commission has been used while also consulting experts and community leaders.
In Appendix A, both the 2001 and the 2011 census groups have been placed in the broad groups above. Our classification coincides with that of Sharma’s9 except for Khawas, which he has as Hill Janajatis and we have as Tarai Janajatis, the latter based on where they traditionally live.10 Tamang and Gurung have listed Dhandi, 9 Pitamber Sharma, Some Aspects of Nepal’s Social Demography: Census 2011 Update
(Social Science Baha and Himal Books, Kathmandu, 2014).10 Khawas are also classified as Tarai Janajatis in Mukta S. Tamang and Om
Gurung (eds), The Social Inclusion Atlas of Nepal: Ethnic and Caste Groups, Volume I (Central Department of Sociology/Anthropology, Tribuvan University, Kathmandu, 2014).

12 Election in Nepal
Dhankar/Dharikar, Kalar, Natuwa and Sarbaria as Madhesi Castes11 whereas we have them as Madhesi Dalits as does Sharma.12 Simi-larly, Tamang and Gurung place Amat within the Madhesi Caste group but we and Sharma have it in the Tarai Janajati group, follow-ing a government taskforce’s recommendation on revising the list of Janajatis.13 All groups from 2001, except Jains and Churaute (Hill Muslims),14 were enumerated in the 2011 census, which means 27 new groups were added.
The new groups in the 2011 census were:
1. Hill and Mountain Janajatis: Aathpariya, Bahing, Bantawa, Chamling, Dolpo, Ghale, Khaling, Kulung, Lhomi, Lhopa, Loharung, Mewahang Bala, Nacchiring, Sampang, Thulung, Topkegola and Yamphu.
2. Madhesi Castes: Dev, Kori and Rajdhob.3. Madhesi Dalits: Dhandi, Dhankar/Dharikar, Kalar, Natuwa
and Sarbaria.4. Tarai Janajatis: Amat and Khawas.
Since many of the new groups are sub-groups of the Rai, Bhote, Sherpa and Gurung groups, this study does not treat them sepa-rately but as Rai, Bhote, Sherpa and Gurung. Appendix A provides the connection between the 2001 and 2011 censuses, and specifies which sub-groups have been allocated to the groups Rai, Bhote, etc.
The group Lohar may be classified as a Dalit group in the hills but in the Tarai they are a caste group. They, therefore, occur twice in the tables in the appendices.
We use the term ‘Janajati’ for ethnic groups. Caste groups indicate Hindu castes either in the hills as part of the Khas people or the Tarai Hindus. Dalits are part of the caste system but are considered separately. The term ‘Madhesi’ has different interpretations and can
11 Tamang and Om Gurung, op cit.12 Sharma, op cit.13 ‘Report presented to the Government of Nepal by the high-level taskforce to
refine the list of Adivasi Janajati’, 17 February, 2010.14 ‘Muslims’now cover both Tarai and Hill Muslims.

Election in Nepal 13
sometimes indicate all the people with origins in the Tarai, Caste and Janajati as well as Muslim, and at other times it denotes the Tarai Caste groups and Muslims. Here, we use the latter definition but treat Muslims as a separate group which includes both Madhesi Muslims and Hill Muslims.
Of the four small religious groups in Census 2001 – two Muslim groups in addition to Sikhs and Jains – only Muslims (Muslim) and Sikhs have been included in 2011. These are categories at the same level as caste and Janajati groups, whereas Hindus and Buddhists are cross-cutting categories and not part of the 125 census groups.15 We have defined ‘religious groups’ to include only those groups that are defined as alternatives to caste and ethnic groups, and in terms of number they are predominantly Muslims. They have been included in the summary table but not divided into Hill and Tarai groups since almost all of them live in the Tarai.
15 But religion is presented as a separate dimension in the census.

5. The Election Results per Group
Going by the definition used in this paper, it would be expected that Hill Castes would be among the included, and Dalits and Muslims shown to be excluded, while for Tarai Castes and Janajatis the pic-ture would be more complex. The data on the election results con-firm this and also suggest where the line between the included and excluded might be drawn when choosing different thresholds that separate the two groups (see Figure 1).
Appendix D provides an overview of the groups’ representation in the parliaments elected in 1991, 1994 and 1999, and Appendices E and F give the same for the 2008 and 2013 CA elections.
The 90 per cent Threshold
The General ConclusionWe first identify the groups in the three elections in the 1990s and the FPTP part of the 2008 and 2013 elections that won fewer seats than the threshold corresponding to 90 per cent of their share of the
Figure 1. An illustration of how the broad groups may be divided into included and excluded groups. The line is dependent on the threshold
one wants to apply.
Included
Excluded
Hill Castes
JanajatisTarai Castes
Muslims
Dalits

Election in Nepal 15
population. Groups for which a conclusion cannot be drawn directly from the data, either because of the size of the group or because there is no clear trend, are given special attention.
Out of the broad categories, Hill Dalits and Madhesi Dalits are, as expected, excluded in their entirety since each of their sub-groups fall well under the threshold in their representation. The Hill Castes are all included since they cross the threshold. The religious minor-ities (Muslims, Jains and Sikhs) are also excluded. Among Tarai Janajatis, all groups except for Tharus fall under the threshold. Some odd representation for some groups may be due to random effects. For the Hill and Mountain Janajatis and the Madhesi Caste groups the picture is more complex and they will be discussed in further detail below.
A similar study was done before the 2013 elections were held. The only difference in the 2013 results was that the Madhesi Caste, Sudhi, and the Tarai Janajati group, Tharu, changed from excluded to included, lowering the proportion of excluded groups from 49.6 to 45.1 per cent.16 The status of all other groups remained the same.
Table 2 provides a comparison between the election results for excluded and included groups and their shares of the population.
As seen from the table, 45.1 per cent of the population has only been able to win from 9 to 13 per cent of the seats with the exception of the 2008 election when they won almost 22 per cent. They are, in other words, grossly under-represented in the FPTP elections.
Dalits did receive fair representation in the PR race of the CA elections due to the quotas as shown in Appendices E and F. Some of the excluded Janajati groups, Madhesi Castes and Muslims were also represented in PR, although, with a few exceptions, these quotas were filled by the sub-groups already included within the groups.
16 The analysis of the pre-2013 election results used the 2001 census (Vollan, op cit). The drop of the share of excluded is less than the combined share of the two groups, Tharus and Sudhi, because the share of population of the rest of the excluded groups has actually increased.

16 Election in Nepal
Table 2: The division of excluded and included groups with the results for the FPTP elections from 1991 to 2013 compared to the groups’
share of the population as per the 2011 census. (The threshold is set at 90 per cent)
Group 1991 1994 1999 2008 FPTP
2013 FPTP
Share of population
according to the census 2011
Excluded groupsHill Dalits 0.5 0.0 0.0 2.5 0.4 8.6Hill and Mountain Janajatis, excluded only
5.9 5.4 4.9 9.2 5.4 16.1
Madhesi Castes, excluded only
2.0 1.0 4.9 5.4 3.8 9.2
Madhesi Dalits 0.0 0.0 0.0 0.4 0.4 4.7Tarai Janajatis, excluded 0.5 0.0 0.5 1.7 0.8 2.1Religious groups (Muslims and Sikhs) 2.4 2.4 2.0 2.5 2.1 4.5
Total excluded groups 11.2 8.8 12.2 21.7 12.9 45.1Included groups
Hill Castes 53.7 62.4 58.1 41.3 55.0 31.3Hill and Mountain Janajatis, included only
19.5 12.7 16.6 16.3 13.8 11.2
Madhesi Castes, included only
7.3 9.3 9.3 15.4 10.4 5.8
Tarai Janajatis, included* 8.3 6.8 3.9 5.4 7.9 6.6Total included groups 88.8 91.2 87.8 78.3 87.1 54.9
* Tharus only
Hill CastesThese are clearly the elite with Bahun and Chhetri as the dominant groups, but also including Thakuri and Sanyasi.
Hill MuslimsThey have never won an FPTP seat and are therefore excluded.
Hill DalitsThey are clearly excluded.
Hill and Mountain JanajatisBy using the criteria defined above, the excluded Hill and Mountain
Election in Nepal 17
Janajati groups are: Bhote, Bote, Bramu/Baramu, Byangsi, Chhan-tel, Chepang, Danuwar, Darai, Dura, Gharti /Bhujel, Hayu, Hyalmo (Yehylmo), Jirel, Kumal, Kusunda, Lepcha, Magar, Majhi, Pahari, Raji, Raute, Sherpa, Sunuwar, Tamang, Thami, Walung and Yakkha.
Of these, although Sunuwar, Gharti /Bhujel, Sherpa and Danu-war have won only one or two odd seats and crossed the threshold in some elections, those instances seem to be random and hence they can still be considered excluded.
The groups that were adequately represented (or over-represented) were: Newar, Gurung, Limbu, Rai and Thakali. Because they crossed the threshold in the previous elections, Rai are listed as included even if they fell below the threshold in 2013.
Madhesi (Tarai) CastesThe following is the list of excluded groups among Madhesi Castes: Badhaee, Bangali, Baraee, Bin, Dhunia, Gaderi/Bhedhar, Hajam/Thakur, Haluwai, Kahar, Kalwar, Kamar, Kanu, Kewat, Koiri/Kushwaha, Kumhar, Kurmi, Lodh, Lohar, Mali, Mallaha, Marwari, Nuniya, Nurang, Rajbhar, Rajdhob, Sonar, Sudhi and Teli.
Of these, Baraee, Bin and Kumhar have had only a single represent-ative in some elections but that seems to have been a random instance. Marwaris won seats and crossed the threshold in 1999 and 2008, but not in the other elections, including the last and they are classified as excluded. Koiri/Kushwaha was over the threshold in 2008, but have otherwise been below, and are therefore classified as excluded.
The over-represented or adequately represented Madhesi Caste groups are: Brahmin, Dev, Kayastha, Kathbaniyan, Rajput, Sudhi and Yadav. Rajput and Yadav are classified as included based on the overall tendency even though they have fallen below the threshold in one election each. Kathbaniyan and Sudhi have sometimes been above and sometimes below the threshold, and it is difficult to deter-mine their status based on the FPTP elections only. According to Bennett and Parajuli’s (2013) multidimensional index, they are both included, and both groups have done well in List PR.17 We, there-17 The two groups do well in The Nepal Multidimensional Social Inclusion Index
as well, placed at the 12th and 14th places.

18 Election in Nepal
fore, classify them as included. Dev is a very small group introduced in 2011 and for whom statistics become insignificant. They are listed as included due to their general position in society being close to the included castes.
Religious GroupsMuslims and Punjabi/Sikhs both fell under the threshold in all elec-tions. Jain was a group mentioned in the 2001 census but not in 2011. None of these groups has ever won any seats in parliament.
Tarai JanajatisThe largest Tarai Janajati group are the Tharu, comprising 6.6 per cent of the national population. Tharus won 5.4 per cent of the FPTP seats in 2008 and 7.9 per cent in 2013. With their increased repre-sentation in 2013 it seems reasonable to classify Tharus as included, having passed the threshold in three elections and otherwise always winning FPTP seats.
There are another 14 Tarai Janajati groups, all of which are very small (0.01 to 0.83 per cent). These are all classified as excluded: Amat, Dhanuk, Dhimal, Gangai, Jhangad (Dhagar/Jhagar), Khawas, Kisan, Koche, Meche, Munda, Pattharkatta/Kuswadiya, Rajbanshi, Santhal/Satar and Tajpuriya.
The 60 per cent ThresholdAfter having used 90 per cent as a threshold for classification, we reduce it by a full 30 points to 60 per cent. But, practically nothing changes with only two groups move from being excluded to being included: the Koiri/Kushwaha (with 1.16 per cent of the population) and the Teli (with 1.40 per cent of the population) both from the Madhesi Caste group. The results are given in Table 3.
There are groups which cross the threshold in one election or the other but the overall tendency does not change. The results are there-fore quite robust to changes in the threshold which means that the separation between included and excluded groups is quite distinct.

Election in Nepal 19
Table 3: The division of excluded and included groups with the results for the FPTP elections from 1991 to 2013 compared to the groups’ share
of the population as per the 2011 census. (The threshold is set at 60 per cent)
Group 1991 1994 1999 2008 FPTP
2013 FPTP
Share of population
according to the census 2011
Excluded groupsHill Dalits 0.5 0.0 0.0 2.5 0.4 8.6Hill and Mountain Janajatis, excluded only
5.9 5.4 4.9 9.2 5.4 16.1
Madhesi Castes, excluded only
1.0 0.0 2.9 2.9 1.7 6.6
Madhesi Dalits 0.0 0.0 0.0 0.4 0.4 4.7Tarai Janajatis, excluded 0.5 0.0 0.5 1.7 0.8 2.1Religious groups (Muslims and Sikhs) 2.4 2.4 2.0 2.5 2.1 4.5
Total excluded groups 10.2 7.8 10.2 19.2 10.8 42.6Included groups
Hill Castes 53.7 62.4 58.1 41.3 55.0 31.3Hill and Mountain Janajatis, included only
19.5 12.7 16.6 16.3 13.8 11.2
Madhesi Castes, included only
8.3 10.2 11.2 17.9 12.5 8.3
Tarai Janajatis, included* 8.3 6.8 3.9 5.4 7.9 6.6Total included groups 89.8 92.2 89.8 80.8 89.2 57.4
* Tharus only
Representation of WomenAn analysis of the gender representation in the 1990s shows that the few women elected came from Hill Caste or Hill Janajati groups with the exception being the election of three Madhesi Caste women in 1999 (see Table 4).
The general pattern was the same in the FPTP races of 2008 and 2013, but the female representation in the List PR race was much more diverse since there had to be 50 per cent women with-in each of the broad ethnic or caste groups in List PR, see Tables 5 and 6.

20 Election in Nepal
Table 4: Gender representation within each group in the elections in 1991 to 1999.
(Number of representatives)Year 1991 1994 1999Group Men Women Total Men Women Total Men Women TotalHill Castes 107 3 110 123 5 128 110 9 119Hill Dalits 1 0 1 0 0 0 0 0 0Hill and Mountain Janajatis
50 2 52 34 3 37 43 1 44
Madhesi Castes 19 0 19 21 0 21 25 3 28
Madhesi Dalits 0 0 0 0 0 0 0 0 0Tarai Janajatis 18 0 18 14 0 14 12 0 12
Religious groups (Muslims and Sikhs)
5 0 5 5 0 5 2 0 2
Total 200 5 205 197 8 205 192 13 205
The two CA elections showed totally different patterns in wom-en’s representation in the FPTP race. In 2008, 16 out of the 99 elect-ed members from the Hill Castes were women, but in 2013 that dropped to two out of 132. In 2008, 24 of the 30 elected women in FPTP came from the CPN (Maoist) party, and 13 of the 16 Hill Caste women were Maoists. In 2013, only one of the 10 women elected was from the UCPN (Maoist),18 which is a significant reduc-tion even considering that the total number of FPTP seats won by the Maoists went down five-fold from 120 to 26. The other parties had a similar profile in the two elections.
The 2008 FPTP election seems to have been an exception rather than a trend regarding the total share of women and their group identity. Women elected in FPTP tend to come from Hill Caste and Hill Janajati groups, but in the 2008 elections they were from all the broad groupings except Madhesi Dalit.
18 Following the dissolution of the CA in 2012 the Maoist party split and the splinter group formed the party CPN(Maoist) and did not participate in the 2013 election.
Election in Nepal 21
Tabl
e 5:
Gen
der r
epre
sent
ation
with
in e
ach
grou
p in
bot
h ra
ces a
nd th
e ap
poin
tees
in th
e 20
08 C
A el
ectio
n.
(Num
ber o
f rep
rese
ntati
ves)
Gro
upSe
ction
of t
he C
A el
ectio
nTo
tal
FPTP
List
PR
Appo
inte
dM
enW
omen
Tota
lM
enW
omen
Tota
lM
enW
omen
Tota
lM
enW
omen
Tota
lHi
ll Ca
stes
8316
9949
4594
71
813
962
201
Hill
Dalit
s4
26
1613
290
2015
35Hi
ll an
d M
ount
ain
Jana
jatis
547
6145
4590
54
910
456
160
Mad
hesi
Cast
es47
350
3831
693
388
3412
2M
adhe
si Da
lits
10
15
1015
06
1016
Tara
i Jan
ajati
s16
117
1513
284
15
3515
50Re
ligio
us g
roup
s (M
uslim
s and
Si
khs)
51
66
410
11
125
17
Tota
l21
030
240
174
161
335
206
2640
419
760
1

22 Election in Nepal
Tabl
e 6:
Gen
der r
epre
sent
ation
with
in e
ach
grou
p in
bot
h ra
ces a
nd th
e ap
poin
tees
in th
e 20
13 C
A el
ectio
n.
(Num
ber o
f rep
rese
ntati
ves)
Gro
upSe
ction
of t
he C
A el
ectio
nTo
tal
FPTP
List
PR
Appo
inte
d*
Men
Wom
en To
tal
Men
Wom
enTo
tal
Men
Wom
enTo
tal
Men
Wom
enTo
tal
Hill
Cast
es13
02
132
5448
102
184
5023
4Hi
ll Da
lits
10
113
1326
1413
27Hi
ll an
d M
ount
ain
Jana
jatis
442
4647
4289
9144
135
Mad
hesi
Cast
es32
234
3328
6165
3095
Mad
hesi
Dalit
s1
01
47
115
712
Tara
i Jan
ajati
s18
321
1418
3232
2153
Relig
ious
gro
ups (
Mus
lims
and
Sikh
s)4
15
86
1412
719
Tota
l23
010
240
173
162
335
403
172
575
* Th
e fu
ll ap
poin
tmen
ts h
ad n
ot b
een
mad
e at
the
time
of w
riting
this
pape
r.
6. Possible Minimum Quotas
Some ExamplesElectoral quotas may be based on the results presented above. Clear-ly, other criteria may be used as well, such as poverty or other indi-ces.19 The advantage of using earlier election results is that they relate directly to parliamentary elections and can be monitored over time so that the continued need for affirmative action can be reviewed from time to time, provided there is a part of the election that does not apply quotas.
Based on the above, one may consider guaranteeing minimum representation for those groups which came out as being excluded in the study above. In other words, quotas for all groups, including the elite, may be replaced with minimum representation for excluded groups. If a mixed electoral system is to be used in the future, such minimum quotas may be applied to either the List PR race sepa-rately or to the full result of the elections. In addition, there should be an overall minimum requirement of at least 50 per cent women, since women have been grossly under-represented in all FPTP elec-tions since 1991.
The minimum quotas could either be specified for each of the broad groups – Dalits, excluded Janajatis, religious groups, and excluded Madhesi Caste groups – or it could simply be one figure combining all the groups. In the latter case, the parties would be free to fill the quotas with candidates from any of the listed groups, whereas in the first case they would have to fill them for each of the four groups. If one got rid of the distinction between Hill and Tarai Janajatis and Hill and Madhesi Dalits, the system would become less complicated, and it would also force Madhesi parties to have
19 The Nepal Multidimensional Exclusion Index (op cit) and The Nepal Multidimensional Social Inclusion Index: Diversity and Agenda for Inclusive Development (op cit) have suggested baselines for social inclusion.

24 Election in Nepal
Hill candidates on their lists. Given that in 2008 and 2013, par-ties with fewer than 100 candidates were exempted from the quota rules in order to accommodate the demand from Madhesi parties, if excluded Janajatis and Dalits are seen as combined groups there would be no reason for such an exemption.20
Example Based on 90 per cent ThresholdIf the four groups of the excluded are placed separately, the mini-mum representation could be as presented in Table 7.
Table 7: Possible minimum representation of groups based on the 1991 to 2013 FPTP elections, with 90 per cent threshold.
Group QuotaDalits 13.3Janajatis, excluded only 18.1Madhesi Castes, excluded only 9.2Muslims, Sikhs and Jains 4.5Total 45.1
To make the quotas fully neutral and very simple, one could combine all the groups and simply state that at least 45.1 per cent need to come from excluded groups and such groups include Dalits, excluded Madhesi Castes, excluded Janajatis, Muslims, Sikhs and Jains without specifying the actual proportion of the four groups that are excluded. This would also allow parties representing an excluded group to have candidates from their own group(s) only.
Example Based on 60 per cent ThresholdWith the lower threshold of 60 per cent, the minimum representa-tion could be as given in Table 8.
Should one choose the simpler approach of a combined minimum for all groups, it would simply mean that 42.6 per cent would have to come from the excluded groups.
20 The exemption was only defined in the election law, not in the constitution.

Election in Nepal 25
Table 8: Possible minimum representation of groups based on the 1991 to 2013 FPTP elections, with 60 per cent threshold.
Group QuotaDalits 13.3Janajatis, excluded only 18.1Madhesi Castes, excluded only 6.6Muslims, Sikhs and Jains (Hill and Tarai) 4.5Total 42.6
Some Effects of the Minimum QuotasIn addition to being simpler for parties and more targeted towards the groups which need affirmative measures, a shift to minimum representation would also solve some of the more problematic sides of maintaining quotas for everybody. Divisions based on caste and ethnicity are far from ideal and all discrimination-based group iden-tities should be abolished. This is in line with the Nepali constitution and most people would agree that the vision is that all people have the same opportunity and the same possibility for political participa-tion regardless of identity. The reality, however, is that formal equal-ity is far from being implemented, as this study shows. Therefore, affirmative action may be a tool for promoting equality, and such measures are legitimate as long as the purpose is to develop equali-ty.21 On the other hand, it is also true that any quota rule introduces divisions of inequality and marks people by identity in some way or another. With quotas for everybody, every candidate in the List PR race as currently framed will have to disclose his or her iden-tity. This may accentuate and deepen inequalities and the separation between groups and make identity more important than it would otherwise perhaps be. If quotas are given only to those who need a push towards equal participation, the division is limited to the bare minimum. Invoking group rights should be an individual choice. It is well understood that, for example, ethnic groups should have a right to promote their culture, language, religion, etc. However, a
21 See for example the ‘CCPR General Comment 25 (Article 25: The right to participate in public affairs, voting rights and the right of equal access to public service)’, CCPR/C/21/Rev.1/Add.7, 27 August 1996, issued by the UN Office of the High Commissioner for Human Rights

26 Election in Nepal
person belonging to a group may also freely choose not to invoke such rights. With minimum quotas, a candidate from a Dalit back-ground can still run as a candidate in List PR without disclosing his or her identity, and not count towards the party’s minimum quota. Only the candidates who are to fill the required minimum represen-tation will have to disclose their identity.
In 2008 and 2013, there had to be 50 per cent women within each of the ethnic and caste groups defined. There was a fear that otherwise all women would come from the elite groups. As a result, women representation has been broad. If one shifts to a system of minimum representation of excluded groups including women, the incentives for the parties to nominate women from excluded groups on the lists would be high. Parties would probably want to protect their leaders on the lists and they would most often be men belong-ing to elite groups. In order to reserve space for the elite, the parties would try to find female candidates from excluded groups because they would fill two slots for excluded groups. A female Dalit candi-date on the list would be like killing two birds with one stone; she would fill the Dalit as well as the women’s quota. It would, there-fore, not be necessary to specify which group the female candidates belong to, and that will in itself represent a significant simplification of the quota system.
Quotas Applied to List PR Part of the Election or to the Whole Membership of ParliamentIt has been suggested in some of the concept papers of the 2008 to 2012 CA that women should be guaranteed at least 33 per cent of the total membership of the parliament. This could be implemented by introducing a compensatory mechanism whereby more List PR seats are filled by women should a party have a deficit in their FPTP representation. A similar mechanism could be used for excluded caste and Janajati groups as well as for religious groups.
A Sunset ClauseAffirmative action may have three purposes which are not clearly distinct from each other, but which may still offer a fruitful approach

Election in Nepal 27
to an analysis: (i) to balance groups which are or have come out of conflict as part of an overall power-sharing deal; (ii) to help exclud-ed groups be represented in order to achieve genuine, and not only formal, equality over time; and (iii) to ensure that normally small groups with an identity and with political interests that differentiates them from the majority in such a way that their voice in parliament ought to be heard, are represented. The latter two are most relevant for Nepal.
If the purpose is equality in representation, as in point (ii) above, it would be logical to give affirmative action a validity period. In India, for example, the special measures for Scheduled Castes and Sched-uled Tribes were given 10 years in the constitution when adopted. Unfortunately, real equality has not yet been reached and the parlia-ment has extended the deadline, currently to 70 years, counting from when the constitution came into effect in 1950. Instead of setting a fixed number of years, one might at certain intervals, for example, following each census, assess how groups are developing. Based on such new assessments, one may adjust the list of excluded groups, and, hopefully in the end, remove all groups because group identity would not be significant for political participation any more.
One example of a category where genuine equality is a goal is women. In old democracies it has taken over a century to create equality in representation, from when women were given the formal equal right to vote and stand for elections till today when equality is within reach. This has often been done without legislating affirma-tive action but parties have volunteered to incorporate such rules in their by-laws. In new democracies, legislation has been seen neces-sary to accelerate the process. At a time when the gender balance is working without affirmative action one may consider removing the legal provisions. The same applies to Dalits or other excluded groups in Nepal. At a time when caste-based discrimination and other forms of inequalities have been removed, there will be little reason to continue with affirmative action. The question is how to monitor when a sufficient degree of equality has been reached. In this paper, the definition of politically excluded has been linked to the group’s under-representation under FPTP. If Nepal maintains a

28 Election in Nepal
mixed electoral system and affirmative action is applied to the List PR side only, one may monitor the FPTP results on a regular basis and get rid of affirmative action when the FPTP produces a result fairly including candidates of previously excluded groups.
For groups mentioned in point (iii) above, i.e., minorities which should be represented in the legislature even if structural barriers working against representation are removed, a time stamp may be less relevant. These are small minorities which may from time to time be represented in parliament without affirmative action but which have such interests which may defend affirmative action on a permanent basis. Examples of groups which are given special treatment to help or secure representation because of recognised special interests are found in a number of countries, such as Germany, Slovenia, Hun-gary, Bolivia, Venezuela, Jordan and Mali. It is not expected that the characteristics will change any time soon and the minorities’ voices have to be heard in parliament. It is important to note that it is not only the identity of the group which should be taken into account, in which case every one of 100-plus groups of Nepal would claim such a right, but identity combined with legitimate interests which could otherwise be ignored. For example, Janajati groups from the Hima-laya or jungle nomad groups may be seen to have such special politi-cal interests where their traditional way of life and their livelihood could be threatened by projects initiated by the centre. This is partly a political and partly an anthropological issue and the work on pos-sibly identifying such groups should be based on pre-defined criteria.
The lawmakers will require the courage to state that some exclud-ed groups would be subject to affirmative action only for a limited time whereas others merit more permanent protection. However, if the system of minimum representation is implemented, the legisla-tion should clearly list the different groups which are to be provided affirmative action at any given time, so that any ambiguity is reduced to a minimum.
Appendices


Election in Nepal 31
Appendix A. The relationship between the groups of the 2001 Census and the 2011 Census.
In the 2001 census there were 100 caste and ethnic groups. In 2011, this had increased to 125. Most of them were identical but for some ethnic groups, sub-groups were introduced. For example, Rai now includes 12 sub-groups. A few new groups were added while two groups, Jain and Churaute, were removed. In the table below the relationship between the 2001 and 2011 censuses are shown and all the groups they are allocated to the broader categories of Hill Castes, Tarai Janajatis, etc.
2001 2011 The 2011 group is merged with this group in this study
Name of Group Name of Group
Hill CastesBrahmin - Hill Brahmin - HillChhetri ChhetriSanyasi Sanyasi/DasnamiThakuri Thakuri
Hill Religious GroupChuraute - Muslim Muslim Same as Madhesi Muslim
Hill DalitsBadi BadiDamai/Dholi Damai/DholiGaine GaineKami KamiLohar Lohar*
Sarki SarkiHill and Mountain Janajatis
Bhote BhoteDolpo Bhote
Bote BoteChhantel Chhantel/ChhantyalDanuwar DanuwarDarai DaraiDura DuraBrahmu/Baramu Brahmu/Baramo
* Because Lohar is a Dalit group in the hills and a Madhesi Caste group in the Tarai, they occur twice in the appendices.

32 Election in Nepal
2001 2011 The 2011 group is merged with this group in this study
Name of Group Name of Group
Byangsi Byasi/SaukaChepang (Praja) Chepang /PrajaGharti/Bhujel Gharti/BhujelGurung Gurung
Ghale GurungHayu HayuHyolmo (Yehylmo) HyolmoJirel JirelKumal KumalKusunda KusundaLepcha LepchaLimbu LimbuMagar MagarMajhi MajhiNewar NewarPahari PahariRai Rai
Aathpariya RaiBahing RaiBantawa RaiChamling RaiKhaling RaiKulung RaiLoharung RaiMewahang Bala RaiNachhiring RaiSampang RaiThulung RaiYamphu Rai
Raji RajiRaute RauteSherpa Sherpa
Lhomi SherpaLhopa SherpaTopkegola Sherpa
Sunuwar SunuwarTamang TamangThakali Thakali

Election in Nepal 33
2001 2011 The 2011 group is merged with this group in this study
Name of Group Name of Group
Thami ThamiWalung WalungYakkha Yakkha
Madhesi CastesBadhaee BadhaeeBangali BangaliBaniya KathbaniyanBaraee BaraeeBhediyar/Gaderi Gaderi/BhedharBing/Binda BinBrahmin - Tarai Brahmin - Tarai
DevDhunia DhuniaHajam/Thakur Hajam/ThakurHaluwai HaluwaiKahar KaharKalwar KalwarKamar KamarKanu KanuKayastha KayasthaKewat KewatKoiri Koiri/Kushwaha
KoriKumhar KumharKurmi KurmiLodha LodhLohar Lohar*
Mali MaliMallah MallahaMarwari MarwariNuniya NuniyaNurang NurangRajbhar Rajbhar
RajdhobRajput RajputSonar SonarSudhi SudhiTeli TeliYadav Yadav

34 Election in Nepal
2001 2011 The 2011 group is merged with this group in this study
Name of Group Name of Group
Madhesi Religious MinoritiesMuslim MuslimPunjabi/Sikh Punjabi/SikhJain
Madhesi DalitsBantar Bantar/SardarChamar/Harijan/Ram Chamar/Harijan/RamChidimar Chidimar
DhandiDhankar/Dharikar
Dhobi DhobiDom DomDusadh/Paswan/Pasi Dusadh/Pasawan/PasiHalkhor Halkhor
KalarKhatwe KhatweMusahar Musahar
NatuwaSarbaria
Tatma Tatma/TatwaTarai Janajatis
AmatDhanuk DhanukDhimal DhimalGangai GangaiJhangad (Dhagar/Jhagar) Jhangad/Dhagar
KhawasKisan KisanKoche KocheMeche MecheMunda MundaPattharkatta/Kushwadiya Pattharkatta/KushwadiyaRajbanshi RajbanshiSanthal/Satar Satar/SanthalTajpuriya TajpuriyaTharu Tharu

Election in Nepal 35
Appendix B. The allocation of the 2001 Census sub-groups into broad groups, with 2001 population figures.
Individual Group PopulationSub-groups
Per cent Sub-group
PopulationBroad Group
Per cent Broad Group
Hill Castes 7,023,220 31.21
Brahmin - Hill 2,896,477 12.87
Chhetri 3,593,496 15.97
Sanyasi 199,127 0.88
Thakuri 334,120 1.48
Hill Religious Minority 4,893 0.02
Churaute (Muslim) 4,893 0.02
Hill Dalits 1,723,084 7.66
Badi 4,442 0.02
Damai/Dholi 390,305 1.73
Gaine 5,887 0.03
Kami 895,954 3.98
Sarki 318,989 1.42
Dalit/Unidentified Dalit 107,507 0.48
Hill and Mountain Janajatis 6,481,389 28.80
Bhote 19,261 0.09
Bote 7,969 0.04
Brahmu/Baramu 7,383 0.03
Byangsi 2,103 0.01
Chepang (Praja) 52,237 0.23
Chhantel 9,814 0.04
Danuwar 53,229 0.24
Darai 14,859 0.07
Dura 5,169 0.02
Gharti/Bhujel 117,568 0.52
Gurung 543,571 2.42
Hayu 1,821 0.01
Hyalmo (Yehylmo) 579 0.00
Jirel 5,316 0.02
Kumal 99,389 0.44
Kusunda 164 0.00

36 Election in Nepal
Individual Group PopulationSub-groups
Per cent Sub-group
PopulationBroad Group
Per cent Broad Group
Lepcha 3,660 0.02
Limbu 359,379 1.60
Magar 1,622,421 7.21
Majhi 72,614 0.32
Newar 1,245,232 5.53
Pahari 11,505 0.05
Rai 635,151 2.82
Raji 2,399 0.01
Raute 658 0.00
Sherpa 154,622 0.69
Sunuwar 95,254 0.42
Tamang 1,282,304 5.70
Thakali 12,973 0.06
Thami 22,999 0.10
Walung 1,148 0.01
Yakkha 17,003 0.08
Adibasi/Janajati 1635 0.01
Madhesi Castes 3,366,172 14.96
Badhaee 45,975 0.20
Bangali 9,860 0.04
Baniya 126,971 0.56
Baraee 35,434 0.16
Bhediyar/Gaderi 17,729 0.08
Bing/Binda 18,720 0.08
Brahmin - Tarai 134,496 0.60
Dhunia 1,231 0.01
Hajam/Thakur 98,169 0.44
Haluwai 50,583 0.22
Kahar 34,531 0.15
Kalwar 115,606 0.51
Kamar 8,761 0.04
Kanu 95,826 0.43
Kayastha 46,071 0.20
Kewat 136,953 0.61
Koiri 251,274 1.12

Election in Nepal 37
Individual Group PopulationSub-groups
Per cent Sub-group
PopulationBroad Group
Per cent Broad Group
Kumhar 54,413 0.24
Kurmi 212,842 0.95
Lodha 24,738 0.11
Lohar 82,637 0.37
Mali 11,390 0.05
Mallah 115,986 0.52
Marwari 43,971 0.20
Nuniya 66,873 0.30
Nurang 17,522 0.08
Rajbhar 24,263 0.11
Rajput 48,454 0.22
Sonar 145,088 0.64
Sudhi 89,846 0.40
Teli 304,536 1.35
Yadav 895,423 3.98
Madhesi Religious Minorities 975,125 4.33
Jain 1,015 0.00
Muslim 971,056 4.31
Punjabi/Sikh 3,054 0.01
Madhesi Dalits 952,098 4.23
Bantar 35,839 0.16
Chamar/Harijan/Ram 269,661 1.20
Chidimar 12,296 0.05
Dhobi 73,413 0.33
Dom 8,931 0.04
Dusadh/Paswan/Pasi 158,525 0.70
Halkhor 3,621 0.02
Khatwe 74,972 0.33
Musahar 172,434 0.77
Tatma 76,512 0.34
Dalit/Unidentified Dalit 65894 0.29
Tarai Janajatis 1,979,312 8.79
Dhanuk 188,150 0.84
Dhimal 19,537 0.09

38 Election in Nepal
Individual Group PopulationSub-groups
Per cent Sub-group
PopulationBroad Group
Per cent Broad Group
Gangai 31,318 0.14
Jhangad (Dhagar/Jhagar) 41,764 0.19
Kisan 2,876 0.01
Koche 1,429 0.01
Meche 3,763 0.02
Munda 660 0.00
Pattharkatta/Kuswadiya 552 0.00
Rajbanshi 95,812 0.43
Santhal/Satar 42,698 0.19
Tajpuriya 13,250 0.06
Tharu 1,533,879 6.82
Adibasi/Janajati 3,624 0.02
Total 22,505,293 100.00 22,505,293 100.00
The census group 103 (‘Unidentified Caste/Ethnic Group’), with 231,641 people, is not included in the total. The groups 81 ( ‘Adiba-si/Janajatis’) and 102 (‘Unidentified Dalits’) are divided between the Hill/Mountain groups and Tarai groups following the Central Bureau of Statistics paper on population of caste and ethnic groups.1
By combining Madhesi Dalits and Tarai Janajatis with the corre-sponding Hill and Mountain groups, the following shows the com-parison between the quotas in the 2008 and 2013 elections and the classification calculated here based on the 2001 census.
Group to be representedThe 2008 and 2013
quotasin per cent
Classification calculated as per the 2001 census in
per centMadhesis 31.2 32.0
Dalits 13.0 11.9
Janajatis 37.8 37.6Others 30.2 31.2
1 Central Bureau of Statistics, Rastriya Janaganana, 2058 (Jat/Jati ko Janasankhya) (National Census, 2001 [Population of Caste/Ethnic Groups]) (Central Bureau of Statistics, Kathmandu, 2007) (in Nepali).

Election in Nepal 39
Appendix C. The allocation of the 2011 Census sub-groups into broad groups, with 2011 population figures.
Individual GroupPopulation
Census Group
Per cent Census Group
PopulationBroad Group
Per cent Broad Group
Hill Castes 8,278,401 31.27
Brahmin - Hill 3,226,903 12.19
Chhetri 4,398,053 16.61
Sanyasi/Dasnami 227,822 0.86
Thakuri 425,623 1.61
Hill Dalits 2,275,336 8.60
Badi 38,603 0.15
Damai/Dholi 472,862 1.79
Gaine 6,791 0.03
Kami 1,258,554 4.75
Lohar (also Madhesi Caste) 25,355 0.10
Sarki 374,816 1.42
Unknown Dalits 98355 0.37
Hill and Mountain Janajatis 7,210,881 27.24
Bhote 17,504 0.07
Bote 10,397 0.04
Brahmu/Baramu 8,140 0.03
Byasi/Sauka 3,895 0.01
Chepang (Praja) 68,399 0.26
Chhantyal/Chhantel 11,810 0.04
Danuwar 84,115 0.32
Darai 16,789 0.06
Dura 5,394 0.02
Gharti /Bhujel 118,650 0.45
Gurung 545,522 2.06
Hayu 2,925 0.01
Hyolmo 10,752 0.04
Jirel 5,774 0.02
Kumal 121,196 0.46
Kusunda 273 0.00
Lepcha 3,445 0.01

40 Election in Nepal
Individual GroupPopulation
Census Group
Per cent Census Group
PopulationBroad Group
Per cent Broad Group
Limbu 387,300 1.46
Magar 1,887,733 7.13
Majhi 83,727 0.32
Newar 1,321,933 4.99
Pahari 13,615 0.05
Rai 694089 2.62
Raji 4,235 0.02
Raute 618 0.00
Sherpa 118707 0.45
Sunuwar 55,712 0.21
Tamang 1,539,830 5.82
Thakali 13,215 0.05
Thami 28,671 0.11
Walung 1,249 0.00
Yakkha 24,336 0.09
Janajati Others, included, ratio
332 0.00
Janajati Others, excluded, ratio
599 0.00
Madhesi Castes 3,960,383 14.96
Badhaee 28,932 0.11
Bangali 26,582 0.10
Baraee 80,597 0.30
Bin 75,195 0.28
Brahmin - Tarai 134,106 0.51
Dev 2,147 0.01
Dhunia 14,846 0.06
Gaderi/Bhedhar 26,375 0.10
Hajam/Thakur 117,758 0.44
Haluwai 83,869 0.32
Kahar 53,159 0.20
Kalwar 128,232 0.48
Kamar 1,787 0.01
Kanu 125,184 0.47

Election in Nepal 41
Individual GroupPopulation
Census Group
Per cent Census Group
PopulationBroad Group
Per cent Broad Group
Kathbaniyan 138,637 0.52
Kayastha 44,304 0.17
Kewat 153,772 0.58
Koiri/Kushwaha 306,393 1.16
Kori 12,276 0.05
Kumhar 62,399 0.24
Kurmi 231,129 0.87
Lodh 32,837 0.12
Lohar 76,066 0.29
Mali 14,995 0.06
Mallaha 173,261 0.65
Marwari 51,443 0.19
Nuniya 70,540 0.27
Nurang 278 0.00
Rajbhar 9,542 0.04
Rajdhob 13,422 0.05
Rajput 41,972 0.16
Sonar 64,335 0.24
Sudhi 93,115 0.35
Teli 369,688 1.40
Yadav 1,054,458 3.98
Other Tarai excluded ratio 26,014 0.10
Other Tarai included ratio 20,738 0.08
Madhesi Religious Minorities
1,185,320 4.48
Muslim 1,164,255 4.40
Punjabi/Sikh 7,176 0.03
Tarai Unspecified, ratio 13,889 0.05
Madhesi Dalits 1,254,216 4.74
Bantar/Sardar 55,104 0.21
Chamar/Harijan/Ram 335,893 1.27
Chidimar 1,254 0.00
Dhandi 1,982 0.01
Dhankar/Dharikar 2,681 0.01

42 Election in Nepal
Individual GroupPopulation
Census Group
Per cent Census Group
PopulationBroad Group
Per cent Broad Group
Dhobi 109,079 0.41
Dom 13,268 0.05
Dusadh/Paswan/Pasi 208,910 0.79
Halkhor 4,003 0.02
Kalar 1,077 0.00
Khatwe 100,921 0.38
Musahar 234,490 0.89
Natuwa 3,062 0.01
Sarbaria 4,906 0.02
Tatma/Tatwa 104,865 0.40
Dalit Others ratio 56,999 0.22
Tarai Others ratio 15,722 0.06
Tarai Janajatis 2,308,040 8.72
Amat 3,830 0.01
Dhanuk 219,808 0.83
Dhimal 26,298 0.10
Gangai 36,988 0.14
Jhangad (Dhagar/Jhagar) 37,424 0.14
Khawas 18,513 0.07
Kisan 1,739 0.01
Koche 1,635 0.01
Meche 4,867 0.02
Munda 2,350 0.01
Pattharkatta/Kuswadiya 3,182 0.01
Rajbanshi 115,242 0.44
Santhal/Satar 51,735 0.20
Tajpuriya 19,213 0.07
Tharu 1,737,470 6.56
Tarai Other, ratio 27449 0.10
Janajatis Other ratio 297 0.00
Total 26,472,577 100.00 26,472,577 100.00
In 2011, a number of new groups were introduced. Some were sub-groups of groups already defined. In this paper, we have merged the

Election in Nepal 43
sub-groups into the group of which they formed a part earlier. See Appendix A for details.
In the census there were a number of ‘unspecified’ people, which means that they have not been allocated to any one of the 125 iden-tified groups although some were identified as belonging to the broader groups. The unspecified are:
Dalit Others 155,354
Janajati Others 1,228
Tarai Others 103,811
Undefined Others 15,277
The group ‘Undefined Others’ is ignored in the table above, but ‘Dalit Others’, ‘Janajati Others’ and ‘Tarai Others’ have been distrib-uted according to the ratio of the identified population figures. This means that whenever population is allocated to a broad group the ratio-based figures are included, but when any one of the 125 census groups is identified those numbers are not included.

44 Election in Nepal
Appendix D. The representation of groups in the parliaments of the 1990s.
Group1991 1994 1999 Census
2001Number of MPs
In per cent
Number of MPs
In per cent
Number of MPs
In per cent
In per cent
Hill Castes 110 53.7 128 62.4 119 58.0 31.2Brahmin - Hill 75 36.6 89 43.4 76 37.1 12.9Chhetri 20 9.8 23 11.2 25 12.2 16.0Sanyasi 1 0.5 2 1.0 0.9Thakuri 15 7.3 15 7.3 16 7.8 1.5
Hill Religious Minority 0.0
Hill Muslim (Churaute) 0.0
Hill Dalits 1 0.5 7.7Badi 0.0Damai/Dholi 1 0.5 1.7
Gaine 0.0Kami 4.0Sarki 1.4
Hill and Mountain Janajatis 52 25.4 37 18.0 44 21.5 28.8
Bhote 0.1Bote 0.0Bramu/Baramu 0.0Byangsi 0.0Chepang (Praja) 0.2Chhantel 0.0Danuwar 1 0.5 0.2Darai 0.1Dura 0.0Gharti /Bhujel 1 0.5 1 0.5 0.5Gurung 8 3.9 5 2.4 6 2.9 2.4Hayu 0.0Hyalmo (Yehylmo) 0.0Jirel 0.0Kumal 0.4Kusunda 0.0Lepcha 0.0

Election in Nepal 45
Group1991 1994 1999 Census
2001Number of MPs
In per cent
Number of MPs
In per cent
Number of MPs
In per cent
In per cent
Limbu 7 3.4 3 1.5 8 3.9 1.6Magar 6 2.9 5 2.4 4 2.0 7.2Majhi 0.3Newar 16 7.8 12 5.9 14 6.8 5.5Pahari 0.1Rai 6 2.9 5 2.4 5 2.4 2.8Raji 0.0Raute 0.0Sherpa 2 1.0 0.7Sunuwar 1 0.5 0.4Tamang 4 2.0 4 2.0 4 2.0 5.7Thakali 3 1.5 1 0.5 1 0.5 0.1Thami 0.1Walung 0.0Yakkha 0.1
Madhesi Castes 19 9.3 21 10.2 29 14.1 15.0Badhaee 0.2Bangali 0.0Baniya 1 0.5 2 1.0 0.6Baraee 1 0.5 0.2Bhediyar/Gaderi 0.1Bing/Binda 0.1Brahmin - Tarai 5 2.4 5 2.4 4 2.0 0.6Dhunia 0.0Hajam/Thakur 0.4Haluwai 0.2Kahar 0.2Kalwar 0.5Kamar 0.0Kanu 1 0.5 0.4Kayastha 3 1.5 3 1.5 1 0.5 0.2Kewat 0.6Koiri 2 1.0 2 1.0 1.1Kumhar 1 0.5 1 0.5 0.2Kurmi 1 0.5 0.9Lodha 0.1Lohar 0.4Mali 0.1

46 Election in Nepal
Group1991 1994 1999 Census
2001Number of MPs
In per cent
Number of MPs
In per cent
Number of MPs
In per cent
In per cent
Mallah 0.5Marwari 3 1.5 0.2Nuniya 0.3Nurang 0.1Rajbhar 0.1Rajput 3 1.5 2 1.0 0.2Sonar 0.6Sudhi 0.4Teli 4 2.0 1.4Yadav 4 2.0 8 3.9 12 5.9 4.0
Madhesi Religious Minorities 5 2.4 5 2.4 4 2.0 4.3
Jain 0.0Muslim 5 2.4 5 2.4 4 2.0 4.3Punjabi/Sikh 0.0
Madhesi Dalits 0 0.0 0 0.0 0 0.0 4.29Bantar 0.2Chamar, Harijan, Ram 1.2Chidimar 0.1Dhobi 0.3Dom 0.0Dusadh/Paswan/Pasi 0.7Halkhor 0.0Khatwe 0.3Musahar 0.8Tatma 0.3
Tarai Janajatis 18 8.8 14 6.8 9 4.4 8.8Dhanuk 1 0.5 0.8Dhimal 0.1Gangai 0.1Jhangad (Dhagar/Jhagar) 0.2Kisan 0.0Koche 0.0Meche 0.0Munda 0.0

Election in Nepal 47
Group1991 1994 1999 Census
2001Number of MPs
In per cent
Number of MPs
In per cent
Number of MPs
In per cent
In per cent
Pattharkatta/Kuswadiya 0.0Rajbanshi 1 0.5 0.4Santhal/Satar 0.2Tajpuriya 0.1Tharu 17 8.3 14 6.8 8 3.9 6.8
Total 205 100.0 205 100.0 205 100.0 100.0
The comparison of the three elections of the 1990s is against the 2001 census because the 2011 census had not been published at the time of the analysis, but the assessment of excluded groups in Sec-tion 5 (pp. 14-23) has used the 2011 census only. New groups intro-duced in 2011 are not included in the figures of this appendix for the elections held in the 1990s. The population shares of sub-groups do not always add up to the share for the broader groups, because the broader group may contain categories of unspecified others, see the explanation under the table of Appendix C.

48 Election in Nepal
Appendix E. The representation of groups in the Constituent Assembly of 2008.
GroupFPTP List PR
Total, incl. the 26 appointees
Census 2001
Number of MPs
In per cent
Number of MPs
In per cent
Number of MPs
In per cent
In per cent
Hill Castes 99 41.3 94 28.1 201 33.4 31.2Brahmin - Hill 61 25.4 61 18.2 127 21.1 12.9Chhetri 29 12.1 23 6.9 53 8.8 16.0Sanyasi 1 0.3 1 0.2 0.9Thakuri 9 3.8 9 2.7 20 3.3 1.5
Hill Religious Minority 0 0.0 1 0.3 1 0.2 0.0
Hill Muslim (Churaute)
1 0.3 1 0.2 0.0
Hill Dalits 6 2.5 29 8.7 35 5.8 7.7Badi 1 0.3 1 0.2 0.0Damai/Dholi 1 0.4 5 1.5 6 1.0 1.7Gaine 0.0Kami 3 1.3 19 5.7 22 3.7 4.0Sarki 2 0.8 2 0.6 4 0.7 1.4Unknown Dalits 2 0.6 2 0.3
Hill and Mountain Janajatis 61 25.4 90 26.8 160 26.6 28.8
Bhote 2 0.6 3 0.5 0.1Bote 0.0Bramu/Baramu 1 0.2 0.0Byangsi 0.0Chepang(Praja) 2 0.6 2 0.3 0.2Chhantel 0.0Danuwar 1 0.4 1 0.3 2 0.3 0.2Darai 0.1Dura 2 0.6 2 0.3 0.0Gharti /Bhujel 1 0.3 1 0.2 0.5Gurung 11 4.6 9 2.7 21 3.5 2.4Hayu 0.0Hyalmo (Yehylmo)
1 0.3 1 0.2 0.0
Jirel 1 0.3 1 0.2 0.0Kumal 3 0.9 3 0.5 0.4

Election in Nepal 49
GroupFPTP List PR
Total, incl. the 26 appointees
Census 2001
Number of MPs
In per cent
Number of MPs
In per cent
Number of MPs
In per cent
In per cent
Kusunda 0.0Lepcha 2 0.6 2 0.3 0.0Limbu 7 2.9 6 1.8 13 2.2 1.6Magar 13 5.4 16 4.8 30 5.0 7.2Majhi 1 0.3 1 0.2 0.3Newar 12 5.0 16 4.8 31 5.2 5.5Pahari 1 0.2 0.1Rai 8 3.3 11 3.3 19 3.2 2.8Raji 0.0Raute 0.0Sherpa 4 1.2 5 0.8 0.7Sunuwar 1 0.3 1 0.2 0.4Tamang 8 3.3 8 2.4 16 2.7 5.7Thakali 1 0.4 2 0.6 3 0.5 0.1Thami 1 0.3 1 0.2 0.1Walung 0.0Yakkha 0.1
Madhesi Castes 50 20.8 69 20.5 122 20.3 15.0Badhaee 0.2Bangali 0.0Baniya 2 0.8 2 0.6 4 0.7 0.6Baraee 1 0.4 1 0.2 0.2Bhediyar/Gaderi 0.1Bing/Binda 0.1Brahmin - Tarai 6 2.5 8 2.4 15 2.5 0.6Dhunia 0.0Hajam/Thakur 1 0.3 1 0.2 0.4Haluwai 0.2Kahar 0.2Kalwar 0.5Kamar 0.0Kanu 1 0.4 2 0.6 4 0.7 0.4Kayastha 1 0.4 4 1.2 5 0.8 0.2Kewat 0.6Koiri 5 2.1 5 1.5 10 1.7 1.1Kumhar 1 0.3 1 0.2 0.2Kurmi 3 1.3 1 0.3 4 0.7 0.9

50 Election in Nepal
GroupFPTP List PR
Total, incl. the 26 appointees
Census 2001
Number of MPs
In per cent
Number of MPs
In per cent
Number of MPs
In per cent
In per cent
Lodha 0.1Lohar 1 0.3 1 0.2 0.4Mali 0.1Mallah 0.5Marwari 1 0.4 9 2.7 11 1.8 0.2Nuniya 1 0.3 1 0.2 0.3Nurang 0.1Rajbhar 0.1Rajput 3 1.3 2 0.6 5 0.8 0.2Sonar 1 0.4 1 0.3 2 0.3 0.6Sudhi 3 1.3 3 0.9 6 1.0 0.4Teli 1 0.4 7 2.1 8 1.3 1.4Yadav 22 9.2 21 6.3 43 7.2 4.0
Madhesi Religious Minorities 6 2.5 9 2.7 16 2.7 4.3
Jain 0.0Muslim 6 2.5 9 2.7 16 2.7 4.3Punjabi/Sikh 0.0
Madhesi Dalits 1 0.4 15 4.5 16 2.7 4.2Bantar 3 0.9 3 0.5 0.2Chamar/Harijan/Ram
2 0.6 2 0.3 1.2
Chidimar 0.1Dhobi 1 0.3 1 0.2 0.3Dom 0.0Dusadh/Paswan/Pasi
1 0.4 8 2.4 9 1.5 0.7
Halkhor 0.0Khatwe 0.3Musahar 0.8Tatma 1 0.3 1 0.2 0.3
Tarai Janajatis 17 7.1 28 8.4 50 8.3 8.8Dhanuk 1 0.3 1 0.2 0.8Dhimal 1 0.4 1 0.3 2 0.3 0.1Gangai 1 0.4 1 0.2 0.1Jhangad (Dhagar/Jhagar)
2 0.6 2 0.3 0.2

Election in Nepal 51
GroupFPTP List PR
Total, incl. the 26 appointees
Census 2001
Number of MPs
In per cent
Number of MPs
In per cent
Number of MPs
In per cent
In per cent
Kisan 0.0Koche 0.0Meche 1 0.2 0.0Munda 0.0Pattharkatta/Kuswadiya
0.0
Rajbanshi 2 0.8 3 0.9 5 0.8 0.4Santhal/Satar 1 0.3 1 0.2 0.2Tajpuriya 1 0.2 0.1Tharu 13 5.4 20 6.0 36 6.0 6.8
Total 240 100.0 335 100.0 601 100.0 100.0
The comparison of the 2008 elections here is against the 2001 census because the 2011 census had not been published at the time of the analysis, but the assessment of excluded groups in Section 5 is done against the 2011 census only. New groups introduced in 2011 are not included in the figures of this appendix.
The total census figures for some broad groups such as Hill Jana-jatis do not add up to the figure given because there are contribu-tions from unspecified groups, see the comments under the tables in Appendix B.

52 Election in Nepal
Appendix F. The representation of groups in the Constituent Assembly of 2013.
GroupFPTP List PR
Total, incl.the 26 appointees
Census 2011
Number of MPs
In per cent
Number of MPs
In per cent
Number of MPs
In per cent
In per cent
Hill Castes 132 55.0 102 30.5 31.27
Brahmin - Hill 77 32.1 62 18.6 12.19
Chhetri 41 17.1 28 8.4 16.61
Sanyasi/Dasnami 3 1.3 4 1.2 0.86
Thakuri 11 4.6 8 2.4 1.61
Hill Dalits 1 0.4 26 7.8 8.60
Badi 0.15
Damai/Dholi 7 2.1 1.79
Gaine 0.03
Kami 1 0.4 15 4.5 4.75
Lohar (also Madhesi Caste)
0.10
Sarki 4 1.2 1.42
Hill and Mountain Janajatis
46 19.2 89 26.7 27.24
Bhote 0.07
Bote 0.04
Brahmu/Baramu 0.03
Byasi/Sauka 0.01
Chepang(Praja) 0.26
Chhantyal/Chhantel
1 0.4 0.04
Danuwar 0.32
Darai 1 0.3 0.06
Dura 0.02
Gharti /Bhujel 1 0.3 0.45
Gurung 7 2.9 10 3.0 2.06
Hayu 0.01
Hyolmo 0.04
* The appointments had not been completed at the time of writing this paper.
*

Election in Nepal 53
GroupFPTP List PR
Total, incl.the 26 appointees
Census 2011
Number of MPs
In per cent
Number of MPs
In per cent
Number of MPs
In per cent
In per cent
Jirel 0.02
Kumal 0.46
Kusunda 0.00
Lepcha 0.01
Limbu 8 3.3 7 2.1 1.46
Magar 5 2.1 17 5.1 7.13
Majhi 2 0.6 0.32
Newar 13 5.4 23 6.9 4.99
Pahari 1 0.3 0.05
Rai 4 1.7 9 2.7 2.62
Raji 0.02
Raute 0.00
Sherpa 2 0.8 1 0.3 0.45
Sunuwar 1 0.4 0.21
Tamang 4 1.7 12 3.6 5.82
Thakali 1 0.4 4 1.2 0.05
Thami 0.11
Walung 0.00
Yakkha 1 0.3 0.09
Madhesi Castes 34 14.2 61 18.2 14.96
Badhaee 0.11
Bangali 0.10
Baraee 0.30
Bin 1 0.4 1 0.3 0.28
Brahmin - Tarai 3 1.3 10 3.0 0.51
Dev 1 0.3 0.01
Dhunia 0.06
Gaderi/Bhedhar 0.10
Hajam/Thakur 1 0.3 0.44
Haluwai 0.32
Kahar 0.20

54 Election in Nepal
GroupFPTP List PR
Total, incl.the 26 appointees
Census 2011
Number of MPs
In per cent
Number of MPs
In per cent
Number of MPs
In per cent
In per cent
Kalwar 1 0.4 3 0.9 0.48Kamar 0.01Kanu 1 0.3 0.47Kathbaniyan 1 0.4 0.52Kayastha 2 0.8 4 1.2 0.17Kewat 1 0.4 0.58Koiri/Kushwaha 2 0.8 2 0.6 1.16Kori 0.05Kumhar 0.24Kurmi 0.0 3 0.9 0.87Lodh 0.12Lohar (also Hill Dalit)
1 0.3 0.29
Mali 1 0.3 0.06Mallaha 0.65Marwari 6 1.8 0.19Nuniya 0.27Nurang 0.00Rajbhar 0.04Rajdhob 0.05Rajput 2 0.8 2 0.6 0.16Sonar 0.24Sudhi 1 0.4 4 1.2 0.35Teli 3 1.3 6 1.8 1.40Yadav 16 6.7 13 3.9 3.98Unknown but included caste*
1 0.3
Unknown but excluded caste**
1 0.4 1 0.3
Madhesi Dalits 1 0.4 11 3.3 4.74
Bantar/Sardar 1 0.3 0.21
Chamar/Harijan/Ram
3 0.9 1.27
* One person within the Madhesi Castes has not been allocated to a census group, but is said to belong to an included caste.** Two persons within the Madhesi Castes have not been allocated to a census group, but are said to belong to excluded castes.

Election in Nepal 55
GroupFPTP List PR
Total, incl.the 26 appointees
Census 2011
Number of MPs
In per cent
Number of MPs
In per cent
Number of MPs
In per cent
In per cent
Chidimar 0.00
Dhandi 0.01
Dhankar/Dharikar
0.01
Dhobi 0.41
Dom 0.05
Dusadh/Paswan/Pasi
5 1.5 0.79
Halkhor 0.02
Kalar 0.00
Khatwe 1 0.4 0.38
Musahar 1 0.3 0.89
Natuwa 0.01
Sarbaria 0.02
Tatma/Tatwa 1 0.3 0.40
Tarai Janajatis 21 8.8 32 9.6 8.72
Amat 0.01
Dhanuk 2 0.8 3 0.9 0.83
Dhimal 0.10
Gangai 0.14
Jhangad (Dhagar/Jhagar)
0.14
Khawas 0.07
Kisan 0.01
Koche 0.01
Meche 0.02
Munda 0.01
Pattharkatta/Kuswadiya
0.01
Rajbanshi 4 1.2 0.44
Santhal/Satar 1 0.3 0.20
Tajpuriya 0.07

56 Election in Nepal
GroupFPTP List PR
Total, incl.the 26 appointees
Census 2011
Number of MPs
In per cent
Number of MPs
In per cent
Number of MPs
In per cent
In per cent
Tharu 19 7.9 23 6.9 6.56
Unknown but excluded*
1 0.3
Religious Groups 5 2.1 14 4.2 4.48
Muslim 5 2.1 14 4.2 4.40
Punjabi/Sikh 0.03
Total 240 100.0 335 100.0 100.00
* One person within the Tarai Janajati has not been allocated to a census group, but belongs to the small, excluded Tarai Janajati group, Aghori.
The total census figures for some broad groups such as Hill Janajatis do not add up to the figure given because there are contributions from unspecified groups, see the comments under the tables in Appendix C. Please note that the number of groups is lower than 125 because the sub-groups such as Sherpa, Rai, etc, have been merged into the main group of Sherpa, Rai, etc (see Appendix A).


Kåre Vollan is Director and owner of the company Quality AS, Oslo, Norway. He has been working on elections in more than 30 countries and territories, including Nepal, Zimbabwe, Kenya, Iraq, Palestine, Sudan, Armenia, and Bosnia and Herzegovina. Since 2006, he has been advising the Election Commission and politicians in Nepal, in particular on the system of representation, including group representation. Between 1996 and 2009, he headed 12 international election observation missions or teams. Since 2003 he has also drafted opinions on election laws for the Council of Europe Venice Commission. Vollan has been teaching and supervising students on elections and power-sharing and has published a number of articles and reports on electoral and decision-making issues, related in particular to post-conflict situations.

9 789937 290579


![0&12+343$(&5'6&)34+7443(8&$9&',9&3(97-&'()&$7-97-& - Input and Output... · 5"-=4&)34+744&*.'-&"#","(-4&3(43)"&-."&',9#3p"2&'+-7'##@&+'74"&-."&3(97-&'()&$7-97-& #3,3-':$(4;&&& & v(&-."&#"\&@$7&+'(&4""&'&-@93+'#&s]vt&3(97-&4-'8";&&c4&-."&+$,,$(&,$)"&3(97-&](https://static.documents.pub/doc/80x56/5b2221987f8b9af0388b46e8/01234356347443899397-7-97-input-and-output-5-434744-4343-93p2-774-397-7-97-.jpg)


