12
9.7 Graphs of Quadratic Inequalities p. 548
| Date post: | 17-Dec-2015 |
| Category: |
Documents |
| Upload: | sybil-nelson |
| View: | 219 times |
| Download: | 1 times |
9.7 Graphs of Quadratic Inequalities
p. 548

Forms of Quadratic InequalitiesForms of Quadratic Inequalitiesy<ax2+bx+c y>ax2+bx+cy≤ax2+bx+c y≥ax2+bx+c
• Graphs will look like a parabola with a solid or dotted line and a shaded section.
• The graph could be shaded inside the parabola or outside.
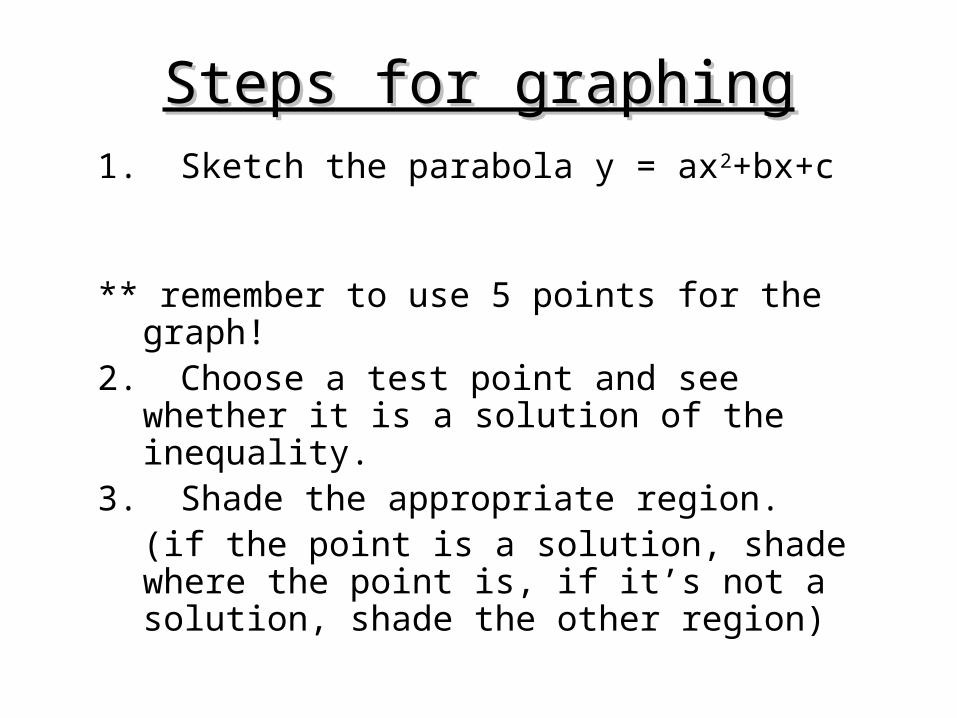
Steps for graphingSteps for graphing1. Sketch the parabola y = ax2+bx+c(dotted line for < or >, solid line for ≤ or ≥)** remember to use 5 points for the graph!2. Choose a test point and see whether it is a
solution of the inequality.3. Shade the appropriate region.
(if the point is a solution, shade where the point is, if it’s not a solution, shade the other region)

Steps for Graphing (quickly)Steps for Graphing (quickly)1. Complete the data table to get all 5 points2. Graph the vertex3. Graph all other 4 points4. For < or > use DASHED for ≤ or ≥ use SOLID
line5. Shade the appropriate region (“greater than”
shade above the vertex, “less than” shade below the vertex)

Shade above y Shade below y
Shading
Shade above y Shade below y

Example:Graph y ≤ x2+6x- 4
3)1(2
6
2
a
bx
* Vertex: (-3,-13)
* Opens up, solid line
134189
4)3(6)3( 2
y 9- 5-
12- 4-
13- 3-
12- 2-
9- 1-
yx
•Test Point: (0,0)
0≤02+6(0)-4
0≤-4 So, shade where the point is NOT!
Test point

Graph: y>-x2+4x-3
* Opens down, dotted line.* Vertex: (2,1)
2)1(2
4
2
a
bx
1384
3)2(4)2(1 2
y
y
* Test point (0,0)
0>-02+4(0)-3
0>-3
x y
0 -3
1 0
2 1
3 0
4 -3
Test Point

Graph: y ≤ x2 + 6x – 4* Vertex: (-3,-13)
* Solid Line
* Less than means shade BELOW
x = -5, -4, -3, -2, -1

Graph: y > -x2 + 4x – 3* Vertex: (2, 1)
* Dashed Line
* Greater than means shade ABOVE
x = 0, 1, 2, 3, 4

Graph: y ≥ x2 – 8x + 12* Vertex: (4, -4)
* Solid Line
* Greater than means shade ABOVE
x = 2, 3, 4, 5, 6

Graph: y > -x2 + 4x + 5* Vertex: (2, 9)
* Dashed Line
* Greater than means shade ABOVE
x = 0, 1, 2, 3, 4

Assignment


