980 IEEE JOURNAL OF MICROELECTROMECHANICAL SYSTEMS, VOL. 23, NO. 4, AUGUST 2014
iGC1: An Integrated Fluidic System for GasChromatography Including Knudsen Pump,
Preconcentrator, Column, and DetectorMicrofabricated by a Three-Mask Process
Yutao Qin and Yogesh B. Gianchandani, Fellow, IEEE
Abstract— This paper reports an integrated microscale gaschromatography (µGC) system, the iGC1, which contains fourcomponents: 1) a Knudsen pump (KP); 2) a preconcentrator-focuser (PCF); 3) a separation column; and 4) a gas detector.All four components are fabricated from glass wafers using athree-mask process with minimal postprocessing. In a stackablearchitecture, the components are finally assembled into a 4-cm3
system. The stacked iGC1 system demonstrates the successfulseparation and detection of an alkane mixture in the range ofC5–C8 in less than 60 s. [2013-0230]
Index Terms— Nanoporous, thermal transpiration, microdis-charge, emission spectrum, gas sensors.
I. INTRODUCTION
AGAS CHROMATOGRAPH (GC) is an instrument usedto spatiotemporally separate and detect vapors by passing
sample plugs through a channel (i.e., the column) coatedwith a functional material (i.e., the stationary phase). Theconstituents can be identified by the time taken to elute fromthe column and quantified by the strength of the signal from adetector located downstream of the column. In general, manyother components are also integral to the operation, such asthe preconcentrator that provides sample injection, and thepump that generates the flow. In some systems valves areused to control the timing and direction of the flow. Theseparation of complex mixtures is sometimes performed usingcomprehensive two-dimensional GC (2DGC or GC × GC).
Since the widespread adoption of the GC by the petroleumindustry in the 1950s, its use has been extended to a number ofother fields. For example, it is used to examine pollutants, suchas polycyclic aromatic hydrocarbons, pesticides, halogenatedcompounds, etc. [1]. Another application is food analysis:coupled with the solid-phase microextraction technique, it isused for the identification and quantification of lipids, drugs,
Manuscript received July 20, 2013; revised October 19, 2013; acceptedJanuary 29, 2014. Date of publication March 4, 2014; date of currentversion July 29, 2014. This work was supported in part by the MicrosystemsTechnology Office, Defense Advanced Research Projects Agency High-Vacuum Program, under Contract W31P4Q-09-1-0011, and in part by theLurie Nanofabrication Facility through the Solid-State Electronics Laboratoryand the University of Michigan, Ann Arbor, MI, USA. Subject Editor C. Ahn.
The authors are with the Center for Wireless Integrated MicroSensingand Systems, University of Michigan, Ann Arbor, MI 48109 USA (e-mail:[email protected]; [email protected]).
Color versions of one or more of the figures in this paper are availableonline at http://ieeexplore.ieee.org.
Digital Object Identifier 10.1109/JMEMS.2014.2306652
pesticides and carbohydrates [2]. In recent years biomedicalscreening has also been performed by this instrument.The analysis of human exhaled biomarkers by the GC providesa non-invasive approach for diagnosis and monitoring ofpotential diseases. Examples of such biomarkers include nitricoxide related to pulmonary inflammation, and ethane andpentane related to lipid peroxidation [3].
The miniaturization of the GC has been an ongoing effortfor over 30 years, with early work dating back to 1979, whenTerry et al. reported a silicon micromachined GC system[4]. As the core component of a micro gas chromatogra-phy (μGC) system, the separation column has been widelyinvestigated and various column structures have been reported,such as the nickel column [5], the silicon-glass column [6],the ParyleneTM column [7] and the plasma-enhanced chem-ical vapor deposition (PECVD) oxynitride column [8]. Thestationary phase coating methods for these columns includethe static coating method [9] as well as the dynamic coatingmethod [10]. A self-assembly process has also been reported[11]. The gas injection device for a μGC system can bemainly classified into two categories: the preconcentratorand the valve injector. The preconcentrator uses sorbents tocollect analytes at low temperatures and inject a plug witha thermal pulse [12]–[14]. Certain preconcentrators collectanalytes without the need for gas flow [15]. Conversely, thevalve injector utilizes valves to sample and inject a plugof gas [16]. A variety of gas detectors have been reported,including the chemiresistor [17], the chemicapacitor [18], thethermal conductivity detector [19], the Fabry-Pérot detec-tor [20], and the discharge-based detector [21], [22]. A micro-fabricated thermal modulator has been reported [23] and itsapplication in a GC × GC has also been reported [24].
The integration of the microfabricated components intoa μGC system has also made remarkable progress. TheμChemLab [25] is a hand-held μGC system reported byLewis et al. that consists of a preconcentrator, a column, andsurface acoustic wave sensors. Researchers at the Universityof Michigan have reported several prototypes of μGC over thepast decade, including the Intrepid [26], the Spiron [27] andthe palm-size Mercury system [28].
Most μGC research efforts have not incorporated the useof micropumps. Only two cases have been reported: onewith a microfabricated, electrostatically-actuated peristaltic
QIN AND GIANCHANDANI: INTEGRATED FLUIDIC SYSTEM FOR GAS CHROMATOGRAPHY 981
pump [29], and another with an array of motionless Knudsenpumps [30]. The former required high frequency, largeamplitude, drive voltages, but was power-efficient. The latterwas not power-efficient, but required only a low-voltage DCsource; it provided high reliability, with continuous operationfor over 6000 hours [31].
Many micropump-operated μGC systems reported to datehave used components fabricated by disparate microfabricationprocesses. Some systems connect the components by tubing(e.g., [26]–[30]), whereas some use manifolds for fluidicinterconnect (e.g., [32]–[35]). The benefit of this approachis that each component can be optimally designed andfabricated. Unfortunately, the increased complexity and costof the fabrication of the whole system pose a challenge forintegration. As in other fluidic systems, a stackable archi-tecture (e.g., [36]) or a monolithic integration scheme(e.g., [37]) can alleviate this problem. Additionally, using asimple and easily available microfabrication process for all ofthe components would greatly benefit the manufacturabilityand integration of the system.
This paper reports the use of a simple 3-mask fabricationprocess for simultaneously manufacturing a preconcentra-tor, a separation column, a discharge-based detector, and aKnudsen pump. Design innovations at the device level areused to accommodate this facile process, followed by systemassembly.1 A stackable architecture is used for the systemintegration scheme, eliminating the use of tubing for gas flowinterconnects and providing a path for further miniaturization.
As opposed to the pump array [30] that included six KPsfabricated by drill machining, the iGC1 system uses a singleKP that is for the first time designed for integration withina μGC and micromachined lithographically. It also providesat least an order of magnitude improvement in footprint andpower.
The design and modeling of the iGC1 system are describedin Section II, the fabrication process is described in Section III,experimental results are presented in Section IV, followed bythe discussion and conclusions in Section V.
II. DESIGN AND MODELING
A. Knudsen Pump
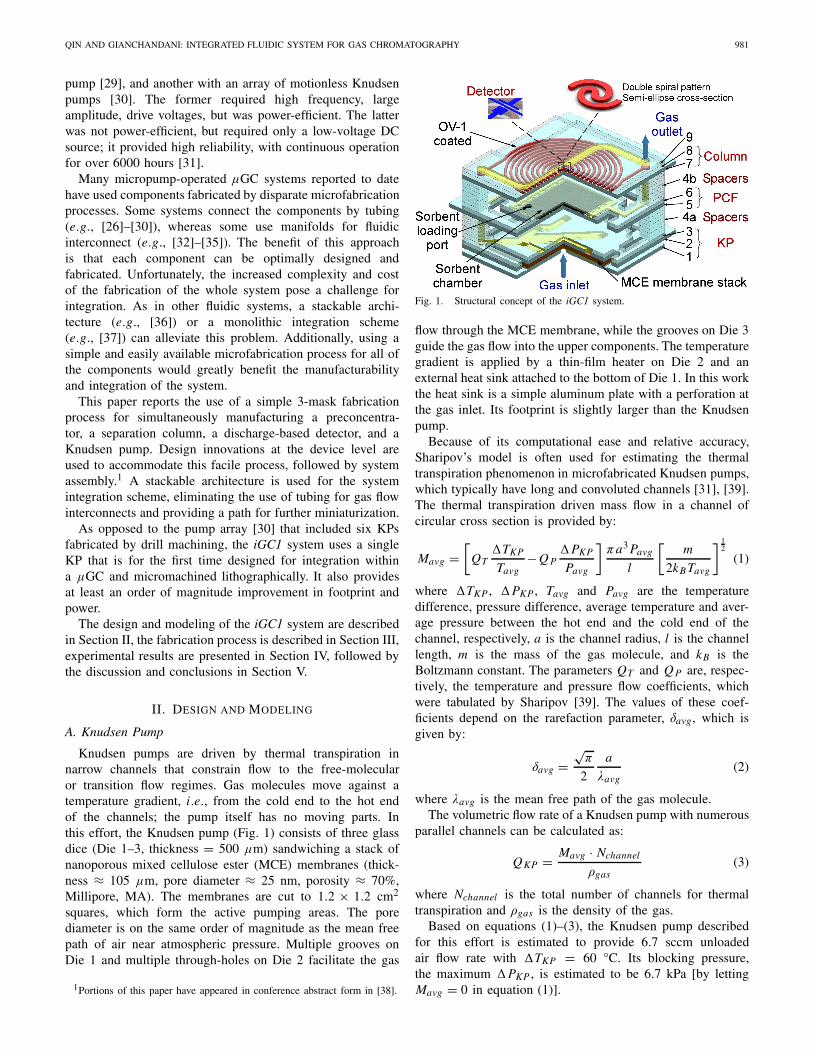
Knudsen pumps are driven by thermal transpiration innarrow channels that constrain flow to the free-molecularor transition flow regimes. Gas molecules move against atemperature gradient, i.e., from the cold end to the hot endof the channels; the pump itself has no moving parts. Inthis effort, the Knudsen pump (Fig. 1) consists of three glassdice (Die 1–3, thickness = 500 μm) sandwiching a stack ofnanoporous mixed cellulose ester (MCE) membranes (thick-ness ≈ 105 μm, pore diameter ≈ 25 nm, porosity ≈ 70%,Millipore, MA). The membranes are cut to 1.2 × 1.2 cm2
squares, which form the active pumping areas. The porediameter is on the same order of magnitude as the mean freepath of air near atmospheric pressure. Multiple grooves onDie 1 and multiple through-holes on Die 2 facilitate the gas
1Portions of this paper have appeared in conference abstract form in [38].
Fig. 1. Structural concept of the iGC1 system.
flow through the MCE membrane, while the grooves on Die 3guide the gas flow into the upper components. The temperaturegradient is applied by a thin-film heater on Die 2 and anexternal heat sink attached to the bottom of Die 1. In this workthe heat sink is a simple aluminum plate with a perforation atthe gas inlet. Its footprint is slightly larger than the Knudsenpump.
Because of its computational ease and relative accuracy,Sharipov’s model is often used for estimating the thermaltranspiration phenomenon in microfabricated Knudsen pumps,which typically have long and convoluted channels [31], [39].The thermal transpiration driven mass flow in a channel ofcircular cross section is provided by:
Mavg =[
QT�TKP
Tavg−Q P
�PKP
Pavg
]πa3 Pavg
l
[m
2kB Tavg
] 12
(1)
where �TKP , �PKP , Tavg and Pavg are the temperaturedifference, pressure difference, average temperature and aver-age pressure between the hot end and the cold end of thechannel, respectively, a is the channel radius, l is the channellength, m is the mass of the gas molecule, and kB is theBoltzmann constant. The parameters QT and Q P are, respec-tively, the temperature and pressure flow coefficients, whichwere tabulated by Sharipov [39]. The values of these coef-ficients depend on the rarefaction parameter, δavg, which isgiven by:
δavg =√
π
2
a
λavg(2)
where λavg is the mean free path of the gas molecule.The volumetric flow rate of a Knudsen pump with numerous
parallel channels can be calculated as:
QKP = Mavg · Nchannel
ρgas(3)
where Nchannel is the total number of channels for thermaltranspiration and ρgas is the density of the gas.
Based on equations (1)–(3), the Knudsen pump describedfor this effort is estimated to provide 6.7 sccm unloadedair flow rate with �TKP = 60 °C. Its blocking pressure,the maximum �PKP , is estimated to be 6.7 kPa [by lettingMavg = 0 in equation (1)].
982 IEEE JOURNAL OF MICROELECTROMECHANICAL SYSTEMS, VOL. 23, NO. 4, AUGUST 2014
B. Preconcentrator
The preconcentrator adsorbs the analyte molecules ontoa porous surface at room temperature. To initiate analysis,sample is desorbed with a thermal pulse and injected into thefluidic path. This work utilizes a single bed preconcentrator,designed as an 11 mm3 chamber formed by Die 5 andDie 6 (Fig. 1). Granules of CarbographTM 2 (Grace DavisonDiscovery Sciences, IL), a graphitized carbon with a surfacearea of 10 m2/g, are packed in the chamber as the sorbentmaterial. In addition to the gas inlet and outlet features, thepreconcentrator contains a sorbent loading port from whichthe sorbent granules can be loaded. The arrays of pillars aredesigned to confine the sorbent granules in the chamber.
The theoretical modeling of the sorbent-packed preconcen-trators is often described using the Wheeler-Jonas model [40].The breakthrough time tb (min.) is a metric for characterizingthe adsorption capability. Specifically, it is the time requiredfor vapor that enters the preconcentrator to saturate and reacha certain concentration at outlet (expressed as a fraction ofthat at inlet):
tb = We
Q · cin
[W − Q · ρb
kvln
(cin
cout
)](4)
where We is the adsorption capacity that can be theoreticallyderived [40], W is the total sorbent mass (g), Q is thevolumetric flow rate (cm3/min.), cin is the inlet chemical con-centration (g/cm3), ρb is the bulk density of the packed sorbent(g/cm3), kv is the overall mass transfer coefficient (min.−1)that can be estimated from semi-empirical equations [41], andcout is the outlet chemical concentration chosen to denotebreakthrough (g/cm3).
The preconcentrator is designed to have the largest achiev-able sorbent chamber without compromising the thermalisolation and form factor of the system (Fig. 1). As describedin Section IV, tb is experimentally measured by settingcin = 80 ppm (determined by mole fraction of the samplevapor in the carrier gas used in this effort) and Q = 1 sccm,while using a breakthrough criterion cout/cin = 10%.
C. Column
The column separates analyte species as they pass along,based on the partition that each analyte establishes betweenthe mobile phase (carrier gas) and the stationary phase. In thiseffort, the column is designed as a channel (length ≈ 25 cm)laid out in a double-spiral pattern and formed by thebonding of Die 7 and Die 8 (Fig. 1). The manufactur-ing process creates an approximately semi-elliptical crosssection (width ≈ 300 μm, depth ≈ 200 μm), which has ahydraulic diameter ≈ 230 μm (defined as 4 × area/perimeter).A ≈0.2 μm thick non-polar polydimethylsiloxane (OV-1, OhioValley Specialty, OH) layer is coated on the inner walls as thestationary phase.
The separation efficiency of a chromatography column canbe evaluated from experimentally obtained chromatograms.Higher separation efficiency is denoted by higher number ofplates, N , as well as smaller dimension of a theoretical plate,termed the “height equivalent to a theoretical plate (HETP).”
The HETP can be theoretically estimated from the structuraldimensions and physical properties of the column, althoughthese are not always well known [42]. The HETP of thecolumn can be calculated accordingly, which facilitates theevaluation and comparison of columns with various lengths.
N = 5.54
(tR
W1/2
)2
(5)
HETP = lcolumn
N(6)
where tR is the retention time, W1/2 is the width of theretention peak measured at half height, and lcolumn is thelength of the separation column. For this work, lcolumn is≈ 25 cm. The experimentally-determined values of tR andW1/2 are described in Section IV, along with the resultingHETP.
D. Detector
The discharge-based gas detector uses two metal electrodesto create localized microdischarges, which generate opticalspectra indicating the presence of carbon atoms. AlthoughRF-powered microdischarges and DC microdischarges areoptions as summarized in [43], pulsed DC microdischargesare used because they consume low power, require a simpleinterface circuit, and offer an extended lifetime [43], [44].As shown in Fig. 1, the electrodes for creating microdis-charges, spaced 50 μm apart, are located on Die 8, whilethe groove structure of Die 9 guides the gas to pass overthe detector. The optical signal is detected by a hand-heldspectrometer (Model # USB 2000, Ocean Optics, FL), whichis controlled by a laptop computer.
E. Stacked iGC1 Assembly
The four components are arranged in a stack, forminga serially connected gas flow path (Fig. 1). Driven by theKnudsen pump located upstream, the preconcentrator accu-mulates analytes and desorbs them along the same gas flowdirection. The desorbed gas analytes pass through the columnwith characteristic retention times that are temporally resolvedby the detector. Thermal crosstalk between the pump, precon-centrator, and separation column is inhibited by glass spacers(Dice 4a and Dice 4b) and the cut-outs (voids) in each layer.Depending on the system requirements, more spacers can beadded to the system to achieve superior thermal isolation.
F. Thermal Modeling of the Stacked iGC1 Assembly
The thermal behavior of the stacked iGC1 assembly wasmodeled using finite element analysis (FEA) in COMSOLMultiphysics 4.2. The simulations were directed at modelingthe temperature distributions of the system while theKnudsen pump or the preconcentrator is heated. In bothcases, the simulated structure included 7 spacers both betweenthe preconcentrator and the column as well as between thepreconcentrator and the Knudsen pump, mimicking the actualsystem used for experimental tests. The thermal conductanceof the MCE membrane stack in the Knudsen pump was derivedfrom an experimentally fitted equivalent value. The bottom of
QIN AND GIANCHANDANI: INTEGRATED FLUIDIC SYSTEM FOR GAS CHROMATOGRAPHY 983
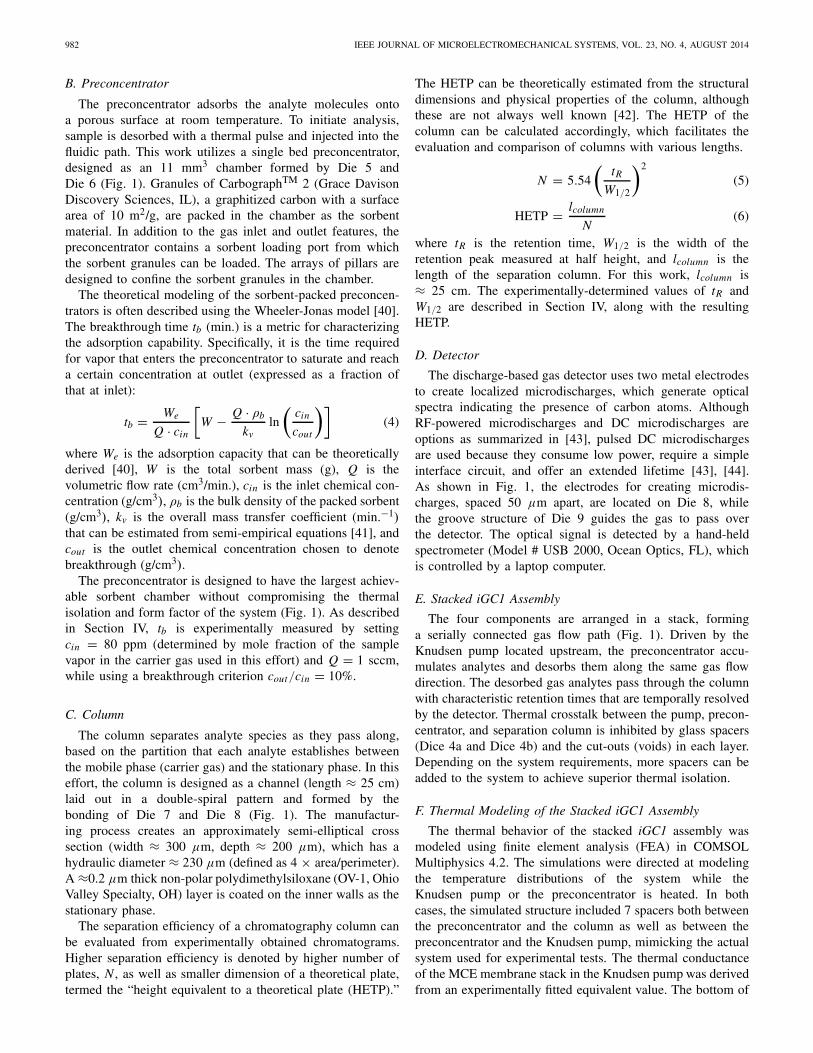
Fig. 2. The FEA simulation result of the thermal response of the iGC1system. (a) The temperature profile of the system after heating the precon-centrator with 12 W for 2 sec. (b) The transient thermal response of thesystem during a thermal cycle of the preconcentrator. (c) The temperatureprofile of the system after heating the Knudsen pump with 1 W for 700 sec.(d) The transient thermal response of the system during a thermal cycle ofthe Knudsen pump.
the Knudsen pump was assumed to be maintained at roomtemperature by an ideal heat sink. The system was surroundedby an air box with natural convective heat transfer to theambient.
In the case where the preconcentrator is heated, it issubject to a thermal pulse (12 W, 2 sec.) and reaches 170 °C[Fig. 2(a) and (b)]. Because of the thermal isolation offered bythe spacers and the pulsed nature of the heating, the columnand the Knudsen pump are only minimally affected.
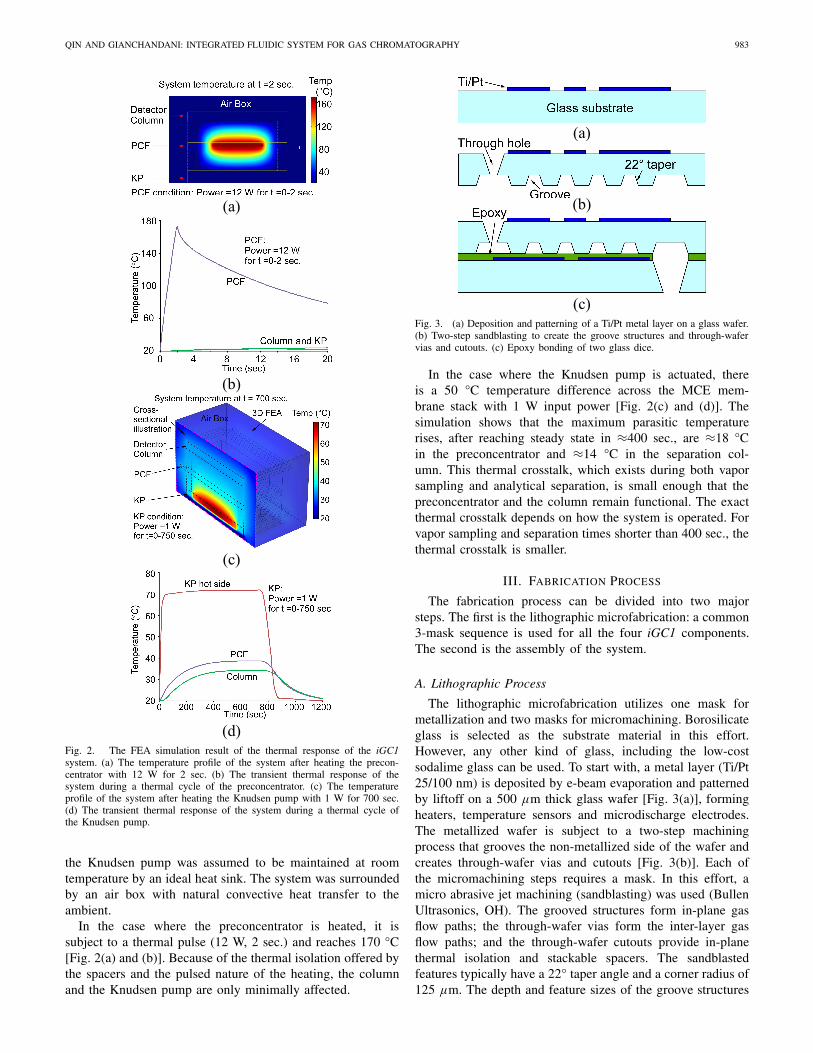
Fig. 3. (a) Deposition and patterning of a Ti/Pt metal layer on a glass wafer.(b) Two-step sandblasting to create the groove structures and through-wafervias and cutouts. (c) Epoxy bonding of two glass dice.
In the case where the Knudsen pump is actuated, thereis a 50 °C temperature difference across the MCE mem-brane stack with 1 W input power [Fig. 2(c) and (d)]. Thesimulation shows that the maximum parasitic temperaturerises, after reaching steady state in ≈400 sec., are ≈18 °Cin the preconcentrator and ≈14 °C in the separation col-umn. This thermal crosstalk, which exists during both vaporsampling and analytical separation, is small enough that thepreconcentrator and the column remain functional. The exactthermal crosstalk depends on how the system is operated. Forvapor sampling and separation times shorter than 400 sec., thethermal crosstalk is smaller.
III. FABRICATION PROCESS
The fabrication process can be divided into two majorsteps. The first is the lithographic microfabrication: a common3-mask sequence is used for all the four iGC1 components.The second is the assembly of the system.
A. Lithographic Process
The lithographic microfabrication utilizes one mask formetallization and two masks for micromachining. Borosilicateglass is selected as the substrate material in this effort.However, any other kind of glass, including the low-costsodalime glass can be used. To start with, a metal layer (Ti/Pt25/100 nm) is deposited by e-beam evaporation and patternedby liftoff on a 500 μm thick glass wafer [Fig. 3(a)], formingheaters, temperature sensors and microdischarge electrodes.The metallized wafer is subject to a two-step machiningprocess that grooves the non-metallized side of the wafer andcreates through-wafer vias and cutouts [Fig. 3(b)]. Each ofthe micromachining steps requires a mask. In this effort, amicro abrasive jet machining (sandblasting) was used (BullenUltrasonics, OH). The grooved structures form in-plane gasflow paths; the through-wafer vias form the inter-layer gasflow paths; and the through-wafer cutouts provide in-planethermal isolation and stackable spacers. The sandblastedfeatures typically have a 22° taper angle and a corner radius of125 μm. The depth and feature sizes of the groove structures
984 IEEE JOURNAL OF MICROELECTROMECHANICAL SYSTEMS, VOL. 23, NO. 4, AUGUST 2014
Fig. 4. The illustrated cross section of the iGC1 system after the finalstacking.
are in the range of 150–300 μm. In addition to sandblasting,many other approaches are available for micromachining glasswafers, such as plasma etching, wet etching and ultrasonicmachining.
B. Assembly Process
If each component is fabricated on a separate wafer, systemassembly can be performed at the wafer level. In this work,however, all the components are on the same wafer, so the diceare singulated prior to assembly. Each of the components isthen epoxy bonded to its upper layer [Fig. 3(c)] before beingadded to the system stack (Fig. 4).
The Knudsen pump is assembled into a glass-MCE-glassstack. Die 2 and Die 3 are first bonded by a low-viscosityepoxy Epotek 377 (Epoxy Technology, MA), which is appliedfrom the perimeter of the dice that are arranged in a stack,and drawn into the seams between the mating surfaces bycapillary force. Curing at 150 °C forms a leak free bondbetween the two glass dice. Next, Die 2, Die 3, four MCEmembranes, and Die 1 are stacked (in order from top to bottomas stated). Finally, a viscous epoxy Stycast2850FT (Henkel,Düsseldorf, Germany) is applied around the edge of the MCEmembrane stack to achieve a hermetic seal, which is crucialto the operation of the Knudsen pump.
The preconcentrator is assembled by epoxy bonding andsorbent packing. Die 5 and Die 6 are bonded by Epotek 377.Next, sorbent granules are packed into the preconcentratorusing a similar method to that described in [15]. Moderatevacuum from the inlet/outlet is used to draw the Carbograph2 granules from the loading port into the preconcentrator. Thepillar structures in the preconcentrator act as sieves to containlarger particles while letting smaller particles to pass throughand exit the preconcentrator. After sorbent loading, the loadingport is sealed with either thermal tape or epoxy.
The separation column is assembled by a coated layer ofSU-8 5 (MicroChem, MA). Omnicoat (MicroChem, MA) isspin-coated and baked as the adhesion promoter, followed bya layer (less than 10 μm) of SU-8 spin-coated on the matingsurfaces – specifically, the metallized side of Die 7 and thegrooved side of Die 8. The grooved die (Die 8) is softbaked at150 °C in order to prevent the potential problem of fluid SU-8filling and blocking the channel. Then the dice are aligned andstacked, followed by a second softbake at 95 °C, which drivesthe fluid SU-8 to gradually fill the gaps and voids betweenthe mating surfaces, providing a leak free bond. The device isexposed to ultraviolet (UV) radiation and hardbaked at 150 °Cto cure the SU-8 and minimize outgassing. The spin-coatingprocess described above fully covers the inner walls of theseparation column with SU-8, providing two potential benefitsfor obtaining a more uniform coating of stationary phase. First,the inner surface of the column is a homogeneous material thatprovides uniform adhesion strength to the stationary phase.Second, any surface roughness on the grooves that may resultfrom the sandblasting is smoothened by the SU-8 layer.
The SU-8 bonded column is then coated with a ≈0.2 μmthick layer of OV-1 stationary phase using a conventionalstatic coating method [9]. In this process, a solution ofOV-1 is prepared by dissolving OV-1 and its cross-linkingagent dicumyl peroxide in pentane and filled into the column.With one end of the column sealed, pentane is evaporatedfrom the other end of the column by vacuum, leaving OV-1coated on the inner walls of the column. After that, the columnis heated at 150 °C overnight to fully remove the solvent aswell as to perform cross-linking. This coating process can beassisted by capillary tubes temporarily attached to both endsof the column using the epoxy Stycast2850FT; the capillaryconnections can be easily detached by localized heat after thecoating process.
The detector is assembled by bonding Die 9 to Die 8 withEpotek 377 using the process as described for assembling theKnudsen pump.
The overall system is finally integrated by the assembly ofall four components together with a number of spacers (Fig. 4),which are micromachined by sandblasting on the same glasswafer as the other dice. The spacers can be permanentlybonded to the iGC1 components using Epotek 377. However,a removable bonding layer between the components is alsofavored to allow reconfigurability. With low melting points andeasy solubility in common solvents, various kinds of mountingwax have been widely used as temporary adhesives in theindustry. The mounting wax QuickStickTM 135 (ElectronMicroscopy Sciences, PA) is used in this effort to provide theremovable bonding layers. When assembling the system, thecomponents are placed on a hot plate at 150 °C. The mountingwax is melted by the elevated temperature and applied to themating surfaces. The components are then pressed together,allowing the mounting wax to form a leak free bond. Thethermal operation of the iGC1 system does not damage thisbond as long as no strong shear force is applied. Whenit is necessary to reconfigure the iGC1 system, the stackcan be heated on a hot plate and the bond can be easilydetached.
QIN AND GIANCHANDANI: INTEGRATED FLUIDIC SYSTEM FOR GAS CHROMATOGRAPHY 985
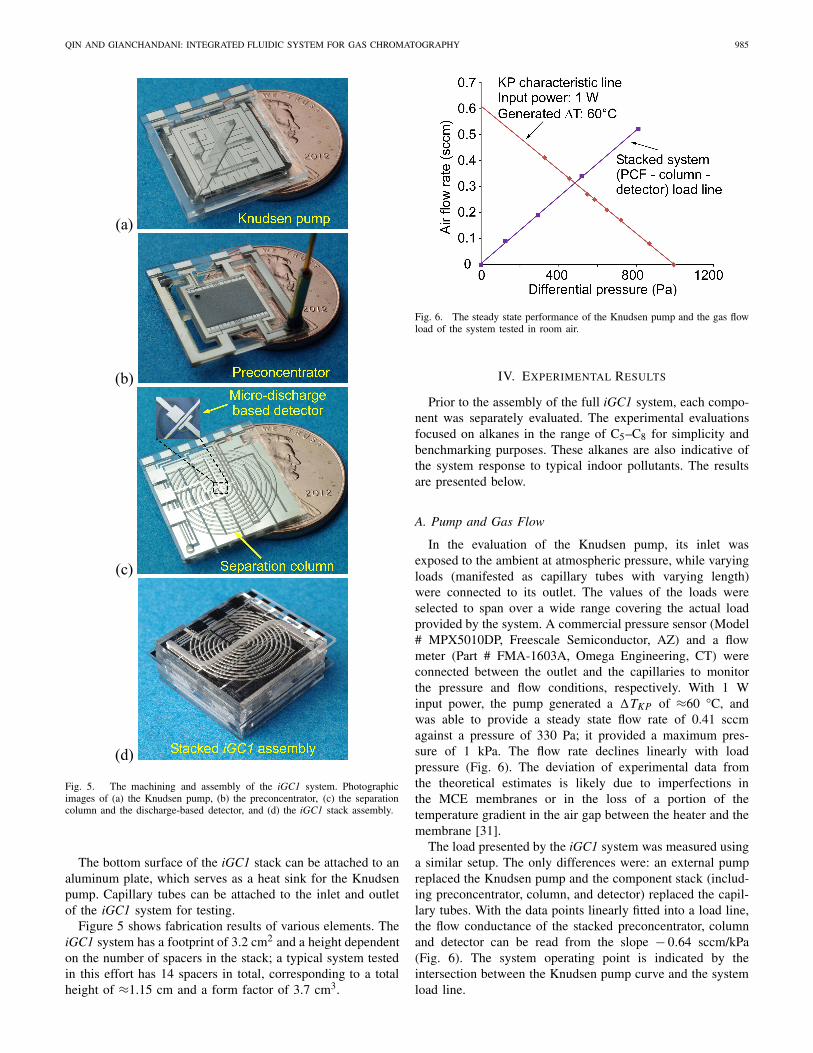
Fig. 5. The machining and assembly of the iGC1 system. Photographicimages of (a) the Knudsen pump, (b) the preconcentrator, (c) the separationcolumn and the discharge-based detector, and (d) the iGC1 stack assembly.
The bottom surface of the iGC1 stack can be attached to analuminum plate, which serves as a heat sink for the Knudsenpump. Capillary tubes can be attached to the inlet and outletof the iGC1 system for testing.
Figure 5 shows fabrication results of various elements. TheiGC1 system has a footprint of 3.2 cm2 and a height dependenton the number of spacers in the stack; a typical system testedin this effort has 14 spacers in total, corresponding to a totalheight of ≈1.15 cm and a form factor of 3.7 cm3.
Fig. 6. The steady state performance of the Knudsen pump and the gas flowload of the system tested in room air.
IV. EXPERIMENTAL RESULTS
Prior to the assembly of the full iGC1 system, each compo-nent was separately evaluated. The experimental evaluationsfocused on alkanes in the range of C5–C8 for simplicity andbenchmarking purposes. These alkanes are also indicative ofthe system response to typical indoor pollutants. The resultsare presented below.
A. Pump and Gas Flow
In the evaluation of the Knudsen pump, its inlet wasexposed to the ambient at atmospheric pressure, while varyingloads (manifested as capillary tubes with varying length)were connected to its outlet. The values of the loads wereselected to span over a wide range covering the actual loadprovided by the system. A commercial pressure sensor (Model# MPX5010DP, Freescale Semiconductor, AZ) and a flowmeter (Part # FMA-1603A, Omega Engineering, CT) wereconnected between the outlet and the capillaries to monitorthe pressure and flow conditions, respectively. With 1 Winput power, the pump generated a �TKP of ≈60 °C, andwas able to provide a steady state flow rate of 0.41 sccmagainst a pressure of 330 Pa; it provided a maximum pres-sure of 1 kPa. The flow rate declines linearly with loadpressure (Fig. 6). The deviation of experimental data fromthe theoretical estimates is likely due to imperfections inthe MCE membranes or in the loss of a portion of thetemperature gradient in the air gap between the heater and themembrane [31].
The load presented by the iGC1 system was measured usinga similar setup. The only differences were: an external pumpreplaced the Knudsen pump and the component stack (includ-ing preconcentrator, column, and detector) replaced the capil-lary tubes. With the data points linearly fitted into a load line,the flow conductance of the stacked preconcentrator, columnand detector can be read from the slope − 0.64 sccm/kPa(Fig. 6). The system operating point is indicated by theintersection between the Knudsen pump curve and the systemload line.
986 IEEE JOURNAL OF MICROELECTROMECHANICAL SYSTEMS, VOL. 23, NO. 4, AUGUST 2014
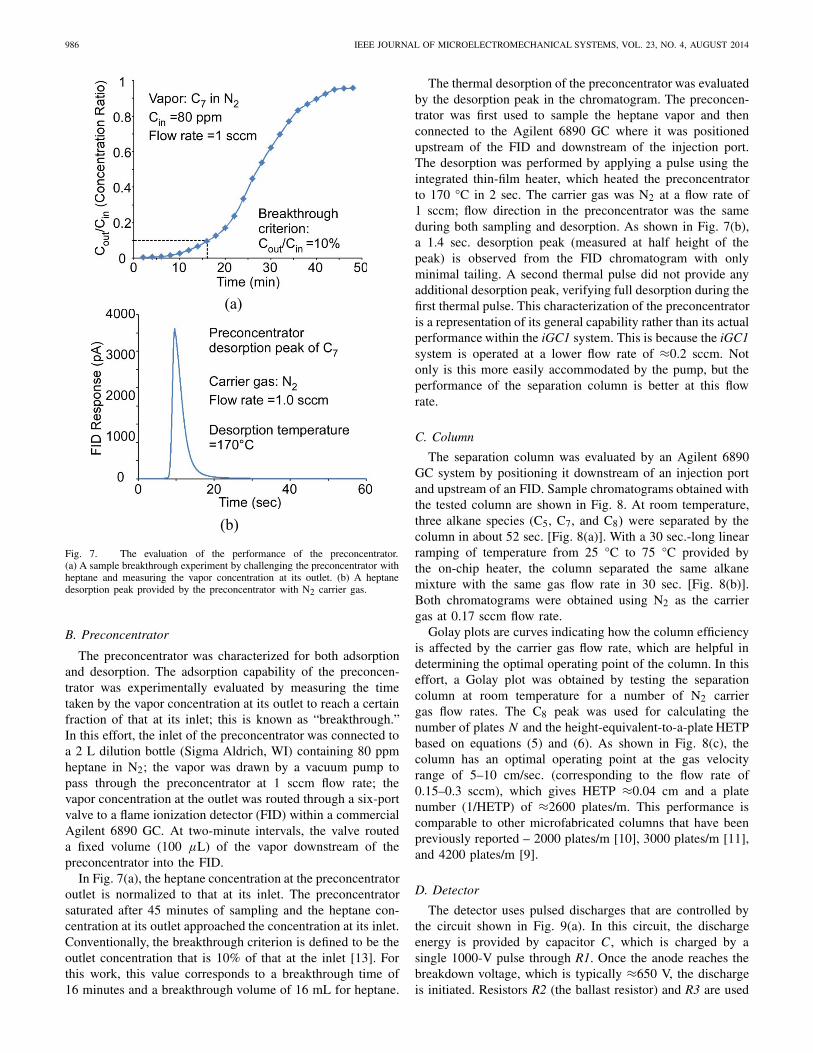
Fig. 7. The evaluation of the performance of the preconcentrator.(a) A sample breakthrough experiment by challenging the preconcentrator withheptane and measuring the vapor concentration at its outlet. (b) A heptanedesorption peak provided by the preconcentrator with N2 carrier gas.
B. Preconcentrator
The preconcentrator was characterized for both adsorptionand desorption. The adsorption capability of the preconcen-trator was experimentally evaluated by measuring the timetaken by the vapor concentration at its outlet to reach a certainfraction of that at its inlet; this is known as “breakthrough.”In this effort, the inlet of the preconcentrator was connected toa 2 L dilution bottle (Sigma Aldrich, WI) containing 80 ppmheptane in N2; the vapor was drawn by a vacuum pump topass through the preconcentrator at 1 sccm flow rate; thevapor concentration at the outlet was routed through a six-portvalve to a flame ionization detector (FID) within a commercialAgilent 6890 GC. At two-minute intervals, the valve routeda fixed volume (100 μL) of the vapor downstream of thepreconcentrator into the FID.
In Fig. 7(a), the heptane concentration at the preconcentratoroutlet is normalized to that at its inlet. The preconcentratorsaturated after 45 minutes of sampling and the heptane con-centration at its outlet approached the concentration at its inlet.Conventionally, the breakthrough criterion is defined to be theoutlet concentration that is 10% of that at the inlet [13]. Forthis work, this value corresponds to a breakthrough time of16 minutes and a breakthrough volume of 16 mL for heptane.
The thermal desorption of the preconcentrator was evaluatedby the desorption peak in the chromatogram. The preconcen-trator was first used to sample the heptane vapor and thenconnected to the Agilent 6890 GC where it was positionedupstream of the FID and downstream of the injection port.The desorption was performed by applying a pulse using theintegrated thin-film heater, which heated the preconcentratorto 170 °C in 2 sec. The carrier gas was N2 at a flow rate of1 sccm; flow direction in the preconcentrator was the sameduring both sampling and desorption. As shown in Fig. 7(b),a 1.4 sec. desorption peak (measured at half height of thepeak) is observed from the FID chromatogram with onlyminimal tailing. A second thermal pulse did not provide anyadditional desorption peak, verifying full desorption during thefirst thermal pulse. This characterization of the preconcentratoris a representation of its general capability rather than its actualperformance within the iGC1 system. This is because the iGC1system is operated at a lower flow rate of ≈0.2 sccm. Notonly is this more easily accommodated by the pump, but theperformance of the separation column is better at this flowrate.
C. Column
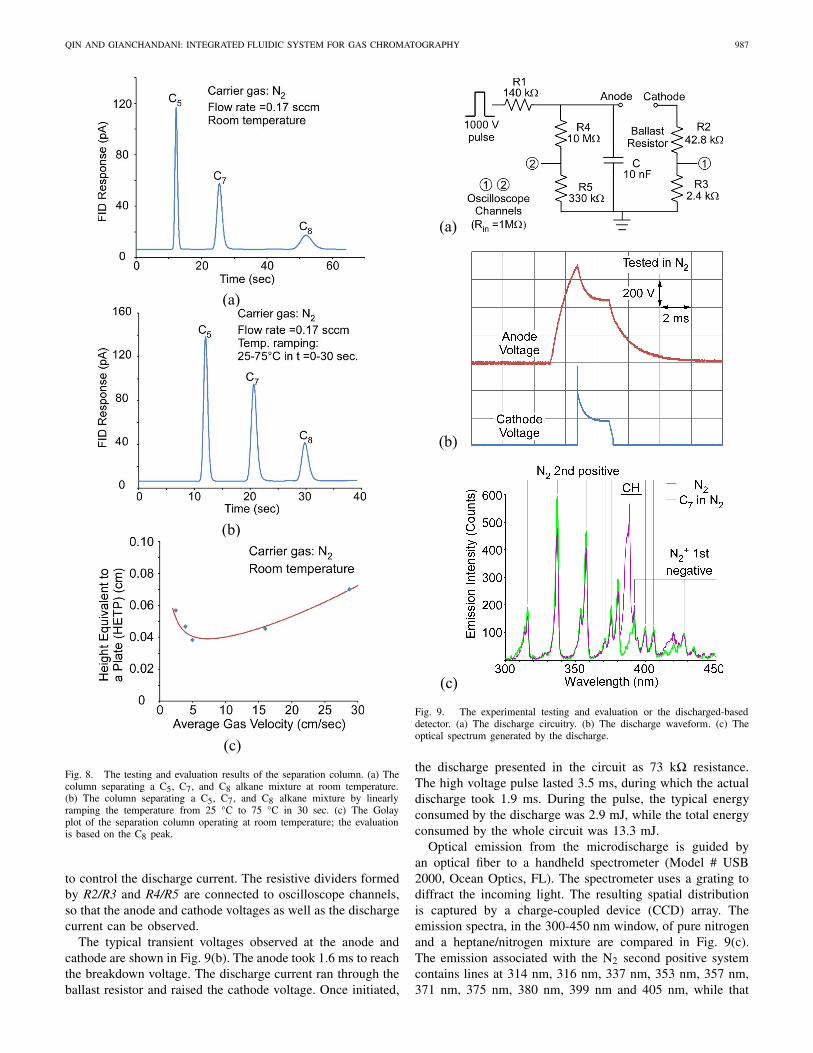
The separation column was evaluated by an Agilent 6890GC system by positioning it downstream of an injection portand upstream of an FID. Sample chromatograms obtained withthe tested column are shown in Fig. 8. At room temperature,three alkane species (C5, C7, and C8) were separated by thecolumn in about 52 sec. [Fig. 8(a)]. With a 30 sec.-long linearramping of temperature from 25 °C to 75 °C provided bythe on-chip heater, the column separated the same alkanemixture with the same gas flow rate in 30 sec. [Fig. 8(b)].Both chromatograms were obtained using N2 as the carriergas at 0.17 sccm flow rate.
Golay plots are curves indicating how the column efficiencyis affected by the carrier gas flow rate, which are helpful indetermining the optimal operating point of the column. In thiseffort, a Golay plot was obtained by testing the separationcolumn at room temperature for a number of N2 carriergas flow rates. The C8 peak was used for calculating thenumber of plates N and the height-equivalent-to-a-plate HETPbased on equations (5) and (6). As shown in Fig. 8(c), thecolumn has an optimal operating point at the gas velocityrange of 5–10 cm/sec. (corresponding to the flow rate of0.15–0.3 sccm), which gives HETP ≈0.04 cm and a platenumber (1/HETP) of ≈2600 plates/m. This performance iscomparable to other microfabricated columns that have beenpreviously reported – 2000 plates/m [10], 3000 plates/m [11],and 4200 plates/m [9].
D. Detector
The detector uses pulsed discharges that are controlled bythe circuit shown in Fig. 9(a). In this circuit, the dischargeenergy is provided by capacitor C , which is charged by asingle 1000-V pulse through R1. Once the anode reaches thebreakdown voltage, which is typically ≈650 V, the dischargeis initiated. Resistors R2 (the ballast resistor) and R3 are used
QIN AND GIANCHANDANI: INTEGRATED FLUIDIC SYSTEM FOR GAS CHROMATOGRAPHY 987
Fig. 8. The testing and evaluation results of the separation column. (a) Thecolumn separating a C5, C7, and C8 alkane mixture at room temperature.(b) The column separating a C5, C7, and C8 alkane mixture by linearlyramping the temperature from 25 °C to 75 °C in 30 sec. (c) The Golayplot of the separation column operating at room temperature; the evaluationis based on the C8 peak.
to control the discharge current. The resistive dividers formedby R2/R3 and R4/R5 are connected to oscilloscope channels,so that the anode and cathode voltages as well as the dischargecurrent can be observed.
The typical transient voltages observed at the anode andcathode are shown in Fig. 9(b). The anode took 1.6 ms to reachthe breakdown voltage. The discharge current ran through theballast resistor and raised the cathode voltage. Once initiated,
Fig. 9. The experimental testing and evaluation or the discharged-baseddetector. (a) The discharge circuitry. (b) The discharge waveform. (c) Theoptical spectrum generated by the discharge.
the discharge presented in the circuit as 73 k� resistance.The high voltage pulse lasted 3.5 ms, during which the actualdischarge took 1.9 ms. During the pulse, the typical energyconsumed by the discharge was 2.9 mJ, while the total energyconsumed by the whole circuit was 13.3 mJ.
Optical emission from the microdischarge is guided byan optical fiber to a handheld spectrometer (Model # USB2000, Ocean Optics, FL). The spectrometer uses a grating todiffract the incoming light. The resulting spatial distributionis captured by a charge-coupled device (CCD) array. Theemission spectra, in the 300-450 nm window, of pure nitrogenand a heptane/nitrogen mixture are compared in Fig. 9(c).The emission associated with the N2 second positive systemcontains lines at 314 nm, 316 nm, 337 nm, 353 nm, 357 nm,371 nm, 375 nm, 380 nm, 399 nm and 405 nm, while that
988 IEEE JOURNAL OF MICROELECTROMECHANICAL SYSTEMS, VOL. 23, NO. 4, AUGUST 2014
Fig. 10. The separation of pentane, heptane and octane by the fully stackediGC1 system. (a) The chromatogram provided by the discharge-based detector.(b) The corresponding chromatogram provided by the FID used as a reference.
associated with N+2 first negative system contains lines at
391 nm and 426 nm [45]. With an elevated concentration ofheptane, the emission spectrum shows a significant CH line at387 nm [46]. The intensity ratio of the CH line at 387 nm to theN2 line at 337 nm was used as a measure of alkane strengthto correct for possible variations in intensity from pulse topulse. The data points with sufficient emission intensity (i.e.,greater than 50 counts at 337 nm line) were used to constructchromatograms.
E. The Stacked iGC1 System
Typical chromatograms provided by the stacked iGC1system for alkane mixtures are shown in Fig. 10. Figure 10(a)shows the data collected by the discharge-based detector. Thethree peaks correspond to the separation and detection ofpentane, heptane and octane. Figure 10(b) shows the bench-mark FID response, verifying the results provides by thedischarge-based detector. The FID signal lags behind thatof the discharge-based detector as the FID is connecteddownstream of the iGC1 stack. The relative peak heightsamong the three analytes are slightly different between the twochromatograms, possibly due to the emission characteristics ofvarious species within the microdischarges. The power/energy
TABLE I
POWER/ENERGY CONSUMPTION DURING THE iGC1 SEPARATION
TABLE II
SUMMARY OF THE SYSTEM CHARACTERISTICS
consumption of the components and the iGC1 system aresummarized in Table I. The iGC1 run as shown in Fig. 10had an average power consumption of 1.5 W.
The results in Fig. 10(a) were obtained by first samplinga prepared vapor mixture. Driven by the integrated Knudsenpump, a mixture of pentane, heptane and octane in N2 wassampled into the preconcentrator for ≈5 min. When initiatingthe separation, the preconcentrator was heated to 170 °Cin 2 sec. to inject the vapor analytes into the column. TheKnudsen pump was supplied with 1.1 W power, providing aN2 flow rate of 0.2 sccm; the N2 carrier gas was supplied bya Tedlar bag connected upstream of the system. Temperatureprogramming of the separation column was not used in thisexperiment. The detector was operated at 1 Hz (1 pulse/sec.)frequency. A customized LabVIEW® program was used tocontrol the overall operation of the iGC1 system.
V. DISCUSSION AND CONCLUSION
This work demonstrates the feasibility of using a standard-ized fabrication approach to manufacture a fluidic microsystemfor gas chromatography, including a pump, a preconcentrator,a separation column and a detector. The fabrication process islow cost and standardized, showing promise of wider adop-tion of μGC technology. The assembly procedure describedin this effort mainly focuses on die-to-die assembly afterdicing. However, as noted earlier, wafer-to-wafer assemblyprior to dicing can also be envisioned, enabling batch modefabrication.
The 4-cm3 iGC1 system demonstrates that it is possible tomitigate thermal crosstalk between components to achieve asmall form factor. The properties of the system are summa-rized in Table II. Discharge-based detectors are stable overtime because the emission spectra are characteristics of the
QIN AND GIANCHANDANI: INTEGRATED FLUIDIC SYSTEM FOR GAS CHROMATOGRAPHY 989
chemical species present. The detection rate is mainly limitedby the duration of plasma afterglow, which is typically lessthan 20 ms [22], corresponding to a detection rate of over50 Hz. Nevertheless, the discharge-based detector requiresspecial considerations because of background noise in an airambient, and the need for high voltages. The miniaturizationof spectrometers has previously been demonstrated [47], andversions as small as 19 cm3 are commercially available(Model # Qstick, RGB Lasersysteme GmbH, Germany [48]),indicating the feasibility of a fully integrated system.
The use of epoxies in the system assembly provides a low-temperature (i.e., less than 200 °C) and low-cost solution.The epoxies are chosen for low out-gassing properties andare sufficiently cured, minimizing the out-gassing problem.In preliminary studies, significant out-gassing was notobserved, but the effects of higher temperatures remainunclear. As an alternative, spin-on-glass may be used for com-ponent assembly. It is expected not to contribute interferencesto the chromatography, but its curing temperature is typicallyabove 400 °C.
The effort of integrating a micro gas pump into theiGC1 system provides a path for realizing a completemicro analytical system. The stackable architecture providesinterchangeability, i.e., different component designs canbe readily fitted into the system, tailoring it for variousapplications. The analytical capability of the system can beextended to more complex gas environments by reconfiguringthe system, such as direct stacking of more separation columnsor even implementing a 2DGC system. Beyond the preliminaryexperimental results shown in this effort, more options ofthe iGC1 operation are possible, such as the combinationof temperature programming and flow programming (readilyprovided by the Knudsen pump [30]). Although the Knudsenpump utilized in this design does not provide optimal flow forthe preconcentrator, future designs are expected to resolve thismatter.
ACKNOWLEDGMENT
The authors thank Prof. Ken Wise and Robert Gordenkerfor providing access to test facilities, Dr. Seungdo An forwafer metallization, and Dr. Naveen Gupta, Dr. Jing Liu,Xin Luo, Prof. Katsuo Kurabayashi, and Prof. Xudong Fanfor discussions.
REFERENCES
[1] F. J. Santos and M. T. Galceran, “The application of gas chromatographyto environmental analysis,” Trends Anal. Chem., vol. 21, nos. 9–10,pp. 672–685, 2002.
[2] S. J. Lehotay and J. Hajšlová, “Application of gas chromatography infood analysis,” Trends Anal. Chem., vol. 21, nos. 9–10, pp. 686–697,2002.
[3] A. W. Boots, J. J. van Berkel, J. W. Dallinga, A. Smolinska,E. F. Wouters, and F. J. van Schooten, “The versatile use of exhaledvolatile organic compounds in human health and disease,” J. BreathRes., vol. 6, no. 2, p. 027108, 2012.
[4] S. C. Terry, J. H. Jerman, and J. B. Angell, “A gas chromatographic airanalyzer fabricated on a silicon wafer,” IEEE Trans. Electron Devices,vol. 26, no. 12, pp. 1880–1886, Dec. 1979.
[5] A. Bhushan, D. Yemane, E. B. Overton, J. Goettert, and M. C. Murphy,“Fabrication and preliminary results for LiGA fabricated nickel microgas chromatograph columns,” J. Microelectromech. Syst., vol. 16, no. 2,pp. 383–393, 2007.
[6] M. Agah, J. A. Potkay, G. Lambertus, R. Sacks, and K. D. Wise,“High-performance temperature-programmed microfabricated gas chro-matography columns,” J. Microelectromech. Syst., vol. 14, no. 5,pp. 1039–1050, 2005.
[7] H. Noh, P. J. Hesketh, and G. C. Frye-Mason, “Parylene gas chromato-graphic column for rapid thermal cycling,” J. Microelectromech. Syst.,vol. 11, no. 6, pp. 718–725, 2002.
[8] J. A. Potkay, G. R. Lambertus, R. D. Sacks, and K. D. Wise, “A low-power pressure- and temperature-programmable micro gas chromatogra-phy column,” J. Microelectromech. Syst., vol. 16, no. 5, pp. 1071–1079,2007.
[9] S. Reidy, G. Lambertus, J. Reece, and R. Sacks, “High-performance,static-coated silicon microfabricated columns for gas chromatography,”Anal. Chem., vol. 78, no. 8, pp. 2623–2630, 2006.
[10] G. Lambertus and R. Sacks, “Stop-flow programmable selectivity witha dual-column ensemble of microfabricated etched silicon columnsand air as carrier gas,” Anal. Chem., vol. 77, no. 7, pp. 2078–2084,2005.
[11] M. A. Zareian-Jahromi and M. Agah, “Microfabricated gas chro-matography columns with monolayer-protected gold stationary phases,”J. Microelectromech. Syst., vol. 19, no. 2, pp. 294–304, 2010.
[12] W.-C. Tian, T. H. Wu, C.-J. Lu, W. R. Chen, and H. J. Sheen, “A novelmicropreconcentrator employing a laminar flow patterned heater formicro gas chromatography,” J. Micromech. Microeng., vol. 22, no. 6,pp. 065014-1–065014-8, 2012.
[13] W.-C. Tian, H. K. L. Chan, C.-J. Lu, S. W. Pang, and E. T. Zellers,“Multiple-stage microfabricated preconcentrator-focuser for micro gaschromatography system,” J. Microelectromech. Syst., vol. 14, no. 3,pp. 498–507, 2005.
[14] I. Voiculescu, M. Zaghloul, and N. Narasimhan, “Microfabricated chem-ical preconcentrators for gas-phase microanalytical detection systems,”Trends Anal. Chem., vol. 27, no. 4, pp. 327–343, 2008.
[15] J. H. Seo, S. K. Kim, E. T. Zellers, and K. Kurabayashi, “Microfabri-cated passive vapor preconcentrator/injector designed for microscale gaschromatography,” Lab Chip, vol. 12, no. 4, pp. 717–724, 2012.
[16] K. Nachef, F. Marty, E. Donzier, B. Bourlon, K. Danaie, andT. Bourouina, “Micro gas chromatography sample injector for theanalysis of natural gas,” J. Microelectromech. Syst., vol. 21, no. 3,pp. 730–738, 2012.
[17] W. H. Steinecker, S. K. Kim, F. I. Bohrer, L. Farina, C. Kurdak,and E. T. Zellers, “Electron-beam patterned monolayer-protected goldnanoparticle interface layers on a chemiresistor vapor sensor array,”IEEE Sensors J., vol. 11, no. 2, pp. 469–480, Feb. 2011.
[18] T. E. Mlsna, S. Cemalovic, M. Warburton, S. T. Hobson, D. A. Mlsna,and S. V. Patel, “Chemicapacitive microsensors for chemical warfareagent and toxic industrial chemical detection,” Sens. Actuators B, Chem.,vol. 116, nos. 1–2, pp. 192–201, 2006.
[19] S. Narayanan, B. Alfeeli, and M. Agah, “Two-port static coatedmicro gas chromatography column with an embedded thermal con-ductivity detector,” IEEE Sensors J., vol. 12, no. 6, pp. 1893–1900,Jun. 2012.
[20] K. Reddy, Y. Guo, J. Liu, W. Lee, M. K. K. Oo, and X.Fan, “Rapid, sensitive, and multiplexed on-chip optical sensors formicro-gas chromatography,” Lab Chip, vol. 12, no. 5, pp. 901–905,2012.
[21] X. Luo, W. Zhu, B. Mitra, J. Liu, T. Liu, X. Fan, et al., “A chemicaldetector for gas chromatography using pulsed discharge emission spec-troscopy on a microchip,” in Proc. AGU Fall Meeting, San Francisco,CA, USA, Dec. 2011, p. 0550.
[22] B. Mitra and Y. B. Gianchandani, “The detection of chemical vapors inair using optical emission spectroscopy of pulsed microdischarges fromtwo- and three- electrode microstructures,” IEEE Sensors J., vol. 8, no. 8,pp. 1445–1454, Aug. 2008.
[23] S.-J. Kim, S. M. Reidy, B. P. Block, K. D. Wise, E. T. Zellers, andK. Kurabayashi, “Microfabricated thermal modulator for comprehensivetwo-dimensional micro gas chromatography: Design, thermal modeling,and preliminary testing,” Lab Chip, vol. 10, no. 13, pp. 1647–1654,2010.
[24] G. Serrano, D. Paul, S.-J. Kim, K. Kurabayashi, and E. T. Zellers,“Comprehensive two-dimensional gas chromatographic separations witha microfabricated thermal modulator,” Anal. Chem., vol. 84, no. 16,pp. 6973–6980, 2012.
[25] P. R. Lewis, R. P. Manginell, D. R. Adkins, R. J. Kottenstette,D. R. Wheeler, S. S. Sokolowski, et al., “Recent advancements in thegas-phase MicroChemLab,” IEEE Sensors J., vol. 6, no. 3, pp. 784–795,Jun. 2006.
990 IEEE JOURNAL OF MICROELECTROMECHANICAL SYSTEMS, VOL. 23, NO. 4, AUGUST 2014
[26] E. T. Zellers, G. Serrano, H. Chang, and L. K. Amos, “A micro gaschromatograph for high-speed determinations of explosive markers,” inProc. IEEE Int. Conf. Solid-State Sens., Actuators Microsyst., Beijing,China, Jun. 2011, pp. 2082–2085.
[27] S. K. Kim, H. Chang, and E. T. Zellers, “Prototype micro gas chro-matograph for breath biomarkers of respiratory disease,” in Proc. IEEEInt. Conf. Solid-State Sens., Actuators Microsyst., Denver, CO, USA,Jun. 2009, pp. 128–131.
[28] R. J. M. Gordenker and K. D. Wise, “A programmable palm-size gasanalyzer for use in micro autonomous systems,” Proc. SPIE, vol. 8373,pp. 83731O-1–83731O-6, Apr. 2012.
[29] H. Kim, W. H. Steinecker, S. Reidy, G. R. Lambertus, A. A.Astle, K. Najafi, et al., “A micropump-driven high-speed MEMS gaschromatography system,” in Proc. IEEE Int. Conf. Solid-State Sens.,Actuators Microsyst. Conf., Lyon, France, Jun. 2007, pp. 1505–1508.
[30] J. Liu, N. K. Gupta, K. D. Wise, Y. B. Gianchandani, and X. Fan,“Demonstration of motionless Knudsen pump based micro-gas chro-matography featuring micro-fabricated columns and on-column detec-tors,” Lab Chip, vol. 11, no. 20, pp. 3487–3492, 2011.
[31] N. K. Gupta and Y. B. Gianchandani, “Thermal transpiration in mixedcellulose ester membranes: Enabling miniature, motionless gas pumps,”Microporous Mesoporous Mater., vol. 142, nos. 2–3, pp. 535–541, 2011.
[32] H. van Weerden, G.-J. Burger, and J. Elders, “Fast micro-GC capabilitiesbased on a microintegration technology platform,” Amer. Lab., vol. 40,no. 16, pp. 14–15, 2008.
[33] R. P. Manginell, D. R. Adkins, M. W. Moorman, R. Hadizadeh,D. Copic, D. A. Porter, et al., “Mass-sensitive microfabricated chem-ical preconcentrator,” J. Microelectromech. Syst., vol. 17, no. 6,pp. 1396–1407, 2008.
[34] D. R. Adkins, “Modular manifold for integrated fluidics and electronics,”U.S. Patent 7 685 864, Mar. 30, 2010.
[35] D. R. Adkins and P. R. Lewis, “Compact low-power gas detector forchemical alarms,” Proc. SPIE, vol. 7304, pp. 73040S-1–73040S-10,Apr. 2009.
[36] P. R. Lewis and D. R. Wheeler, “Non-planar microfabricated gaschromatography column,” U.S. Patent 7 273 517, Sep. 25, 2007.
[37] R. P. Manginell, J. M. Bauer, M. W. Moorman, L. J. Sanchez,J. M. Anderson, J. J. Whiting, et al., “A monolithically-integrated μGCchemical sensor system,” Sensors, vol. 11, no. 7, pp. 6517–6532, 2011.
[38] Y. Qin and Y. B. Gianchandani, “A facile, standardized fabricationapproach and scalable architecture for a micro gas chromatographysystem with integrated pump,” in Proc. IEEE Int. Conf. Solid-State Sens.,Actuators Microsyst., Barcelona, Spain, Jun. 2013, pp. 2755–2758.
[39] F. Sharipov, “Rarefied gas flow through a long tube at any tempera-ture ratio,” J. Vac. Sci. Technol. A, Vac. Surf. Films, vol. 14, no. 4,pp. 2627–2635, 1996.
[40] L. A. Jonas and J. A. Rehrmann, “Predictive equations in gas adsorptionkinetics,” Carbon, vol. 11, no. 1, pp. 59–64, 1973.
[41] P. Lodewyckx, G. O. Wood, and S. K. Ryu, “The Wheeler–Jonasequation: A versatile tool for the prediction of carbon bed breakthroughtimes,” in Proc. Carbon Conf., Oviedo, Spain, Jul. 2003, pp. 1345–1349.
[42] E. F. Barry, “Columns: Packed and capillary; column selection ingas chromatography,” in Modern Practice of Gas Chromatography,R. L. Grob and E. F. Barry, Eds. Hoboken, NJ, USA: Wiley, 2004,pp. 65–191.
[43] C. K. Eun and Y. B. Gianchandani, “Microdischarge-based sensorsand actuators for portable microsystems: Selected examples,” IEEEJ. Quantum Electron., vol. 48, no. 6, pp. 814–826, Jun. 2012.
[44] B. Mitra, B. Levey, and Y. B. Gianchandani, “Hybrid arc/glow microdis-charges at atmospheric pressure and their use in portable systems forliquid and gas sensing,” IEEE Trans. Plasma Sci., vol. 36, no. 4,pp. 1913–1924, Aug. 2008.
[45] R. R. O’Neil and G. Davidson, “The fluorescence of air and nitrogenexcited by energetic electrons,” Tech. Rep. 12, Amer. Sci. Eng. Inc.,Cambridge, MA, USA, Jan. 1968.
[46] R. W. Pearse and A. G. Gaydon, The Identification of Molecular Spectra.London, U.K.: Chapman & Hall, 1950.
[47] L. Que, C. G. Wilson, and Y. B. Gianchandani, “Microfluidic elec-trodischarge devices with integrated dispersion optics for spectral analy-sis of water impurities,” J. Microelectromech. Syst., vol. 14, no. 2,pp. 185–191, 2005.
[48] RGB Lasersysteme GmbH, Toledo, OH, USA. (2014, Feb. 19).Qstick—The World’s First USB Stick Spectrometer [Online]. Available:http://www.rgb-laser.com/content_products/product_qstick.html
Yutao Qin received the B.S.E. degree in electronicscience and technology (microelectronics) fromSouth China University of Technology, Guangzhou,China, in 2010 and the M.S.E. degree in electricalengineering from the University of Michigan, AnnArbor, MI, USA, in 2012. He is currently pursuingthe Ph.D. degree in electrical engineering at theUniversity of Michigan, Ann Arbor. His researchinterests include micro gas chromatography systemsand Knudsen pumps.
Yogesh B. Gianchandani (M’86–SM’05–F’10) isa Professor at the University of Michigan, AnnArbor, with a primary appointment in the ElectricalEngineering and Computer Science Department anda courtesy appointment in the Mechanical Engi-neering Department. He also serves as the Directorfor the Center for Wireless Integrated MicroSensingand Systems (WIMS2). Dr. Gianchandani’s researchinterests include all aspects of design, fabrication,and packaging of micromachined sensors and actua-tors (http://www.eecs.umich.edu/∼yogesh/). He has
published about 300 papers in journals and conferences, and has about 35US patents issued or pending. He was a Chief Co-Editor of ComprehensiveMicrosystems: Fundamentals, Technology, and Applications, published in2008. From 2007 to 2009 he also served at the National Science Foundation,as the program director for Micro and Nano Systems within the Electrical,Communication, and Cyber Systems Division (ECCS).


![Liquid Encapsulation Technology for Microelectromechanical ... · Liquid Encapsulation Technology for Microelectromechanical Systems Norihisa Miki ... [27]. Therefore, sealing with](https://static.documents.pub/doc/80x56/5ebd6745ad290220a7044b42/liquid-encapsulation-technology-for-microelectromechanical-liquid-encapsulation.jpg)
